The OPERA experiment Target Tracker
Abstract
The main task of the Target Tracker detector of the long baseline neutrino oscillation OPERA experiment is to locate in which of the target elementary constituents, the lead/emulsion bricks, the neutrino interactions have occurred and also to give calorimetric information about each event. The technology used consists in walls of two planes of plastic scintillator strips, one per transverse direction. Wavelength shifting fibres collect the light signal emitted by the scintillator strips and guide it to both ends where it is read by multi-anode photomultiplier tubes. All the elements used in the construction of this detector and its main characteristics are described.
Keywords:
OPERA, Target Tracker, plastic scintillator, photomultiplier, PMT, multianode, WLS fiber, , , , , , , , , , , , , , , , , , , , , , , , , , , , , , , , , , , ,
1 Introduction
OPERA [1] is a long baseline neutrino oscillation experiment designed to detect the appearance of in a pure beam in the parameter region indicated by the anomaly in the atmospheric neutrino flux. The detector is installed at the Laboratori Nazionali del Gran Sasso (LNGS) in a cavern excavated under the Gran Sasso in the Italian Abruzzes. The cavern (Hall C) is in the line of sight of the CNGS beam of neutrinos originating from CERN, Geneva, at a distance of 730 km. The beam energy has been optimized to maximize the number of CC interactions. The commissioning of the beam and of the electronic components of the detector has started in August 2006. The data taking is due to start in spring 2007 and to last for five years.
At the nominal value of eV2 and full mixing (), as measured by the Super–Kamiokande atmospheric neutrino experiment [2], OPERA will observe about 20 CC interactions after 5 years of data taking, with an estimated background of only 1 event.
The OPERA detector consists of two identical super–modules. Each super–module has a 0.9-kton instrumented target followed by a m2 dipolar magnetic muon spectrometer. One target is the repetition of 31 m2 modules each including a proper target wall followed by a tracker wall. A target wall is an assembly of 52 horizontal trays, each of which is loaded with 64 bricks of 8.3 kg each. A brick is made of 56 lead sheets, 1 mm thick, providing the necessary mass, interleaved with 57 nuclear emulsion films that provide the necessary sub–millimeter spatial resolution required to detect and separate unambiguously the production and decay vertices of the lepton produced in charged current interactions with the lead nuclei.
The bricks in which neutrino interactions have occurred, typically 30 per day at the nominal beam intensity, are identified by the event reconstruction in the trackers and the spectrometers. They will be extracted on a regular basis, disassembled and the emulsion films will be scanned and analyzed by a battery of high speed, high resolution automatic microscopes in order to locate the interaction vertex and search for candidates of lepton decay.
The main role of the Target Tracker is therefore to locate the lead/emulsion brick where a neutrino interaction has occurred. It will also provide a neutrino interaction trigger for the readout of the whole OPERA detector and be used as a calorimeter for the event analysis.
The required high brick finding efficiency puts strong requirements on the Target Tracker spatial resolution and track detection efficiency. The replacement of faulty elements of the Target Tracker is extremely difficult and this detector must therefore present a long term stability and reliability (at least for 5 years which is the expected OPERA data taking period). In case of problems, the brick finding efficiency not only of the bricks just in front of the concerned zone, but also of several walls upstream will severely be affected. The sensitive surface to be covered being of the order of m2, a cost effective technology had to be used.
2 Overview of the Target Tracker
The technology selected to instrument the targets of the OPERA detector consists in scintillator strips, 6.86 m long, 10.6 mm thick, 26.3 mm wide, read on both sides using Wave Length Shifting (WLS) fibres and multi-anode photomultipliers (PMT). The particle detection principle is depicted by Fig. 2. The scintillator strips used have been produced by extrusion, with a co-extruded reflective and diffusing coating for better light collection. A long groove running on the whole length and at the center of the scintillating strips, houses the WLS fibre which is glued inside the groove using a high transparency glue. This technology is very reliable due to the robustness of its components. Delicate elements, like electronics and PMT’s are located outside the sensitive area where they are accessible.

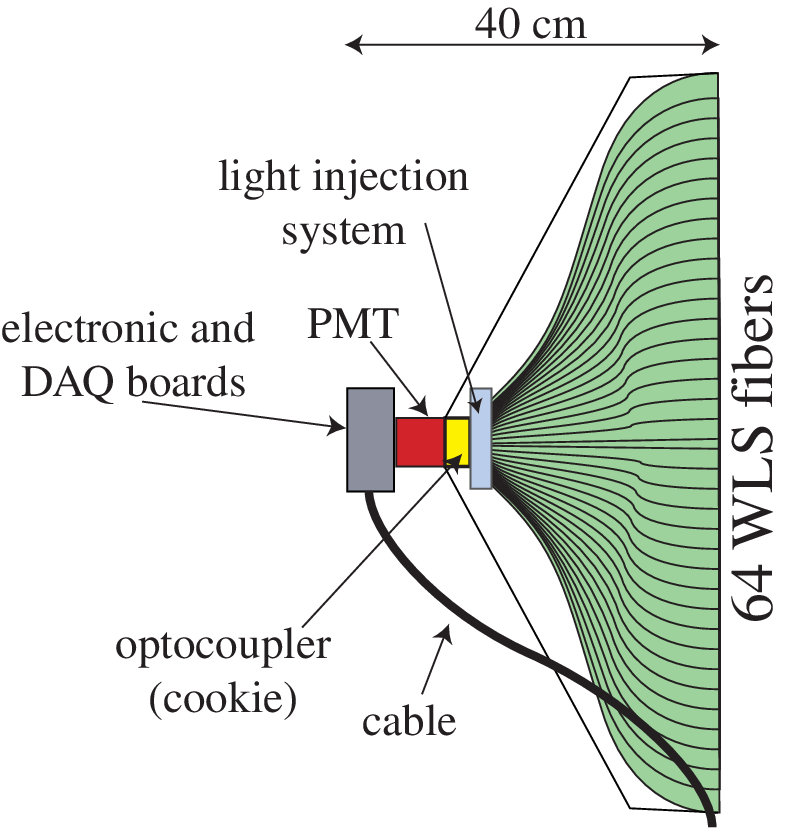
A basic unit (module) of the target tracker consists of 64 strips readout by WLS fibres coupled to two 64–channel photodetectors. The 64 strips of the module are glued on the surrounding aluminium sheets that serve as covers (the strips are not glued together). In this way, the mechanical strength of the module is provided by the strips themselves, the covers and the end–caps. The fibres are directly routed at both ends to the photodetectors through the end–caps (Fig. 2).
Four such modules are assembled together to construct a tracker plane covering the m2 sensitive surface defined by the target brick walls. One plane of 4 horizontal modules and one plane of 4 vertical modules form a tracker wall providing 2D track information (Fig. 4). The total OPERA target contains 62 walls, 31 per super–module. Thus, the total number of scintillating strips is 31744 for 63488 electronic channels.
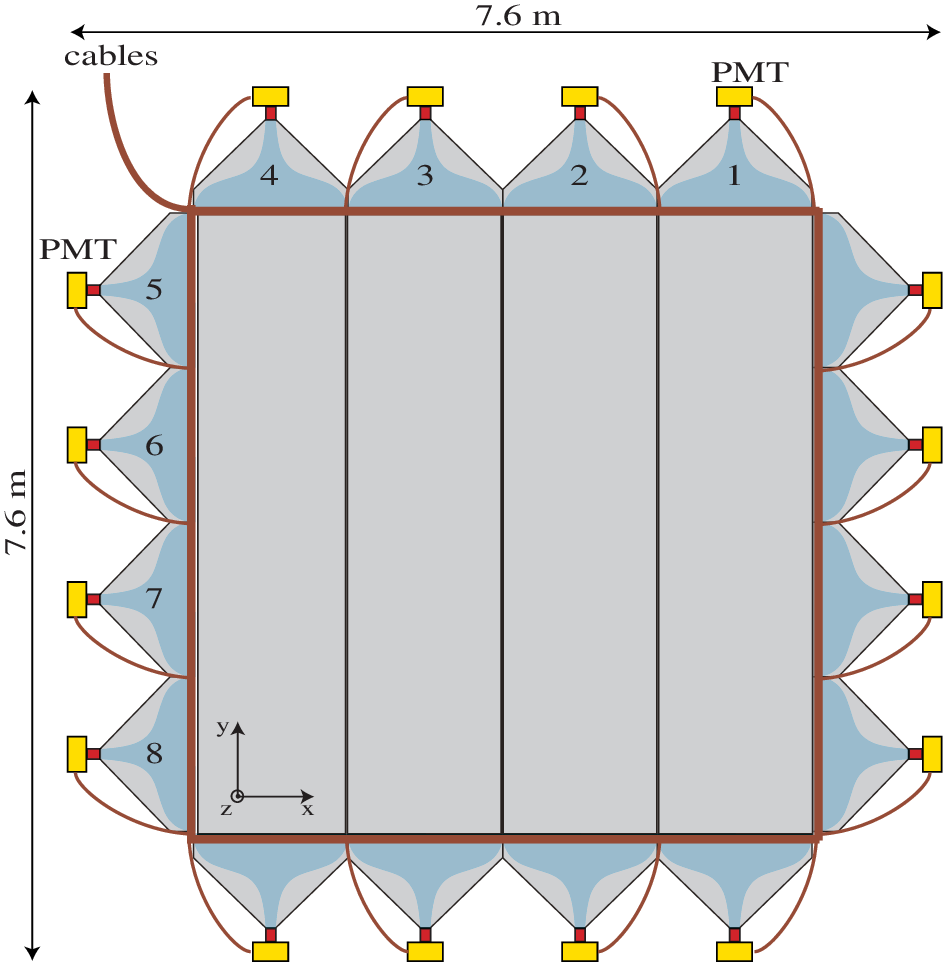
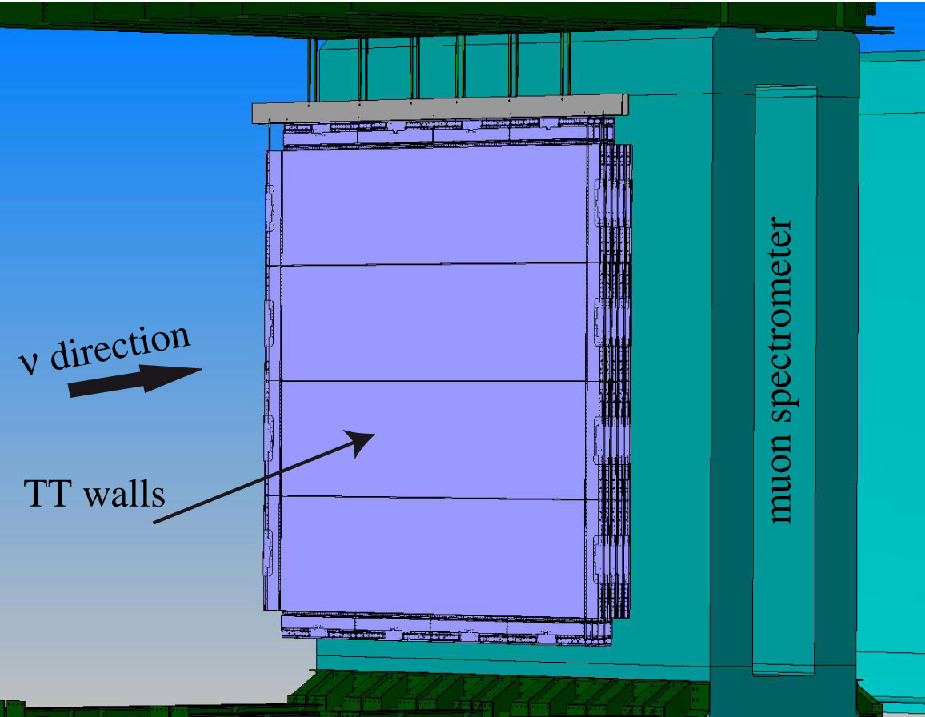
Target Tracker walls hanging in between two brick walls are shown schematically by Fig. 4, the walls are suspended on the OPERA main I–beams independently of the brick walls. The vertical modules are suspended on a flat beam (10 mm thick, 30 cm wide and 8.24 m long) which is hanged directly on the main I–beams of the OPERA detector supporting structure, while for the horizontal modules only the first one is suspended at the two ends on the flat beam while the other three modules are suspended on one another. The end–caps of the horizontal modules are rigid enough to support the other modules.
The minimum total wall thickness in the sensitive area covered by the emulsion bricks is 28.8 mm. The dead space induced by the gap between modules, the mechanical tolerance between strips of 0.1 mm and the scintillator strip wrapping (0.15 mm thick) is of the order of 1.5% of the overall sensitive surface.
3 Components
A description of the main components entering the Target Tracker construction is given in this section. More information can be found in the Target Tracker Technical Design Report [4].
3.1 Plastic Scintillator Strips
The transverse geometry of the plastic scintillator strips is shown in Fig. 6. The scintillator strips have been extruded, with a co-extruded reflective coating for improved light collection, by the AMCRYS-H company11 1 AMCRYS-H, 60, Lenin ave, Kharkov, 310001, Ukraine.. The WLS fibre is glued with high transparency glue in a machined groove, 2.0 mm deep and 1.6 mm wide, which runs along the strip length. The plastic scintillator is composed of polystyrene with 2% of p-Terphenyl, the primary fluor, and 0.02% of POPOP, the secondary fluor. Fig. 6 [5] shows the absorption and emission spectra of the fluors.


Several plastic scintillator strips produced by different companies have been tested by irradiation of the strips (Fig. 8) with electrons of 1.8 MeV energy selected from a 10 mCi source by a purposely developed compact magnetic spectrometer (Fig. 8). The electron trigger at the exit of the spectrometer is provided by a 0.1 mm thick scintillator read at both ends by two PMT’s in coincidence. The signal was read-out by two Hamamatsu bialkali PMT’s H3164-10 through the WLS fibre. A correction factor of 1.19 was applied to the measurements to express the signal in terms of the number of photoelectrons (p.e) resulting from the 2.15 MeV energy lost by a crossing minimum ionizing particle. Subsequent tests with a pion beam at the CERN-PS have confirmed this correction factor within 4%.


Fig. 10 presents the number of p.e versus the distance from the two PMT’s for several samples provided by AMCRYS-H company. In the worst case where the particle crosses the strip at its middle (4.5 m distance from each PMT), the number of observed p.e is well above 4 (lower limit requested by the experiment), inducing a particle detection efficiency higher than 99%.


Primary photons produced in the strip by an ionizing particle make several reflections on the strip surface before entering the WLS fibre. To evaluate the distribution of the distance between the point of emission and the entry point in the fibre, the long WLS fibre was replaced by a short segment of 3 cm glued at both ends to clear fibres. By varying the position of the spectrometer with respect to the center of the WLS fibre segment, the measured light yield shown by Fig. 10 was observed. A gaussian distribution has been fitted to the data with a standard deviation of 2.3 cm. Taking into account the WLS fibre length, the standard deviation of the light expansion distribution has been calculated to be about 2.2 cm.
3.2 Wavelength Shifting Fibres
The attenuation length has been measured for several 1 mm diameter double cladding WLS fibres commercially available from Bicron22 2 Bicron Corp., 12345 Kinsman Road, Newbury, Ohio 44065., Kuraray33 3 Kuraray Co., Methacrylic Resin Division, 8F, Maruzen Building, 3-10, 2-Chrome, Hihonbashi, Chuo-ku, Tokyo, 103-0027, Japan. and PoL.Hi.Tech44 4 Pol.Hi.Tech. s.r.l., 67061 CARSOLI (AQ), S.P. Turanense Km. 44.400, Italy.. The fibres were inserted into a 1 mm diameter hole machined in a NE110 scintillator excited by an UV lamp. Fig. 11 shows the collected light intensity versus the distance between the PMT (Hamamatsu bialkali H3164-10) and the illumination point for the Y11(175)MJ non S fibre from Kuraray, which was the final choice for this detector. The equivalent number of p.e is just indicative. The fitted curve is the sum of two exponential distributions: with cm (short absorption length) and cm (long absorption length).

3.3 End-Caps
The fibres are routed to the PMT photocathodes in the two module end-caps (Fig. 12). These also constitute the mechanical structure by or to which the modules are suspended in the OPERA detector. The length of the end-cap, 1.7 m, is defined by the module width. Its width is fixed by the minimum fibre bending radius, the photodetector and its opto–coupling window and the electronics. Altogether it equals the maximum value of 40 cm, a limit imposed by the design of the manipulator used for brick insertion into and extraction from the target walls. It has a maximum thickness of 3.4 cm and weighs about 10 kg. The core of the body is a block of 320 kg/m3 polyurethane foam glued on a black soft steel frame. Soft steel has been chosen for the sake of shielding the PMT from the spectrometer fringe magnetic field.

The housing for the free ends of the optical fibres is machined into the foam body. It is lined with soft black tissue for the sake of protecting the fibre cladding from scratches and increasing the light tightness. Every other strip is attached to one end-cap, and so on for the other 32. For this, the end-cap is equipped with 32 rivets of 7.3 mm diameter spaced by 52.8 mm, twice the maximum scintillator strip width plus 0.1 mm tolerance between strips. Each rivet is due to receive the hole drilled at one end of a strip. The fibre housing is closed by the optical coupler providing a precise positioning of each fibre in front of its corresponding PMT channel. The frame also provides housing for the multi-channel PMT and its HV power supply, the monitoring light injection system, the front–end electronics and the data acquisition cards. The low voltage and readout cables are extracted and routed through a path on the back of the end-caps. When closed with its main cover, the light tightness in the fibre housing is ensured.
The end--caps have been constructed by the Aériane company55 5 Aériane S.A., rue des Poiriers, 7, B-5030 Gembloux, Belgium..
3.4 Photodetectors
The choice of the photodetector is mainly based on the single p.e detection efficiency, the dynamic range, the cost and the geometry. Other considerations are gain uniformity among channels, linearity and cross–talk. The photodetector chosen for the OPERA Target Tracker is based on the commercially available -channel Hamamatsu H PMT. These PMT’s are powered by a negative polarity high voltage (in the following, the absolute value of the high voltage will be given). This PMT has also been chosen for the MINOS [6] near detector and has been extensively evaluated.
Each channel contains two sets of 12 dynodes and covers a surface of mm2 (Fig. 13). The PMT provides a common output of the signals on the last dynodes which can be used as a FAST-OR to trigger the acquisition system or for timing purposes.


Fig. 14 is an example of the uniformity of the channels responses, normalized to 100 and obtained by full photocathode illumination using a W–lamp [7]. More advanced studies of the multi–anode PMT properties have been performed on a purposely developed test bench. A computer guided translation system and the PMT are enclosed in a light–tight box together with a UV lamp, a band–pass filter and focalization optics. The full area of the photocathode can be scanned with a narrow light spot with a diameter . Alternatively, the photocathode may be illuminated by a WLS fibre glued to a bloc of scintillator activated by the UV lamp.


Fine scans of the gain distribution and of the number of p.e collected inside a single channel are shown on Fig. 16 and Fig. 16. They were obtained with a 1.0 mm fibre and a light intensity reduced to the single p.e level. A loss of p.e collection of the order of 6% is observed when the fibre is positioned between the two dynodes as is in the experiment. The number of p.e was computed by fitting the charge distribution with the convolution of a gaussian and a Poisson distribution for the signal and a gaussian distribution for the pedestal (Fig. 18) [8]. The maximum dispersion between the two dynodes of the same channel is of the order of 20% while the gain variation from channel to channel may reach a factor 3 (Fig. 18). The dispersion on the gain is about 50% of the gain mean value of each channel.


The counting rate induced by natural radioactivity or PMT dark current must be as low as possible to reduce the effect of dead time. Using the PMT with a threshold corresponding to of p.e, a noise of less than 10 Hz/channel at C has been measured coming from photocathode thermo–emission. This possibility of using a low threshold ensures a very high single p.e detection efficiency.
The PMT’s have been customized by Hamamatsu to our requests. Modifications had to do with mechanics (assembly and alignment of the tube with the optical coupler), electronics (rearrangement of the back plane connectors) and light tightness (injection of black, high voltage resistant resin in the space between the tube and its housing).
All PMT’s were connected to a reference optical coupling window and passed a number of calibration measurements ([9]). These were achieved with a device in which the 64 WLS--fibres of the coupling window were divided into 8 groups of 8 arranged such that no neighbouring fibres belong to the same group. Each group of fibres originated in a separate light diffusion box containing two UV-LED’s SLOAN L5-UV5N66 6 SLOAN AG, Birmannsgasse 8, CH-4009 Basel/Switzerland.. The fibres were exposed over a length of 2 mm to light pulses, the intensity of which could be varied by a factor of about 250. The position of the two LED’s with respect to the fibres was chosen such as to extend the dynamic range of the system from 0.03 to 120 p.e. The signals of two additional monitoring fibres arranged across each box were read by two reference Hamamatsu HI949 PMT’s. The monitoring of the LED light output with time was provided by comparison to the light emitted by a piece of scintillator loaded with a weak 30 Bq Bi source. The testing device is shown in Fig. 19 where the amplifier box developed especially for this application is seen.

One of the goals of the PMT tests was to determine the nominal value of the high voltage to be applied to each unit. The high voltage was defined such that the gain of the strongest channel of each PMT equals . The mean high voltage applied on all tested PMT’s is 825 V varying from 750 V to 930 V. The gains of the 64 channels are electronically equalized by means of the front end chips (see 3.5). Along with the gain, other important characteristics were measured, such as cross–talk and dark current. All relevant results were stored in a data base for use during the calibration of the Target Tracker modules.
To avoid problems along time, it has been decided not to apply optical grease between the opto–coupler and the PMT photocathode. Optical grease may also generate bubbles between the PMT and opto–coupler surface which could create light transmission problems and also increase the optical cross–talk between channels. This choice causes a loss of about 15% of the number of observed p.e.
For the high voltage power supply of the PMT’s, small modules located for convenience on the DAQ boards in the end--caps, have been selected. The modules provided by Iseg company77 7 Iseg Spezialelektronik GmbH, Bautzner Landstr. 23, D - 01454 Radeberg/Rossendorf. (BPS BPN 10 165 12) fulfill the following main requirements:
- •
Adjustable voltage (negative polarity) between 0 and 1000 V by means of an external control voltage not exceeding 5 V.
- •
Accuracy of the output voltage of ±1%, ripple less than 0.01% peak-to-peak and temperature coefficient not exceeding ±0.01% ∘C.
- •
Output maximum current between 1 mA and 2 mA (overload and short circuit protected).
- •
Modules powered by a low voltage DC supply (14 V%).
- •
MTBF (Mean Time Between Failure) higher than 300’000 hours at full load and 25 ∘C (a burn–in procedure during 24 hours at maximum charge with temperature cycling was done by the company for each module).
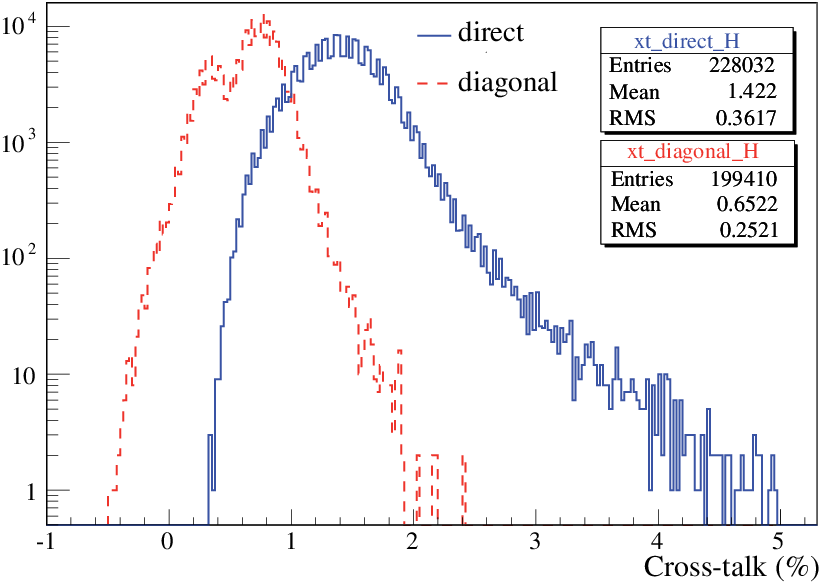
After testing 1032 multi-anode PMT’s, 5.4% have been rejected mainly due to high cross–talk between neighbouring channels. The cross–talk distributions for direct and diagonal neighbours are shown in Fig. 21. The mean cross-talk on direct neighbours is of the order of 1.43% while for diagonal neighbours this factor goes down to 0.65%. Fig. 21 presents the mean gain of all tested PMT’s versus the channel position. One can see that the channels of the first (1–8) and last (57–64) columns have a significantly lower gain than the other channels. PMT’s where the difference between the highest and lowest observed gain on individual channels exceeds a factor of 3 were rejected.

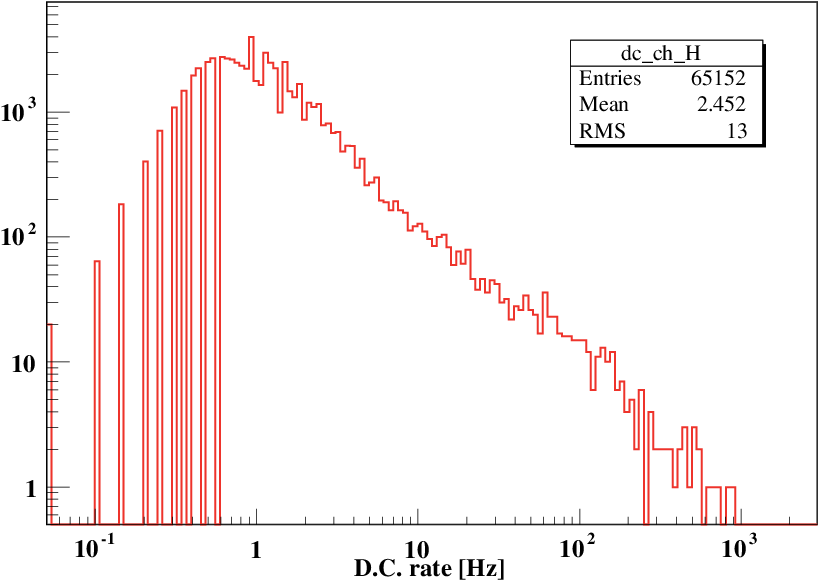
Another important parameter, especially for OPERA which is a triggerless experiment, is the PMT dark count rate. Fig. 22 presents the dark count rate of all tested PMT channels. A mean value of 2.45 Hz is observed at 20∘C. PMT’s having channels with rate higher than 300 Hz were rejected.
3.5 Front-End Electronics
The readout electronics of the Target Tracker is based on a 32-channel ASIC, referenced in the following as the OPERA ReadOut Chip (ROC). Two ROC’s are used to readout each multi–anode PMT, for a total of 1984 chips for the full detector. A detailed description of the ASIC design and performance can be found in [10].
The main requirements that have driven the chip design are:
- •
Compensation for the factor 3 anode-to-anode gain variations (Fig. 18). It is equipped with an adjustable gain system incorporated in the preamplifier stage that delivers a signal of identical range to the fast and slow shapers of every channel.
- •
Delivery of a global low noise auto-trigger and time information with 100% trigger efficiency for particles at minimum of ionization (MIP), that is for a signal as low as 1/3 of p.e, corresponding to 50 fC at the anode for a PMT gain of 106.
- •
Delivery of a charge proportional to the signal delivered by each pixel of the PMT in a dynamic range corresponding to 1 to 100 p.e.
Each of the 32 channels comprises a low noise variable gain preamplifier that feeds both a trigger and a charge measurement arms (Fig. 23). The auto-trigger includes a fast shaper followed by a comparator. The trigger decision is provided by the logical ”OR” of all 32 comparator outputs, with a threshold set externally. A mask register allows disabling externally any malfunctioning channel. The charge measurement arm consists of a slow shaper followed by a Track & Hold buffer. Upon a trigger decision, charges are stored in 2 pF capacitors and the 32 channels outputs are readout sequentially at a 5 MHz frequency, in a period of 6.4 s.
The technology of the chip is AMS BiCMOS 0.8 m 88 8 Technology AutriaMicroSystems (AMS) BiCMOS 0.8 microns, http://cmp.imag.fr/. Its area is about 10 mm2 and it is packaged in a QFP100 case. Its consumption depends upon the gain correction settings and ranges between 130 and 160 mW.

The variable gain system is implemented by adding selectable current mirrors with various areas (2.0, 1.0, 0.5, 0.25, 0.125, and 0.0625). The activation of the six switches thus allows setting an effective gain correction ranging from 0 to 3.9. By turning off all current switches of a channel, the gain is zeroed and the channel is disabled. For a correction gain set to 1, the preamplifier gain is found to be 94 mV/pC , or 15 mV/p.e at a PMT gain of , with a rise time of about 30 ns . After amplification, two copies of the input current are made available to feed both the trigger and the charge measurement arms. For both arms, the RMS of the noise corresponds to at most 0.01 p.e.
The fast shaper is directly fed with a mirror output via a 3 pF capacitance and the signal is integrated in a 0.1 pF charge amplifier. The integration time constant is 10 ns to produce a fast signal. A differential input is used to minimize offset dispersion and to allow a common threshold for the chip with a minimal threshold spread. The fast shaper is then followed by a comparator, whose input stage includes a bipolar differential pair in order to minimize the offset. With a low offset comparator and a high gain in the shaping just before, a common threshold can be used for all channels. The trigger decision is defined as the logical “OR” of all comparator’s outputs and sets in the charge integration process.
Fast shaper characteristics are a gain of 2.5 V/pC, i.e., 400 mV/p.e and a peaking time of 10 ns for a preamplifier gain set to 1. The trigger rise–time only slightly depends on the input charge magnitude.
The trigger efficiency has been measured as a function of the injected charge for each individual channel. 100% trigger efficiency is obtained for input charge as low as 1/10th of p.e, independently of the preamplifier correction. The trigger threshold common to all channels being set externally, the output spread among the 32 channels has been carefully controlled. It is found to be around p.e, an order of magnitude smaller than the useful threshold level.
The slow shaper has a long peaking time to minimize the sensitivity to the signal arrival time. The voltage pulse available on the RC integrator is shaped by a Sallen-Key shaper characterized by a time constant of . This corresponds to an average rise–time of 160 ns with a spread among the 32 channels not exceeding ns. In order to minimize pedestal variation from channel-to-channel slow shaper DC offset dispersion, a differential input stage has been used.

Upon a trigger decision, all the capacitors are read sequentially through a shift register made by D-flip-flop. The pedestal level is V in average, with a corresponding spread of . These numbers correspond to less than 1/3rd of p.e. The signal entering the ADC is in fact the difference between the multiplexed output and the Channel 0 output. This channel being disconnected from any input, this technique allows to make measurements insensitive to pedestal variations common to all channels caused by, e.g., temperature effects.
The linearity in the charge measurement has been determined for all channels and found to be better than 2% over the full range 1-16 pC for a preamplifier gain of 1, corresponding to 1-100 p.e (Fig. 25).
The noise at the multiplexed output has been measured at 12 fC, i.e., 0.075 p.e for a preamplifier gain 1, and at 3.7 fC or 0.08 p.e for a maximal gain.
Cross–talk due to the ASIC has been carefully considered. Two main sources of cross–talk have been identified. A first effect is interpreted as a coupling between the trigger and the charge measurement arms and has been determined to be lower than 0.1%. The second effect affects the nearest neighbours of a hit channel, where a cross–talk of the order of 1% is measured. This effect is negligible for far channels where a constant cross–talk component of about 0.2% is observed.
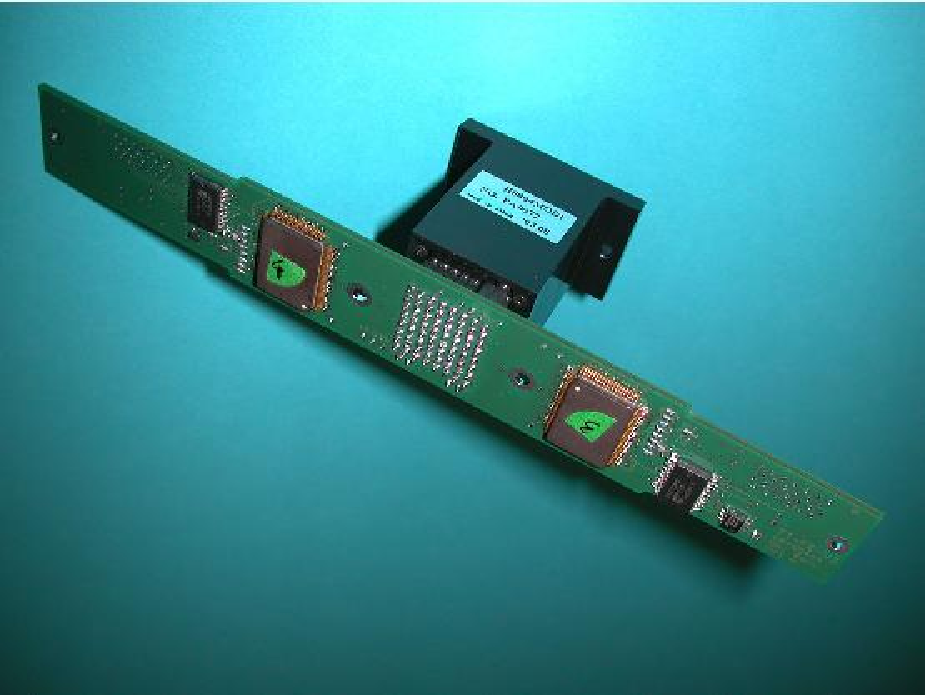
The front–end board is a 8–layer PCB carrying two ROCs. It is directly plugged to the PMT, as shown in Fig. 25. The lines from the PMT to the ROC inputs are well separated and protected from external noise sources by four ground planes in the PCB. The front–end board contains buffer amplifiers for the differential charge output signals of the ROC’s and logic level translators for the digital signals. It also carries five operational amplifiers, four for adapting the output voltage range of the two DAC’s on the DAQ board to the threshold voltage range of the two ROC’s and one for reading the high voltage of the PMT. The front–end card is connected to the DAQ board by means of two 26–lines miniature flat cables. The ADC’s (Analog Devices AD9220, 12 bits) are located on the DAQ board, in order to minimize the length of the data bus.
3.6 Light Injection System
The light injection system is used to test and monitor all the electronic channels and the data acquisition system. In each end--cap, light is injected into the WLS fibres just in front of the fibre--PMT opto--coupler with the help of LED’s (Kingbright99 9 Kingbright No. 317-1, Sec. 2 Chung Shan Road Chung Ho, Taipei Hsien 235 Taiwan. L-7113PBC), straight PMMA light guides, 6 mm diameter and 50 mm long, and a white painted diffusive box (Fig. 12). The LED’s are pulsed from outside the end–cap by a purposely designed driver activated by an external trigger.
The gain monitoring of each PMT channel and its associated electronics can be performed in a very short time in the single p.e mode and up to about 100 p.e. By pulsing LED’s on one side of the module and reading the signal on the other side, a possible WLS fibre ageing can be monitored.
The system is designed to provide a rather uniform illumination, within a factor 3, of all the 64 fibres bundled in a dense pattern near the optical window.
The light injection system will regularly be operated during the whole experiment duration.
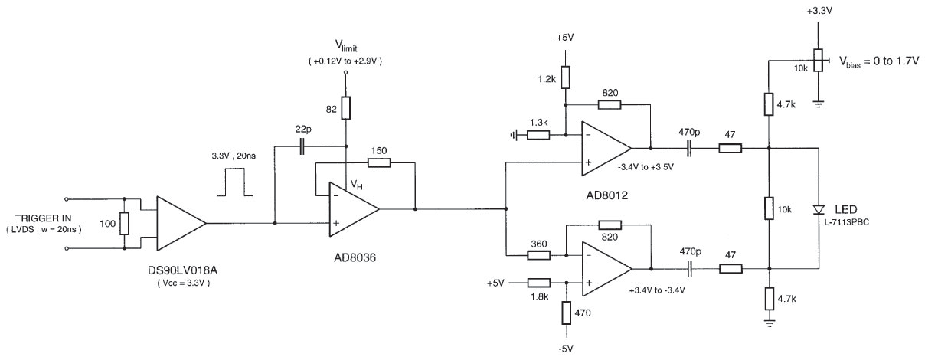
The LED pulser (Fig. 26) provides fast blue light pulses with an amplitude range of more than a factor of 200, with a stability and reproducibility of about one percent at the high and medium amplitudes and a few percent at the lowest amplitudes. The circuit, which generates the current pulses for the pair of LEDs of the light injector, based on standard fast amplifier chips, needs only 5 V supplies and fits on a PCB area of mm2. The pulser requires a LVDS trigger signal with a width of 20 ns.
The spread of the absolute light output of 2500 LED’s was found to be within a factor of two. Also the relative light output as a function of the DAC setting can differ up to a factor of two for two arbitrary chosen LED’s. To improve the uniformity, LED’s of similar performance were chosen to form a pair and adequate filters were used to equalize the absolute light yield for all pulsing systems. The spread of the maximum light signal produced by the LED’s is then reduced to about 15% for all injectors and the relative light signals of the LED pairs as a function of the DAC setting will track within about 20%.
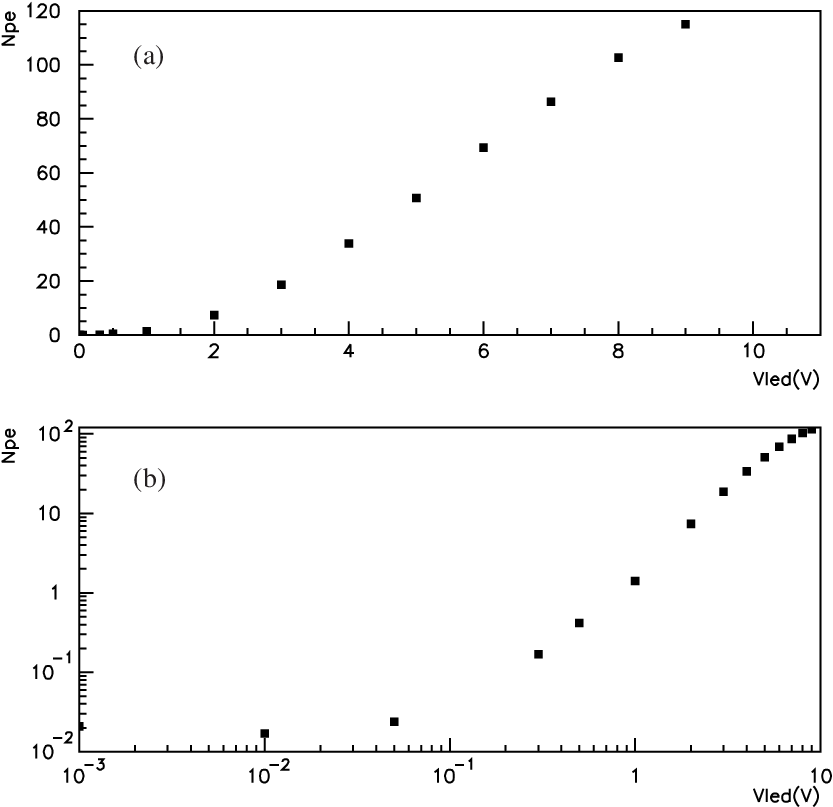
The variation of the response of one channel as a function of the control voltage applied to the LED is displayed in Fig. 27. The non linear response below 20 p.e makes the amplitude setting at the lower end of the range less critical. Signals as low as 0.02 p.e can be extracted from the background.
4 Radioactivity in the Target Tracker
In this section the radioactivity measurements of the materials used for the Target Tracker construction are presented. The goal of these measurements was mainly to ensure that the background caused by the activity of these materials was low enough not to introduce significant dead time during the acquisition due to high trigger rate. Using the results of these measurements, a simulation to obtain an estimation of the induced background in the scintillator strips and measured by the WLS fibres and the PMT’s, has been prepared.
Target Tracker radioactivity has been measured using ray spectrometry with an ultra low background germanium detector. The “” 400 cm3 semiconductor is well shielded and located underground at the “La Vue–des–Alpes” laboratory in the Swiss Jura Mountains [11] under 600 m water–equivalent. This detector permits to reach a sensitivity of g/g for and and g/g for .
The radioactivity of the materials selected for the construction of the Target Tracker are summarized in table 1. These materials have been measured during around one week each.
| Materials | Activity (Bq/g) | ||||
| 238U series | 232Th series | ||||
| 238U | 226Ra | 228Ra | 137Cs or 60Co | 40K | |
| Amcrys | 137Cs | ||||
| scintillator | equil. | (1.80.2)10-5 | (3.81.3)10-6 | ||
| optical fibre | equil. | (4.00.6)10-4 | (4.11.2)10-4 | (6.62.5).10-5 | (1.20.5)10-3 |
| glue 815 C | equil. | (3.90.8)10-4 | (3.23.2)10-4 | ||
| glue hardener | equil. | (1.90.3)10-4 | |||
| TiO2 | 137Cs | ||||
| (R104) | (1.70.7)10-5 | (5.92.6)10-6 | |||
| M 2755 | 60Co | ||||
| (adhesive) | equil. | (1.60.3)10-4 | (3.72.2)10-5 | (2.32.0)10-6 | (10.09.2)10-5 |
| sikaflex 221 | (5.40.4)10-5 | (2.40.1)10-3 | (1.60.3)10-5 | (1.20.1)10-4 | |
| alum. cover | (5.50.7)10-3 | (1.50.4)10-5 | (4.60.2)10-4 | (6.13.4)10-5 | |
| foam (end–caps) | equil. | (4.41.5)10-5 | (1.91.0)10-5 | (8.40.2)10-3 | |
| iron | 137Cs | ||||
| end–cap | equil. | (6.60.7)10-6 | (3.30.9)10-6 | (1.20.6)10-6 | (1.90.5)10-5 |
These measurements have been used to estimate the signal induced in a scintillator strip. For this, all the particles (, , ) coming from the decay chain of the radioactive elements are simulated for each component. Then the produced particles are propagated in the Target Tracker geometry and the energy they deposit in the scintillator strip is simulated. Fig. 28 shows the geometry used for the simulation. 3 scintillator strips have been considered in order to estimate the signal produced in the middle one.

Table 2 gives an estimation of the rate induced by the radioactivity of each component and the total rate. The quoted error only reflects the uncertainty on the radioactivity measurement. The main contribution is given by the aluminium cover which produces a total rate of 0.24 Hz. The contributions of the glue and the fibre are negligible. The total background rate per scintillator strip induced by the radioactivity of all components is estimated to 0.29 0.05 Hz, where the enlarged error includes the uncertainty on the triggering level which could be different in the experiment than the one used in the simulation.
| Materials | Decay serie | Rate (Hz) | Total rate (Hz) |
|---|---|---|---|
| Aluminium | 0.2120.028 | ||
| 0.0170.001 | |||
| 0.0060.0001 | |||
| 0.0050.003 | 0.240 0.032 | ||
| Central Scintillator strip | 0.0390.005 | ||
| 0.0080.003 | 0.047 0.008 | ||
| Double face | 0.0020.0003 | ||
| adhesive | 0.0004 0.0002 | ||
| 0.00010.0001 | |||
| 0.0040.004 | 0.0065 0.0046 | ||
| Side Scintillator strips | 0.00060.0001 | ||
| 0.00040.0001 | 0.001 0.0002 | ||
| Fibre in the central strip | negligible | ||
| Fibres in the side strips | negligible | ||
| Glue in the central strip | negligible | ||
| Glue in the side strips | negligible | ||
| TOTAL RATE (s-1) | 0.29 0.05 | ||
5 Effect of the magnetic field on PMT’s
The efficiency of a PMT is affected by a strong enough magnetic field because the Lorentz force modifies the p.e trajectory. Similarly, the gain is reduced by the effect of the field on the multiplication process of the secondary electrons. Studies done by MINOS collaboration and Hamamatsu indicate that the efficiency of the PMT used in OPERA decreases significantly if the magnitude of the field perpendicular to the photocathode exceeds 5 Gauss.
Simulations done with TOSCA [13], based on the finite element method, and AMPERES [14, 15], based on the boundary element method, (Fig. 29), revealed that the magnetic field at the place where PMT’s had to be located was largely exceeding the allowed maximum value. Fig 30 shows the variation of the magnetic field along a line parallel to the beam direction and passing through the series of top PMT’s of row 3 (see Fig. 4 for PMT numbering) where the fringe field was expected to be maximum. The right–hand plot is for the first target, upstream of the first spectrometer and the left–hand plot for the second target, between the two spectrometers. In both cases, the field varies between 10 and 40 Gauss, showing the necessity to shield the PMT’s.


Evaluations of the effects of a magnetic field on the performance of the PMT have been performed with a coil surrounding the PMT and its electronics. The efficiency, the gain and the cross–talk between channels have been studied by varying the direction and the magnitude of the field. All 64 photocathode channels were uniformly illuminated with a blue LED. The ratio of the number of p.e () with and without magnetic field is used as a measure of the efficiency.
Very different behaviours are observed for channels located on the border and at the centre of the photocathode (Fig. 32). The border channels are very sensitive to the magnetic field while those at the centre show no significant effect below 30 Gauss. Similar results, though less dramatic, are obtained for the gain dependence to the field, evaluated by the ratio of the gains G with and without magnetic field (Fig. 32).


The drop in collection efficiency is expected to be associated with an increase in the cross–talk between channels, a fraction of the electrons being deviated towards the neighbouring channels. One channel in the centre (#29) and one on the border (#8) have been illuminated in turn, varying the direction and the intensity of the magnetic field. The border channels are significantly affected whereas the central ones are not and the effect is maximal when the field is orthogonal to the photocathode (Fig. 33).

Several configurations and materials for magnetic shielding were tested. All the measurements were done with a field perpendicular to the photocathode. Mu-metal (main features are high permeability and low saturation field T) was tested but discarded because of its prohibitive price. Adequate shielding was obtained with 0.8 mm STE37 or ARMCO (99.5% Fe, less expensive than Mu-metal) sheets extending over the PMT and the fibres optical window and using ARMCO instead of aluminium for the bar supporting the fibre–PMT opto–coupler. STE37 was chosen for the covers for reason of cost. Fig. 34 presents the collection efficiency of one border and one central PMT channel with and without applying the chosen shielding. One can see that this shielding is very efficient for both channels up to a magnetic field of 40 Gauss.


6 Construction and Installation
Two production lines have been set up at IReS–Strasbourg to construct, test and calibrate a total of 8 modules per week. The construction was done according to the following steps:
- 1.
Groups of 16 scintillator strips were placed on a frame on a table equipped with a 16–head glue distribution system. The frame was slightly curved along its length, upward at the centre. After mixing with the hardener, about 15 g of glue was injected in each groove. The fibres, stretched with springs at both ends, were positioned inside the grooves. The frame curvature maintained the fibres at the bottom of the grooves by gravity during glue polymerization. After polymerization, an aluminized self adhesive Mylar band was laid over the grooves to increase the light collection.
- 2.
The two end–caps were placed on the assembly table on reference positions with pins and holes. A double face adhesive was glued on the bottom aluminium cover sheet. This sheet was placed on the table, positioning accuracy being achieved by inserting at each end the 32 end–caps rivets in the 32 holes of the covers. To increase light tightness, black glue was used to assemble the end-caps and the cover together.
- 3.
The top double face adhesive protection was removed. Thick strings were placed transversally on the adhesive every 40 cm to prevent the contact of the strips with the adhesive before final positioning. The 64 strips were positioned in the module. Each strip was accurately positioned at one end, alternatively left and right, by inserting the corresponding end–cap rivet in its hole. Insuring the proper alignment of the two external strips with guides provided the overall geometrical accuracy.
- 4.
All fibres ends were inserted in their nominal holes in the fibre/PMT opto–couplers. This very delicate manipulation was executed prior to gluing the strips to allow their replacement in case of accidental damaging of the fibres.
- 5.
The strings were removed and the strips were glued on the double face adhesive. The top aluminium cover with its double face adhesive was put in place and pressed against the strips. Again, its holes and the end-caps rivets insured its proper positioning.
- 6.
The two light injection systems were mounted in the end–caps.
- 7.
Black glue was injected in the small tank of the opto–couplers. The holes of the opto–couplers being 0.08 mm larger than the fibre diameter, the glue filled the holes and slightly expended to the outside.
- 8.
The end–caps covers were sealed with black glue. For mechanical protection and to insure light tightness, an aluminium ribbon reinforced with carbon fibres was glued on the two long edges of the module. The ribbon was itself further protected by a 0.1 mm U–shape stainless steel foil.
- 9.
After polymerization of the glue in the opto–coupler, the module was placed on its side in a vacuum box. Two elastic membranes applied pressure on the two aluminium cover sheets to complete the assembly.
- 10.
The opto–coupler faces were polished with a Diamond Head countersink.
- 11.
The two PMT’s, their front–end electronic boards, DAQ boards and pairs of LED’s for the light injection system were mounted in the end-caps and connected.
Using this procedure, only a negligible number of fibres have been broken at one end (%) during the module construction and after the strip gluing.
The modules were transported to Gran Sasso in special boxes of 8 modules, 4 boxes per truck, equipped with shock absorbers. The 62 Target Tracker walls were mounted in situ in groups of 8, in parallel with the insertion inside the detector of previously mounted walls. The alignment of the inserted walls was performed using the Leica TDA5005 theodolite. Marks on both end–caps of the modules were used as reference points.
7 Module tests and calibration
The light tightness of the modules was tested using PMT’s dynode 12 which is the OR of all the PMT channels. The same measurements repeated in the Gran Sasso underground laboratory under much reduced cosmic ray and ambient radioactivity background give a counting rate of the order of 50 Hz/channel in the absence of light leaks.
For energy calibration, each module was placed on a vertical scanning table equipped with two electron spectrometers (see 3.1) that may irradiate simultaneously any two points of its surface. The nominal high voltage values determined during the PMT acceptance tests previously described, were applied to the tested module PMT’s. The correction factors equalizing all the PMT’s channels were set in the front–end chips.

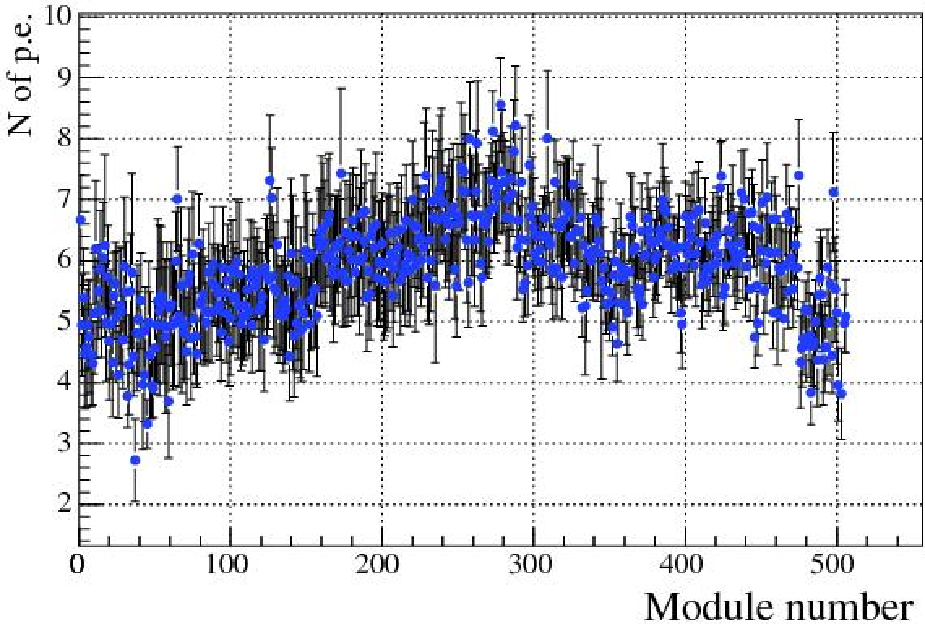
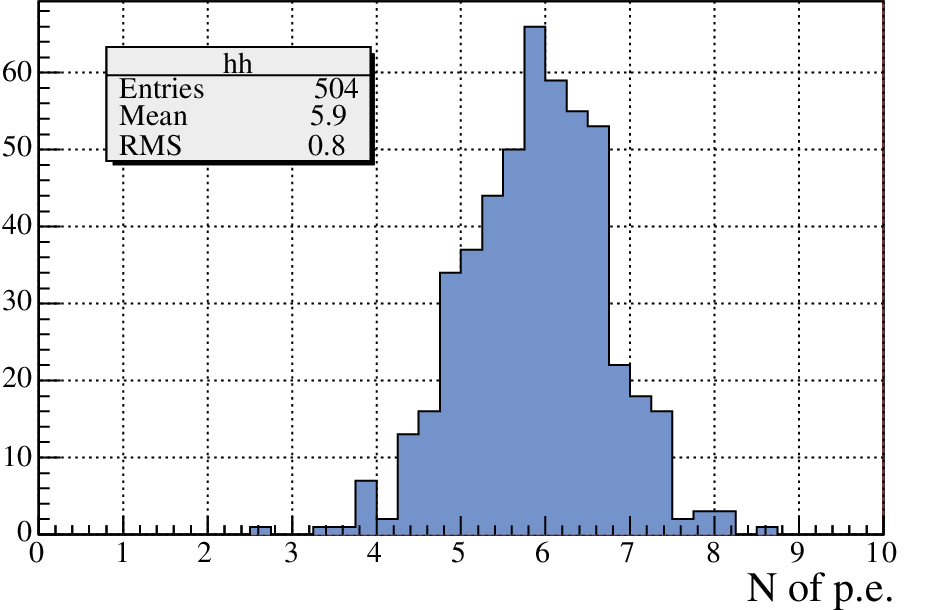
Two scanning tables driven by the acquisition program have been used during the production period. Measurements were taken at 9 points uniformly distributed along the length of each strip (see example Fig. 37). All distributions of the number of p.e versus the distance have been fitted by an exponential distribution. The parameters are stored in a data base for further use during the analysis to reconstruct by calorimetry the energy of OPERA events. Fig. 37 shows the mean number of p.e observed at the middle of the scintillator strips versus the strips production time. Fig. 37 is the marginal distribution of the former. The mean number of p.e is 5.9. Essentially, all values are well above the lower limit of 4 required in the specifications.
8 Aging
The properties of the glues are well known as they have been used by other neutrino experiments (NEMO3 [16], MINOS). Several glue samples have been followed for more than 7 years. The strength of the double face adhesive is guaranteed by the production and selling companies (MACTAC1010 10 MACtac Europe, Boulevard Kennedy, B-7060 Soignies, Belgium and VARITAPE1111 11 Varitape, NV Frankrijkstraat, 5 9140 Temse, Belgium) not to vary for at least 10 years. According to tests done by the AMCRYS–H company, an acceptable 10% decrease in the light output of the strips is expected over 10 years. Kuraray fibres are also widely used and tested by high energy experiments in much more severe conditions than in OPERA, as for example by the LHC ATLAS [17] experiment where no ageing effects have been reported. No ageing is expected for the multi-channel PMT’s.
During construction, a piece of 100 mm was cut from one every 8th scintillator strip. 63 optically isolated pieces glued together form a strip of the same length as a regular strip. 64 such strips made of 7936 pieces were assembled into a module. The module has been placed on a scanning table and each piece is irradiated in turn by an electron spectrometer following the procedure developed for the calibration of all Target Tracker modules. Any of the 7936 pieces has its light output measured every 25 days by continuously running the system, thus allowing a follow–up of the quality of the scintillator strips and of the glue used for fibres. Natural radioactivity in the underground laboratory is also being considered to measure the time dependence of the light output by dedicated measurements considering the shape of the corresponding energy distribution measured by the Target Tracker.
9 Acknowledgments
We acknowledge the support of the funding agencies IN2P3–France, FNRS/IISN–Belgium, SNF–Suiss and JINR-Russia. We would like to thank all private companies which have collaborated with our institutes in developing and providing materials for the OPERA Target Tracker construction. We are grateful to the OPERA collaboration for the support provided. Finally, we would like to thank all technicians non–authors of this paper who have helped us all these last years.
References
- [1] OPERA proposal,“An appearance experiment to search for oscillations in the CNGS beam”, CERN/SPSC 2000–028, SPSC/P318, LNGS P25/2000, July 10, 2000.
- [2] Y. Fukuda et al. (Super-Kamiokande), Phys. Rev. Lett. 81, 1562(1998), hep-ex/9807003.
- [3] M.Apollonio et al. (CHOOZ), Phys. Lett. B420, 397(1998), hep-ex/9711002.
- [4]
“Target Tracker Technical Design Report”,
http://ireswww.in2p3.fr/ires/recherche/opera/general/TDR/target_tracker.htm. - [5] PhotochemCAD. A Computer-Aided Design and Research Tool in Photochemistry and Photobiology, Du, H.; Fuh, R.-C. A.; Li, J.; Corkan, L. A.; Lindsey, J. S. Photochem. Photobiol. 1998, 68, 141142.
- [6] E. Ables et al. (MINOS), Fermilab Proposal P-875 (1995).
- [7] Hamamatsu Photonics K.K., Electron Tube Center, 314–5, Shimokanzo, Toyooka–village, Iwata–gun, Shizuoka–ken, 438–0193, Japan.
- [8] E.H. Bellamy and al., NIM A 339 (1994) 468-476.
- [9] “Contribution to Locating Interactions and Identifying Trajectories in the OPERA Detector”, Thomas Wälchli, PhD thesis, Bern, Nov. 2005.
- [10] Lucotte et al., “A front–end read out chip for the OPERA scintillator tracker”, Nuclear Instruments and Methods in Physics Research A 521 (2004) 378392.
- [11] The “Vue-des-Alpes” underground laboratory, Rev. Sci. Instrum., Vol. 74, No 11 (2003)4663.
- [12] CERN Program Library Long Writeup W5013, 1993.
- [13] OPERA–3d OPERA–2d and TOSCA are products by Vector Field Ltd., Oxford, UK (www.vectorfields.co.uk)
- [14] AMPERES, 3D Magnetostatic design software, Integrated Engineering Software, 46–1313 Border Place, Winnipeg, Manitoba, Canada R3H OX4 (www.integratedsoft.com).
- [15] “Le Trajectographe électronique associé á la cible de l’expérience d’oscillation de neutrinos OPERA”, Eric Baussan, PhD thesis, Université Louis Pasteur, Strasbourg, March 2004.
- [16] NEMO 3 Proposal LAL 94-29 (1994).
- [17] M. J. Varanda et al., “Recent results on radiation hardness tests of WLS fibers for the ATLAS Tilecal hadronic calorimeter”, Nuclear Instruments and Methods, A453 (2000) 255–258.