Marangoni Convection in Binary Mixtures
Abstract
Marangoni instabilities in binary mixtures are different from those in pure liquids. In contrast to a large amount of experimental work on Marangoni convection in pure liquids, such experiments in binary mixtures are not available in the literature, to our knowledge. Using binary mixtures of sodium chloride/water, we have systematically investigated the pattern formation for a set of substrate temperatures and solute concentrations in an open system. The flow patterns evolve with time, driven by surface-tension fluctuations due to evaporation and the Soret effect, while the air-liquid interface does not deform. A shadowgraph method is used to follow the pattern formation in time. The patterns are mainly composed of polygons and rolls. The mean pattern size first decreases slightly, and then gradually increases during the evolution. Evaporation affects the pattern formation mainly at the early stage and the local evaporation rate tends to become spatially uniform at the film surface. The Soret effect becomes important at the later stage and affects the mixture for a large mean solute concentration where the Soret number is significantly above zero. The strength of convection increases with the initial solute concentration and the substrate temperature. Our findings differ from the theoretical predictions in which evaporation is neglected.
pacs
47.20.Dr, 47.15.gm, 47.54.-r, 68.15.+eI INTRODUCTION
When a horizontal pure-liquid thin film is sandwiched between a warm
solid at the bottom and a cool gas at the top, heat transfer can be
used to drive fluid flows. At the liquid-gas interface, the surface
tension is a function of the interfacial temperature, and usually
decreases with temperature. A small temperature perturbation along
the film surface may create surface-tension inhomogeneities which
in turn trigger fluid instabilities. Flows observed in such films
are known as Bénard-Marangoni convection or surface-tension-driven
convection. Several recent theoretical and experimental studies are
relevant hereSchatz_prl95; swinney_jfm; Davis_arfm1987; Colinet_2000.
Differing from thin films of pure liquids, the instabilities in binary-mixture
films occur because the surface tension is a function of both temperature
and solute concentration Bhattacharjee_pre; Joo_jfm; Oron_pre04; Podolny_pof; Podolny_pof06.
Given a vertical temperature gradient across the film, the concentration
gradient may then be imposed by an independent source or generated
spontaneously by the Soret effect Platten_EurPJE04. If the
thermal Marangoni and solutal Marangoni effects enhance each other,
a long-wavelength monotonic instability is possible, while if they
compete with each other, an oscillatory instability may occur instead
Bhattacharjee_pre; Joo_jfm; Oron_pre04; Podolny_pof; Podolny_pof06.
In the past decade, theoretical work has led to predictions for the
linear and nonlinear stages of instabilities in thin films of binary
mixtures Bhattacharjee_pre; Joo_jfm; Oron_pre04; Podolny_pof; Podolny_pof06.
By contrast, experiments with surface-tension-driven instabilities
in binary mixtures are not available in the literature, to our knowledge.
The lack of such experiments has motivated us to investigate pattern
formation for binary mixtures in thin films.
II GOVERNING EQUATIONS AND PARAMETERS OF THE SYSTEM
The governing equations of the system, including the Soret effect are: Oron_pre04; Podolny_pof06
| (1) |
| (2) |
| (3) |
| (4) |
Here is time, , , , and denote the fluid velocity field, pressure, density, kinematic viscosity, and gravitational acceleration, respectively, and represent the temperature and thermal diffusivity of the fluid, respectively, is the concentration of the solute, is mass diffusivity of the solute, and is the Soret coefficient.
In Eq. (3), the heat flux induced by the concentration gradient, known as the Dufour effect, is usually very weak in liquids, and thus neglected. At the solid-liquid interface, , satisfies the no-slip, no-penetration condition , the temperature is fixed , and the mass flux vanishes, . Here, the wafer temperature is constant. At a nondeformable liquid-air interface, , the boundary conditions are given by Oron_RevMP. The heat and mass flux balances as well as those for the normal and tangential stresses read, respectively,
| (5) | |||
| (6) | |||
| (7) | |||
| (8) | |||
| (9) |
Here, is the thermal conductivity of the liquid, is the two-dimensional projection of onto the (horizontal) plane, is the heat transfer coefficient, assuming Newton’s law of cooling, is the constant room temperature, is the evaporative mass flux, is the liquid viscosity, is the vapor density, and is the latent heat of evaporation. Also, we have assumed that the surface tension is a linear function of temperature and concentration ; hence, . Here, is the reference surface tension at and . and . is the temperature difference across the film.
The dimensionless parameters of the problem are
| (10) | |||
| (11) |
respectively, the Prandtl, Lewis, Biot, Marangoni, evaporation, interfacial resistance and Soret numbers. The estimated values of these dimensionless parameters at the solute concentration of (Mole per liter of water) and at the temperature are , , , , , . The Marangoni number depends on the instantaneous value of the film thickness and in our experiments varies between and . The estimate of the Soret number is based on the experimental data from Ref. Gaeta_JPC82.
III EXPERIMENTAL SYSTEM
Before carrying out an experiment, the first important issue to be
resolved is the selection of a resonably non-volatile working liquid,
i.e. a binary liquid. We explored a wide range of candidate materials.
We first tried a mixture of ethanol/water and then abandoned it due
to the fast evaporation of ethanol. We also tested different combinations
of silicone oils with noticeable differences in surface tension between
them to avoid non-miscibility. Only a few silicone oils satisfying
the requirements of non-volatility and miscibility are commercially
available and are affordable. However, for all the possible pairs
of oils, either one or both are highly volatile at room temperature
or they are highly viscous at low temperature and volatile when heated.
The volatilities are typically much larger than that of pure water.
As a consequence, we did not choose binary mixtures of silicone oils
for our experiments. After much trial and error, we chose solutions
of sodium chloride (NaCl) with pure water as the working binary mixtures.
There is an additional advantage in choosing the mixture of NaCl/water
as a working liquid because its many physicochemical properties are
available in the literature, including surface tension as a function
of both concentration and temperature Matubayasi_JCIS99, and
the variation of the Soret coefficient with temperature and concentrationGaeta_JPC82
among others. The evaporation of water is significantly weaker than
that of other strongly volatile liquids, so that there is a reasonably
long time to take measurements before the film dries out completely.
Finally, the convective patterns are readily visible a short time
after a thin film is drawn.
Figure 1 presents a sketch of the experimental setup
of the system. The film was prepared on top of a silicon wafer with
a circular Plexiglas ring (about in diameter) as the lateral
boundary. The wafer was bonded to an Aluminum disk attached to a thin
copper plate. A copper tubing coil was soldered to the bottom of the
latter. The two ends of the coil were connected to a water bath (Neslab
RTE-221) using thermally insulated plastic tubing. The temperature
of the plate was held constant by water circulation. To further reduce
the heat loss, the whole copper plate was covered by thermally insulating
foam materials, leaving only a circular hole to hold the Aluminum
disk. The film was directly exposed to the room air whose temperature
is approximately constant during the course of an experiment. The
fluctuation in the room air is , equivalent to
of the film temperature stability. The temperature fluctuation of
the wafer was affected by several sources. The first source is the
thermal fluctuation of the Neslab water bath which does not exceed
. The second source is the temperature fluctuation at the
liquid-air interface. To further reduce the thermal fluctuation at
the silicon wafer, a bridge-controlled heating method was appliedbeh-ahlers.
The wafer temperature was measured by a thermistor embedded underneath
which was measured with an AC bridge. An offset of the bridge balance
point drove an integro-differential feedback circuit which, in turn,
drove a heater attached to the inlet of the tubing that carried the
cooling water. In such a way, the thermal fluctuation of the wafer
was further reduced. Depending on the mean temperature of the film,
the long-time thermal fluctuations of the wafer temperature are less
than at the mean temperature of the film
and less than at . The mean temperature
drop across the film is typically less than .
IV RESULTS AND DISCUSSION
Figure 2 shows a set of typical shadowgraph
flow patterns observed in thin films of NaCl/water mixtures with an
initial NaCl concentration of . In this figure, bright and
dark shades represent downward and upward flows, respectively. In
comparison with the standard Marangoni convection in pure liquids
(MCP), these patterns are very irregular and evolve with time. Following
the film deposition, an irregular pattern emerges, as seen in Fig.
2(a). This is a transient process with
patterns gradually decreasing in size (Fig. 2(b)).
Eventually small-scale patterns cover the entire system, as shown
in Fig. 2(c). The majority of the patterns
are roll-like structures, although there are also localized dots,
which are rarely observed in MCP. These small-scale patterns persist
for a period of time before any qualitative changes appear. Then,
the characteristic scale of the pattern becomes larger and the patterns
consist primarily of polygons, as shown in Fig. 2(d-f).
If the concentration of NaCl exceeds the maximal solubility (),
salt begins to crystallize out of the solution; small islands of salt
appear as black dots, as in Fig. 2(g-i).
An interesting aspect of the system evolution concerns the film thickness.
Interferometric measurements show that except at the meniscus boundary,
the film thickness remains horizontally uniform during
the evolution preceding the formation of salt crystals when deformation
of the film interface becomes significant.
To quantify the time variation of the pattern size, we apply fast
Fourier transforms (FFT) to the original shadowgraph images after
the removal of the background intensity variation. The images in the
Fourier space were averaged over phase angles. From the FFT spectrum,
we calculate both the mean wavenumber and its standard deviation.
The results are then converted to a real space pattern size, ,
as presented in Fig. 3(a). We normalize
this characteristic pattern size by its instantaneous film thickness,
which we refer to hereafter as the normalized pattern size. Immediately
after the film is initialized, the normalized pattern size is approximately
, i.e. the average pattern size is slightly below the value
of the film thickness. For some time thereafter, the patterns are
rolls, as seen in Fig. 2(c). The normalized
pattern size also retains its initial value for a considerable time,
and then gradually increases. Due to evaporation, the film thickness
decreases monotonically. Because the Marangoni number is proportional
to the film thickness, it too continuously decreases. Finally, the
average normalized pattern size reaches . At this point,
the corresponding pattern consists mainly of non-equilateral polygons.
The irregular shape of these polygons leads to large errors in determining
the pattern size, Fig. 3. This
feature is different from the classical MCP where patterns are regular
polygons Benard; Schatz_prl95. This difference may be caused
by one or a combination of several sources. First, there is the fact
that the surface conditions in the MCP are usually precisely controlled,
as compared to the present open system, for which a precise control
of the air layer above the film surface is much more difficult. Alternatively,
we note that the Marangoni number is ever changing, and it is impossible
to tune the value of the Marangoni number exactly at the threshold
value.
Towards the later stages of the pattern evolution, a noticeable difference
in the pattern occurs as relatively linear rolls give way to polygonal
patterns. At that point, the Marangoni number is , which
is quite big compared with the threshold values derived in non-evaporative
films Bhattacharjee_pre; Joo_jfm, and the film thickness was
about mm. We also carried out an experiment with an initial
film thickness of , which is close to the value mentioned
above. At this initial film thickness, the convection starts from
polygons and the pattern intensity decays with time until the convection
pattern vanishes. The magnitude of the pattern intensity, ,
as a function of time is plotted in the inset of Fig. 3(a).
is calculated from the average intensity of the image after
the removal of the background. A large Marangoni number was also observed
in an experiment using pure liquid films with strong evaporation Chai_ExpHT98.
However, no patterns were observed in pure water films in our system.
This suggests the solutal effects (thermal solutal and Soret effect)
are important. This also leads us to the conjecture that a considerable
part of the temperature drop across the film may actually occur spatially
uniformly at the film surface. This is because evaporation can create
a large temperature drop across the film due to the latent heat loss.
The rest of the temperature drop across the film is responsible for
the fluid instabilities at the film surface. Indeed, we estimate that
as much as 95% of the temperature drop across the fluid may occur
at the surface. Note that Fig. 3
does not show the data points where the crystallization of NaCl (black
dots) takes place at the film surface, as seen in Fig. 2(g-i).
The existence of the solid phase changes the flow pattern dramatically.
Solid NaCl can grow and merge with a deformable fluid interface. The
physics of this stage has not yet been well understood and is outside
the scope of this work.
Figure 3(b) shows the time evolution
of the normalized pattern size at a different temperature, .
While the qualitative features are similar to Fig. 3(a),
there are still some quantitative differences. The normalized pattern
size at the early stage is around which is larger than
at . In the beginning of each run (see e.g. circles
and diamonds), the normalized pattern size usually decreases for the
initial . This feature exists in some of the other
runs in figure (a) or (b), except it is more visible here. We note
that typically, after the film is deposited, patterns generally appear
at a slightly bigger size; they then gradually decrease in size by
developing smaller scale convection polygons or rolls such as those
in Fig. 2(a-c).
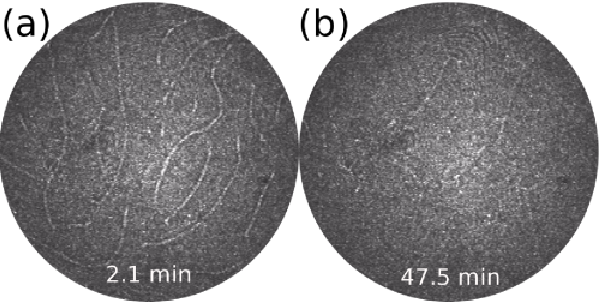
Figure 3 does not present the normalized
pattern-size variation for films with low concentrations where the
convection flows are weaker and convection decays rapidly. For instance,
in Fig. 4(a) the patterns are readily seen at
time ; they are very weak if not completely gone in
(b) at after the film is deposited. Similar observations
were seen for initial concentrations . The decay
of the pattern is an indication that the local evaporation flux has
a tendency to become spatially uniform with time. It is reasonable
to believe that the evaporation rate, and hence this effect, should
be independent of concentration. For higher concentrations, however,
the patterns persist and the intensity tends to be more uniform during
the evolution. One possibility is that this difference is related
to the Soret coefficient, as determined, for instance, from data for
NaCl/water mixtures by Gaeta et al.Gaeta_JPC82 At ,
the Soret coefficient is at and linearly
increases as to at .
We estimate the corresponding Soret number to be for
and for . The characteristic
time for mass diffusion, about for a thick film,
is roughly the same as in Fig 4. This suggests
that the Soret effect becomes important at the later stage of convection.
In Fig. 4(b), the value is
too small to drive convection after the pattern created by evaporation
begins fading away. Thus, in order for the Soret effect to play a
role, a sufficiently large concentration leading to a higher Soret
diffusion is necessary since the solutal Marangoni effect is directly
proportional to the Soret number .
In our experiments we have measured the instantaneous thickness of
the film over extended periods of time. Using the time history we
then evaluate the evaporation rate as a function of time. We find
that this quantity is nearly constant at a given film temperature
and a room temperature . Considering that the mean
concentration increases with time, the linear plot for , as
seen in the Fig. 5(a), implies a very weak concentration
dependence on the evaporation rate. The slope of vs.
increases for a larger film temperature or a smaller room
temperature . The linear decrease of the film thickness due
to evaporation seems to be robust and almost independent of the NaCl
concentration. As a comparison, the measurements of the film thickness
for evaporating pure-water films are also presented in Fig. 5(a).
The slope of for a water film is also a constant, indicating
that this linear behavior is indeed independent of the composition
of the liquid film.
This result is different from the analytical solution obtained by Burelbach et al. Burelbach_jfm1988 and Oron et al.Oron_RevMP for the base state of an evaporating film of a uniform thickness
| (12) |
where is the initial film thickness, is a constant
interfacial resistance to phase change and is the evaporation
constant. If , would be nearly linear. However, as
grows, would start to bend downwards, especially at
small . This trend is not seen in the present data. We have
experimentally ruled out the possibility that convective air motion
above the film might be responsible, since the theory assumes that
the air layer is at rest. In particular, experimental measurements
of the evaporation rate for a film at a temperature lower than the
room air are also presented in the inset of Fig. 5(a)
shown by the triangle-left symbols; they too show a linear variation.
We believe that the reason for the discrepancy between theory and
experiment is caused by the large fraction of the temperature difference
that occurs at the liquid-air interface. Because this temperature
difference remains nearly constant, the evaporation rate also remains
constant. Hence, the boundary condition used in recent theoretical
work differs from that which applies for these experiments.
Keeping other conditions the same, the magnitude of the convection,
as determined based on the average intensity of the shadowgraph images
recorded over the first 15 minutes after the film was initialized,
depends on the initial concentration of NaCl and the film’s
mean temperature. At low concentrations, , there
are no visible convection patterns even for a thick film.
This implies that buoyancy is irrelevant in our system if we assume
that the thermal expansion of the fluid is not significantly affected
by adding NaCl to the pure water. When the concentration
is higher than , the patterns gradually appear. This observation
suggests that thermal Marangoni alone cannot drive the fluid instability
and that the fluid motion is driven by the combination of thermal
Marangoni and solutal Marangoni effects. The magnitude increases monotonically
with concentration for . At a fixed film temperature
of , the Soret coefficient is negative in the concentration
range Gaeta_JPC82. However,
in such a range, the concentration is too low to observe any realistic
motions in the film.
V SUMMARY
To summarize, we have experimentally studied transient Marangoni convection
in thin binary-mixture liquid films using solutions of NaCl/water
in an open system. In the presence of evaporation, the patterns, consisting
of rolls and polygons, evolve with time. The length scale of the pattern
increases with time until the convection ceases. The Marangoni numbers
near onset are much larger than the values predicted in theories developed
for non-volatile binary liquids. Evaporation is important to the pattern
formation at the early stage, while the Soret effect is essential
at the later stage. For higher concentrations of NaCl, the convection
becomes stronger. Within the temperature range
explored in the experiment, convection patterns were observed in the
NaCl concentration range . Understanding
the rich pattern forming dynamics clearly requires new theoretical
work.
Acknowledgements.
This work was supported by NSF grant number . J. Z. thanks Matthias Sperl for his comments and suggestions of the manuscript. J. Z. also enjoyed the discussion with Peidong Yu about the lockin amplifier. A. O. acknowledges the hospitality of the focused research group in thin films and of the Mathematics department of Duke University. A. O. was partially supported by the Israel Science Foundation founded by the Israel Science Foundation through Grant no. 31/03-15.3.References
- (1) M. F. Schatz, S. J. Vanhook, W. McCormick, J. Swift, and H. L. Swinney, Phys. Rev. Lett. 75, 1938 (1995).
- (2) S. J. Vanhook, M. F. Schatz, J. Swift, W. McCormick, and H. L. Swinney, J. Fluid Mech. 345, 45 (1997).
- (3) S. Davis, Annu. Rev. Fluid Mech. 19, 403 (1987).
- (4) P. Colinet, J. Legros, and M. Velarde, Nonlinear Dynamics of Surface-Tension-Driven Instabilities (Wiley-VCH, Berlin, 2001).
- (5) J. Bhattacharjee, Phys. Rev. E 50, 1198 (1994).
- (6) S. Joo, J. Fluid Mech. 293, 127 (1995).
- (7) A. Oron and A. Nepomnyashchy, Phys. Rev. E 69, 16313 (2004).
- (8) A. Podolny, A. Oron, and A. Nepomnyashchy, Phys. Fluids 17, 104104 (2005).
- (9) A. Podolny, A. Oron, and A. Nepomnyashchy, Phys. Fluids 18, 054104 (2006).
- (10) J. Platten and P. Costeseque, Eur. Phys. J. E 15, 235 (2004).
- (11) A. Oron, S. H. Davis, and S. G. Bankoff, Rev. Mod. Phys. 69, 931 (1997).
- (12) F. Gaeta, G. Perna, and F. Belluccl, J. Phys. Chem. 86, 2967 (1982).
- (13) N. Matubayasi, H. Matso, K. Yamamoto, S.-i. Yamaguchi, and A. Matuzawa, J. Colloid Interface Sci. 209, 398 (1999).
- (14) R. Behringer and G. Ahlers, J. Fluid Mech. 125, 219 (1982).
- (15) H. Benard, Rev. Gen. Sci. Pure Appl. 11, 1261 (1900).
- (16) A.-T. Chai and N. Zhang, Exp. Heat Trans. 11, 187 (1998).
- (17) J. Burelbach, S. Bankoff, and S. Davis, J. Fluid Mech. 195, 463 (1988).