Interplay between evolutionary game and network structure:
the coevolution of social net, cooperation and wealth
distribution
Abstract
We study the interplay between evolutionary game and network structure and show how the dynamics of the game affect the growth pattern of the network and how the evolution of the network influence the cooperative behavior in the game. Simulation results show that the payoff-based preferential attachment mechanism leads to the emergence of a scale-free structural property, . Moreover, we investigate the average path length and the assortative mixing features. The obtained results indicate that the network has small-world and positive assortative behaviors, which are consistent with the observations of some real social networks. In parallel, we found that the evolution of the underlying network structure effectively promotes the cooperation level of the game. We also investigate the wealth distribution obtained by our model, which is consistent with the Pareto law in the real observation. In addition, the analysis of the generated scale-free network structure is provided for better understanding the evolutionary dynamics of our model.
pacs
89.75.Fb, 02.50.Le, 89.65.-s, 87.23.GeI Introduction
Game theory provides a useful framework for describing the evolution of systems consisting of selfish individuals game1; game2; game3. The prisoner’s dilemma game (PDG) as a metaphor for investigating the evolution of cooperation has drawn considerable attention PD1; PD2. In the PDG, two players simultaneously choose whether to cooperate or defect. Mutual cooperation results in payoff for both players, whereas mutual defection leads to payoff gained both. If one cooperates while the other defects, the defector gains the highest payoff , while the cooperator bears a cost . This thus gives a simply rank of four payoff values: . One can see that in the PDG, it is best to defect regardless of the co-player’s decision to gain the highest payoff . However, besides the widely observed selfish behavior, many natural species and human being show the altruism that individuals bear cost to benefit others. These observation brings difficulties in evaluating the fitness payoffs for different behavioral patterns, even challenge the rank of payoffs in the PDG. Since it is not suitable to consider the PDG as the sole model to discuss cooperative behavior, the snowdrift game (SG) has been proposed as possible alternative to the PDG, as pointed out in Ref Hauert. The main difference between the PDG and the SG is in the order of and , as in the SG. This game, equivalent to the hawk-dove game, is also of much biological interest SG1; SG2. However, the original PDG and SG cannot satisfyingly reproduce the widely observed cooperative behavior in nature and society. This thus motivates numerous extensions of the original model to better mimic the evolution of cooperation in the real world Nowak2; Nowak3; Nowak4; Lieberman.
Since the spatial structure is introduced into the evolutionary games by Nowak and May Nowak1, there has been a continuous effort on exploring effects of spatial structures on the cooperation Doebeli1; Doebeli2; Hauert. It has been found that the spatial structure promotes evolution of cooperation in the PDG Nowak1, while in contrast often inhibits cooperative behavior in the SG Hauert. In recent years, extensive studies indicate that many real networks are far different from regular lattices, instead, show small-world and scale-free topological properties. Hence, it is naturally to consider evolutionary games on networks with these kinds of properties Abramson; Kim; Masuda; WZX; Kim2; DoubleZheng; Jie. An interesting result found by Santos and Pacheco is that “Scale-free networks provide a unifying framework for the emergence of cooperation” Santos. So far, most studies of evolutionary games over networks are based on static network structure. However, it has been pointed out that the network structure may coevolve with the game Interplay1; Interplay11; Interplay2; Interplay3; Interplay4, where each individual would choose its co-players to gain more benefits, inducing the evolution of their relationship network. Some previous works about weighted networks suggest that it is indeed the traffic increment spurs the evolution of the network to maintain the system’s normal and efficient functioning traffic1; traffic2. From this perspective, in the present paper we propose an evolutionary model with respect to the interplay between the evolutions of the game and the network for characterizing the dynamics of some social and economic systems.
In our model, the SG is adopted for its more general representation of the realism and evolutionary cooperative behavior. Since growth is a common feature among networked systems BAreview, we assume that the network continuously grows by adding new agents to the existent network on the basis of the payoff preferential attachment. We focus on the evolution of the network structure together with the emergence and persistence of cooperation. Simulation results show that the obtained networks follow a power-law distribution, , with exponent tuned by a model parameter. The average distance of the network scales logarithmically with the network size, which indicates the network has a small-world effect. Interestingly, the assortative mixing properties generated by our model demonstrate that the model can well mimic social networks. In parallel, with the extension of the network, the density of cooperators increases and approaches a stable value, which gives a new explanation for the emergence and persistence of cooperation. We also explore the wealth distribution, where the so-called wealth is the accumulated payoff distribution of each individual. The Pareto law is well reproduced by our model. At last, we provide analyses for the obtained scale-free network structures.
The paper is arranged as follows. In the following section, we describe the model in detail, in Sec. III, simulation results and correspondent analytical ones are provided, and in Sec. IV, the work is concluded.
II The model
Let us introduce briefly the SG first. Consider two drivers are trapped in two side of a snowdrift. Each driver has two possible selections, either shoving the snowdrift (cooperator-C) or remaining in the car and do nothing (defect-D). If both cooperate, they could be back home on time, so that each will gain a reward of , whereas mutual defection results in still blocked by the snowdrift and each gets a payoff . If only one driver shovels (takes C), then both drivers can be back home. The driver taking D gets home with do nothing and hence gets a payoff , while the driver taking C gains a “sucker” payoff of . Thus, the rank of four payoff values is . Following common practice, the SG is rescaled with , and , where is a tunable parameter ranging from to . Hence, the payoffs can be characterized by a single parameter for convenient study.

Our model starts from nodes randomly connected with probability , each of which represents a player (In the following, we fix and examine that it has no influence on our results in present work). Initially, the nodes are randomly assigned to be either strategy C or D with percentages. Players interact with all their neighbors simultaneously and get payoffs according to the preset payoff parameter. The total payoff of a certain player is the sum over all its encounters. Then, every node randomly selects a neighbor at the same time for possible updating its strategy. The probability that follows the strategy of the selected node is determined by the total payoff difference between them, i.e.,
| (1) |
where and are the total payoffs of and at the moment of the encounter. Here, characterizes “noise”, including bounded rationality, individual trials, errors in decision, etc. It should be noted that here plays a different role comparing with the cases of adopting the normalized payoff difference. In parallel, does not play the same role for different network sizes T1; T2; Szabo4; Szabo5. Since in our model, the network size gradually grows, it is not easy to keep the effect of unchanged at every time step. For simplicity, we fix to during the evolution of the network.
Here, we adopt the synchronous updating rule. After each step that players update their strategies, a new individual is added into the network with (we fix for convenience) links preferentially attached to existent nodes of higher payoffs, i.e.,
| (2) |
where and are the total payoffs of and obtained in the interaction process. is a tunable parameter, which reflects the original payoff values of players when they join into the game system. For simplicity, we set be a constant. The payoff-based preferential selection takes into account the “rich gets richer” characteristic and couples the dynamics of the evolutionary game and the evolution of the underlying network. After a new player joins into the network, the new one randomly choose strategy C or D and all old players preserve their strategies for the game in the next round. Then, repeat the above procedures, and the network size gradually grows.
III Simulation and analytical results
III.1 The evolution of networks
Numerical simulations are performed to quantify the structural properties of the obtained networks. In Figure 1, we show the degree distribution and correspondent cumulative degree distribution , in networks of size . The distributions clearly exhibit power-law behaviors, , in a broad range of degrees with a fat tail for very large degrees. Besides, for the cumulative degree distribution , a cut-off at very large degrees is observed for each distribution, which corresponds to the fat tail range. The cumulative degree distribution provides a clear picture of the power-law behavior. These results indicate that the empirically observed scale-free structure can be generated from the coupling of the game and the evolution of the network, which may be an explanation for the heterogenous structure of many social and economical networked-systems. Moreover, the exponent is a function of , which makes our model more general for mimicking a variety of real networks. We have checked that the parameter has slight effect on , while plays a major role. Analytical results of the power-law distribution will be given after the discussion of the correlation between individuals’s payoffs and the degrees of nodes occupied by them.
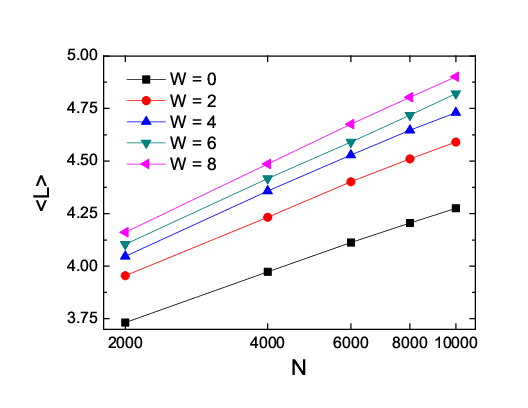
Average path length is a key measure for quantifying the small-world effect, which is widely observed in the real world Newman. The average path length of a network is defined as
| (3) |
where is the shortest path length from node to node , and is the network size. We perform simulations on as a function of network size for different values of parameter . Each data point is obtained by averaging over different network realizations. Figure 2 shows that for all the values of , increases logarithmically with the growth of the network, but the slopes for different show slight differences. These results demonstrate that the small-world effect can be reproduced by the proposed model.
Another important structural feature useful for measuring the correlation among nodes of a network is the assortative mixing coefficient , or called degree-degree correlation mixing1; mixing2, which is defined as follows:
| (4) |
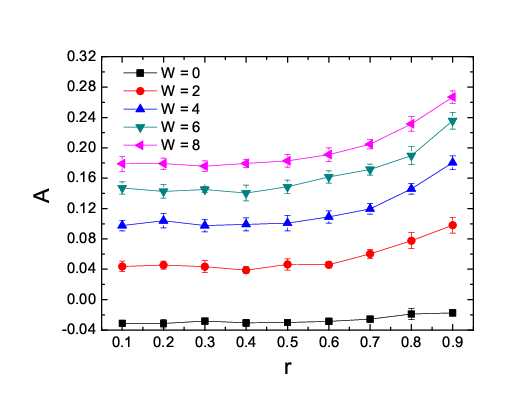
where and are the degrees of the two nodes at the end of the th edge, with ( is the total number of edges of the observed graph). Two main classes of possible correlations have been observed in the real world: assortative behavior if , which indicates that large-degree nodes are preferentially connected with other large-degree nodes, and disassortative if , which denotes that links are more easily built between large-degree nodes and small-degree ones. As demonstrated in Ref mixing1, almost all social networks show positive values of , while others, including technological and biological networks, show negative . However, the mechanism that leads to the basic difference between these two classes networks remains unclear why. We calculate the assortative mixing coefficient to check whether the generated networks by our model are suitable representations of social systems. Figure 3 shows as a function of parameter for different values of . One can see that assortative behavior occurs as increases. For each value of , shows slight changes in the cases of low values of , while for large , assortative mixing is enhanced with the same value of . The reported results demonstrate that the networks generated by our model can well capture the key distinguished structural property of social networks.
III.2 Cooperation and wealth distribution
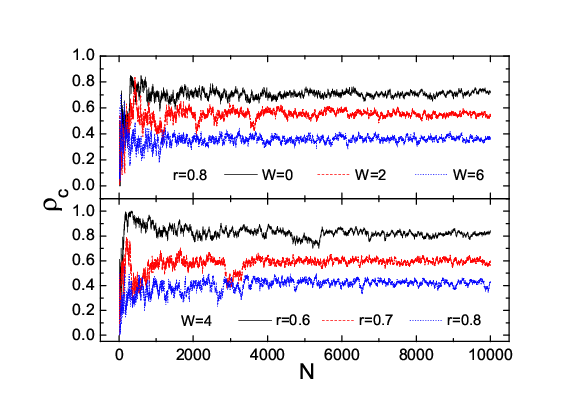
So far we have studied the evolution of the underlying network structure influenced by the game. Next, we turn to the effect of changing network structure on the cooperative behavior in the game. The key quantity for measuring the cooperation level of the game is the density of cooperators, Kim. Figure 4 shows the time series of for different values of and . One can find that after a short period of temporary behavior, reaches a stable value with small fluctuations around the average value. Hence, for each pair of and can be calculated by averaging a period time after the system enter a steady state. Here, the network size is equal to the evolutionary time step, since each time an individual joins into the system. In Fig. 5, we report the depending on for different values of . Each data point is obtained by averaging over 10 different simulations with an average from to for each simulation. One can see in Fig. 5, in the case of , shows no difference for distinct . While for , the lower the value of , the higher the cooperation level. It has been known that scale-free networks favor the emergence and persistence of cooperation Santos. Thus, the fact that in our model is larger than that of well-mixed cases is attributed to the emergence of scale-free structural properties. At the very beginning, the network evolves from a core of random-like structure, in which cooperation cannot dominate in the game. While as the network gradually grows, power-law degree distribution emerges, which leads to a sharp increase of , as shown in Fig. 4 from to . The inhibited cooperation by the increment of is also ascribed to the weakened heterogeneity of degree distribution. As displayed in Fig. 1, lower value of corresponds to stronger heterogeneity of degree distribution reflected by the longer fat tail. The above discussion gives a thorough picture that it is the growth and the payoff-based preferential attachment that produce scale-free network structures and meanwhile, the generated heterogeneity of degree distribution effectively promotes the emergence and persistence of cooperation.

Generally speaking, cooperation and defection are prototypical actions in economical systems. Hence, evolutionary games may be suitable paradigms for studying and characterizing the phenomena observed in economical systems with players represented by agents. In such systems, a well-known and extensively studied phenomenon is the wealth distribution of agents which follows the Pareto law in the high-income group pareto; US; JP. In order to check the validity of our model for understanding economical behavior, we investigate the wealth distribution by adopting the present evolutionary model, where the wealth of an agent is naturally represented by the accumulated payoff over time steps. Figure 6 reports the accumulated distribution of accumulated payoff in the whole population for different model parameters and . One can see that power-law distribution can be observed in a wide range of , while the wealth distributions behave as exponential corrections in the zone of low values of , which is in accordance with the empirical evidence. Moreover, in the left panel of Fig. 6, has strong influence on the exponent of power-law distribution and higher value of corresponds to larger exponent. In contrast, in the right panel, nearly has no effect on the wealth distribution. The correlation between and the exponent of wealth distribution makes our model general for reproducing the empirical observation.

III.3 Analysis
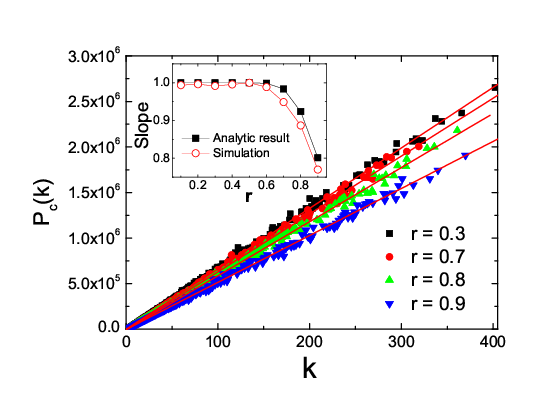
In the following, we provide some analysis for the scale-free network structure induced by the payoff-preferential attachment via considering the correlation between the accumulated payoff of individuals and their correspondent degrees . As shown in Fig. 7, is a good linear function of with slope depending on in the simulations. Using the mean-field approximation, a node with degree may have cooperative neighbors and defectors and itself may be cooperator with probability and defector with . Thus, at time step , its payoff can be calculated as
| (5) | |||||
By substituting the elements of payoff matrix of the SG in Eq. (5), where , , and , Eq. (5) is simplified to
| (6) |
Then, we get the accumulated payoff
| (7) | |||||
where the approximation is ascribed to the fact that quickly reaches a stable value which is almost independent of (as shown in Fig. 4), so that are replaced by for simplicity. The inset of Fig. 7 illustrates the comparison between the simulation results and the analytical ones on the the normalized slopes vs . The theoretical predictions are calculated by substituting the simulation results of (in Fig. 5) into Eq. (7). The theoretical results are consistent with simulations.
Accordingly, considering the relation between the payoff of an individual and its degree in Eq. (6), we give the evolution equation of the degree of a given node
| (8) | |||||
Thus, we get with . Then, in the infinite size, the degree probability distribution can be acquired by with
| (9) |
Though this expression is somewhat rough because of several approximations, such as , Eq. (9) can qualitatively describe the power-law degree distribution of the generated network.
In addition, we should mention a network model proposed by Dorogovtsev and Mendes IA, which is related to the present work. In such model, by introducing the “initial attractiveness” (IA) to each node, power-law degree distributions can be generated together with the exponent of the distribution controlled by strength of the IA. Very interestingly, the IA plays a significant role in the emergence of the assortative mixing property Assort. In our model, the parameter may play the same role as that of the IA in the perspective of assortative feature. The introduction of enlarges the probability of poor players being connected by the new one in the growth process. Moreover, there is an approximately positive correlation between the payoff and the degree of a given individual. Hence, enhances the connecting probability between small-degree individuals that results in the assortative mixing behavior. However, in our model, the degree distribution is not only controlled by and , but also by , as obtained in Eq. (9). Our model couples the dynamical process of the SG and the evolution of the network, which leads to the difference between our model and the network model of Dorogovtsev and Mendes.
IV conclusion
In summary, we have studied the interplay of the evolutionary game and the relevant network structure. Simulation results indicate that both scale-free structural property and high cooperation level result from the interplay between the game and the network. Moreover, the resultant networks reproduce some typical features of social networks, including small-world and positive assortative mixing properties. The investigation of the wealth distribution of players indicates the validity of our model in mimicking the dynamical behavior of economical systems.
However, some issues still remain unclear and deserve further study, such as the evolution of connections among existing nodes, as discussed in previous works DM; MS1; why. On the other hand, in the present work, we only consider the case of “birth” of new players, which leads to the growth of the network. While, in social systems, “death” and “aging” are also important events and a previous work has already pointed out that the aging effect plays a significant role in the evolution of network structures aging. Therefore, there is a need to consider the death and aging processes for better characterizing the evolutionary dynamics of social systems in the future study.
References
- (1) A. M. Colman, Game Theory and its Applications in the Social and Biological Sciences (Butterworth-Heinemann, Oxford, 1995).
- (2) J. Hofbauer and K. Sigmund, Evolutionary Games and Population Dynamics (Cambridge University Press, Cambridge, U.K., 1998).
- (3) R. Trivers, Social Evolution (Cummings, Menlo Park, 1985).
- (4) R. Axelrod and W. D. Hamilton, Science 211, 1390 (1981)
- (5) R. Axelrod, The Evolution of Cooperation (Basic books, New York, 1984).
- (6) C. Hauert and M. Doebeli, Nature 428, 643 (2004).
- (7) R. Sugden, The Economics of Rights, Co-operation and Welfare (Blackwell, Oxford, U.K., 1986).
- (8) J. M. Smith, Evolution and the Theory of Games (Cambridge University Press, Cambridge, UK, 1982).
- (9) M. Nowak and K. Sigmund, Nature (London) 355, 250 (1992).
- (10) M. Nowak and K. Sigmund, Nature (London) 364, 1 (1993).
- (11) M. Nowak, A. Sasaki, C. Taylor, and D. Fudenberg, Nature (London) 428, 646 (2004).
- (12) E. Lieberman, C. Hauert, and M. Nowak, Nature (London) 433, 312 (2005).
- (13) M. Nowak and R. M. May, Nature (London) 359, 826 (1992); Int. J. Bifurcation Chaos Appl. Sci. Eng. 3, 35 (1993).
- (14) M. Doebeli and N. Knowlton, Proc. Natl. Acad. Sci. USA 95, 8676 (1998).
- (15) M. Doebeli, C. Hauert and T. Killingback, Science 306, 859 (2004).
- (16) G. Abramson and M. Kuperman, Phys. Rev. E 63, 030901(R) (2001).
- (17) B. J. Kim, A. Trusina, P. Holme, P. Minnhagen, J. S. Chung, and M. Y. Choi, Phys. Rev. E 66, 021907 (2002).
- (18) N. Masuda and K. Aihara, Phys. Lett. A 313, 55 (2003).
- (19) Z. X. Wu, X. J. Xu, Y. Chen, and Y. H. Wang, Phys. Rev. E 71, 037103 (2005).
- (20) H. Hong, B. J. Kim, M. Y. Choi, and H. Park, Phys. Rev. E 72, 041906 (2005).
- (21) L.-X. Zhong, D.-F. Zheng, and B. Zheng, and P. M. Hui, arXiv: physics/0602039.
- (22) J. Ren, W.-X. Wang, G. Yan, and B.-H. Wang, arXiv: physics/0603007.
- (23) F. C. Santos and J. M. Pacheco, Phys. Rev. Lett. 95, 098104 (2005).
- (24) H. Ebel and S. Bornholdt, Phys. Rev. E 66, 056118 (2002).
- (25) M. G. Zimmermann, V. M. Eguíluz and M. S. Miguel, Phys. Rev. E 69, 065102 (2002).
- (26) M. G. Zimmermann and V. M. Eguíluz, Phys. Rev. E 72, 056118 (2005).
- (27) V. M. Eguíluz, M. G. Zimmermann, C. J. Cela-Conde, and M. San Miguel, Am. J. Sociol. 110, 977 (2005).
- (28) P. Holme and G. Ghoshal, Phys. Rev. Lett. 96, 098701 (2006).
- (29) A. Barrat, M. Barthélemy, and A. Vespignani, Phys. Rev. Lett. 92, 228701 (2004).
- (30) W.-X. Wang, B.-H. Wang, B. Hu, G. Yan, and Q. Ou, Phys. Rev. Lett. 94, 188702 (2005).
- (31) R. Albert and A.-L. Barabási, Rev. Mod. Phys. 74, 47 (2002).
- (32) A. Traulsen, J. C. Claussen and C. Hauert, Phys. Rev. Lett. 95, 238701 (2005).
- (33) J. C. Claussen and A. Traulsen, Phys. Rev. E. 71, 025101 (2005).
- (34) G. Szabó and J. Vukov, Phys. Rev. E 69, 036107 (2004).
- (35) J. Vukov and G. Szabó, Phys. Rev. E 71, 036133 (2005).
- (36) M. E. J. Newman, SIAM Review 45, 167 (2003).
- (37) M. E. J. Newman, Phys. Rev. Lett. 89, 208701 (2002).
- (38) M. E. J. Newman, Phys. Rev. E 67, 026126 (2003).
- (39) W.-X. Wang, B. Hu, B.-H. Wang, and G. Yan, Phys. Rev. E 73, 016133 (2006).
- (40) V. Pareto, Le Cours d’Economique Politique (Macmillan, Lausanne, Paris, 1987).
- (41) A. A. Dragulescu, V. M. Yakovenko, Physica A 299, 213 (2001).
- (42) S. Moss de Oliveira, P. M. C. de Oliveira, D. Stauer, Evolution, Money, War and Computers (B. G. Tuebner, Stuttgart, Leipzig, 1999).
- (43) S. N. Dorogovtsev, J. F. F. Mendes and A. N. Samukhin, Phys. Rev. Lett. 85, 4633 (2000).
- (44) A. Barrat and R. Pastor-Satorras, Phys. Rev. E 71, 036127 (2005).
- (45) S. N. Dorogovtsev and J. F. F. Mendes, Europhys. Lett. 52, 33 (2000).
- (46) W.-X. Wang, B. Hu, T. Zhou, B.-H. Wang, and Y.-B. Xie, Phys. Rev. E 72, 046140 (2005).
- (47) S. N. Dorogovtsev and J. F. F. Mendes, Phys. Rev. E 62, 1842 (2000).