Correcting for Distortions due to Ionization in the STAR TPC
Abstract
Physics goals of the STAR Experiment at RHIC in recent (and future) years drive the need to operate the STAR TPC at ever higher luminosities, leading to increased ionization levels in the TPC gas. The resulting ionic space charge introduces field distortions in the detector which impact tracking performance. Further complications arise from ionic charge leakage into the main TPC volume from the high gain anode region. STAR has implemented corrections for these distortions based on measures of luminosity, which we present here. Additionally, we highlight a novel approach to applying the corrections on an event-by-event basis applicable in conditions of rapidly varying ionization sources.
Keywords:
Calibration , Space charge , Time projection chamberPACS
29.40.Cs , 29.40.Gx, , , , , , , ,
1 Introduction
The time projection chamber (TPC) used by the STAR experiment at RHIC has several potential sources of field distortions [1]. While most of these sources are static, the buildup of slow-drifting positively charged ions in the volume gas generated from standard operation of the TPC varies with the quantity of charged particles traversing the TPC, and thereby both the luminosity of the collider and the multiplicity of charged particles emitted by the collisions. The variations in this “space charge” can occur on time scales down to what it takes the ions to drift the length of the chamber, which is approximately one half second for the STAR TPC.
2 Space Charge Distortions
Modeling the distortions due to space charge is a straightforward process beginning with a postulation of the typical three-dimensional distribution of ionization in the TPC. The nearest measure we have of this in STAR is a record of the distribution of electron clusters reaching the TPC endcap averaged over many events using a so-called “zero-bias” trigger (which is random with respect to collision times, removing any biases related to the definition of a collision). This measure integrates out any drift-direction dependencies, but compares well in radial dependence (approximately as inverse radius squared) for Au+Au collisions to a simulation using the HIJET event generator [2]. The simulation indicates a uniform distribution of charge in the drift direction.
We use the HIJET charge distribution integrated along the distance from the endcap to any point in space (representing the effect of continual collision contributions) in conjunction with the boundary conditions of grounded surfaces surrounding the TPC gas volume to solve for the electrical potential due to space charge. An analytical solution is not achievable, so we use a numerical relaxation to solve for the potential on a grid in two dimensions (with assumed azimuthal symmetry) and interpolate. An electric field is obtained from the potential and is treated as a perturbation atop the normal drift field. The distortions to the measured positions of electron clusters are then calculated by integrating the effects of this perturbing field (which depend on operating conditions of the chamber) along the path from a point in the TPC to the endcap where the clusters are measured [1]. The amplitude of this distortion is directly proportional to the quantity of space charge () present. In practice, we calibrate the average charge density over the volume of the chamber: .
Because the Lorentz force on the drifting electron clusters is proportional to the cross product of the electric and magnetic field (aligned along the drift direction in STAR) vectors, the principal distortion of consequence is azimuthal, and is plotted in Fig. 1. This distortion has the effect of rotating reconstructed tracks in the transverse plane about a point midway along their path through the TPC.


3 Space Charge Corrections
Knowing is sufficient to subtract the calculated distortions from measured electron cluster positions to obtain their approximate original, undistorted positions. In the absence of direct measures of , a measure of the distortion to tracks (fit from distorted clusters) may suffice to indirectly determine . Simulation shows that for any given distorted primary particle track, its signed distance of closest approach (sDCA)11 1 The sign is determined by the Z-direction of the cross product of the track momentum vector at its closest approach and the vector pointing to the collision vertex, essentially identifying on which “side” of the vertex the reconstructed track passes. to the collision vertex is approximately linearly proportional to space charge, and we can obtain , where depends on the locations of points on the track. Each real track can then be used to derive an observed space charge:
To understand the scale of this distortion, it is worthwhile to note that some recorded events exhibited beyond 1cm offsets in sDCA, the mean of their distributions.22 2 We use only TPC tracks with at least 25 points, pseudorapidity within 1, and transverse momentum between 0.3-2.0 GeV/c for all sDCA and measurements.
A distribution of values from any given collision event will include a background from secondaries which naturally do not point to the collision vertex, and will be smeared by the intrinsic resolution of the TPC to measure sDCA. As seen in the distribution from a single very high multiplicity event in Fig. 2, the centroid of a peak formed by primaries provides a means to determine more accurately.

To be effective, the value of used to correct the distortions must be updated on time scales shorter than the fluctuations caused by collider operating conditions. During the 2000 through 2003 years of operating RHIC, scalers of trigger counter rates recorded online (during runs) every 30 seconds served to measure these fluctuations sufficiently [3]. Along with a significant luminosity increase in 2004, however, these fluctuations were observed in the systematic behavior of sDCA distributions on sub-second time scales.
An event-by-event (E-by-E) method using only from individually recorded events suffers from insufficient statistics to get a good measure in most events. To compensate, we can take advantage of the fact that fluctuations cannot occur on time scales much shorter than the drift time of ions in the TPC. We do this by building a running sum of from each event and previous events downweighted appropriately by their age. Because we measure from events which have already been corrected with some value , we set the new value to be . This method is self-correcting in that even if the conversion factors are not perfect, will quickly converge to a value which brings the sDCA distributions to peak at zero.
Weaknesses in this technique include events at the start of data files (for which there are no previous events), sizable time gaps between some events, and series of low multiplicity events for which insufficient statistics are obtained within short time scales. The first problem is solved by performing a prepass on the first few events in each file to determine a viable initial , which is then used in the production pass until the E-by-E method becomes applicable. The latter issues are handled by falling back to for such events until the E-by-E method can again be useful. Backgrounds which introduce charge distributions different from the HIJET model can also degrade performance.
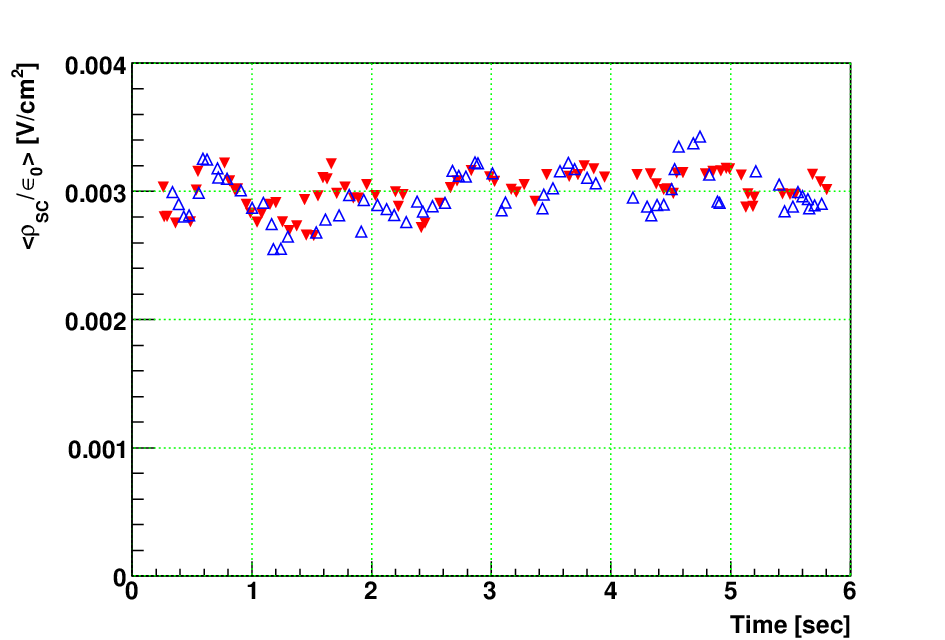
Fig. 3 demonstrates that the fluctuations in determined by the E-by-E method are not artificial. In two independent but concurrent sets of events, similar behaviors can be seen on sub-second time scales, while differences illustrate the uncertainty on in the method of about 0.0001 V/cm2.
4 Ion Leakage Around the Gated Grid
Studying residuals of TPC cluster positions from track fits revealed that an additional source of ions is also present in the TPC. A discontinuity in the residuals at the gap between the inner and outer readout wire chambers of the TPC, evident in Fig. 4, is consistent with incomplete blockage (by the gated grid) at this gap of ions created in the high gain region around the anode wires. This allows a sheet of ions to flow from this gap across the TPC gas volume to the cathode.


Again, we can model the distortions from this leak around the gated grid in the same manner as the space charge, providing a map of cluster position corrections whose magnitude is proportional to the amount of leaked charge (). These distortions similarly affect sDCA, and was found to scale with collision rates in the same manner as . A calibration was performed to find the ratio () between and which removed the residual discontinuities while simultaneously zeroing sDCA in a sample of events. And the E-by-E correction was modified to track the two distortions together:
5 Summary
We have identified and corrected for distortions due to ion charge buildup in the STAR TPC. With the onset of significant short time scale fluctuations in the sources of the ions which were not monitored with fine time granularity during data acquisition, we have developed a technique to determine and adjust for the fluctuations during reconstruction on an event-by-event basis. Performance of the corrections can be assessed by examining the distribution of sDCA as a function of luminosity, shown in Fig. 5. Here we see that the spread in sDCA is contained to within approximately 1mm at all luminosities, and the mean is kept to within a few hundred microns of zero. In 2005, online monitoring with one second granularity was implemented and will provide further assessment of the technique’s success.

References
- [1] M. Anderson et al., Nucl. Instr. and Meth. A499 (2003) 659.
- [2] A. Shor and R. Longacre, Phys. Lett B218 (1989) 100.
- [3] F.S. Bieser et al., Nucl. Instr. and Meth. A499 (2003) 766