A highly granular electromagnetic calorimeter prototype based on tungsten absorber and sampling units equipped with silicon pads as sensitive devices for signal collection is under construction. The full prototype will have in total 30 layers and be read out by about 10000 Si cells of 1 1 cm2. A first module consisting of 14 layers and depth of 7.2 at normal incidence, having in total 3024 channels of 1 cm2, was tested recently with beam. We describe the prototype and discuss some preliminary testbeam results.
CALICE Si/W electromagnetic calorimeter prototype, first testbeam results
Abstract
A highly granular electromagnetic calorimeter prototype based on tungsten absorber and sampling units equipped with silicon pads as sensitive devices for signal collection is under construction. The full prototype will have in total 30 layers and be read out by about 10000 Si cells of 1 1 cm2. A first module consisting of 14 layers and depth of 7.2 at normal incidence, having in total 3024 channels of 1 cm2, was tested recently with beam. We describe the prototype and discuss some preliminary testbeam results.
Proceedings of the International Linear Collider Workshop
LCWS 2005, Stanford University, 18-22 March 2005
2005 International Linear Collider Workshop - Stanford,
U.S.A.
CALICE Si/W electromagnetic calorimeter prototype, first testbeam results
G. Mavromanolakis 11 1 email: gmavroma@hep.phy.cam.ac.uk or gmavroma@mail.cern.ch
I GENERAL
An experiment at the Future Linear Collider with 0.5 - 1 TeV center-of-mass energy range must be capable to perform high precision measurements in order to exploit the physics potential of the machine. This fact sets strict requirements on performance of vertex, tracking and calorimetric detectors. The CALICE Collaboration ref:calice has been formed to conduct the research and development effort needed to bring initial conceptual designs for the calorimetry to a final proposal suitable for an experiment at the Future Linear Collider.
The main proposal is that both electromagnetic and hadronic calorimeters should be highly granular to allow very efficient pattern recognition for excellent shower separation and particle identification within jets and subsequently to provide excellent jet reconstruction efficiency ref:calorimetry. This concept, also known as “particle flow paradigm”, to be successful requires optimal interplay between hardware, i.e. granularity, and software, i.e. reconstruction algorithms.
CALICE plans include studies of both electromagnetic and hadronic calorimeter prototypes. The electromagnetic prototype is a sampling calorimeter with W absorber and Si pads as sensitive material. There are two main different hadronic prototype concepts under study both based on steel absorber. One has scintillator tiles and conventional analogue readout scheme, while the other is envisaged to be equipped with resistive plate chambers or GEMs and have digital readout ref:calorimetry.
Combined and individual testbeam studies are planned that will allow us to debug technology/detector concept(s), to perform detector characterisation, to test the “particle flow paradigm” and the interplay between hardware and software, and also to test-validate-improve available simulation codes and shower packages ref:gm.
The Si/W ECAL prototype and first testbeam results are discussed here.
II Si/W ECAL PROTOTYPE
The Si/W electromagnetic prototype is a sampling calorimeter with high granularity, in both transverse and longitudinal direction. The full detector is longitudinally segmented into 30 layers of W interleaved with 0.5 mm thick Si pads as sensitive material. The W layers have varying thickness, the first 10 layers are 1.4 mm thick each, 2.8 mm in the next 10 and 4.2 mm in the final 10. The total depth of the detector is about 24 at normal incidence, and has an active face with an area of 18 18 cm2. It is read out in 1 1 cm2 cells and in total there are 9720 channels arranged in 270 wafers each consisting of a 6 6 cell matrix. A schematic of the full prototype is given in Figure 1 which illustrates more clearly the actual construction. The layers are arranged in slabs with their supporting structure consisting of H-shaped W sheet wrapped with a carbon fiber layer. On each side of the W sheet of the slabs PCB’s are put on which the Si wafers are glued. Then each slab is shielded with aluminum foil. This construction introduces odd/even layer asymmetry, which contributes to difference in layer response at a few percent level, since showering particles pass through alternately different material budget before its signal is sampled, namely W-Al-Si-PCB for the odd layers and W-PCB-Si-Al for the even layers.

III FIRST TESTBEAM RESULTS
A structure of 10 layers with in total 60 wafers and 2160 channels was calibrated in a cosmic testbench at Ecole Polytechnique in Paris, France. About cosmic triggers were recorded during December 2004. These data allowed the calibration constants of these channels to be determined to 1% level of accuracy which is sufficient for the current phase of studies.
A typical channel is shown in Figure 2(a), the pedestal and the mip signal are clearly separated and have Gaussian and Landau shape, respectively, as expected. A signal over noise ratio of about 8.5 was observed with a variation among the channels of about 6%, as can be seen in Figure 2(b). Figure 2(c) shows the distribution of the mip peak for the channels. One should note how narrow the distribution is, with a spread, as expressed by the sigma/mean, of 3%. This intercalibration spread is coming from the variation of the wafer thickness which is 3% as given by the wafer suppliers. Construction and material inhomogeneity contribute to the constant term of energy resolution and is a common source of performance degradation. To be able to determine and to correct for these inhomogeneities effects due to production tolerance is one of the key advantages of Si being used for calorimetric detectors. Since Si show relatively stable properties along time and with respect to temperature variation less frequent monitoring and calibration dedicated effort will be required for a Si based calorimeter.
 |
 |
 |
| (a) | (b) | (c) |
A so-called “30%” equipped Si/W prototype was shipped to DESY in Hamburg, Germany, and was tested with electrons during January-February 2005. The prototype consists of 14 W layers, the first 10 are 1.4 mm thick each and the last 4 at 2.8 mm, interleaved with 18 12 matrix of active Si cells 1 1 cm2 each. In total the detector has 3024 channels and measures about 7.2 at normal incidence.
The testbeam layout is shown in Figure 3. Three scintillation counters are used to provide the trigger signal and there are also four drift chambers which perform the tracking of the incoming particles. The calorimeter protoype was put on top of a moving table which allowed horizontal and vertical displacement with respect to beam. Data at several configurations of position energy angle were taken. We performed position scans at center - edge - corner of wafers, with electron beam mainly at 1, 2, 3 GeV, and with some runs at 4, 5 and 6 GeV, and with detector tilted with respect to the beam direction at , , and . In total about trigger events were recorded. Some preliminary results are reported in the following.

A typical event is displayed in Figure 4 where the cells hit with signal above a threshold of 0.5 mip are shown. This illustrates clearly the concept of “tracking calorimetry”, the high granularity of the calorimeter allows to record the development of the shower along both transverse and longitudinal direction and to reconstruct it in a tracking manner, i.e. both calorimetric and tracking information are provided.
The total signal recorded as a function of the cell threshold applied is shown in Figure 5. A threshold around 0.5 - 0.6 mip seems to be a safe limit in order to suppress noise sufficiently. The results following are with a cell threshold of 0.5 mip being applied.
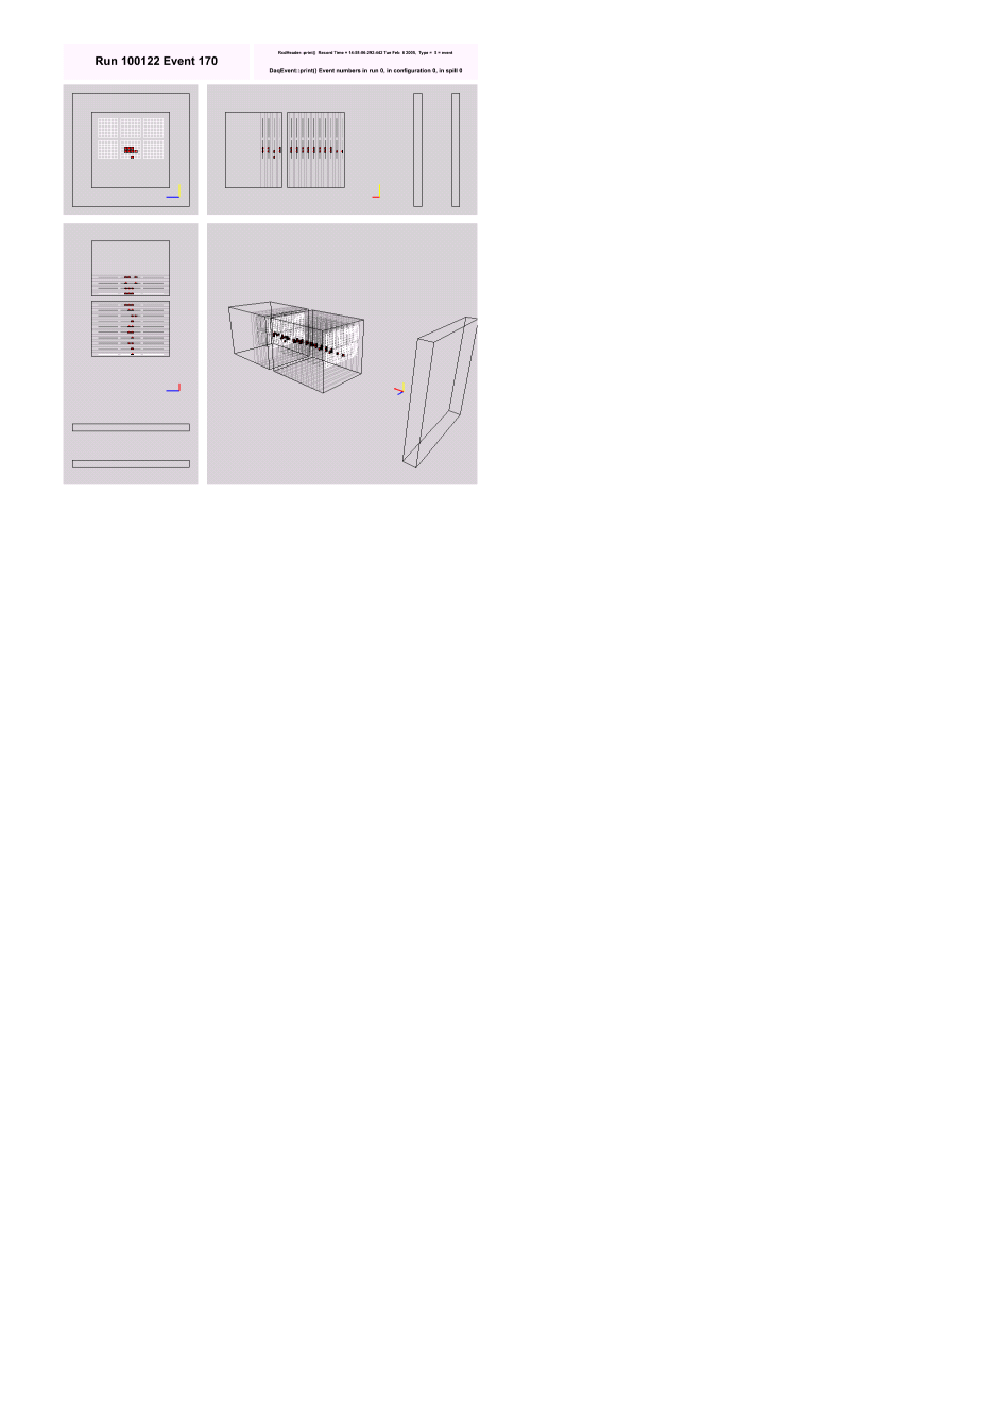

Figure 6 shows the detector response to incident electrons with energy of 1, 2 and 3 GeV in terms of total number of cells above 0.5 mip threshold (left column) or total energy deposited (right column). The upper and lower row of plots correspond to prototype being at and angle with respect to beam direction, respectively. The prototype is not long enough to contain the showers and therefore its response shows poor linearity. Better containment is achieved at as can be seen also in Figure 7 which depicts the longitudinal development of the showers. The odd/even layer response asymmetry due to construction is observed.
 |
 |
 |
 |
 |
 |
Several position scans along the wafers and their borders were performed to investigate the response homogeneity. The plots at Figure 8 illustrate the results from a typical scan at the corners of four neighboring wafers. Figure 8(a) is the scatter plot of the event energy recorded, expressed in color coded scale, versus the impact point coordinates of the electron beam. Each wafer has a border of about 1 mm of non-active zone. The drop of signal along the borders is clearly seen. Figures 8(b) and (c) are the corresponding projections along the horizontal and the vertical direction. The alternate layers of the detector are staggered horizontally, but not vertically. Therefore, as observed, the dip is shallower and wider in the former case, and deeper and narrower in the latter one.
 |
 |
 |
| (a) | (b) | (c) |
Similar studies are under way for general debugging and understanding of the system before the next testbeam phase.
IV SUMMARY
We discussed the CALICE Si/W ECAL prototype and some first results from a recent testbeam. A prototype with 14 layers and depth of 7.2 at normal incidence, having in total 3024 channels of 1 1 cm2 Si pads, was tested at DESY with beam. The testbeam progressed very smoothly and a lot of data were collected that will allow us to perform a thorough debugging of the system. Analysis studies are in progress in order to understand the detector before the next round of testbeams. The next testbeam is planned for summer 2005 with the prototype structure equipped with more layers and channels.
Acknowledgements.
On behalf of the ECAL group the author wish to thank the CALICE-HCAL group at DESY for their support and contribution to the success of the testbeam.References
- (1) CALICE Collaboration, http://polywww.in2p3.fr/flc/calice.html
- (2) talks on calorimetry, these proceedings.
- (3) G. Mavromanolakis, D. Ward, “Comparisons of hadronic shower packages”, Proceedings of the International Conference on Linear Colliders, LCWS 2004, Paris, 19-23 April 2004, arXiv:physics/0409040.