Bi-Analyte Surface Enhanced Raman Scattering for unambiguous evidence of single molecule detection
Abstract
A method is proposed to pin down an unambiguous proof for single molecule surface enhanced Raman spectroscopy (SERS). The simultaneous use of two analyte molecules enables a clear confirmation of the single (or few) molecule nature of the signals. This method eliminates most of the uncertainties associated with low dye concentrations in previous experiments. It further shows that single-molecule signals are very common in SERS, both in liquids and on dry substrates.
pacs
78.67.-n, 78.20.Bh, 78.67.Bf, 73.20.MfI Introduction
Surface Enhanced Raman Scattering (SERS) was discovered in the 1970’s and was immediately the subject of intense research up to the 1980’s. The possibility of observing Raman signals, which are normally very weak, with enhancements of the order of had interesting applications, in particular in analytical chemistry. However, the lack of reproducibility, of adequate SERS substrates, and of understanding of the SERS enhancement mechanisms hampered progress. An in-depth review of these early studies can be found in Ref. Moskovits85. Two independent reports Nie97; Kneipp97 in 1997 of the observation of single molecule emission under SERS conditions triggered a renewed interest in this technique. It meant that enhancement factors might be as large as to compensate for the intrinsically small Raman cross section, and that SERS probes could potentially replace fluorescent ones in several applications; for example in biology. Some advantages of SERS over fluorescence are its higher spectral specificity and the possibility of using infrared excitation (important in living tissues for example). Studies of single-molecule SERS (SM-SERS) could also lead to a better understanding of the SERS effect itself. However, SM-SERS has encountered many of the same problems: fluctuations, non-reproducibility, and a lack of understanding of the origin of the sites suitable for SM-SERS. Another major problem is the fact that single-molecule emission has so far been inferred from indirect evidence, casting doubts over the reality of SM-SERS in the first place and giving rise to alternative explanations. This is perfectly summarized in the title of a discussion Chimia99 by several of the authors of the first reports of SM-SERS Nie97; Kneipp97: ”Single Molecule Raman Spectroscopy: Fact or Fiction?”. They stress that the inference of SM-SERS from their results is not straightforward, and that although many evidence support it, it does not constitute a proof in the absolute sense. In this report, we propose and apply a technique, Bi-Analyte SERS (BiASERS) which provides a much more direct evidence for SM-SERS. The principle is to carry out SERS measurements on a mixture of two different analytes (dyes). This alternative presents several advantages over previous techniques: firstly, it does not rely on ultra-low concentrations of analytes and on the observation of rare events (such as that of a ‘hot’ particle Nie97). Secondly, the simplicity of the experiment and its interpretation makes it a more direct and convincing evidence of SM-SERS. Finally, it can be applied to most SERS substrates (dry or colloidal) to test for the presence of SM-SERS. Using BiASERS, we show that SM-SERS is, in fact, quite common and gives information on the nature of the active sites, the so-called ‘hot spots’.
II Previous work
In order to put this work in context, we first review the various evidence for SM-SERS. By far, the largest group of evidence comes from studies of SERS on dry silver colloidal particles Nie97; Michaels99; Xu99; Weiss01. Silver colloids mixed with dyes are immobilized after drying or spin-coated on a suitable substrate. The dye concentration is chosen so that there are a small number of dyes per colloids. SERS signals from individual colloids or clusters are then collected and analyzed. The single molecule nature of these signals is inferred mainly from two characteristics:
- •
Firstly, the low dye concentration suggests that, statistically speaking, there cannot be much more than one dye per colloid Nie97; Michaels99; Xu99. However, it was acknowledged early that these concentration estimates do not necessarily provide a satisfactory proof Nie97; Chimia99. They are indeed prone to large errors: colloid concentration is usually estimated from a knowledge of Ag mass used during preparation Lee82 and an estimate of their average size (or volume). Any non-reacted Ag, or the presence of a small number of much-larger-than-average particles could lead to an overestimation of colloid concentration and therefore an underestimate of dye:colloid ratio. Moreover, dye concentrations below 1 nM require particular care to avoid contamination, wall adsorption, and dilution errors Hildebrandt84. A further source of uncertainty is the fact that only a small proportion of colloid aggregates (so-called ‘hot’ particles) seem to give rise to SERS signals. This means that there is a possibility that those active aggregates are the ones who have adsorbed a larger than average number of dyes because, for example, they present a larger surface area, or are composed of many individual colloids.
- •
Secondly, these SERS signals exhibit strong fluctuations, both in intensity and spectral shape, along with blinking (alternating on/off periods). These are usually considered a characteristic of SM-emission Michaels99; Weiss01; Maruyama04. However, such fluctuations are often observed in SERS, even in conditions of high dye concentration, where the signal is not believed to originate from single molecules. They were also observed in the SERS spectra of residual amorphous carbon on the colloids, and attributed to ongoing photo-induced chemical reactions on the surface, such as photo-oxidation Kudelski00; LeRuCPL04. Blinking can be observed in SM fluorescence as a result of photo-bleaching. However, fluorescence-induced photo-bleaching requires exciting the molecule to its first excited state. It is believed that photo-bleaching is minimized under SERS conditions because of very fast energy transfer to the metal. Other photo-induced effects in SERS can be desorption, molecule dissociation, or modification of the silver configuration itself (through photo-oxidation for example). These can be induced directly by light or indirectly by photo-induced thermal heating of the metal substrate LeRuFD05. The difference with photo-bleaching is that these effects are cooperative, i.e. they are likely to affect all molecules at the same time (for example when the metal reaches a critical temperature). Therefore, blinking in SERS cannot be invoked as an unambiguous proof of single molecule emission.
Other indirect evidence were put forward, for example by studying the polarization property of the SERS signal Nie97, but they rely on a theoretical understanding of the details of the SERS mechanism, which is still open to debate. In particular, the polarization selection rules of a molecule in close proximity to surface plasmons can be severely modified with respect to the bare Raman tensor polarization selection rules; an effect which has a longstanding history in SERS and related techniques Moskovits01.
Another type of SM-SERS study was carried out in liquid colloidal solution Kneipp97. The evidence for SM detection was based mainly on the ultra-low dye concentration (33 fM). It was further supported by the observation of a Poissonian distribution of the SERS intensities. However, the main problem with this type of experiments is that the small number of events (100) is not significant enough to rule out other distributions. For example, a sample of 100 intensities following a log-normal distribution often exhibits oscillations similar to that shown in Ref. Kneipp97. Moreover, as pointed out in Ref. Kneipp97, such a Poissonian distribution would require a very large uniformity in the SERS signals (or enhancements), which is not common in SERS experiments, and that nearly every single molecule in the scattering volume would be detected. As pointed out recently Moskovits02, this is in contradiction with the findings of the other original report of SM-SERS where only a small number of ‘hot’ particles gave rise to SM-SERS Nie97. The convolution problem of the enhancement factor and the dye concentration is very difficult to break in these approaches.
Despite the uncertainties, this body of evidence has led to the general acceptance that SM-SERS is a real phenomenon, in particular on dry substrates, even if no absolute proof was available. The consensus is that there are very few active particles () Nie97 capable of producing SM signals. In addition, there are on these particles only a few site capable of providing sufficiently large enhancement for SM-SERS. These sites are typically at the junction between two closely spaced colloids Xu99; Michaels00, and corresponds to only 0.01 – 0.1% of the surface area of a dimer. Such an interpretation is supported by theoretical studies Corni02; Xu03. One therefore easily sees the conundrum of SM-SERS: how can we place a molecule at these rare active sites and be sure that the signal comes from this molecule only? All approaches so far have relied on low dye concentrations, which more or less ensures that only a few dyes are observed at a time. However, the probability of having a molecule at an active site then becomes very small, leading to unreliable statistics, and making the SM interpretation of the signals very difficult.
Our approach is exactly the opposite. We use a relatively high concentration of dyes to ensure that there is indeed at least one molecule at most active sites. In order to confirm the SM nature of the signal, we simply use a mixture of two dye molecules (BiASERS). Because of the large number of molecules, the SERS signal should in principle always be a mixture of these two dyes. The observation of a SERS signal of purely one type of dye (say Dye 1) is a clear evidence that it comes from a very small number of molecules. For example, if the signal originates from exactly 5 molecules, the probability of it being purely Dye 1 is only 1/32, going down to 1/1024 for 10 molecules. The main advantage of this method, in addition to its simplicity, is that it enables to probe every active sites and it does not rely on an accurate estimate of the dye:colloid ratio.

III Experimental Details
Our citrate-reduced silver colloid solutions were prepared using standard procedures Lee82. Rhodamine 6G (RH6G) was used as purchased, while the benzotriazole dye (BTZ) was synthesized following the procedure described in Ref. Graham98 (dye # 2 of this reference). RH6G has been widely used in the past for SERS and SM-SERS. BTZ was designed specifically for SERS studies. It is believed to adsorb strongly (through covalent bonding) to silver Graham98. Under standard conditions, the two dyes show strong SERS spectra, which are easily distinguishable, as shown in Fig. 1. Of particular interest are non-overlapping peaks that allow unequivocal identification of the different dye species. Raman spectra were acquired using a Jobin Yvon Labram confocal Raman spectrometer, with a immersion objective index-matched to water or a objective matched to air for dry substrates. Excitation was carried out with a 633 nm HeNe laser (2 mW at the sample for liquids, 0.2 mW for the Raman map on dry substrates). Solution K was prepared by mixing 0.5 mL of colloidal solution with 0.5 mL of a 20 mM KCl solution. The main effect of KCl is to reduce the Coulombic repulsion between the colloidal particles. Using a 35 mM KCl solution triggers aggregation and collapse of the colloids. SERS signals are usually very small at low KCl concentrations ( mM), because they originate from single, non-interacting colloids. Using 20 mM KCl (10 mM final concentration in solution), the colloidal solution remains stable for several weeks. However, the Coulombic repulsion is sufficiently reduced to allow colloids to form aggregates. The stability of these samples indicate that these aggregates must be small, most likely pairs of colloids. Such interactions are necessary to observe large SERS signals. All colloidal solutions were then prepared by adding a small volume of a dye solution (BTZ, RH6G, or a mixture of both) to solution K. We used final dye concentration in the range 20 to 100 nM. All colloid solutions were left to rest for several hours or more before measurements.
For experiments on dry colloids, a 40 L drop of such a colloid+dye solution was deposited and left for one minute on a positively-charged Polylysine-coated glass slide. Because of the negative charge on the colloids, clusters close to the Polylysine surface are immobilized through electrostatic interactions Nie97. The slide was then rinsed with distilled water, leaving a small density of immobilized clusters for SERS measurements.
IV Experimental results
We first focus on a colloidal solution prepared with a mixture of equal concentration (100 nM for each dye) of RH6G and BTZ (solution C). Control samples with 100 nM of BTZ only (solution A) or RH6G only (solution B) were also measured for comparison. We estimate that this corresponds to at least 1200 dyes of each type per colloids, much more than in any previous SM-SERS studies. We also estimate a surface density of around 0.1 dye of each type per nm2, which indicates that there should not be any steric hinderance for adsorption (typical surface area of an adsorbed dye is 1 nm2). There is also on average between 1 and 4 colloids (or between 0.5 and 2 pairs) at any given time in the scattering volume. A series of 1000 SERS spectra with 0.2 s integration time were collected from each solution and analyzed. The results are summarized in Fig. 1. The average spectra of solution A and B show that RH6G and BTZ have clearly distinguishable SERS spectra. The RH6G spectrum is stronger due to its higher SERS cross-section under these conditions. Solution C shows a superposition of these two spectra, which is identical to the sum of the spectra from sol A and B, within the experimental errors. This strongly indicates that the two dyes do not interact with each other and adsorb on the colloids independently of each other, as expected from the low surface densities. We now focus on the analysis of the 1000 individual spectra obtained from solution C. Most spectra exhibit a good signal, indicating that interacting colloids are on average always present in the scattering volume. We observe fluctuations in intensity and spectral shape. These are attributed to constantly changing colloid configurations in the scattering volume because of the unavoidable Brownian motion, and are not necessarily a sign of SM-SERS. More interesting are the large fluctuations observed in the relative proportion of signal from each of the dyes. For example, in Fig. 1 (B) are shown two representative scans where the signals is composed of purely one or the other type of dye. This, we believe, shows unambiguously that the SERS signal is dominated by a very small number of molecules, and represents the simplest and most direct evidence for SM-SERS. We believe that this is a reliable experimental proof of an assumption which, although widely accepted in the literature as possible, is very difficult to demonstrate experimentally.

In addition, the average BiASERS spectrum and the 1000 spectra of solution C were fitted as a weighted superposition of the average spectra of BTZ and RH6G (obtained from solution A and B). The fit for the average spectrum leads to a 1:1 superposition of the average RH6G-only and BTZ-only spectra, and we assume this corresponds to a 1:1 dye ratio. The weighted fits therefore enable to extract a single percentage characterizing the proportion of the total signal in each spectrum originating from BTZ. If the enhancement mechanism was uniform, this percentage would correspond to the proportion of molecules producing the observed BTZ signal. For example, a fit of the average spectrum gives (1:1 dye ratio) even if the integrated intensity is dominated by RH6G peaks because of its higher cross section. This procedure, accordingly, acts as a normalization condition for the different cross sections of the dyes. The statistics of is illustrated in Fig. 2 in two forms: (A) Histograms of the probability distribution of , and (B) correlation plot of with SERS intensity. represents the proportion of BTZ molecules if the signals from each molecule was perfectly uniform and equal to the average signal. Because there are in excess of 1000 molecules of each type on each colloid, one always expects that , with negligible fluctuations around this value. Fig. 1 (B) and Fig. 2 (A) show that this is clearly not the case, with several events where or . The most likely explanation is that, at least for these events, the signal is dominated by a few molecules, those situated at the position of highest enhancements. A simple description is to assume that the observed signals originate only from a given fixed (small) area of large enhancements , a ‘hot-spot’. The number of molecules of each type in this area then follows a Poissonian distribution with the same average (because dyes are in 1:1 ratio). One can then easily derive the probability distribution of for a given . As shown in Fig. 2 (A), a value of fits well to our experimental results. The statistics of therefore suggests that most clusters exhibit a SERS enhancement that is sufficient for single molecule detection within our integration time of 0.2 s. Note that we are not strictly speaking observing SM-SERS here since the signal originates on average from around 4 molecules, but a signal only 4 times smaller is still well within the detection limit. Reducing the dye concentration would only result in many events where no dye are present in the hot-spot, making the statistical analysis more difficult, like in previous studies. Finally, for larger values of , the distribution of should be increasingly peaked around 0.5, and the probability of extreme events ( or ) should decrease drastically. We clearly observe this effect experimentally as shown in Fig. 2 (A) in the histogram for a solution identical to C, but with doubled concentration for each dye (200 nM). It is clear that the occurrence of extreme events has virtually disappeared. This simple model clearly accounts for the few-molecule nature of the signals. Moreover, assuming that the signals originate from a pair of colloids and comparing the value of to the average number of molecules on this pair, we can estimate the hot-spot area to be only of the total surface area. Such an estimate is much easier with BiASERS than with conventional low dye concentration methods. However, this model assumes that the characteristics of the hot-spots are the same for each event, and that every molecule in the hot-spot contributes equally to the signal, which are clearly rough approximations. For example, Fig. 2 (B) presents a clear indication that the nature of the hot-spots changes from one event to the other. If large SERS events corresponded simply to instances where more molecules are present in the hot-spot area, then these events should be more likely to be of a ‘mixed’ type, while low intensity events should exhibit more of the extreme ‘pure dye’ type. Our results suggest the opposite: ‘pure’ events only occur for high intensity events. This suggests a strong correlation between the size of a hot-spot and its enhancement. Such a correlation is actually predicted by theoretical studies of the SERS electromagnetic enhancement, where high enhancement are correlated with strong localization. This is another characteristic of the effect that is very difficult to prove experimentally under normal situations.
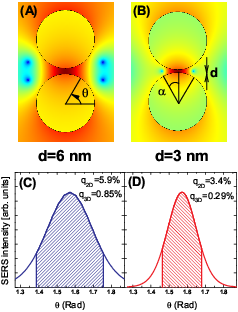
It is interesting to relate these results to the standard example of a hot-spot formed by a pair of closely-spaced colloids. In this case, the main parameter is the separation between the colloids. As decreases, the SERS enhancement increases and becomes more localized in between the two colloids. This is illustrated in Fig. 3 using a simple electromagnetic model of colloid interaction. The plots were obtained using a 2D electrostatics approximation and represent the SERS enhancement factors, approximated by the fourth power of the field amplitude enhancement, . The two cylinders have a diameter of 50 nm and are separated by or nm. The optical properties of Ag were used for the colloids, and the environment is water (). Excitation is polarized along the dimer axis at a wavelength nm, i.e. red-shifted compared to the single and coupled plasmon resonances of the system. This simple model is obviously over-simplified, but it clearly illustrates the point we want to make: the region of highest enhancement (hot-spot) is increasingly localized for the smallest separations. In Figs. 3 (b) and (c) we show the normalized SERS enhancements on the surface of one colloid as a function of angular position, ( corresponds to the dimer axis). For each plot, the colored area corresponds to of the total area and is a good representation of the hot-spot (defined here as the region from which of the total SERS intensity originates). This corresponds to an angle interval from which we derive a percentage . is the proportion of the cylinder circumference covered by the hot-spot. To extend this result to 3D, we assume that the hot-spot corresponds to a solid angle defined by a semi-angle : . The hot-spot therefore covers a proportion of the total surface area. Despite the simplicity of this model, the value of obtained for nm is of the same order as that inferred from the histogram of Fig. 2 (B). It is also apparent that the hot-spot area is correlated with the colloid separation and therefore with the total SERS enhancements. This is in agreement with the correlation observed in the scatter plot of Fig. 2 (B).
Finally, in order to link this study to previous works, mostly carried out on dry colloidal particles, we show in Fig. 4 the results of such an experiment using BiASERS. There are on average 240 dyes of each type per colloid (dye concentration is 20 nM before drying), and therefore more than 500 molecules of each type per cluster, depending on their size. The Raman map in Fig. 4 (D) suggests that all clusters are active at these concentrations. Moreover, as illustrated in Fig. 4 (A-C), we can again observe signals composed purely of the SERS spectrum of one type of dye, despite the large number of molecules of both types. This is again a clear indication that SM emission is the norm, rather than the exception. Such a conclusion could only be inferred statistically in previous low-concentration studies because of the small probability of finding a molecule at a hot-spot. However, we insist that the rarity of these events was not due to the small number of hot-spots or ‘hot-particles’, but to the small probability of having a molecule there. In other words, most particles are ‘hot’ provided that a probe molecule is present at the right position. This is easily achievable in BiASERS (due to the large concentration of dyes) whilst keeping the ability to distinguish few-molecules from many-molecules signals.

V Conclusion
In closing, we have proposed and applied a new method to evidence SM-SERS, using a combination of two SERS probes. Using such a mixture of two distinguishable probes circumvents many problems associated with low-concentration studies. It enables to study most SM-SERS events, instead of a very small number with unreliable statistics. This technique is simple, unambiguous, and of wide applicability to various SERS substrates. Our results readily demonstrate that single-molecule SERS is common, even in stable colloidal solutions. It could further be used to study a number of outstanding issues in SERS, which we have only briefly outlined here. For example, it could shed new light into the nature of SERS hot-spots themselves, and can also be applied to determine the SERS cross-sections and enhancements with more accuracy . All this is necessary for a better understanding of SM-SERS. This will not, however, solve another major challenge of SM-SERS in the reverse problem, namely : how we can force a single available molecule to go to the right position in order to observe its SERS signal? This will be necessary for some of the most exciting proposed applications of SM-SERS, such as single-DNA-molecule sequencing.
References
- (1) M. Moskovits, Rev. Mod. Phys. 57, 783 (1985).
- (2) S. Nie and S. R. Emory, Science 275, 1102 (1997).
- (3) K. Kneipp, Y. Wang,H. Kneipp, L. T. Perelman, I. Itzkan, R. R. Dasari, and M. S. Feld, Phys. Rev. Lett. 78, 1667 (1997).
- (4) S. R. Emory, S. Nie, K. Kneipp, and G. R. Harrison, Chimia 53, 35 (1999).
- (5) A. M. Michaels, M. Nirmal, and L. E. Brus, J. Am. Chem. Soc. 121, 9932 (1999).
- (6) H. Xu, E. J. Bjerneld, M. Käll, and L. Börjesson, Phys. Rev. Lett. 83, 4357 (1999).
- (7) A. Weiss and G. Haran, J. Phys. Chem. B 105, 12348 (2001).
- (8) P.C. Lee and D. Meisel, J. Phys. Chem. 86, 3391 (1982).
- (9) P. Hildebrandt and M. Stockburger, J. Phys. Chem. 88, 5935 (1984).
- (10) Y. Maruyama, M. Ishikawa, and M. Futamata, J. Phys. Chem. B 108, 673 (2004).
- (11) A. Kudelski and B. Pettinger, Chem. Phys. Lett. 321, 356 (2000).
- (12) E. C. Le Ru and P. G. Etchegoin, Chem. Phys. Lett. 396, 393 (2004).
- (13) E. C. Le Ru and P. G. Etchegoin, Faraday Discussions 132, in press.
- (14) M. Moskovits, J. Chem. Phys. 77, 4408 (1982).
- (15) M. Moskovits, L.-L. Tay, J. Yang, and T. Haslett, Topics Appl. Phys. 82 215 (2002).
- (16) , A. M. Michaels, J. Jiang, and L. Brus, J. Phys. Chem. B 104, 11965 (2000).
- (17) S. Corni and J. Tomasi, J. Chem. Phys. 116, 1156 (2002).
- (18) H. Xu and M. Käll, Chem. Phys. Chem. 4, 1001 (2003).
- (19) D. Graham, C. McLaughlin, G. McAnally, J. C. Jones, P. C. White, and W. E. Smith, Chem. Commun., 1187 (1998).