Relaxation of atomic polarization in paraffin-coated cesium vapor cells
Abstract
The relaxation of atomic polarization in buffer-gas-free, paraffin-coated cesium vapor cells is studied using a variation on Franzen’s technique of “relaxation in the dark” [Franzen, Phys. Rev. 115, 850 (1959)]. In the present experiment, narrow-band, circularly polarized pump light, resonant with the Cs D2 transition, orients atoms along a longitudinal magnetic field, and time-dependent optical rotation of linearly polarized probe light is measured to determine the relaxation rates of the atomic orientation of a particular hyperfine level. The change in relaxation rates during light-induced atomic desorption (LIAD) is studied. No significant change in the spin relaxation rate during LIAD is found beyond that expected from the faster rate of spin-exchange collisions due to the increase in Cs density.
pacs
PACS. 32.80.Bx, 34.50.Dy, 79.20.LaI Introduction
Coating the walls of an alkali-metal vapor cell with paraffin wax reduces the relaxation rate of atomic polarization by up to four orders of magnitude Robinson; Bouchiat; Alexandrov1; Alexandrov2. Long-lived atomic polarization (relaxation times of has been observed) enables extremely sensitive measurements of magnetic fields Claude; Alexandrov1; Alexandrov2; NMOR; Alexandrov3, enhances nonlinear optical effects at low light powers (see the review NMOEreview and references therein), and may make possible precision tests of fundamental symmetries UW_edm; Yashchuk; Kimball. Paraffin-coated cells have drawn attention in the study of light propagation dynamics SlowLight; FastLight, for the generation of spin-squeezed states Bigelow, and the creation and study of high-rank polarization moments HexaDecapole. There has also been renewed interest in the application of paraffin-coated cells in miniaturized atomic clocks NISTpaper. In spite of their wide and varied application and several detailed studies of their spin-relaxation properties BouchiatPhD; Bouchiat; Gibbs; Liberman; BalabasRID; Vanier; AleksandrovK, there is still much to learn about the mechanisms of spin relaxation in paraffin-coated cells.
In this study, we use a variation on Franzen’s classic technique of “relaxation in the dark” FranzenRID to elucidate the mechanisms for spin-relaxation of cesium atoms in buffer-gas-free, paraffin-coated cells (prepared in the manner described in Ref. ourLIAD). A circularly polarized laser beam (the pump beam), tuned to resonance with one of the hyperfine components of the D2 transition, propagates along the direction of an applied magnetic field () and polarizes the Cs atoms. The pump beam is abruptly blocked by a shutter and the decay of the atomic polarization is monitored by measuring optical rotation of a weak, linearly polarized probe beam (propagating collinearly with the pump beam).
A key challenge in the interpretation of the measurements is to determine the physical meaning of the optical signal, in particular how it relates to the atomic polarization in the cell. In the usual implementation of Franzen’s technique, in which transmission of a circularly polarized probe is measured to determine the relaxation of atomic polarization, the observed signal depends on two quantities Bouchiat; HapperReview: the longitudinal electronic polarization and the population difference between the two ground-state hyperfine levels, proportional to (here represents the electron spin and represents the nuclear spin). The relation of the optical signal to the relaxation of and depends on the spectral properties and polarization of the probe light Bouchiat.
Furthermore, the quantities and can relax with several different time constants depending on the relaxation mechanisms (e.g., spin-exchange collisions between Cs atoms, electron-randomization collisions with the cell walls, relaxation due to exchange of atoms between a metal sample in the stem of the cell and the vapor phase in the volume of the cell – known as the “reservoir effect” Bouchiat). Consequently, when narrow-band laser light is used, the observed signal in Franzen’s method relaxes with multiple rates that can be difficult to distinguish.
In contrast (as discussed in Sec. II.1), by observing optical rotation of a linearly polarized probe beam as we do in the present experiment, under the magnetic field conditions of our experiments (where for most measurements ) the observed signal is well described with only two exponentials. Furthermore, the amplitudes of the rotation associated with the two exponentials turn out to be opposite in sign, allowing a clear distinction between the associated rates. We analyze our experimental results using the concepts of atomic polarization moments (see, for example, Refs. OkunevichBook; NMOEreview; OurBook; Stenholm; Blum), and find that under appropriate conditions the optical signal is sensitive only to the rank-one multipole moment (orientation).
We have used this technique of relaxation in the dark observed via optical rotation to study the change in the relaxation rates of atomic polarization when a paraffin-coated vapor cell is exposed to non-resonant light that causes desorption of alkali atoms from the paraffin coating (light-induced atomic desorption, LIAD, see Ref. ourLIAD and references therein). LIAD is of interest as a method for rapid control of the vapor density in paraffin-coated cells; LIAD can also be used as a technique for the study of wall coatings. We find no significant change in spin-relaxation rates in the cell during LIAD beyond that expected from the faster rate of spin-exchange collisions due to the increase in Cs vapor density. This indicates that LIAD does not significantly affect the relaxation properties of the coating. In contrast, when the alkali density is increased by heating the cell, our work shows evidence of a significant increase in relaxation caused by electron-randomization collisions.
II Relaxation in the dark observed via optical rotation
II.1 Principle of measurement technique
When optical pumping with circularly polarized laser light is performed, in general the populations of the ground state hyperfine levels are altered and the atomic medium acquires both orientation and alignment along the direction of light propagation (see, for example, Refs. NMOEreview; OurBook). The orientation and alignment of a collection of atoms can be characterized using the density matrix formalism (as described, for example, in Refs. NMOEreview; OurBook; Stenholm; Blum; HapperReview – also see several recent articles focusing specifically on atomic polarization in paraffin-coated cells Okunevich1; Okunevich2; Okunevich3). Orientation corresponds to the rank irreducible tensor component of the density matrix and alignment corresponds to the rank component, while the population corresponds to the component. For a state with total angular momentum , the multipole moments are related to the usual Zeeman components of the density matrix (where refer to Zeeman sublevels) via the equation Omont; Varshalovich
| (1) |
where is the appropriate Clebsch-Gordan coefficient. Note that the atomic polarization moments may be of rank for a given hyperfine level.
If circularly polarized pump light propagates in the direction (chosen here to be the quantization axis), alkali atoms can acquire nonzero polarization moments with in each hyperfine level. In our experiments, the creation of moments with is further suppressed by the application of a longitudinal magnetic field, which averages out any transverse polarization (to which the experiment might be sensitive due to misalignment of the pump and probe beams). While moments higher than can be created by the pump light, because the light power in the probe beam is very low, we can safely assume we are only probing the lowest rank polarization moments, (those for which the optical rotation is independent of probe light power HexaDecapole). Therefore in our analysis we consider only the moments (population), (orientation along ), and (alignment along ) in each hyperfine level.
We assume that three different types of relaxation processes for ground state atomic polarization are possible in the paraffin-coated cell: (1) electron-randomization collisions with the paraffin-coated cell wall or perhaps gaseous impurities, (2) spin-exchange collisions between the Cs atoms, and (3) a process, such as the reservoir effect Bouchiat, which relaxes all polarization moments at the same rate (denoted as uniform relaxation):
| (2) | ||||
Estimates and experimental evidence (discussed in Sec. II.3.2) show that relaxation due to magnetic field gradients can be neglected. The probe light power used (3-5 ) is sufficiently low that relaxation due to optical pumping by the probe light can be neglected as well (see Sec. II.3.2).
Electron-randomization collisions completely randomize the polarization of the valence electron, but the nuclear spin of the Cs atom is altered only due to the fact that hyperfine interactions recouple the electron spin to the nuclear spin after the collision. Thus the total atomic polarization takes many [about for ] collisions to relax (this is known as the nuclear slow-down effect). Taking these effects into account, for a rate of electron-randomization collisions, the equation describing the relaxation of atomic polarization moments is (for ) OkunevichBook
| (3) |
where takes on the value of the total angular momentum of each ground state hyperfine level, is the polarization-moment rank of the nucleus, and
| (4) | ||||
The terms in curly brackets in Eq. (4) are nine- symbols Varshalovich.
Spin-exchange collisions are electron-randomization collisions among the alkali atoms. A key feature of spin-exchange collisions is that because of angular momentum conservation, the overall orientation of the alkali vapor must be preserved. This leads to an extra term [] on the right-hand side of the equation (3) describing the relaxation of atomic polarization due to electron-randomizing collisions OkunevichBook [again, as in Eq. (3), ]:
| (5) | ||||
where the spin-exchange rate is given by , is the number density of Cs atoms, is the effective spin-exchange cross-section, and is the average relative velocity between Cs atoms. Equation (5) is the linearized version of the equations describing spin exchange, and is valid when the orientation is sufficiently small. Experimental evidence indicates that such an approximation is reasonable for our experiment (see Sec. II.3.2).
Finally, the uniform relaxation of atomic polarization with the rate is described by the equation
| (6) |


Here we note that according to Eqs. (3) and (5), to determine the time dependence of a particular polarization moment for a given hyperfine level , one must solve two coupled linear differential equations (if both levels support the rank polarization moment being considered). Thus for alkali atoms, in order to find the time dependence of a signal depending on the population, orientation, and alignment in a given hyperfine level, it is necessary to employ three sets of two coupled linear differential equations — a total of six. In general, a system of first-order differential equations yields up to possible independent solutions
11endnote: 1 This can be seen from the fact that one can solve such a system of equations using matrix methods where the coefficients form a matrix, which can have at most eigenvalues and eigenvectors. These eigenvalues map directly to the solutions. However, it should be noted that some of these solutions may be the same, leading to fewer than independent time constants..
In the traditional Franzen’s method of relaxation in the dark, transmission of circularly polarized probe light is measured. The absorption of circularly polarized light depends on all three ground state polarization moments , , and (intuitively this must be the case, since circularly polarized light changes all three moments during the optical pumping process). This leads to a time-dependent optical signal involving many time constants.
However, if one measures optical rotation of narrow-band, linearly polarized probe light (as in the scheme to measure relaxation in the dark employed in the present experiment), at sufficiently low magnetic fields, the signal is primarily sensitive only to the orientation in the probed hyperfine level. Thus in the present experiment, there appear only two time constants in the optical signal.
Orientation produces optical rotation through a different physical mechanism than population and alignment. Orientation in the probed hyperfine level creates a difference in the amplitudes of the real parts of the complex indices of refraction for left- and right-circularly polarized light (upper plot of Fig. 1). This causes optical rotation due to the difference in the phase velocities of the circular components of the linearly polarized probe light, as illustrated in the lower plot of Fig. 1. It is crucial to note that optical rotation caused by longitudinal orientation appears even in the absence of a magnetic field (and, in fact, is to first order independent of ).
On the other hand, in the absence of orientation, optical rotation related to the or polarization moments (population and alignment) appears only when a nonzero magnetic field is present. The magnetic field splits the Zeeman sublevels, producing a difference in the resonance frequencies of the real parts of the complex indices of refraction for left- and right-circularly polarized light (Fig. 2). This mechanism for optical rotation of linearly-polarized light (whose frequency is near-resonant with an atomic transition) is known as the Macaluso-Corbino effect (see the review NMOEreview). For small magnetic fields, the amplitude of the optical rotation signal due to the Macaluso-Corbino effect depends linearly on . This distinction, as well as the difference in optical rotation spectra (see Figs. 1 and 2), allows discrimination between the signal caused by orientation and that caused by the Macaluso-Corbino effect.
Here it should be noted that because cesium has nonzero nuclear spin, mixing of different hyperfine components [with the same value but different ] in the upper state of the transition adds an important contribution to optical rotation due to the Macaluso-Corbino effect Khriplovich; TelegdiAndWeis; NMOEreview. The rotation due to this wavefunction-mixing effect also scales linearly with in the low-field regime, but has a different dependence on light detuning. Nonetheless, because the antisymmetric-with-detuning contributions of the different hyperfine components are unresolved for due to Doppler broadening, the overall spectrum of time-dependent Macaluso-Corbino rotation due to changes in population and alignment turns out to be quite similar to that shown in Fig. 2 TelegdiAndWeis.
We can estimate the contribution of Macaluso-Corbino rotation to the time-dependent optical rotation signal measured in our experiment based on the amplitude of linear Faraday rotation that is expected. At the typical laser detuning and magnetic fields at which we work (), taking into account the efficiency of optical pumping, we expect a contribution of only a few mrad to the time-dependent optical rotation amplitudes TelegdiAndWeis. Compared to the measured amplitudes of time-dependent optical rotation due to changes in orientation (20-80 mrad under usual conditions), this is a small correction (on the order of the statistical noise in our measurements). This is verified by measuring the dependence of the amplitudes as a function of magnetic field (see Sec. II.3.2) and laser detuning (see Sec. II.3.3). Note, however, that the contribution of the Macaluso-Corbino effect to time-dependent rotation becomes important at higher magnetic fields.
Based on the above considerations, we assume that the time-dependent optical rotation signal is due primarily to the relaxation of atomic orientation along . In our experiments, the pump and probe light beams’ frequencies are tuned to resonance with the hyperfine component of the D2 transition in Cs. Therefore the optical rotation signal in our experiments is proportional to , and so according to the described theory for the ground state hyperfine level of Cs (), is described by the following expression:
| (7) |
where and are, respectively, the faster and slower rates of relaxation given by
| (8) |
and are the respective amplitudes of the two exponentials, and is the dc rotation caused by the linear Faraday effect. Equation (7) is used to fit the obtained data to extract the relaxation rates.
We can investigate several limits of the equations describing relaxation of atomic orientation when various relaxation processes are not present. According to Eq. (8), if then the fast and slow rates are given by:
| (9) | ||||
| (10) |
Since , this means that if , then one expects the fast and slow rates to extrapolate to the same value for zero Cs density. If , Eq. (8) yields for the fast and slow rates:
| (11) | ||||
| (12) |
As we discuss in Sec. III, analysis of our experimental results yields a nonzero value for , indicating that relaxation due to electron-randomization collisions is prominent in the paraffin-coated cells studied. This observation is consistent with other recent studies of relaxation in paraffin-coated cells HexaDecapole; NISTpaper.
II.2 Experimental Setup

The experimental apparatus for measuring spin relaxation is shown in Fig. 3. The pump and probe beams, resonant with the Cs D2 transition (), are derived from the same 852-nm diode laser (Newport Model 2010 External Cavity Tunable Diode Laser).

The frequency of the diode laser is controlled and monitored using the Dichroic Atomic Vapor Laser Locking (DAVLL) system (see Ref. ourDAVLL and references therein) illustrated in Fig. 4. In order to stabilize the laser frequency, a small portion of the laser light is split off from the main beam (light power ; beam diameter ) and directed into the DAVLL. The DAVLL system generates an electronic feedback signal that is used to control the frequency of the diode laser. Figure 5 shows the improvement in the frequency stability of the laser when the DAVLL system is employed. The DAVLL reduces the drift of the laser frequency to over the measurement time.

The main portion of the laser beam is split into a pump beam and a probe beam (Fig. 3). The typical light power of the pump beam is and the typical light power of the probe beam is , and their diameters are . The pump beam passes through a mechanical camera-iris type shutter (that opens and closes at a rate of 0.25 Hz), and then through a polarizing beam splitter followed by a quarter-wave plate with fast axis at 45∘ to the axis of linear polarization, which produces circular polarization. The normalized Stokes parameter describing the degree of circular polarization (, see, for example, Refs. Huard) is for the pump light. The light then passes through the paraffin-coated Cs cell, but is blocked by an iris before it can hit the polarimeter for the probe light (see below), thus avoiding saturation of the photodiodes.
The probe is linearly polarized by a polarizing beam splitter and then directed along the axis of the cell. After passing through the cell, the probe light enters a balanced polarimeter which measures its optical rotation. The polarimeter is fitted with an interference filter centered at 850 nm (with a bandwidth of 12 nm FWHM) to eliminate detection of scattered light from the Ar+ laser (used for experiments with LIAD, see below). We record both the sum () and the difference () of the photodiode signals from the polarimeter. The rotation angle is found according to:
| (13) |
The sum signal is a measure of light transmitted through the cell. By scanning the frequency of the laser light, the sum signal gives the absorption spectrum which can be fit to a sum of Voigt profiles – allowing one to calculate the vapor density of Cs in the cell.
The three paraffin-coated vapor cells studied in this work are cylindrical glass cells with dimensions listed in Table 1. Each cell has a single stem containing a droplet of Cs metal. The stems have circular openings of diameter , although the diameters of the openings vary from cell to cell by up to a factor of two. The size of the hole is chosen to be small enough that relaxation due to the “reservoir effect” Bouchiat; BouchiatPhD is small compared to other sources of relaxation. The cells are evacuated to a residual pressure of during manufacture and are nominally free of any buffer gas. Detailed information on the manufacture and properties of similar cells can be found in Ref. ourLIAD.
| Cell | diameter (cm) | length (cm) | mean free path (cm) |
| A | 6 | 3 | 3.4 |
| B | 6 | 3 | 3.4 |
| C | 2 | 2 | 1.5 |
A magnetic field directed along the axis of light propagation of up to is applied to the cell with a pair of Helmholtz coils. For an applied field of 1 G, the variation of the longitudinal and transverse components of the field over the volume of the cell were less than 3% of the magnitude of the leading field. The field variation was measured with a flux-gate magnetometer mounted on a translation stage movable in three dimensions, and the measurement was carried out at 1 G to accommodate the magnetic field range of the flux-gate magnetometer. We expect inhomogeneities of the magnetic field to either scale proportionally to the applied field (for example, if they are due to coil geometry) or be reduced at higher magnetic fields (for example, if they are due to a stray inhomogeneous magnetic field generated by some object in the laboratory). Thus we assume that the field homogeneity in our experiments was better than 3%.
The Ar+ laser (lasing on the line) is employed in the measurements of relaxation in the dark during LIAD. The laser beam is reflected from a vibrating mirror which serves to average most of the interference pattern in the laser light (speckle), and expanded using lenses in order to illuminate the entire cell. The intensity of light incident on the cell ranged from to .
II.3 Results and Discussion
II.3.1 Time-dependent optical rotation
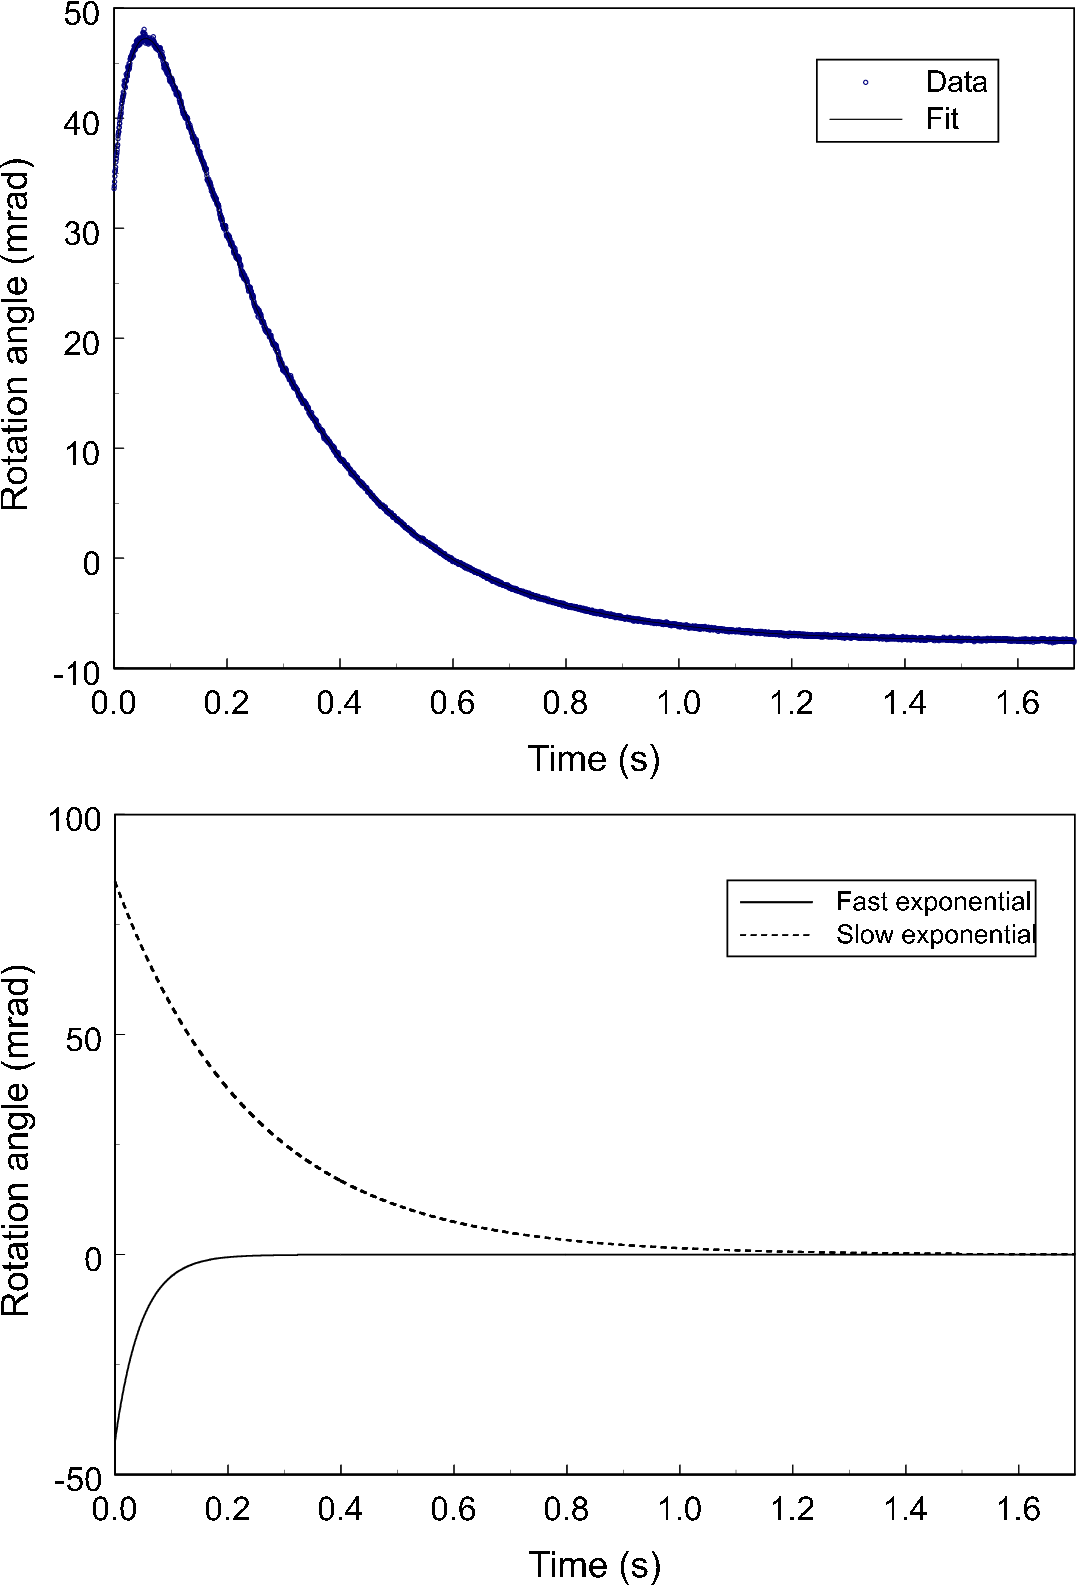
Typical data for time-dependent optical rotation is shown in Fig. 6. This is a measurement of the rotation angle according to Eq. (13) during the time when the circularly polarized pump light is blocked by the shutter. The data indicates two contributions to optical rotation with opposite signs that relax at different rates, allowing us to determine and according to Eq. (7).
It may at first glance seem strange that relaxation of atomic polarization can cause the magnitude of optical rotation (and by inference, the amount of orientation in the probed level) to first increase, and then decrease in time (Fig. 6). The optical pumping process creates orientation in both the and hyperfine levels, but the probe beam only measures the orientation in the level. Uniform relaxation, which is the dominant contribution to the slow relaxation rate [Eq. (8)], reduces the degree of orientation in both hyperfine levels. However, electron randomization and spin-exchange collisions (which dominate ) transfer orientation from one level to another, and thus can increase the orientation in the probed level.
II.3.2 Verification of assumptions in model describing optical rotation signal: light-power and magnetic-field dependences
In order to apply the analysis outlined in Sec. II.1, it is crucial to verify that the experiments were performed under conditions consistent with the assumptions of the model.

First, for the purposes of our measurements, it is important that the probe beam does not cause any optical pumping and thus does not affect the spin-relaxation rates we seek to measure. As the data in the upper plot of Fig. 7 demonstrates, the light power of the probe beam has no significant effect on the relaxation rates as long as the power is kept below . In all other data, the probe beam’s power is kept well below this level so that it measures the orientation of the Cs gas without disturbing the atomic polarization during the part of the experiment that is meant to be “dark.”
Second, the linearization of the spin-exchange equations [Eq. (5)] hinges on the assumption of small orientation, placing a limit on the power of the pump beam. At the same time, the pump beam must be sufficiently intense to produce a measurable signal. The lower plot of Fig. 7 shows that the relaxation rates are relatively independent of light power (within 10% of the mean value) over the range of powers measured, indicating that Eq. (5) is adequate for the description of our data. (The slight increase () in relaxation at high pump light powers may be a hint of increased spin relaxation due to violation of the small orientation condition.)
Third, it is essential that the field is large enough that the optical rotation signal is not affected by precession of atomic polarization in stray fields and that spin relaxation due to magnetic field gradients can be neglected (as discussed below). On the other hand, as was discussed in detail in Sec. II.1, the longitudinal magnetic field applied by the Helmholtz coils cannot be so large that the optical-rotation signal becomes sensitive to atomic polarization moments other than orientation (the moment). Time-dependent optical rotation due to other polarization moments comes about because of the Macaluso-Corbino effect (see the review NMOEreview). For example, since the laser light in our experiment is resonant with one particular ground-state hyperfine level, if optical pumping changes the population of that hyperfine level, then Macaluso-Corbino rotation changes amplitude in time due to the relaxation of the population (the moment) difference “in the dark.”
For most data a magnetic field of G was applied along the direction of light propagation. This field served as the leading magnetic field along which the atomic orientation was directed. The stray transverse field in the laboratory (due primarily to the Earth’s magnetic field and magnetic properties of the optical table) at the position of the vapor cell was measured to be and directed vertically. The data presented in Fig. 8 show that relaxation rates level off at fields above G, demonstrating that when the applied longitudinal field sufficiently exceeds the stray transverse magnetic field, the rates are field-independent (over this range). For smaller values of the applied magnetic field, the stray field significantly tilts the total magnetic field vector away from the light propagation direction. In this case precession of the oriented atoms tends to average out the net atomic polarization. This is the reason for the apparent increase in and for G.
Figure 9 shows the magnetic field dependence of the amplitudes of time-dependent optical rotation, and [see Eq. (7)]. We observe a dramatic change in the amplitudes for magnetic fields below G, due to the influence of the stray laboratory field discussed above. Above this value, there appears to be no linear dependence of the amplitudes on magnetic field over the studied range. This is a key test verifying that the optical rotation signal is dominated by the moment and relatively insensitive to the Macaluso-Corbino effect at the light detuning and magnetic field conditions at which we work.
The data shown in Figs. 8 and 9 also reveal how the relaxation rates and optical rotation signal amplitudes depend on the alignment of the leading magnetic field with the light propagation direction. For our experimental geometry (Fig. 3), we have verified that the light propagation directions of the pump and probe beams are collinear with the applied magnetic field to within 2∘. As the amplitude of the applied magnetic field is increased from zero, the field goes from nearly perpendicular to the light propagation direction to nearly parallel. From the data plotted in Figs. 8 and 9, we conclude that uncertainty in the alignment of the light beams and the magnetic field is a negligible contribution to the uncertainty in the determination of the relaxation rates and optical rotation amplitudes.


Under the conditions of our experiment, relaxation due to magnetic-field gradients is negligible. This can be seen as follows. The presence of gradients can be modelled by assuming there is a small transverse field in one half of the cell (the magnitude of the transverse gradient field is much smaller than the leading field, ). Between collisions with the cell wall, the Cs atoms’ orientation adiabatically follows the direction of the total magnetic field (). This is assured by the fact that where is the Larmor frequency ( is the gyromagnetic ratio), is the characteristic dimension of the vapor cell and is the atoms’ thermal velocity. Collisions with the wall break this adiabatic condition, as discussed in detail in Refs. HapperReview; OurBook, leading to spin relaxation described by OurBook:
| (14) |
where is the longitudinal spin-relaxation time. From Eq. (14) we find that the relaxation rate due to gradients is completely negligible under the conditions of this work ( at ). This conclusion is further substantiated by the data presented in Fig. 8, which demonstrates that there is no discernible field dependence of the relaxation rates over the range of fields at which we work.
II.3.3 Laser detuning dependence
The upper plot in Fig. 10 illustrates the laser-detuning dependence of the two relaxation rates ( and ) near the Doppler-broadened hyperfine component of the Cs D2 line. The relaxation rates are relatively independent of detuning (deviations from the average values are less than ). The small detuning dependence of the relaxation rates seen in the data shown in Fig. 10 may be due to a slight violation of the small orientation condition for linearized spin exchange assumed in the derivation of Eq. (5). Another possible cause of the slight detuning dependence is a small contribution to the rates from the Macaluso-Corbino effect.

The middle plot in Fig. 10 shows the dependence of the amplitudes of the optical rotation signals on laser detuning. The dispersive character of the spectrum of the amplitudes and seen in Fig. 10 is roughly what would be expected from optical rotation produced by an oriented sample of atoms — the dispersive function shown in Fig. 1 must be convolved with a Gaussian function to account for Doppler broadening and multiplied by a Voigt lineshape function to account for optical pumping (as well as taking into account the unresolved hyperfine structure). Optical rotation related to the Macaluso-Corbino effect would have a mostly symmetric spectrum derived from that shown in Fig. 2.
One may notice that the centers (zero-crossings) of the dispersively shaped spectra of the optical rotation amplitudes and are shifted by around 250 MHz from the center of the low light power transmission spectrum in Fig. 10. This may be explained by recalling that on the high frequency side of the Doppler-broadened resonance the pump and probe light are resonant with the cycling transition, which may enhance the contribution of this hyperfine component to the optical rotation signal. Furthermore, it is important and convenient that the two amplitudes and generally are of opposite sign. A possible reason for this difference in sign was offered in Sec. II.3.1 – namely that electron-randomization collisions and spin-exchange collisions, which dominate the fast rate , can transfer orientation from the unprobed ground state hyperfine level to the probed level, while uniform relaxation, which is the dominant contribution to , decreases orientation in both levels. Therefore, in principle, can be related to an increase in the orientation in the level and can be associated with a decrease in the orientation in the level, which in turn would cause the amplitudes and to have opposite signs.
A complete density-matrix calculation describing the optical pumping, evolution of atomic polarization, and optical probing of alkali atoms contained in paraffin-coated cells is in progress.
II.3.4 Cell-temperature dependence
Figure 11 illustrates the atomic polarization relaxation rates in cells A and B (Table 1) as a function of Cs density — the density was altered by varying the ambient air temperature in an insulated foam box containing the vapor cell. The temperature dependence of the fast rate of relaxation is roughly similar for both cells. Since, according to the model described in Sec. II.1, is dominated by electron-randomization and spin-exchange collisions (which depend only on the Cs density), we see that our data is consistent with the observation that paraffin-coated cells of similar construction and size have similar values for NISTpaper. The slow rate, consistent with the hypothesis that is dominated by the (caused by the reservoir effect), does appear to depend on the specific cell (presumably because the size of the stem opening varies between cells) but not on the temperature.

A linear fit of the data describing the fast rate of relaxation with respect to Cs density yields a slope of . The spin exchange rate is given by , where is the density of Cs atoms, Bouchiat is the spin exchange cross section, and is the average relative velocity between the Cs atoms. Using this relation for in Eq. (8), the contribution to the slope of the fast rate in Fig. 11 from spin exchange is , i.e. about a factor of smaller than the observed slope. This means that the fast relaxation rate is not dominated by spin-exchange collisions, but instead by electron randomization collisions with the wall or, perhaps, some gaseous impurities.
The relaxation due to electron randomization collisions evidently depends on the cell temperature or the cesium vapor density, and in the latter scenario has a nearly linear dependence on Cs density. The origin of this relaxation is not presently understood.
One basic question is whether or not such relaxation has been observed in other antirelaxation coated cells, and what information can be drawn from these previous studies.
In Ref. NISTpaper, measurements of the widths and frequency shifts for microwave transitions in paraffin-coated rubidium cells are compared to data on Zeeman relaxation obtained from nonlinear magneto-optical rotation measurements. In that work, there emerges compelling evidence that electron-randomization collisions on the wall dominate spin-relaxation, in agreement with our findings at room temperature and above.
In Ref. Vanier, the authors measured relaxation rates associated with the 3.03 GHz 85Rb 0-0 hyperfine transition in a Paraflint coated cell as a function of cell temperature. They took measurements for different stem temperatures and extrapolated to zero Rb density to isolate effects dependent on the coating temperature from effects dependent on the Rb density. In this case electron randomization collisions were not found to dominate relaxation. This may be a hint that it is in fact some modification of the coating surface by the alkali atoms that is responsible for the relaxation due to electron randomization collisions in our experiment. In fact, experiments carried out by the same group discussed in Ref. Boulanger seem to hint that in a similar situation when the data is not extrapolated to zero alkali density, electron randomization collisions do in fact dominate relaxation.
In Ref. AleksandrovK, the spin-relaxation effects in a paraffin-coated cell containing potassium were measured. Based on measurements of the broadening of a potassium magnetic resonance line as a function of cell temperature and potassium vapor density, it was determined that spin-exchange collisions between the potassium atoms were the dominant source of relaxation. This may indicate that the relaxation due to electron randomizing wall collisions observed in Ref. NISTpaper and the present work are somehow specific to rubidium and cesium.
Thus it is apparent that according to available literature, the nature of this relaxation is unclear at the present time, and further experimentation is warranted.
III Relaxation of atomic polarization in the presence of light-induced atomic desorption
Alkali atoms in paraffin-coated vapor cells are absorbed into the cell coating over time. When these cells are then exposed to light of sufficiently short wavelength, alkali atoms are desorbed from the paraffin coating into the volume of the cell ourLIAD. This phenomenon, known as light-induced atomic desorption (LIAD), has been observed using a wide range of surfaces: sapphire AlexandrovLIAD; BonchB1; BonchB2, silane-coated glass (in particular poly-dimethylsiloxane) PDMS_gozzini; PDMS_meucci; PDMS_mariotti; PDMS_xu; PDMS_atutov, superfluid 4He films Yabuzaki; YabuzakiNew, quartz QuartzLIAD, and porous silica PorousSilicaLIAD. LIAD is useful as a method for the rapid control of atomic density, and is of particular interest in the development of miniaturized atomic clocks and magnetometers NISTpaper. A primary question is whether or not LIAD affects the relaxation properties of the wall coating. Additionally, can LIAD be used to understand the relaxation processes?

The relaxation rates before, during, and after exposure of a cell to desorbing light are shown in Fig 12. Cell A (Table 1) was fully illuminated using the Ar+ laser. The results show a correlation between the fast relaxation rate and the presence of desorbing light, whereas the slow relaxation rate appears to be unaffected by the presence of desorbing light.

In Fig. 13, the fast relaxation rate is shown both when LIAD is used to change Cs density and when the cell is heated. As discussed previously in Sec. II.3.4, the slope of the fast relaxation rate with respect to is a factor of four larger than the value expected from spin-exchange collisions when is changed by heating the cell. On the other hand, the Cs density dependence of the fast rate when LIAD is used to change is consistent with relaxation due solely to spin-exchange collisions [according to fits to Eq. (8)]. Thus it appears that LIAD does not change the relaxation properties of the wall coating, and in fact avoids the “extra” relaxation due to electron randomization collisions introduced when the entire cell is heated.
Note that the fast relaxation rate does not extrapolate to zero for when LIAD is used to alter , presumably because of the presence of the “extra” relaxation described by the rate . Furthermore, one may notice that at every Cs density, the data for are different for the LIAD experiment and the heating experiment. This can be understood as a result of the fact that the temperature of the cell (20∘C) in the LIAD experiment is lower than any of the temperatures during the heating experiment (minimum temperature = 22.4∘C) – note that at lower Cs densities () the extrapolations from the fits intersect. This may be an indication of a temperature-dependent, Cs-density-independent source of spin relaxation
22endnote: 2 However, there is some ambiguity because temperature and Cs density are not always reproducibly correlated from run-to-run in the paraffin-coated cells we use – occasionally it is necessary to temporarily overheat the stems (for about 5 minutes) relative to the body of the cells to reach the usual vapor pressure at room temperature..
To confirm that the way in which the cell is illuminated does not change these results, we performed an experiment in which only a small portion (12%) of the cell surface was exposed to desorbing light. The light intensity was increased (from to ) so that the overall change in density was comparable to the data shown in Fig. 13. We observed a nearly identical change in the fast relaxation rate.

Figure 14 compares the density dependences of the fast and slow relaxation rates predicted by the model described in Sec. II.1 to the data obtained when LIAD is used to alter . As predicted, the fast and slow rates have the dependence given by Eq. (8) using the known -dependence of spin-exchange relaxation in Cs. Extrapolation to , and thus , yields and from Eqs. eqrefEq:RatesAtZeroDensity1 and (12). The analysis clearly shows that electron-randomization collisions are a dominant source of relaxation in the cell at room temperature and above, in agreement with the results of Ref. NISTpaper.
Finally, in an effort to establish the specific location of the collisions causing electron randomization relaxation, we used LIAD to investigate the relaxation rates in cell C (the small cell, Table 1). This relaxation could be occurring in collisions with the wall or possibly in collisions with some gaseous impurity in the cells. If the relaxation is occurring in wall collisions, the effect should scale inversely proportional to the cell radius:
| (15) |
where is the electron-randomization relaxation rate on the wall, is probability for relaxation in a single collision with the wall, and is the effective radius of the cell (half the mean free path listed in Table 1). We used a Monte-Carlo simulation to determine , assuming a cosine distribution of atoms reflected from the paraffin surface. Relaxation due to gaseous impurities should have no dependence on the size of the cell.
For a reasonable comparison of relaxation in the cells of two different sizes, much higher light intensity had to be used for the small cell C in order to obtain a stable and comparable change in density (this is because of the difference in the ratio of the cells’ surface areas to stem entrance areas, as discussed in Ref. ourLIAD – the stem acts as a pump for the excess vapor density produced in the volume of the cell by LIAD). To accomplish this, we used the same lens set-up as in the aforementioned partial illumination experiment and increased the desorbing light intensity to . The rates , , and were determined from the data by fits to our model. For the small cell, , consistent with a larger reservoir effect due to the lower surface area to stem entrance area ratio compared to cell A (Table 1). The electron randomization rate is for cell C, an increase of 2 times compared to cell A. This increase is comparable to ratio of effective radii of the cells, , consistent with the notion that this relaxation is on the cell walls NISTpaper.
If the relaxation rate can be attributed to electron-randomizing wall collisions, why does heating the cell increase while LIAD seems to not affect it? The most straightforward explanation would be that depends on the wall coating temperature, but this would contradict previous studies which show that relaxation properties of the coating actually improve at higher temperatures (up to about C) Vanier. In the study described in Ref. Vanier, as previously discussed, data was extrapolated to zero Rb density to isolate effects dependent on the coating temperature from effects dependent on the Rb density, and electron randomization collisions were not found to dominate relaxation. This leads us to the conclusion that is caused by some alkali-atom induced modification of the coating surface. But why does increasing the vapor density with LIAD not cause a similar modification of the coating surface?
Alkali-atom-induced modification of the paraffin coating is known to occur. There is considerable experimental evidence (see Ref. ourLIAD and references therein) suggesting that during the cell preparation procedure alkali atoms react with paramagnetic impurities in the paraffin-coating, thereby eliminating paramagnetic sites from the paraffin surface and subsequently improving the relaxation properties of the coating. It may be that when the cell coating is heated, some fraction of Cs atoms previously bonded to the paramagnetic impurity sites are released and the sites become active again, increasing the probability of electron-randomizing wall collisions. Conversely, when LIAD is used to desorb Cs atoms from the coating, Cs atoms not associated with the paramagnetic relaxation sites are released. However, this hypothesis would again contradict previous work showing a decrease in relaxation due to wall collisions at higher temperatures Vanier.
One possible explanation that seems consistent with both the present work and previous studies of relaxation properties of paraffin-coated cells Robinson; Bouchiat; Alexandrov1; Alexandrov2; NISTpaper; BouchiatPhD; Bouchiat; Gibbs; Liberman; BalabasRID; Vanier; AleksandrovK would involve a alkali-atom induced modification of the surface that takes a relatively long period of time to occur. In this case, increasing the alkali density for a short time using LIAD is insufficient to alter the coating properties. An increase of density sustained over a longer period of time, as in the case of heating the cell, may allow sufficient time for the surface modification.
Clearly, further experimentation is required to resolve this issue.
IV Conclusion
We have studied the relaxation of optically pumped ground-state atomic polarization in paraffin-coated cesium vapor cells by measuring “relaxation in the dark” using optical rotation of a narrow-band, low intensity probe beam. The approach employed in the present work enabled a clear distinction of two different relaxation rates. A model of relaxation processes in the cell is presented that relates the measured relaxation rates to three different physical relaxation mechanisms in the cell: (1) spin-exchange collisions between Cs atoms, (2) electron-randomization collisions with, for example, the cell wall, and (3) a process that relaxes all atomic polarization moments at the same rate, for example due to exchange of atoms between the metal sample in the stem of the cell and the vapor phase in the volume of the cell – the “reservoir effect” Bouchiat.
The relaxation rates were studied as a function of pump and probe light power and detuning, magnetic field, and cell temperature. These studies confirmed that the assumptions made in our model were reasonable and that the model could be used to extract information about relaxation processes in the cell. The change in relaxation rates when the cell temperature was increased greatly exceeded that expected from an increased rate of Cs spin-exchange collisions – indicating that there existed some additional, cell-temperature-dependent relaxation process.
Relaxation rates were also studied when the cells were exposed to off-resonant light that caused desorption of Cs atoms from the paraffin coating (Light-Induced Atomic Desorption — LIAD ourLIAD). When the Cs vapor density increased in the cell due to LIAD, the spin relaxation rates changed as expected assuming only the spin-exchange rate increased. This technique enabled us to unambiguously separate the contributions of the three physical relaxation processes described in our model. It was determined that spin relaxation in the cells was dominated by electron-randomization collisions. Comparison of rates in differently sized cells indicated that collisions with the cell walls were the source of the electron randomization (see also Ref. NISTpaper). Furthermore, we found no evidence of a change in the relaxation properties of the coating during LIAD.
This study has demonstrated that LIAD is a promising tool for the control of alkali vapor density in paraffin-coated cells, since it does not change spin-relaxation properties of the coating. Additionally, the use of LIAD in conjunction with relaxation-in-the-dark measurements enabled some basic characterization of the relaxation processes in paraffin-coated cells.
LIAD may become a useful technique in the ongoing work aimed at developing highly miniaturized atomic frequency references SmallClocks1; SmallClocks2 and magnetometers SmallMags. These devices will likely take advantage of miniature atomic vapor cells with physical dimensions on the order of 1 mm or smaller SmallCells. Because of the larger surface-to-volume ratio, atoms confined in such a small cell spend a larger fraction of their time interacting with the cell wall than they would in a larger cell – so understanding relaxation due to wall collisions becomes even more important. Additionally, in order to increase the signal in such miniaturized cells, an efficient method to increase the atomic density is required. Compared to changing vapor densities by heating the cells, our work shows that LIAD may offer significant improvement in spin-relaxation times.
Because of the importance of anti-relaxation coated cells in many areas of research, it is crucial to develop a complete understanding of the spin-relaxation processes in coated cells. In the future, we plan to apply modern surface science techniques to this interesting and important question, potentially leading to a design of a new generation of anti-relaxation coatings with even better spin-relaxation properties.
V Acknowledgments
The authors would like to sincerely thank Damon English for Monte Carlo simulations of the atomic trajectories in the parrafin-coated cells, and A. I. Okunevich for useful comments and suggestions on the manuscript.
This research was supported by the Office of Naval Research (grants N00014-97-1-0214 and SBIR), the Russian Foundation for Basic Research (grant 03-02-17509 RFBR), the National Science Foundation, a Cal-Space Mini-grant, Lawrence Berkeley National Laboratory’s Nuclear Science Division, and the University of California at Berkeley’s Undergraduate Research Apprenticeship Program.
References
- (1) H. G. Robinson, E. S. Ensberg, and H. G. Dehmelt, Bull. Am. Phys. Soc. 3, 9 (1958).
- (2) M. A. Bouchiat and J. Brossel, Phys. Rev. 147, 41 (1966); M. A. Bouchiat, Ph. D. Thesis, University of Paris, 1964.
- (3) E. B. Alexandrov and V. A. Bonch-Bruevich, Opt. Engin. 31, 711 (1992).
- (4) E. B. Alexandrov, M. V. Balabas, A. S. Pasgalev, A. K. Vershovskii, and N. N. Yakobson, Laser Phys. 6, 244 (1996).
- (5) J. Dupont-Roc, S. Haroche and C. Cohen-Tannoudji, Phys. Lett. 28A, 638 (1969); C. Cohen-Tannoudji, J. Dupont-Roc, S. Haroche, and F. Laloe, Phys. Rev. Lett. 22, 758 (1969).
- (6) D. Budker, V. Yashchuk, and M. Zolotorev, Phys. Rev. Lett. 81, 5788 (1998); D. Budker, D. F. Kimball, S. M. Rochester, and V. V. Yashchuk, Phys. Rev. Lett. 85, 2088 (2000); D. Budker, D. F. Kimball, S. M. Rochester, V. V. Yashchuk, and M. Zolotorev, Phys. Rev. A 62, 043403 (2000); D. Budker, D. F. Kimball, V. V. Yashchuk, and M. Zolotorev, Phys. Rev. A 65, 055403 (2002).
- (7) E. B. Alexandrov, M. V. Balabas, A. K. Vershovski, and A. S. Pazgalev, Technical Physics 49(6), 779-783 (2004).
- (8) D. Budker, W. Gawlik, D. F. Kimball, S. M. Rochester, V. V. Yashchuk, and A. Weiss, Rev. Mod. Phys. 74, 1153 (2002).
- (9) E. S. Ensberg, Phys. Rev. 153, 36 (1967).
- (10) V. Yashchuk, D. Budker and M. Zolotorev, in Trapped Charged Particles and Fundamental Physics AIP Conference Proceedings 457, edited by D.H.E. Dubin and D. Schneider (American Institute of Physics, New York, 1999), pp. 177-181.
- (11) D. F. Kimball, D. Budker, D. S. English, C.-H. Li, A.-T. Nguyen, S. M. Rochester, A. Sushkov, V. V. Yashchuk, and M. Zolotorev, in Art and Symmetry in Experimental Physics AIP Conference Proceedings 596, edited by D. Budker, P. H. Bucksbaum, and S. J. Freedman (American Institute of Physics, New York, 2001), pp. 84-107.
- (12) D. Budker, D. F. Kimball, S. M. Rochester, and V. V. Yashchuk, Phys. Rev. Lett. 83, 1767 (1999).
- (13) L. J. Wang, A. Kuzmich, and A. Dogariu, Nature 406, 277 (2000).
- (14) A. Kuzmich, L. Mandel, and N. P. Bigelow, Phys. Rev. Lett. 85, 1594 (2000).
- (15) V. V. Yashchuk, D. Budker, W. Gawlik, D. F. Kimball, Yu. P. Malakyan, and S. M. Rochester, Phys. Rev. Lett. 90, 253001 (2003).
- (16) D. Budker, L. Hollberg, D. F. Kimball, J. Kitching, S. Pustelny, and V. V. Yashchuk, Phys. Rev. A 71, 012903 (2005).
- (17) M. A. Bouchiat, Ph. D. thesis, L’Universite de Paris (1964).
- (18) H. Gibbs, Phys. Rev. 139, 1374 (1965).
- (19) V. Liberman and R. J. Knize, Phys. Rev. A 34, 5115 (1986).
- (20) M. V. Balabas, M. I. Karuzin, and A. S. Pazgalev, JETP Lett. 70, 196 (1999).
- (21) J. Vanier, J.-F. Simard, and J.-S. Boulanger, Phys. Rev. A 9(3), 1031 (1974).
- (22) E. B. Aleksandrov, M. V. Balabas, A. K. Vershovskii, A. I. Okunevich, and N. N. Yakobson, Optics and Spectroscopy, 87(3), 329-34 (1999).
- (23) W. Franzen, Phys. Rev. 115, 850 (1959).
- (24) E.B. Alexandrov, M.V. Balabas, D. Budker, D. English, D.F. Kimball, C.-H. Li, and V.V. Yashchuk, Phys. Rev. A 66, 042903 (2002).
- (25) A. I. Okunevich, in Optical orientation of atoms and molecules (FTI, Leningrad, 1987).
- (26) D. Budker, D. F. Kimball, and D. P. DeMille, Atomic Physics: an exploration through problems and solutions (Oxford University Press, Oxford, 2004).
- (27) S. Stenholm, Foundations of Laser Spectroscopy (Wiley, New York, 1984).
- (28) K. Blum, Density Matrix Theory and Applications (Plenum Press, New York, 1996).
- (29) W. Happer, Rev. Mod. Phys. 44 (2), 169 (1972).
- (30) A. I. Okunevich, Optics and Spectroscopy, 97(6), 834841 (2004) [Optika i Spektroskopiya, 97(6) 890897 (2004)].
- (31) A. I. Okunevich, Optics and Spectroscopy, 97(6), 842848 (2004) [Optika i Spektroskopiya, 97(6) 898904 (2004)].
- (32) A. I. Okunevich, J. Opt. Soc. Am. B 22(1) 29-36 (2005).
- (33) A. Omont, Prog. in Quant. Elect., 5, 69-138 (1977).
- (34) D. A. Varshalovich, A. N. Moskalev, and V. K. Khersonskii, Quantum Theory of Angular Momentum (World Scientific, Singapore, 1988).
- (35) I. B. Khriplovich, Parity Nonconservartion in Atomic Phenomena (Gordon and Breach, Philadelphia,1991).
- (36) X. Chen, V. L. Telegdi, and A. Weis, J. Phys. B 20, 5653-5662 (1987).
- (37) V.V. Yashchuk, D. Budker, and J.R. Davis, Rev. Sci. Instr. 71(2), 341 (2000).
- (38) S. Huard, Polarization of Light (Wiley, New York, 1997).
- (39) J. S. Boulanger, These de Doctorat (Université Laval, Québec, 1975).
- (40) I. N. Abramova, E. B. Aleksandrov, A. M. Bonch-Bruevich, and V. V. Khromov, Pis’ma Zh. Eskp. Teor. Fiz. 39, 172 (1984) [JETP Lett. 39, 203 (1984)].
- (41) A. M. Bonch-Bruevich, Yu. N. Maksimov, S. G. Przhibel’skiĭ, and V. V. Khromov, Zh. Eskp. Teor. Fiz. 92, 285 (1987) [Sov. Phys. JETP 65, 161 (1987)].
- (42) A. M. Bonch-Bruevich, T. A. Vartanyan, Yu. N. Maksimov, S. G. Przhibel’skiĭ, and V. V. Khromov, Zh. Eskp. Teor. Fiz. 97, 1761 (1990) [Sov. Phys. JETP 70, 993 (1990)].
- (43) A. Gozzini, F. Mango, J. H. Xu, G. Alzetta, F. Maccarrone, and R. A. Bernheim, Nuovo Cimento D 15, 709 (1993).
- (44) M. Meucci, E. Mariotti, P. Bicchi, C. Marinelli, and L. Moi, Europhys. Lett. 25, 639 (1994).
- (45) E. Mariotti, S. Atutov, M. Meucci, P. Bicchi, C. Marinelli, and L. Moi, Chem. Phys. 187, 111 (1994).
- (46) J. H. Xu, A. Gozzini, F. Mango, G. Alzetta, and R. A. Bernheim, Phys. Rev. A 54, 3146 (1996).
- (47) S. Atutov, V. Biancalana, P. Bicchi, C. Marinelli, E. Mariotti, M. Meucci, A. Nagel, K. A. Nasyrov, S. Rachini, and L. Moi, Phys. Rev. A 60, 4693 (1999).
- (48) A. Hatakeyama, K. Oe, K. Ota, S. Hara, J. Arai, T. Yabuzaki, and A.R. Young, Phys. Rev. Lett. 84, 1407 (2000).
- (49) A. Hatakeyama, K. Enomoto, N. Sugimoto, and T. Yabuzaki, Phys. Rev. A65, 022904 (2002).
- (50) J. Brewer and H. G. Rubahn, Chem. Phys. 303(1-3), 1-6 (2004).
- (51) A. Burchianti, C. Marinelli, A. Bogi, J. Brewer, K. Rubahn, H. G. Rubahn, F. Della Valle, E. Mariotti, V. Biancalana, S. Veronesi, and L. Moi, Europhysics Letters 67(6), 983-989 (2004).
- (52) J. Kitching, S. Knappe, and L. Hollberg, Appl. Phys. Lett. 81, 553 (2002).
- (53) Y. Y. Jau, A. B. Post, N. N. Kuzma, A. M. Braun, M. V. Romalis, and W. Happer, Phys. Rev. Lett. 92, 110801 (2004).
- (54) P. Schwindt, S. Knappe, V. Shah, L. Hollberg, J. Kitching, L. Liew, and J. Moreland, Appl. Phys. Lett. 85, 6409 (2004).
- (55) L. Liew, S. Knappe, J. Moreland, H. G. Robinson, L. Hollberg, and J. Kitching, Appl. Phys. Lett. 84, 2694 (2004).