Development of a novel high-sensivitiy LAr purity monitor based on an -source
Abstract
A novel liquid argon (LAr) purity monitor was developed with a sensitivity to electronegative impurities of the order of ppb (O2 equivalent). Such a high purity is e.g. needed in a LAr drift chamber. The principle is to measure the lifetime of quasifree electrons in LAr, since this is the important parameter for the operation of a drift chamber. Free electrons are produced by ionizing the LAr with -particles emitted by the chain daughter of an isotope source. From a measurement of the charge of the electron cloud at the beginning and at the end of a drift path, together with the drift time, the lifetime of the electrons is obtained. The -particles have a very short range of about 50 m in LAr and the ionization density is very high, typically between , leading to a high recombination rate. To suppress the recombination of the argon ions with the electrons, the -source was put in a strong electric field of kV/cm. This was achieved by depositing the source on the surface of a spherical high voltage cathode with a diameter of about 0.5 mm. The anode was also made as a sphere of about the same diameter as the cathode, thus, close to the axis between the two electrodes the electric drift field was approximately a dipole field.
Keywords:
Purity monitor , liquid Argon purity1 Introduction
Liquid argon (LAr) detectors need to monitor the purity of the LAr since electronegative impurities (mainly ) capture ionization electrons, and hence degrade the performance of the detector. Different types of liquid argon purity monitors were developed for the LAr detectors in use or for future experiments. For the LAr calorimeters in the H1 [1] and the Atlas [2] experiments the necessary sensitivity of the monitors to electronegative impurities is of the order of (oxygen equivalent). The pulse height spectra from -decay electrons and -particles are measured in a LAr ionization chamber. In the drift chamber of the ICARUS detector [3] drift times of the order of occur. In order to measure such long drift times, it is necessary to purify the LAr from to a level below (oxygen equivalent). Purity monitors with this sensitivity were built [4], measuring the lifetime of electrons which drift in a homogeneous electric field over a distance of about 10 cm. The drift electrons were extracted using an appropriately chosen photocathode, which is flashed periodically with a bright light pulse.
Traditionally the problems encountered in designing purity monitors were (1) related to the creation of a sufficiently large drift electron cloud in order to produce clean signals above noise and (2) to the extraction of the purity with high precision and sensitivity.
The purity monitor described in this paper is also based on a lifetime measurement of electrons. The method to determine the lifetime of electrons consists of measuring the attenuation of the charge of an electron cloud drifting in an electric field as a function of the drift time. The mean lifetime of the electrons is obtained from equation (1):
| (1) |
where is the number of electrons at the beginning and the number of electrons at the end of the drift path corresponding to a drift time .
However, our purity monitor includes the following new features:
- •
a new almost monochromatic source of free electrons based on an energetic 5.3 MeV -source;
- •
a dipole geometry to introduce a very high field in the region of the cathode and anode, and a very low field in the drift region in-between (inhomogeneous field);
- •
a direct start and stop trigger for a source-event from the independent readout of the cathode and anode induced signals;
- •
a built-in variation of the drift time, due to the different path along the dipole field lines introducing a spread-in-time for the arrival of the electron cloud on the anode;
- •
an event-by-event measurement of the drift time and induced charges before the drift at the cathode and after the drift at the anode, yielding the attentuation as a function of the event-by-event varying drift-time.

2 The purity monitor
The purity monitor described in this paper is shown schematically in Figure 1; it uses the ionization electrons produced by the -particles emitted by to measure the electron lifetime. The -emitter is produced with a decay fraction of almost 100% through -decays in the decay chain of . The decay chain ends at the stable isotope. In the decay chain of several - and -decays occur, but only the -decay of with an endpoint energy of and the -decay of with an energy of have decay probabilities of almost , all other decays are very rare.

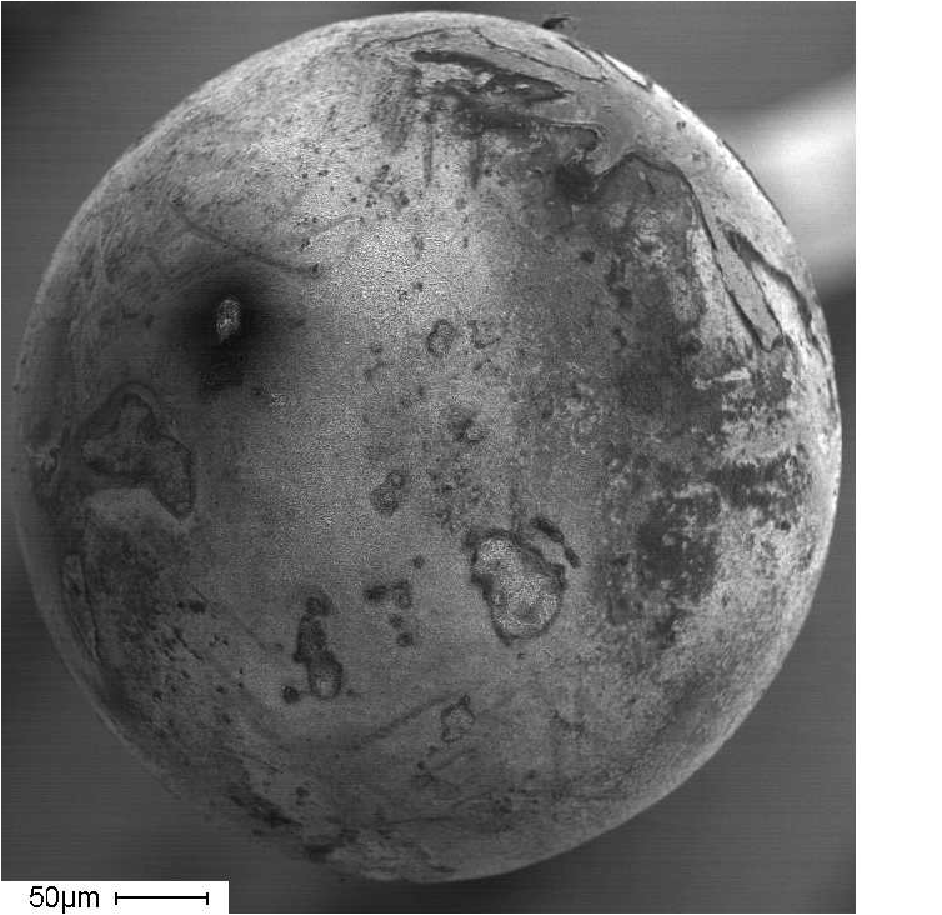
The high ionization density of -particles in LAr, typically between as opposed to about 2 MeV/cm for a m.i.p., leads to an extremely high recombination rate [5] of the argon ions with the electrons along the track of the -particles, thus, reducing the measurable electron charge [6]. The recombination rate is reduced, when the ionization occurs in a strong electric field [7]. At a typical drift field of 500 V/cm, less than 1% is recovered as free electrons. To expose the source to the mandatory electric fields of the order of kV/cm, it was deposited onto the surface of a spherical platinum high voltage cathode with a diameter of about 0.5 mm; applying a high voltage of 2 kV produces an electric field , where is the radius of the sphere, of about 80 kV/cm at the surface. The spherical electrodes were made from a 76 m thick platinum wire by melting one end of the wire in a flame of a Bunsen burner [6]; the surface tension of the melting platinum was forming spherical drops. The 20 kBq -source 11 1 Purchased from AEA Technology QSA GmbH, D-38110 Braunschweig with a mean lifetime of 31.9 years was dissolved in a 1.2 molar -solution. A thin layer with an activity of about was deposited electrolytically on the spherical cathode. Figure 2 shows an electron microscope picture of a cathode, having a thin layer of deposited on the surface; the diameter of the electrode is 458 m.

The anode also consists of a Pt sphere with a diameter of 335 m. A symmetrical high voltage applied to the two electrodes produces approximately an electric dipole drift field. The electric drift field on the axis between the electrodes is shown in Figure 3 for a high voltage of 1.5 kV.
The number of free ionization electrons remaining after recombination depends on the electric field along the entire track of the -particle, i.e., it depends on the high voltage applied to the cathode and its diameter. The range of the 5.3 MeV -particles in LAr is only about 50 m, i.e., 1/5 of the used cathode radius. Thus, the electric field along the entire track of the -particle can (in the worst case) decrease by only 33% from the value at the cathode surface. The number of electron-ion pairs produced by -particles depositing their total energy of 5.3 MeV in LAr is , where eV is the mean energy needed to create an electron-ion pair in LAr. We stress that this number is reduced if the alpha deposits a non-negligible fraction of its energy in the lead (the range in lead is 16 m). Neglecting this effect, we anticipate here (see section 3.2 for more details) that the measured quenching of this charge by the recombination (recombination factor ) varied between 0.22 at a field on the cathode surface of 44 kV/cm to 0.39 at 154 kV/cm (see Figure 8), a variation consistent with the Box model of recombination.
The charge of the electron cloud at the cathode and the anode is obtained by integrating the current signals induced on the electrodes by the movement of the electrons in the drift field. The fast movement in the high field near the surface of the electrodes induces a fast rising current signal (see Figure 6) with a good signal to noise ratio. The argon ions have drift velocities orders of magnitude smaller than the electrons so that they do not contribute to the current signal. To summarize, the configuration of Figure 1 combines the following desirable features:
- •
the high electric field on the cathode surface containing the source suppresses the recombination,
- •
the fast drift velocity of the electrons in the high electric field near the surface of the electrodes induces a short (approx. 1 s) current pulse, which can be measured.
- •
the small drift velocity of the electrons in the central region of the dipole field (minimal field strength is a few V/cm) allows to measure long drift times.
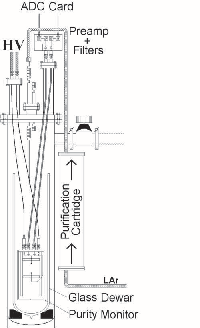
The mechanical design of the purity monitor is shown in Figure 4. Two circular polyethylene plates with the electrodes in the center are held by three Macor rods. The monitor is shielded by a stainless steel cylinder and covered at the bottom and at the top with steel plates. The distance between the electrodes was varied between 20 mm and 50 mm. The measuring set-up is shown in Figure 5.
A glass dewar holding the purity monitor was mounted in a vacuum chamber. Before filling the dewar with LAr, the chamber was heated to about 70∘C for at least one day and pumped to a pressure of about 10-6 mbar. The LAr passed through a 5 purification cartridge containing 50% BTS22 2 Fluka No. 18820, Fluka Chemie GmbH, CH-9471 Buchs SG, Switzerland catalyst and 50% copper oxide. The BTS and the copper oxide were reduced by controlled flowing of hydrogen gas through the cartridge before it could be used to purify LAr from oxygen.
The readout electronics for the two electrodes is operated at room temperature outside the vacuum chamber. It consists of a low noise charge preamplifier of the type used for the ICARUS drift chamber [10] followed by a custom-made ac-coupled amplifier, which also acts as a bandpass filter transmitting frequencies from 530 Hz to 760 kHz (-3 dB values). The preamplifier integrates the current pulse from the electrode; its decay constant is about 250 s. The circuit has an overall sensitivity of 10.8 mV/k corresponding to 68 mV/fC. Both electrodes have their own readout channels, which were carefully calibrated. The analog signals were sampled with 10 MHz and digitized by a 12 bit ADC card in a PC; the digital data were accumulated with a LabView program.
3 Results
3.1 Signal shapes
Figure 6 shows the measured pulse shapes from the cathode and the anode at a high voltage of 1.5 kV and an electrode distance of 20 mm. The integrated current (i.e. the charge) induced on the electrodes by the moving electron cloud is shown as a function of time. The fast rising leading edge of the signals is induced by the fast movement of the electrons in the high field near the surface of the electrodes. The decay of the signal is given by the decay time of the integrating electronics. In the anode signal the contribution to the signal over the whole drift time is seen: it starts with the fast movement of the electron cloud near the cathode, gets flat during the time of the slow drift through the central region of the drift field and rises sharply when the cloud reaches the anode. In the cathode signal the contribution from the drift in the low field region is hidden in the rounding of the signal after the sharp rise. The charge is given by the pulse height difference between the maximum (minimum) and the base line defined by the (average) signal measured at times before the cathode pulse starts.


Figure 7 shows the pulse height spectra from the cathode and the anode measured at three different high voltages and at a separation of the electrodes of 20 mm. The peaks from -particles are clearly separated form noise and the small pulses from -decays (-decay electrons have a maximal range in LAr of 3 mm, compared to 50 m for -particles, and hence, have a different distribution of induced signals between cathode and anode). The energy deposited by the -particles in LAr is reduced from the maximal energy of 5.3 MeV and smeared out by the energy deposition in the lead of the source (the range in lead is 16 m). The maximal charge (for a fixed high voltage) is given by the end point of a pulse height spectrum and corresponds to the deposition of the total energy of 5.3 MeV in the LAr. The values for the maximal and the mean (corresponding to the peak of the distribution) measured charge are given in Table 1.
| HV () | Average charge | Maximal charge | Minimal drift time | Lifetime |
|---|---|---|---|---|
| [ electrons] | [ electrons] | |||
| 1.0 | 36 | 50 | 20 | 83 2 |
| 1.5 | 49 | 62 | 14 | 1052 |
| 2.0 | 58 | 70 | 12.5 | 1122 |
| 2.5 | 62 | 76 | 11 | 1092 |
| 3.0 | 69 | 82 | 10.5 | 1203 |
| 3.5 | 72 | 88 | 10 | 1083 |
3.2 E-field dependence
In order to study the recombination of the electron-ion pairs produced by ’s as a function of the electric field, we consider the maximal charge (i.e. the end-point) of the electron clouds measured at the cathode. In this way, we try to suppress the uncertainties related to the energy loss of the ’s in the source Pb before they enter the liquid Argon medium33 3 We note that regardless of the actual thickness of the deposit of lead on the Pt sphere, solid angle considerations limit the statistics of ’s to the few outer microns thickness.. In Figure 8 the maximum measured charged is plotted as a function of the high voltage (or as a function of the electric field on the cathode surface). The strong dependence on the electric field supports the interpretation of the events in favour of the -decays; the -decays would never show such a dependence. To our knowledge, this curve represents the first measurement of the recombination factor for -particles in LAr as a function of the electric field at field strengths .
The observed curve fits well with the Box Model[7]:
| (2) |
where is the number of electrons after recombination and before the recombination. is a constant depending on the ionizing particle and the medium, but not on the field. For the field, we use where is the potential of the cathode, and is the amplification due to the sphere geometry. For a sphere of radius , one expects . From a fit to the measured curve as a function of the cathode voltage, we can extract , and electrons. The 68% C.L. for the parameters assuming a 10% uncorrelated error on the points is , and electrons. A systematic variation of the measured points by does not change appreciably the fitted and parameters which depend mostly on the changing slope of the curve.
The fitted amplification factor is in perfect agreement with the measured properties of the cathode, since the radius of a sphere corresponding to such an amplification is 44 4 We recall here that the range of the being so short, the error introduced by the variation of the field over the range is less than 30%.. The measured diameter of the electrode (see section 2) is 458 m.
In order to compare this result to expectations, we developed a simulation of the -source. The number of ionization electrons was obtained by numerically integrating of the semi-empirical expression of Birks [5] along the track of the -particles [6]:
| (3) |
where is the mean energy to produce an electron-ion pair in LAr, = 23.6 eV. The Birks law parameters were extracted from measurements in a LAr TPC with m.i.p. or stopping protons up to at electric fields up to 500 V/cm[11]. In order to predict the recombination of the , one must extrapolate these parameters to very high ionization densities, between 750 and . The E-field dependence of the Birks factor was obtained from the Box Model. For -particles in LAr, we obtain . This is in excellent agreement with the observed shape of the curve.

3.3 Drift electron lifetime
Selecting -particle events with a cut on the pulse height, the measured anode to cathode charge ratio for each selected event is plotted versus the drift time in Figure 9, for a distance of the electrodes of 20 mm and high voltages of 1.5 and 2.5 kV. The drift time of the events varies between for the 1.5 kV and for the 2.5 kV. This variation is due to different drift paths of the electrons in the dipole field: the minimal drift time corresponds to electrons drifting on the axis between the electrodes; electrons starting off axis on the cathode sphere follow the dipole field lines, i.e., they have a longer drift path and, in addition, feel the smaller drift field in the central region. A direct fit of an exponential decay function to the charge ratio as a function of the drift time yields the mean lifetime of the electrons. Table 1 summarizes the results obtained with different high voltages for an electrode distance of 20 mm.

The capture cross section of electrons by electronegative impurities depends on the electric drift field [8], i.e., the observed drift-electron lifetime can also depend on the drift field and not only on the concentration of impurities. Since the drift field in our purity monitor is very inhomogeneous, this effect can in principle also distort the exponential decay curve of the charge. However, for drift fields 600 V/cm the lifetime of electrons in LAr for a concentration of 3.5 ppb was measured to be almost constant [9]. As seen from Figure 3, the drift path in the high field ( 1 kV/cm) is only a very small fraction of the total drift path and contributes very little to the drift time. Thus, only a small correction, depending on the applied high voltage and the distance between the electrodes, has to be applied to the measured drift time to normalize it to a constant drift field. This correction was not applied to the lifetimes given here.
4 Conclusion
To conclude, we have developed a novel LAr purity monitor using an -source in a very high electric field to produce the free drift electrons. The adopted dipole geometry has allowed to avoid the otherwise typical strong quenching of the . We have measured the recombination factor of the ionization charge from -particles as the function of the electric field, ranging from kV/cm.
In a series of measurements performed in a dedicated setup, drift electron lifetimes of the order of 100 s were measured at electrode distances of 20 mm with a precision of 2-5 %. To measure longer lifetimes, up to a few ms, larger electrode distances could be needed, making it necessary to install field shaping electrodes in the long drift region.
Acknowledgements
We thank Prof. B. Eichler from the Radiochemistry Department of the Paul Scherrer Institut (PSI), CH-5232 Villigen PSI, for his advice and for his help to prepare the source. We thank P. Picchi, F. Pietropaolo and F. Sergiampietri for useful discussions and suggestions. This work was supported by the Swiss National Research Foundation.
References
- [1] E.Barrelet et al., Nucl. Instr. & Meth. A490, 204 (2002).
- [2]
ATLAS Collaboration, Liquid Argon Calorimeter
Technical Design Report, CERN/LHCC/96-41, 1996.
W. Walkowiak et al., ATLAS Internal Note, LARGO-NO-089, 1996. - [3] S. Amerio et al. [ICARUS Collaboration], Nucl. Instrum. Meth. A 527 (2004) 329.
- [4] P. Cennini et al., Nucl. Instr. & Meth. A332, 395 (1993). P. Benetti et al., Nucl. Instr. & Meth. A333, 567 (1993). P. Cennini et al., Nucl. Instr. & Meth. A346, 550 (1994).
- [5] J.B. Birks, Proc. Phys. Soc. A64, 874 (1951).
- [6] M. Laffranchi, Diploma Thesis, ETH Zurich, September 2000, unpublished. Available at http://neutrino.ethz.ch/diplomathesis.html.
- [7] J. Thomas and D.A. Imel, Phys. Rev. A36, 614 (1987);
- [8] G. Bakale, U. Sowada and W.F. Schmidt, J. Phys. Chem. 80, 2556 (1976); G. Bakale, U. Sowada and W.F. Schmidt, J. Phys. Chem. 81, 2220 (1977);
- [9] A. Bettini et al., Nucl. Instr. & Meth. A305, 177 (1991);
- [10] P. Cennini et al., Nucl. Instr. & Meth. A409, 300 (1998);
- [11] P. Cennini et al., Nucl. Instrum. Meth. A 345 (1994) 230.