LED Monitoring System for the BTeV Lead Tungstate Crystal Calorimeter Prototype
Abstract
We report on the performance of a monitoring system for a prototype calorimeter for the BTeV experiment that uses lead tungstate crystals coupled with photomultiplier tubes. The tests were carried out at the 70 GeV accelerator complex at Protvino, Russia.
Keywords:
light emitting diode , monitoring system , stability , calorimeter , scintillating crystalPACS
29.90.+r , 85.60.Dw , 85.60.Jb , 85.60.Ha, , , , , , , , , , , , , , , , , , , , , , , , , , , , , ,
1 Introduction
The BTeV experiment at Fermilab will use an electromagnetic calorimeter (EMCAL) made of lead tungstate (PbWO4) crystals [1]. These are scintillating crystals with a rather complex emission spectrum, consisting of two emission components: blue, peaking at 420 nm and green, peaking at 480-520 nm. Most of the light, , is emitted in 100 ns. The properties of the crystals produced by different manufacturers as well as the characteristics of the EMCAL prototype made of these crystals have been investigated using a test-beam facility at the 70-GeV accelerator at Protvino, Russia. Results of the measurements as well as a detailed description of the test-beam facility are given elsewhere [2], [3], [4].
The light output of the PbWO4 crystals is reduced, as a rule, when they are irradiated using electron and pion beams. The main reason for this effect is thought to be a lowering of the crystals transparency in a wavelength dependent manner. To study the magnitude of this effect we constructed a light output monitoring system that used light emitting diodes (LED) at four different wavelengths covering the range from 400 to 660 nm. The most important characteristics of this system include: easy adjustment of the light pulse duration and intensity, high reliability, low power consumption, durability, and finally low cost.
The BTeV lead tungstate crystals will be continuously calibrated in situ at the Tevatron using different physical processes. It is foreseen that electrons from decays as well as photon conversions will be used for this purpose. The overall system must be able to track the light output changes in each crystal to an accuracy of . The time required to collect enough events for the energy calibration varies from less than an hour for the most hit of the crystals laying close to the beam to about 10-20 hours, for the least hit crystals. A light monitoring system will track the transparency variation over these time intervals in order to guarantee that we maintain the calorimeter’s energy resolution.
The monitoring system described here has already proven to be an invaluable tool for our systematic study of the crystal properties at the test-beam facility. The main goal of the present study is to measure the levels of instability of this system. This information will allow us to decide if this type of system can be used in the final design of the BTeV monitoring system.
The stability of the monitoring system was evaluated using data collected from special LED pulse triggers intermixed with data taken using intense beams that served to irradiate the PbWO4 crystals. The crystals were exposed to the beam in December 2002 and recovery was monitored between January and March of 2003.
2 Test-beam Facility
The BTeV calorimeter test-beam setup consisted of a 55 array of lead tungstate crystals coupled to photomultiplier tubes, a beam with a momentum tagging on individual particles and a trigger system using scintillation counters. To eliminate the effects of temperature variation, crystals were placed inside a thermally insulated light-tight box. The temperature was measured continuously at 24 different locations around the crystal array using thermo-sensors. A more detailed description is given in [3]. The main difference from our earlier test-beam studies is the use of 6-stage R5380Q Hamamatsu PMT’s (instead of 10-stage R5800 PMT’s) for the crystals readout. This phototube is one of the possible candidates to be used in the BTeV EMCAL. Signals from the PMT’s were amplified by a factor of 10 using electronics developed at Fermilab to match the range of the LeCroy 2285 15-bit integrating ADC modules. The amplifiers were placed near the PMT’s inside the thermo-insulated box. The signal charge (either from particles or from LED’s) was integrated over a 150 ns gate.
3 Monitoring LED Pulser System Design
The LED-based monitoring system was designed to study variations of the crystals transparency while they were irradiated by high energy particles. Because we used different wavelengths of light and the crystals transparency change under radiation is wavelength dependent, it also is possible to monitor changes of the PMT’s gains. These can arise from changes in the average anode currents, as well as other reasons such as variations in the high voltage (HV) power supply.
The following LED’s were used in the monitoring system:
- •
violet (Kingbright L2523UVC), peak wavelength at 400 nm;
- •
blue (Nichia NSPB 500S), peak wavelength at 470 nm;
- •
yellow (Kingbright L-53SYC), peak wavelength at 590 nm;
- •
red (Kingbright L-53SRC-E), dominant wavelength at 640 nm.
Violet and blue LED’s provided the main results about the crystal transparency change in their respective wavelength regions. The transmission of red light in the PbWO4 crystal is not affected much by radiation damage [5], and thus we use the red LED to monitor the photomultiplier gains. This proved to be extremely valuable.
The system consisted of three main parts: a program-controlled LED pulser, a distribution network comprised of optical fibers and a stability monitoring subsystem. The block diagram is shown in Fig. 1. All the components of the light monitoring system, except the adjustable direct current (DC) voltage source, were placed inside the temperature stabilized box near the crystal array.
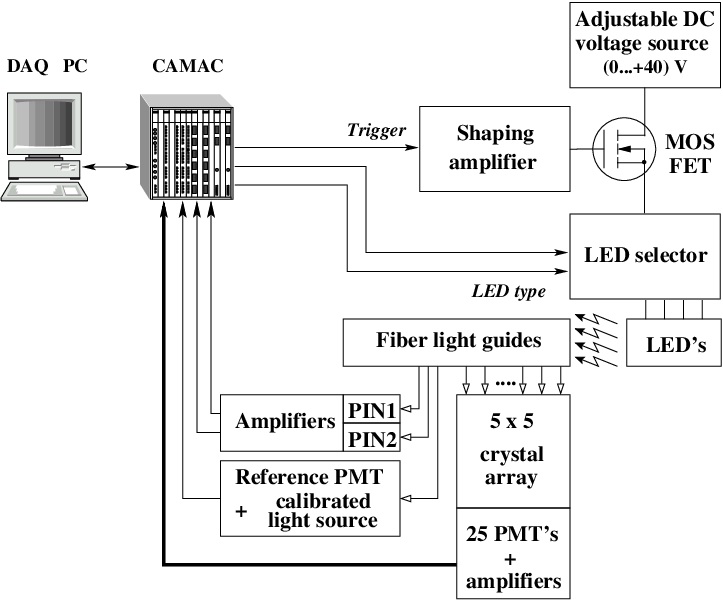
The LED pulser includes a shaping amplifier and output transistor (MOS FET) in a switching mode. The FET source is connected to one of the four LED’s using the LED selector, while the drain of the FET was connected to the stable DC voltage source. The shaping amplifier determines the duration (100 ns) of the LED driving pulses. The LEDs’ capacitances made the duration of light pulses longer, but the signals from all four LED’s were still shorter than the ADC gate width of 150 ns. The source voltage defines the light pulse intensity. It can be set at any value between 0 and +40 V.
The LED pulser’s operation mode was controlled remotely via the data acquisition system (DAQ) and can be easily modified if necessary. The selected LED produced a series of 10 light pulses between two accelerator spills. After the next beam spill, an LED of another wavelength produced 10 pulses. As a result, four accelerator cycles were necessary to complete the readout of all four LED’s. The cycle duration is about 10 seconds, therefore about 60 amplitude values per minute (15 for each LED) from each photodetector were recorded during data taking. This provided enough statistics for accurate monitoring every few minutes.
Clear plastic fiber light guides were used to transmit light from the LED’s to the cells of the EMCAL prototype and to the stability monitoring subsystem. LED’s illuminated a bunch of optical fibers. They were placed about 100 mm apart to provide a uniform illumination over the entire fiber bundle. Fibers were attached to the far (from PMT’s) ends of the crystals. Typical pulse height distributions of the signals in one of the EMCAL prototype channels, produced by four LED’s of different wavelengths, collected over 20 minutes are shown in Fig. 2. The channel 10000 of ADC approximately corresponds to the peak position of the 20 GeV electron signal amplitude distribution.

To monitor the stability of the LED’s we used two silicon PIN photodiodes Hamamatsu S6468-05 and a PMT Hamamatsu R5800 as a reference photomultiplier tube with a calibrated light source mounted on its front window. This light source was comprised of a small YAP:Ce crystal ( mm3) assembled in a plastic case with an -source [6]. It provided about 20 flashes per second with maximum of emission spectrum at 360 nm and decay time of about 30 ns. A signal from the PMT’s last dynode was used for trigger. The DAQ recorded about 50 -events between two accelerator spills. An amplitude spectrum obtained from this reference light source is shown in Fig. 4.
![[Uncaptioned image]](0311119v2/al_spectr.png) |
![[Uncaptioned image]](0311119v2/pin_spectr.png) |
|
|
|
The S6468-05 is a photodiode and a preamplifier chip integrated in the same package. It has an active area of 0.8 mm diameter and good sensitivity over a wide spectral range from 320 to 1000 nm. Two photodiodes were mounted on a small printed circuit board with additional AD8002 integrated circuit–based amplifiers and two voltage stabilizer integrated circuits, supplied DC voltage for the amplifiers. Figure 4 shows a typical amplitude distribution of blue LED signals obtained from one of the PIN photodiodes. The width of this distribution is caused mainly by the noise of the amplifiers rather than photon statistics.
4 Stability Analysis Method

The stability of the monitoring system was estimated using the data from the PIN photodiodes (PIN1 and PIN2) and the reference PMT (-PMT). We calculated the mean pulse heights of signals from the four LED’s measured by PIN1, PIN2 and -PMT, accumulated over 20-minutes intervals.
Figures 5(a) and 5(b) show time variation of -PMT signals from the yellow LED and the -YAP light source over a 30 hour time period. The correlated variations indicate that the gain of the reference PMT changed during this time. By taking the ratio between 5(a) and 5(b), shown in 5(c), we can correct the LED intensity measured with the reference PMT for the PMT gain variation. Figure 5(c), in fact, shows much smaller variations. In order to evaluate the size of the variations, we formed normalized histograms of pulse height measurements shown in Figures 5(a) and 5(c), which are shown in Figure 6. The r.m.s. of these distributions, expressed in percent, are 1.04% before the PMT gain corrections and 0.24% afterward. This correction works very well, therefore all the results on LED’s intensity variations measured by -PMT presented in this paper are corrected using the -YAP light source. The r.m.s. of the corrected distribution has contributions from the variations of the LED intensity, as well as the statistical error of each measurement. Measurements made with the PIN photodiodes reflect the LED intensity variation as well as the variation of the PIN photodiode monitoring system.

5 Monitoring System Performance
We have estimated the stability of the monitoring system for three
continuous time intervals of different duration:
a) 25 hours (short-term stability),
b) 200 hours (middle-term stability),
c) 2000 hours (long-term stability).
The results are presented in Table 1.
| -PMT | PIN1 | PIN2 | |||||||||
|---|---|---|---|---|---|---|---|---|---|---|---|
| violet | blue | yellow | red | violet | blue | yellow | red | violet | blue | yellow | |
| 25 h | 0.38 | 0.23 | 0.28 | 0.12 | 0.37 | 0.29 | 0.16 | 0.05 | 0.21 | 0.14 | 0.16 |
| 0.29 | 0.22 | 0.19 | 0.09 | 0.33 | 0.35 | 0.15 | 0.04 | 0.21 | 0.10 | 0.15 | |
| 200 h | 0.57 | 0.46 | 0.50 | 0.36 | 0.57 | 0.50 | 0.32 | 0.08 | 0.38 | 0.45 | 0.23 |
| 0.41 | 0.33 | 0.95 | 0.72 | 0.47 | 0.38 | 0.55 | 0.07 | 0.38 | 0.40 | 0.42 | |
| 2000 h | 0.54 | 0.34 | 0.95 | 0.73 | 0.79 | 0.41 | 0.55 | 0.08* | 0.47 | 0.50 | 0.46 |
* The result obtained for the first 550 hours of the recovery process.

The Table is organized as follows. There are two groups of results for each of the 25 h and 200 h intervals. The first line in each set contains the results obtained while irradiating the lead tungstate crystals; the second line contains the results while the crystals were recovering. The 2000 h interval reflects further recovery; here the data were collected continuously only during the first part (about 550 hours) of this interval. After that, the HV power supply and the DAQ systems were turned on for only about 10-12 hours a day. We excluded from the analysis data collected over the first 4 hours after each switch-on to allow the system to reach stability.
The results using the -PMT for the two different 25 h sets of data look very similar, but the recovery-period data appears slightly more stable. This may be explained by the fact that the system was somewhat affected by electrical noise, which was higher during accelerator operation. The same differences are observed in the 200 h results for the violet and blue LED’s in all three monitoring photodetectors. However, for the yellow and red LED’s (except red in PIN1) the trend is opposite. It can be explained by temperature dependence which contributes the major effect as we’ll show later. The variations over 2000 h do not differ much from those obtained for 200 h recovery data. Only the violet LED results are worse over 2000 h than 200 h in all monitoring photodetectors. This is particularly pronounced in the PIN1 data.
The sensitivity of PIN photodiodes is much better in the red region than in the blue one. Unfortunately signals from the red LED in PIN2 were out of ADC range. To monitor the red LED by PIN1 we chose a fiber with bad light transmission, thus the pulse heights in PIN1 from all other LED’s are significantly smaller than those in PIN2. As a result, the relative statistical errors of mean pulse height calculations and resulting r.m.s. was higher in PIN1.
Detailed study showed that temperature variations affect the monitoring systems stability. Figure 7(a) shows the temperature variation over first 500 hours of the recovery process as measured by one of the sensors installed in a rather hot place in back of the crystal array near the PMT’s. The room temperature changed significantly during this time interval and caused non-negligible temperature variation inside the box: the difference between maximum and minimum is 0.9∘C. Comparing the variation with time of the mean LED signals (some of them are shown in Figure 7) and temperature, we find that the violet LED signals in both PIN’s are directly proportional to the temperature, while the blue LED signal in PIN2, the red LED signal in the -PMT and the yellow LED signals in all monitoring photodetectors are inversely proportional to the temperature. No evident dependencies on temperature were found for the violet and blue signals in the -PMT, or the blue and red signals in PIN1.
Since we didn’t have temperature sensors installed near the LED pulser, the reference
PMT and PIN’s, dependence of the particular photodetector output signal on its own
temperature cannot be obtained.
Nevertheless, it is possible to correct for the effect of the temperature variations, since
all the sensors inside the box gave similar curves of the temperature behavior with time.
For this purpose we plotted dependencies of the output signals in the referenced
photodetectors on temperature measured by one of the thermo-sensors, fitted them by straight
lines and found the linear fit coefficients. After that we plotted the long-term stability
histograms with correction for the temperature variation using obtained coefficients.
Figure 8 illustrates the results of
applying such correction for the red LED mean amplitude distribution measured by the -PMT.
Histograms 8(a) and 8(b) represent the first 500 hours of the
recovery process, while 8(c) and 8(d) are the distributions
obtained over 2000 hours. It is clear that the temperature is
the major factor in the instability of the red LED signal.
After applying the correction for the
temperature variation the r.m.s. has been improved by the factor of four.
It is interesting that signal from the same LED measured by PIN1 didn’t depend
on temperature. There are several possible explanations of this effect:
1) saturation of electronics;
2) the red LED and PIN1 don’t depend on temperature;
3) the red LED and PIN1 in the red region have opposite temperature coefficients
and compensate each other.
The linearity of electronics was checked and confirmed.
It is known from the Kingbright LED data sheets [7], that light
intensities of the violet, yellow and red LED’s have negative temperature coefficients.
Therefore the last hypothesis seems to be the most reasonable. Also it might explain,
why the violet LED signals in both PIN’s behave in opposite manner compared to other
color LED’s: temperature coefficient of the PIN in violet region is greater than that
of the violet LED and has opposite sign.

The r.m.s. values of mean signal distributions, corrected for temperature variations, are presented in Table 2. The results are given only for those combinations LED – photodetector that showed temperature dependencies.
| -PMT | PIN1 | PIN2 | |||||||||
|---|---|---|---|---|---|---|---|---|---|---|---|
| violet | blue | yellow | red | violet | blue | yellow | red | violet | blue | yellow | |
| 200 h | - | - | 0.37 | 0.21 | 0.55 | - | 0.27 | - | 0.28 | 0.42 | 0.22 |
| - | - | 0.29 | 0.16 | 0.43 | - | 0.23 | - | 0.24 | 0.13 | 0.19 | |
| 2000 h | - | - | 0.29 | 0.17 | 0.72 | - | 0.29 | - | 0.37 | 0.34 | 0.26 |
6 Summary
A light monitoring system with four LEDs of different wavelengths has been designed for the BTeV lead tungstate electromagnetic calorimeter prototype and assembled and tested in a test-beam at Protvino. The system provided an individual check of each prototype channel by monitoring the PMT’s gain variation and crystals transparency change due to the beam irradiation.
Each color LED was fed to the crystal-PMT combination using a light fiber. In addition, the LED’s were connected to two PIN photodiodes and a PMT with calibrated light source placed on its window, to provide reference signals. We have analyzed the stability of the signals produced by each combination LED – monitoring photodetector for several time intervals of different duration. This analysis allowed us to determine, which photodetector gives the most stable reference signal for any particular LED. The best combinations were stable within:
- •
over one day;
- •
over one week and longer (up to 3 months).
Variations of temperature were found to be the most important factor which affected the monitoring system performance. The correction for temperature was included in the off-line analysis in order to estimate the long-term stability of the system in condition of stable temperature. This correction decreased the r.m.s. instability to over several months.
The system completely satisfies our demands on stability for the methodical tests of crystals radiation hardness. It allows us to perform measurements with an accuracy of over a few months. Moreover, the 24-hour system performance has already exceeded the requirements for BTeV. We are going to design an LED monitoring system for the BTeV EMCAL with the required long-term stability of over a week using the same technical solution in the part of LED driver. Special care will be put in the choice of LED’s and monitoring photodiodes as well as the good temperature stabilization of the system.
7 Acknowledgments
We thank the IHEP management for providing us infrastructure support and accelerator time. We thank Sten Hansen for developing and producing the PMT amplifiers for our studies. Special thanks to Fermilab for providing equipment for data acquisition. This work was partially supported by the U.S. National Science Foundation and the Department of Energy as well as the Russian Foundation for Basic Research grant 02-02-39008.
References
- [1] A. Kulyavtsev et al., “Proposal for an Experiment to Measure Mixing, CP Violation and Rare Decays in Charm and Beauty Particle Decays at the Fermilab Collider - BTeV,” May 2000; G. Y. Drobychev et al., “Update to Proposal for an Experiment to Measure Mixing, CP Violation and Rare Decays in Charm and Beauty Particle Decays at the Fermilab Collider - BTeV,” March 2002. See http://www-btev.fnal.gov/public/hep/general/proposal/index.shtml .
- [2] V.A.Batarin et al., Development of a Momentum Determined Electron Beam in the 1–45 GeV Range, Nucl. Instrum. and Meth. A510(2003), 211-218; e-Print ArXiv hep-ex/0208012.
- [3] V.A.Batarin et al., Precision Measurement of Energy and Position Resolutions of the BTeV Electromagnetic Calorimeter Prototype, Nucl. Instrum. and Meth. A510(2003), 248–261; e-Print ArXiv hep-ex/0209055.
- [4] V.A.Batarin et al., Study of Radiation Damage in Lead Tungstate Crystals Using Intense High Energy Beams, Nucl. Instrum. and Meth. A512(2003), 484–501; e-Print ArXiv hep-ex/0210011.
- [5]
E.Auffray, Results on different measurements on Endcap
crystals (2368-2467) made in RC CERN/lab27, CERN, CMS, in: Minutes
of the Detector Performance Group meeting on June 11, 2002.
E.Auffray et al., Comparison of different irradiation procedures for recently optimized russian PbWO4 crystals, CERN, CMS NOTE 98/069 (1998). - [6] V.A.Kachanov et al., Light source for energy stabilization of calorimeter detectors based on photodetectors, Nucl. Instrum. and Meth. A314(1992), 215–218.
- [7] http://www.us.kingbright.com