Comment on ”Scaling of Atmosphere and Ocean Temperature Correlations in Observations and Climate Models”
In a recent Letter [1], Fraedrich and Blender (FB) studied the scaling of atmosphere and ocean temperature. They analyzed the fluctuation functions of monthly temperature records (mostly from grid data) by using the detrended fluctuation analysis (DFA2) and claim that the scaling exponent over the inner continents is equal to , being characteristic of uncorrelated random sequences. Here we show that this statement is (i) not supported by their own analysis and (ii) disagrees with the analysis of the daily observational data from which the grid monthly data have been derived. We conclude that also for the inner continents, the exponent is between and , similar as for the coastline-stations.
(i) Figure 1a in [1] shows the representative results of FB for for the inner continental site of Krasnojarsk (observational, grid and model data). Close inspection of the curves shows that none of the observational data approaches the exponent 0.5, but rather yield exponents close to 0.6 or above.

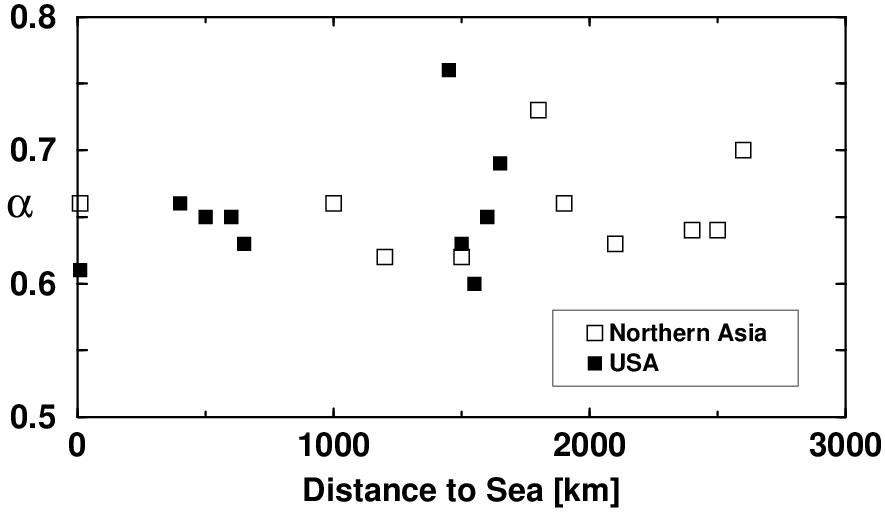
(ii) Figure 1 shows representative results of (DFA2) obtained from daily observational records, for 18 inner continental sites in North America and Asia, where the stations are between 400 and 2600 km away from the ocean. For comparison, we also show the results for two coastline stations. The maximum s-value in each curve is below one quarter of the length of the corresponding record. To facilitate the evaluation of the data, we have divided by . A plateau now indicates loss of correlations. One can see clearly that none of the curves approaches a plateau, i. e. an exponent is never seen. All asymptotic slopes have values above . The mean value of , averaged over all innercontinental stations, is 0.65 . There is no remarkable difference between coastline and inner continental stations. Figure 2 shows the dependence of on the shortest distance to the oceans. There is no tendency towards a lower exponent at larger distances.
Finally, we like to comment on the claim that for sea surface temperatures. As has been shown in [2], there is a remarkable crossover at about 1 year in the sea surface temperatures: At small scales, the exponent is significantly larger than 1, , while at large time scales is between and , with the average at .
This work has been supported by the Deutsche Forschungsgemeinschaft and the
Israeli Science Foundation.
A. Bunde1, J. F. Eichner1, S. Havlin2, E. Koscielny-Bunde1,3,
H. J. Schellnhuber3,4, and D. Vjushin2
1 Institut für Theoretische Physik III,
Universität Giessen, D-35392 Giessen, Germany
2 Minerva Center and Department of Physics,
Bar-Ilan University, Ramat-Gan 52900, Israel
3 Potsdam Institute for Climate Impact Research, D-14412 Potsdam, Germany
4 Tyndall Center for Climate Change Research, Norwich, NR4 7JD, England
PACS numbers: 92.10.Fj 89,75,DA 92.70.Gt
References
- [1] K. Fraedrich and R. Blender, Phys. Rev. Lett. 90, 108501 (2003)
- [2] R. A. Monetti, S. Havlin, and A. Bunde, Physica A 320, 581 (2003)