The Effects of Implementation Delay on Decision-Making Under Uncertainty
Abstract
In this paper, we accomplish two objectives: First, we provide a
new mathematical characterization of the value function for
impulse control problems with implementation delay and present a
direct solution method that differs from its counterparts that use
quasi-variational inequalities. Our method is direct, in the sense
that we do not have to guess the form of the solution and we do
not have to prove that the conjectured solution satisfies
conditions of a verification lemma. Second, by employing this
direct solution method, we solve two examples that involve
decision delays: an exchange rate intervention problem and a
problem of labor force optimization.
Key Words: Optimal stopping, Impulse Control,
Implementation Delay, Firing and Hiring Decisions.
AMS
Subject Classification (2000): Primary 93E20; Secondary 60J60.
JEL Classification: E24, E52
1 Introduction
Implementation delays occur naturally in decision-making problems. Many corporations face regulatory delays, which need to be taken into account when the corporations make decisions under uncertainty. A decision made will be carried out only after certain amount of time elapses, for example, due to regulatory reasons. The decision involves optimally exercising a real option or optimally manipulating (with some associated cost) a state variable, which is the source of uncertainty. Several problems that fit into this framework can be found in the literature: The work of Bar-Ilan and Strange [6] constitutes the first study considering how delays affect rational investment behavior. Keppo and Peura [17] consider the decision making problem a bank has to solve when it is faced with a minimum capital requirement, a random income, and delayed (and costly) recapitalization. The bank’s problem is to determine when to raise capital from its shareholders and the amount to be raised, given that this transaction requires a heavy preparatory work, which causes delay. Bar-Ilan and Strange [7] consider (irreversible) sequential (2 stage) investment decision problems given two sources of delay: one due to market analysis in the first stage and the other due to construction of a production facility in the second stage. In each stage the firm’s problem is to decide whether to continue entering into the market (of that product) or to abandon it. See also Subramanian and Jarrow [24] who consider the problem of a trader (who is not a price taker) who wants to liquidate her position and encounters execution delays in an illiquid market. Alvarez and Keppo [3] study the impact of delivery lags on irreversible investment demand under revenue uncertainty. Øksendal et. al. [20], [15] consider the classical stochastic control of stochastic delays systems.
The problem of finding an optimal decision (in the presence of delays) can be characterized as a stochastic impulse control problem or an optimal stopping problem. In the papers cited above the impulse control problem or the optimal stopping problem were solved by using a system of quasi-variational inequalities. (See e.g. Bensoussan and Lions [8] and Øksendal and Sulem [21] for the relationship between control problems and quasi-variational inequalities.) In a different approach, Øksendal and Sulem [22] solve a version of delay problems, in which the controller decides on the magnitude of control at the time of decision-making before any delay (the decision is implemented after some delay). They convert the optimal impulse control problem with delayed reaction into a no-delay optimal stopping/impulse control problem. Note that choosing the control in this way introduces strong path dependence of the controlled process.
Here, we solve the impulse control problems with delays directly and the magnitude of the impulses are chosen at the time of action, not at the time of decision-making, by providing a new characterization of the value function. The controlled process is a non-Markov process in this case, too, since depending on when a point in the state space is reached, it has different roles. But the controlled process in this case regenerates after a decision is implemented, and the value of the state process during the delay time depends on the past only through the value of the state process at the time of decision-making. We will only consider the threshold and band policies in this paper, since we expect that the non-Markovian structure will make finding the optimal solution much more difficult if we allow more general strategies. For example, because of the lack of Strong Markov property, we were unable to prove the concavity properties of the value function when the admissible strategies were a superset of band or threshold strategies.
Our results rely on the works of Dynkin [13], [14] (see e.g. Theorem 16.4) and Dayanik and Karatzas [12], who give a general characterization of optimal stopping times of one dimensional diffusions, and on the work of Dayanik and Egami [11], who characterize the value function of stochastic impulse control problems. Our method is direct, in the sense that we do not have to guess the form of the solution and we do not have to prove that the conjectured solution satisfies conditions of a verification lemma as all the methods in the above literature do. Other works similar in vein to ours that provide different characterizations of the value function of impulse/singular control problems for one dimensional diffusions rather than solving variational inequalities are Alvarez [1], [2]; Alvarez and Virtanen [4]; and Weerasighe [25].
We give a geometric characterization of the value function, specifically, we find very general conditions on the reward function and the coefficients of the underlying diffusion under which the value function can be linearized (in the continuation region) after a suitable transformation. Then the problem of determining the value function is equivalent to determining the slope (if admissible strategies are threshold strategies), the slope and the intercept (if admissible strategies are band strategies) from first order conditions. To show the efficacy of our methodology we apply it to an optimization problem of a central bank that needs to carry out exchange rate intervention (this is the Krugman model of interest rates considered, among others, in Mundaca and Øksendal [18]) when there is delay in the implementation of its decisions. Also, using our methodology we will find optimal hiring and firing decisions of a firm that faces stochastic demand and has to conform to regulatory delays. Other works that deal with labor optimization problems are Bentolila and Bertola [9], and Shepp and Shiryaev [23] who model firing and hiring decisions as singular controls. It is also worth pointing out that an impulse control study when the underlying process is a superposition of a Brownian motion and a compound Poisson process (when the jumps are of phase type) is given by [5] with management of foreign exchange reserves and labor optimization in mind.
The rest of the paper is organized as follows: In Section 2, we give a characterization of general threshold strategies with implementation delays and provide an easily implemented algorithm to find the value function and the optimal control. To illustrate our methodology, we will solve a delayed version of an example from Mundaca and Øksendal [18] (also see Øksendal [19]). A similar problem to the one we consider was solved in [22] in which the controller decides on the magnitude of control at the time of decision-making before any delay. In Section 3, we work with a band policy. In this section we work on the specific example of optimal hiring and firing decisions rather than providing a general characterization for the value function. We again provide an easily implemented algorithm to find the optimal control. Finally, we conclude in Section 4.
2 Optimal Threshold Strategies
Let be a complete probability space with a standard Brownian motion and consider the diffusion process with state pace and dynamics
| (2.1) |
for some Borel functions and . (We assume that the functions and are sufficiently regular so that (2.1) makes sense.) Here we take and to be a natural boundaries. We use “0” as the superscript to indicate that is the uncontrolled process. We denote the infinitesimal generator of by and consider the ODE . This equation has two fundamental solutions, and . We set to be the increasing and to be the decreasing solution. and because both and are natural boundaries. First, we define an increasing function
| (2.2) |
Next, following [14], p. 238, we define concavity of a function with respect as follows: A real valued function is called -concave on if, for every and ,
Suppose that at any time and any state , we can intervene and give the system an impulse . Once the system gets intervened, the point moves from to with associated reward and cost. An impulse control for the system is a double sequence,
| (2.3) |
where is an increasing sequence of -stopping times such that , and , are measurable random variables representing impulses exercised at the corresponding intervention times with for all where is a given set of admissible impulse values. The controlled process until the first intervention time is described as follows:
| (2.4) |
with some mapping . We consider the following performance measure associated with (= a collection of admissible strategies),
| (2.5) |
The objective (we shall call it the delay problem) is to find the optimal strategy (if it exists) and the value function:
| (2.6) |
Remark 2.1.
The controlled process is not a Markov process, since depending on whether a point is reached in the time interval or not, that point has different roles. (The controlled process might jump or not at a given point depending on how it reaches to that point.) However, 1) the process regenerates at times , and 2) the value of the process at time , , depends on the information up to , , only through the value of the process at time , . Instead of finding the optimal strategy for a non-Markov process, we will use the hints of Markovian features to find the optimal threshold strategy (see Assumption 2.1).
The following is a standing assumption in Sections 2.1 and 2.2.
Assumption 2.1.
We make the following assumptions in this section:
- (a)
We will assume that the set of admissible strategies is limited to threshold strategies. These strategies are determined by specifying two numbers and as follows: At the time the uncontrolled process hits level , the controller decides to reduce the level of the process from to , through an intervention, and save the continuously incurred cost (which is high if the process is at a high level). But the implementation of this decision is subject to a delay of units of time. Note that might be less than . In that case the impulse applied increases the value of the process. Otherwise, if the value of the process is greater than at time then the intervention reduces the level of the process to .
- (b)
The running cost function is a continuous functions that satisfies
(2.7) - (c)
For any point , we assume
(2.8) We make this assumption to account for the fixed cost of making an intervention.
2.1 Characterization of the Value Function
In this section, we will show that when we apply a suitable transformation to the value function corresponding to a particular threshold strategy (that is identified by a pair ), the transformed value function is linear on . This characterization will become important in determining the optimal threshold strategy in the next section.
Let us define
| (2.9) |
The following identity, which can be derived using the Strong Markov Property of , will come handy in a couple of computations below:
| (2.10) |
for any stopping time under the assumption (2.7).
Now, let us simplify by splitting the terms in (2.5). We can write the first terms (the term with the integral) as
| (2.11) |
while the second term can be developed as
where we used with the shift operator in the second equality. Here, we relied on Remark 2.1. Combining the two terms, we can write (2.5) as
We define
| (2.12) |
By adding and subtracting to and from the first term we obtain
| (2.13) |
in which
| (2.14) |
Since with and the post intervention point by
| (2.15) |
From Remark 2.1
| (2.16) |
Evaluating at , we obtain . Therefore, (2.13) becomes
Hence we have finally
| (2.17) |
where the second equality is obtained when we plug in (2.13).
Using appropriate boundary conditions one can solve and obtain
| (2.18) |
for where and (see e.g. Dayanik and Karatzas [12]). By defining
| (2.19) |
equation (2.17) becomes
| (2.20) |
We should note that and
| (2.21) |
for any . For more detailed mathematical meaning of this value , we refer the reader to Dayanik and Karatzas[12]. We have now established that is a linear function in the transformed “continuation region”.
2.2 An Algorithm to Compute the Value Function
Let us denote
| (2.22) |
and transform this function by
| (2.23) |
First stage: For a given pair we can determine (2.17) from the linear characterization (2.20). On we will find (in which the slope is to be determined) from
| (2.24) |
can be determined as
| (2.25) |
Sometimes we will refer to as , when it becomes necessary to emphasize the dependence on . The function can be written as
| (2.26) |
Note that for . Henceforth, to emphasize the dependence on the pair we will write for the function .
Second stage: Our purpose in this section is to determine
| (2.27) |
to determine the constant
| (2.28) |
if there exists one.
Let us fix and treat as a function of parametrized by a.
Lemma 2.1.
Proof.
To find the optimal (given ) we solve the non-linear and implicit equation (2.29). Under certain assumptions on the function , this equation has a unique solution as we show below.
Remark 2.2.
On , the function is given by
| (2.30) |
The right derivative of at is given by
| (2.31) |
Therefore, (2.29) implies that the left and the right derivative of (recall that for ) at are equal (smooth fit).
Let us define
| (2.32) |
The next lemma shows that (2.32) is well-defined. Below we show that under certain assumptions on this function is equal to .
Lemma 2.2.
Assume that
| (2.33) |
for some . Let us introduce a family of value functions parameterized by as
| (2.34) |
here is the set of all stopping times of the filtration natural filtration of . Then there exists a unique such that .
Proof.
Let us denote
| (2.35) |
Consider the function . Our aim is to show that there exists a fixed point to this function. Let us consider first. Because (2.33) is satisfied we have that . As increases, increases monotonically, by the right hand side of (2.34). Now, Lemma 5.1 implies that for ,
| (2.36) |
for any . Note that for all . However, since has less than linear growth in as demonstrated by (2.36) we can see that there is a certain large enough such that for . This implies however
where the inequality is due to the assumption (2.8). For this , we have .
Since is continuous, which follows from the fact that this function is convex, and increasing, and implies that crosses the line .
∎
Lemma 2.3.
Assume that
| (2.37) |
Let us define where
| (2.38) |
Then (2.35) is the smallest non-negative concave majorant of that passes through .
Lemma 2.4.
Proof.
Proof.
It follows from Lemma 2.4 that is -excessive. Also, observe from (2.32) that
| (2.40) |
where is as in (2.37). Let be an admissible control and let . Without loss of generality we will assume that , because otherwise the corresponding strategy will have a lower value function associated to it. Since is excessive,
| (2.41) |
for all . Then
| (2.42) |
in which the inequality follows from (2.40) and the fact that is non-negative. Now, using the monotone convergence theorem
| (2.43) |
The third inequality follows from Remark 2.1). The fourth inequality can be derived from (2.11). The last equality follows from (2.12). Now taking to supremum over , we obtain (2.39). ∎
Lemma 2.6.
Proof.
Since is concave, in (2.38) is also concave on . The assumption in (2.44) implies that the smallest concave majorant in (2.35) is linear on for a unique and is tangential to at and coincides with on . Together with Lemma 2.2 this implies that there exists a unique such that equations (2.30) and (2.31) are satisfied when is replaced by and is replaced by . Note that corresponds to a strategy . That is, if we start with and transform it via (2.19) we get . On the other hand, using (2.35) with by substituting we have that , . This let’s us conclude that , . We see that the unique in the claim of the proposition is . ∎
Proposition 2.7.
Proof.
Note that when the assumptions of Proposition 2.7 hold, the optimal threshold strategy is described by a single open interval in the state space of the controlled process. The conditions for the existence and uniqueness of the optimal interval are specified, essentially by the conditions on total reward function associated with one intervention from to (see (2.14), (2.23) ) and drift and volatility of the underlying diffusion as the function depends on them that appears in (2.23) depends on them.
Third stage: Now, we let vary and choose that maximizes and also find . Finally, we obtain the value function given in (2.6) by .
2.3 Example: Optimal Exchange Rate Intervention When There is Delay
To illustrate the procedure of solving impulse control problems with delay, we take an example from Mundaca and Øksendal [18] (also see Øksendal [19]) that considers the following foreign exchange rate intervention problem:
| (2.45) |
where , in which is a standard Brownian motion. Here, the superscript 0 is to indicate that the dynamics in consideration are of the uncontrolled state variable. In (2.45), and are constants representing the cost of making an intervention. The problem without delays are solved by [19] through quasi-variational inequalities and by [11] using a direct characterization of the value function. In this problem, the Brownian motion represents the exchange rate of currency and the impulse control represents the interventions the central bank makes in order to keep the exchange rate in a given target window. At time , such that , the central bank makes a commitment to reduce the exchange rate from to , which is implemented units of time later. During the time interval the central bank does not make any other interventions. units later if the exchange rate is still greater than , then the central bank reduces the exchange rate from to and pays a cost of . On the other hand, if units of time later if the exchange rate is less than , the central bank chooses increases the exchange rate to at a cost of . This is a one-sided impulse control problem, in the sense that a control is triggered only if and there has not been any previous action in the interval .
The problem is to minimize the expected total discounted cost over all threshold strategies.
| (2.46) |
A similar version of this problem is analyzed by Øksendal and Sulem [22], in which they take the controls for all . (This introduces path dependence since the value of is partially determined by .)
Instead of solving a minimization problem of (2.46), we will solve
and recover the value function by . (Here, the supremum is taken over all the threshold strategies.) The continuous cost rate is and the intervention cost is in our terminology. By solving the equation , we find that and . Hence and . Using Fubini’s theorem we can calculate explicitly as:
We shall follow the procedure described in the last section: Let us fix and consider
| (2.47) | ||||
The left boundary is natural for a Brownian motion and, for any ,
It follows that passes through . (See Dayanik and Karatzas[12] Proposition 5.12.)
Proof.
See Appendix. ∎
Using the algorithm we described in Section 2.2 we find the optimal . Going back to the original space we get
on . To get , we add back ,
Finally, flipping the sign we obtain the optimal cost function as
| (2.48) |
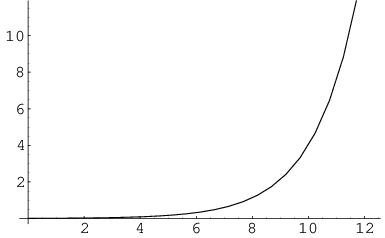
Figure 1 is obtained when the parameters are chosen to be . We found the solution triplet to be . The optimal cost function without delay, for the same parameters, has the solution triplet . The continuation region shifts to the left with delay (it shrinks from to ), and the central bank acts more aggressively when it encounters delays (see Figure 1 - (c)).

(a)

(b)

(c)
(d)
3 Firing Costs and Labor Demand: Optimal Band Strategies
In this section, we will improve on the techniques of the previous section in order to study an impulse control corresponding to band policies when there are implementation delays. In particular, we will concentrate our attention on a specific example, which is of practical interest. We will find optimal hiring and firing decisions of a firm that faces stochastic demand and has to conform to regulatory delays when it is firing employees.
Recently, General Motors Corporation (GM) has decided to lay off 25,000 of its work force to cut back on its production and administrative costs. However ‘‘GM’s UAW (United Auto Workers) contract essentially forces it to pay union employees during the life of the contract even if hourly workers are laid off and their plants are closed. But those protections only run through September 2007, when the current four-year pact with the union ends. GM spokesman Ed Snyder said the automaker has yet to reach any agreement with the UAW yet on the nature or the manner of the work force reduction.” 22 2 Source: June 7, 2005 CNN Money, “GM to cut 25,000 jobs” by Chris Isidore, http://money.cnn.com/2005/06/07/ news/fortune500/gm_closings/ This is a typical example of a firing cost and implementation delay a corporation faces when the workers are unionized. Another example of firing delay caused by government regulations in Europe (see e.g. [9]).
Bentolila and Bertola [9] address the issue of costly hiring and firing and its effects on unemployment rate in Europe using singular stochastic control. Here, we are solving an impulse control problem since we are also taking fixed cost of labor adjustments into account. But our main purpose is to measure the effects on firing delay in decisions of firms. As we shall see, it turns out that the controlled state variable is not Markov, therefore we will focus our attention completely on the band policies (which we will define shortly) rather than trying to find the best impulse control policy. Our method of solving impulse control problem differs from its counterparts that use quasi-variational inequalities since we give a direct characterization of the value function as a linear function in the continuation region without having to guess the form of the solution and without having to prove that the conjectured solution satisfies conditions of a verification lemma.
3.1 Problem setup
As in [9]33 3 The set up of Bentolila and Bertola [9] was brought to our attention by Keppo and Maull. In the INFORMS Annual Meeting in 2004, Keppo and Maull presented their partial results on the hiring and firing decisions of firms which they obtained by solving quasi-variational inequalities., we will consider a firm with a linear production technology. In particular the quantity sold is , , in which is the labor at time . The selling price at time , , of the product is determined from
| (3.1) |
in which indexes the position of the direct demand curve whose dynamics follow
| (3.2) |
with a constant . In equation (3.1) the quantity is the firm’s monopoly power. Let us denote the filtration generated by the demand process by . We will make the following assumption to guarantee that (3.2) has a unique strong solution. We assume that is bounded and adapted to the filtration of the Brownian motion .
In our framework, if the firm produces excess products because of the excess labor, the products produced are still all sold but at a cheaper price. The firm pays a wage, , to its workers, therefore the net rate of profit that the firm makes at time is given by
When the workers quit voluntarily, the firm bears no firing costs and we assume that the workers quit at rate , that is, without any intervention from the management the labor force follows the dynamics
| (3.3) |
Here, as in the previous section, the superscript 0 indicates that there are no controls applied. The firm makes commitments to change its labor force at times and . At time the firm makes a commitment to increase its labor force (which is immediately implemented), and at time it makes a commitment to decrease its labor force, which is implemented units of time later. During the time interval the firm makes no commitments to change its labor force. Note that although at time the firm decided to decrease its labor force, the labor force itself might move to very low levels following the dynamics (3.3), therefore at time the firm may end up hiring to move keep the production level up. However, if the labor force level is still very high at time , then the firm ends up firing. Here, represents the regulatory delays a firm faces when it is cutting off its work force.
The labor adjustments come at a cost: At time the firm increases the labor by (Here, for the sake of brevity we are taking the -algebras as a collection of mappings.) to , then the associated cost is
At time , the firm makes a commitment to decrease the labor at time . If it ends up decreasing the labor force by to , then the associated cost is quantified as
which depends on the amount of labor force to be fired and the level of the total labor force as well. The latter component of costs is based on the following observations: When a corporation decides who to be fired or which division to be restructured, administrative costs will become larger in proportion to the size of the total labor force since the firm’s operations are closely knitted among various divisions.
On the other hand as we discussed above if the labor force itself moves to very low levels itself during the units of time, at time the firm may end up hiring (in this case ) to keep the production up at the cost of
for some positive constants and . This cost becomes negligible as becomes small because in that case the work force does not change much by itself. So the controls of the firm are of the form
where and are two increasing sequences of stopping times of the filtration . and for any there exists no such that . The magnitudes of the impulses satisfy and for all . We call these type of controls admissible and we will denote the set of all admissible controls by . To each control we associate a profit function of the form
| (3.4) |
which incorporates the profit and cost structure we described so far. Here is a subjective rate of return that the firm uses to discount its future profits. In fact if , then taking no action is optimal as we will point out below. Under the measure , we have that and almost surely.
The objective of the company is then to maximize its profits by choosing the best possible strategy such that
| (3.5) |
if the optimal strategy exists. Hereafter, we will refer to as the value function.
It looks as if the control problem defined in (3.5) involves two state variables, namely the demand and the labor force . Recall that we have no control over the demand but we can control the labor force by making hires and fires. But the only source of randomness is the demand process. In the sequel we will show that the optimal control problem (3.5) involves only one state variable. On denoting , and the absolute changes in labor per unit of demand by and , we can write the the profit function as
| (3.6) |
Let us introduce a new probability measure by
| (3.7) |
for every . Using the representation of the profit function , we can write it as
| (3.8) |
in which
| (3.9) |
where is the expectation under given that . Here, with slight abuse of notation, on the right-hand-side of (3.8), we denoted
is a control that is applied to the process . The controls here are such that and . Again as before and are two increasing sequence of stopping times. We also assume that and that for any there exists no such that . With another slight abuse of notation we will denote the admissible set of controls we described here also by . As a result of the developments in the last part of this section we see that the process is the sufficient statistic of the problem in (3.5). In fact we can write the value function as
| (3.10) |
Under the measure the dynamics of the process, when there are no impulses applied follows
| (3.11) |
where is a Wiener process under measure . Here, as before, the superscript 0 indicates that there are no controls/impulses applied.
3.2 Solution
Although the controlled process is not a Markov process, because depending on whether the process reaches a point during the interval or not, that point has different roles. That is, how the process reaches to a particular point (path information) affects how the process will continue from this point. However, the process regenerates at times and the value of the process at time , , depends on the information up to , , only through the value of the process at time , . Therefore, as we did in Section 2.1, assuming there is no history prior to time 0, i.e. is a trivial sigma-algebra, we can develop
| (3.12) |
| (3.13) |
| (3.14) |
On denoting , we can write
| (3.15) |
in which
| (3.16) |
In the rest of this section, we will analyze the following double sided threshold strategy (band policy) of the following form: 1) Whenever the marginal revenue product of labor hits level , the firm makes a commitment to bring the marginal revenue product of labor to . This may be achieved by firing employees if marginal revenue product of labor is still greater than after the delay. However, it is possible that after the delay the marginal revenue product of labor will be less than . In this case, the firm makes hires. 2) Whenever the marginal revenue product of labor hits level the firm increases it to (by hiring new employees). We will characterize the value function corresponding to an arbitrary band policy.
For a band policy we described above and , and
Here, for any , . Let us introduce
| (3.17) |
in which
| (3.18) |
From (3.15)-(3.18) it can be seen that
| (3.19) |
in which
| (3.20) |
Let us denote the fundamental solutions of , by (increasing) and (decreasing), and introduce . Using (2.18), on the interval we can write as
| (3.21) |
Then, , satisfies
| (3.22) |
Using the linear characterization (in the continuation region) of the band policies in (3.22), the following algorithm first determines the function for an arbitrary band policy and goes onto finding the best band policy.
First, let us define
| (3.23) |
Algorithm:
- 1.
For a given band policy which is characterized by the quadruplet such that , we can find the value function in (3.19) using the linear characterization in (3.22). On [F(p), F(d)] we will find (in which the slope and the intercept are to be determined) from
(3.24) and are determined as
(3.25) Now can be written as
(3.26) From this last expression, we observe that for .
- 2.
Note that and are functions of parametrized by . We will find an optimal pair given by equating the gradient of the function with respect to to be zero. Now, differentiating the first equation in (3.24) with respect to d, and the second with respect to , and evaluating them at we obtain
(3.27) in which and are given by (3.25). To find the optimal (given ) we solve the non-linear and implicit system of equations in (3.27).
Remark 3.1.
On the function is given by
(3.28) and its left derivative at F(p), , is given by
(3.29) Therefore, the equation in (3.27) in fact implies that the left and the right derivative of at are equal (smooth fit). (Recall that on .) Similarly, the second equation in (3.27) implies that the left and the right derivative of at are equal. This can be also expressed as: ” shifted by an appropriate amount is tangential to the line ” at .
- 3.
Next, we vary and to find the best band policy. Such a search can easily carried out in Mathematica.
To obtain an explicit expression for in (3.14) and in (3.20) we make the following assumption. We will assume that (a constant) in (3.2). Now, we can obtain in (3.14) (see Appendix) explicitly as
| (3.30) |
Note that if , then , which implies that taking no action is optimal. The assumption in Proposition 3.1 that is for technical reasons, however it is not very restrictive. denotes the present value of the total wage that a firm pays per unit of marginal revenue product of labor and it should be greater than costs associated with one time hiring or firing of one unit of marginal revenue product of labor. Using (3.30) we can also calculate in (3.20) explicitly as (see Appendix)
| (3.31) |
in which
| (3.32) |
Here the function , , denotes the cumulative distribution function of an (standard Gaussian) random variable. The infinitesimal generator of the process is , acting on smooth test functions . Therefore the fundamental solutions of the equation are
| (3.33) |
in which and are the roots of the following quadratic equation (in terms of )
| (3.34) |
The next proposition justifies the second stage of our algorithm.
Proposition 3.1.
For a given , such that there exits a unique solution to the system of equations (3.27) if we further assume that . Moreover, .
Proof.
The proof is similar to that of Proposition 2.8. Also, see the remark below. ∎
Remark 3.2.
Our results in this section can be generalized to the two-sided control of any one-dimensional diffusion and penalty functions satisfying the conditions in Remark 3.2 are satisfied. It is worth pointing out that Weeransinghe [25] has studied the two-sided bounded variation control within the framework of singular stochastic control of linear diffusions for a large class of cost functions by using of the functional relationship between the value function of optimal stopping and that of singular stochastic control (see e.g. Karatzas and Shreve [16]).

(a)

(b)

(c)

(d)

(e)
(f)

(g)

(h)
3.3 Numerical Example
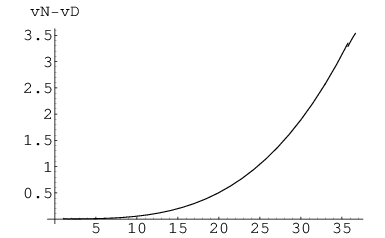
In this section, we will give a numerical example for the labor problem with and without delay. We select the parameters as , , , and . The results we obtain are summarized in the following table:
| 2.125 | 7.240 | 35.728 | ||||
| 0.0001725 | 38.1597 | 1.0661 | 2.100 | 7.120 | 36.640 |
Both the slope and the intercept are greater in the no-delay case and therefore, the value function corresponding to no-delay problem will dominate that to delay problem . On the right boundary, we have and on the left boundary pair has shifted to the left with delay. As a result, the continuation region has expanded with delay: . An explanations for this phenomenon can be made through the relative size of costs of firing and hiring, the size of delay parameter, the shape of function, etc. In our example, the firing cost is relatively larger than hiring cost, the penalty of firing becomes smaller with delay (than without delay) which encourages the controller not make hasty firing decisions, facing relatively large firing costs. Or since there is a chance that the process moves to the left during the delay period due to voluntary quits, this effect may help to reduce firing costs even though the decision making is postponed.
4 Conclusion
In this paper we give a new characterization of the value function of one-sided and two-sided impulse control problems with implementation delays. We also provided easily implemented algorithms to find out the optimal control and the value function. Our methodology bypasses the need to guess the form of solution of quasi-variational inequalities and prove that this solution satisfies a verification lemma. Since our method directly finds the value function, we believe that this method can solve a larger set of problems than just with quasi-variational inequalities. Indeed, we applied our results to solving some specific examples. As an important application of a two-sided impulse control problem with decision delays we found out the optimal hiring and firing decisions of a firm facing regulatory delays and stochastic demand.
Here we considered a problem in which the decision maker needs to decide whether to take action and, after some delay, needs to decide the magnitude of her action. In the future, we will consider problems in which the decision maker takes action and waits that action to be implemented. We will also consider a general characterization of the value function and the optimal controls when the decision delay is not a constant but it depends on the magnitude of the action taken as in [24] or it depends on the value of the state variable that is controlled as in [3].
Acknowledgment
We are grateful to the the referee for his/her detailed comments that helped us improve the manuscript.
5 Appendix
5.1 Derivations of (3.14) and (3.31)
Using (3.11) we can write (3.14) as
| (5.1) |
from which we obtain (3.30) under the assumption that . Here the second inequality follows from the Fubini’s theorem and using the Laplace transform of .
Using (3.11) and the assumption that , we compute
| (5.3) |
where or . Here the third equality follows from the Laplace transform of We will also need to compute
| (5.4) |
We will denote
in which , is an random variable. Then and . Introducing a new probability measure Q by the radon-nikodym derivative , we get
Under the measure , is and we can write in terms of as
| (5.5) |
Using (5.5), we can compute
| (5.6) |
in which is given by (3.32). We can then immediately obtain,
| (5.7) |
5.2 A Technical Lemma
Lemma 5.1.
Define
for some Borel function . Then for we have that
Proof.
See the proof of Lemma 3.3 in [11]. ∎
5.3 Proof of Proposition 2.8
The proof follows from the analysis of the function . The following remark will be helpful in the analysis that follows.
Remark 5.1.
Let us denote . If is twice-differentiable at and , then and with
| (5.8) |
with strict inequality if .
5.3.1 The Analysis of the Function in (2.47)
Let us check the sign of which is the same as the derivative of as can be observed from the first equation in (5.8). The sign of is the same as that of
| (5.9) |
Using the fact for and for sufficiently large,in this equation (for sufficiently large x) we identify the absolute value of the negative terms as , and . Since these negative terms are bounded, if we take sufficiently large value, say , the sign of (5.3.1) is positive for . Moreover, we can directly calculate to check the behavior of for a large . We also know that is negative at . On the other hand, is increasing and concave function. It follows that is an increasing function on .
To investigate the concavity of , we set
so that for every . We have if . By the second equation in (5.8), the function becomes concave eventually. Since is increasing and concave on for some and we can find a unique linear majorant to in Lemma 2.3 (the linear majorant majorizes in the continuation region and is equal to in the stopping region). The rest of the proof from Proposition 2.7.
References
- [1] L. H. R. Alvarez. A class of solvable impulse control problems. Appl. Math. and Optim., 49:265–295, 2004.
- [2] L. H. R. Alvarez. Stochastic forest stand value and optimal timber harvesting. SIAM J. Control. Optim., 42(6):1972–1993, 2004.
- [3] L. H. R. Alvarez and J. Keppo. The impact of delivery lags on irreversible investment under uncertainty. European Journal of Operational Research, 136:173–180, 2002.
- [4] L. H. R. Alvarez and J. Virtanen. A class of solvable stochastic dividend optimization problems: On the general impact of flexibility on valuation. Economic Theory, 28:373–398, 2006.
- [5] A. Bar-Ilan, D. Perry, and W. Stadje. A generalized impulse control of cash management. Journal of Economic Dynamics and Control, 28:1013–1033, 2004.
- [6] A. Bar-Ilan and W. C. Strange. Investment lags. American Economic Review, 86:610–622, 1996.
- [7] A. Bar-Ilan and W. C. Strange. A model of sequential invetment. Journal of Economic Dynamics and Control, 22:437–463, 1998.
- [8] A. Bensoussan and J. L. Lions. Impulse Control and Quasi-Variational Inequalities. Gauthier-Villars, Paris, 1982.
- [9] S. Bentolila and G. Bertola. Firing costs and labor demand: How bad is Eurosclerosis? Review of Economic Studies, 57:381–402, 1990.
- [10] A. N. Borodin and P. Salminen. Handbook of Brownian Motion Facts and Formulae. Birkhäuser, Boston, 2002.
- [11] S. Dayanik and M. Egami. Solving stochastic impulse control problems via optimal stopping for one-dimensional diffusions. preprint, www.umich.edu/egami, 2005.
- [12] S. Dayanik and I. Karatzas. On the optimal stopping problem for one-dimensional diffusions. Stochastic Processes and their Applications, 107 (2):173–212, 2003.
- [13] E. Dynkin. Optimal choice of stopping moment of a Markov process. Dokl. Akad. Nauk. SSSR, 150:238–240, 1963.
- [14] E. Dynkin. Markov processes, Volume II. Springer Verlag, Berlin, 1965.
- [15] I. Elsanosi, B. Øksendal, and A. Sulem. Some solvable stochastic control problems with delay. Stochastics and Stochastics Reports, 71:225–243, 2000.
- [16] I. Karatzas and S. E. Shreve. Connections between optimal stopping and singular stochastic control ii. reflected follower problems. SIAM J. Control Optim., 23 (3):433–451, 1985.
- [17] J. Keppo and S. Peura. Optimal bank capital with costly recapitalization. To appear in the Journal of Business, 2005.
- [18] G. Mundaca and B. Øksendal. Optimal stochastic intervention control with application to the exchange rate. Journal of Mathematical Economics, 29:225–243, 1998.
- [19] B. Øksendal. Stochastic control problems where small intervention costs have big effects. Appl. Math. Optim., 40:355–375, 1999.
- [20] B. Øksendal and A. Sulem. A Maximum Principle for optimal control of stochastic systems with delay, with applications to finance, pages 64–79. IOS Press, 2001. Optima Control and Partial Differential Equations, J.L. Menaldi et. al.(editors)).
- [21] B. Øksendal and A. Sulem. Applied stochastic controll of jump diffusions. Springer-Verlag, New York, 2005.
- [22] B. Øksendal and A. Sulem. Optimal stochastic impulse control with delayed reaction. Preprint. University of Oslo, 2005.
- [23] L. A. Shepp and A. N. Shiryaev. Hiring and firing optimally in a large corporation. Journal of Economic Dynamics and Control, 20:1523–1540, 1996.
- [24] A. Subramanian and R. A. Jarrow. The liquidity discount. Mathematical Finance, 11:447–474, 2001.
- [25] A. Weerasinghe. A bounded variation control problem for diffusion process. SIAM J. Control Optim., 44(2):389–417, 2005.