A Dynamic I/O Model for TRACON Traffic Management
Abstract
This work investigates the TRACON flow management around a major airport. Aircraft flows are analyzed through a study of TRACON trajectories records. Rerouting and queuing processes are highlighted and airport characteristics are shown as function of the number of planes in the TRACON. Then, a simple input-output TRACON queuing and landing model is proposed. This model is calibrated and validated using available TRACON data. It reproduces the same phenomenon as the real system. This model is used to show the impact of limiting the number of aircrafts in the TRACON. A limited number of aircraft does not increase delays but reduces the controller’s workload and increases safety.
1 Introduction
Airspace, especially Terminal Radar Approach Control (TRACON) area around major airports becomes more and more congested . As the concentration of aircrafts is the highest, TRACON areas are very critical areas for controllers. The objective of this paper is to present a study about the dynamics of the traffic congestion in the arrival process at a major airport. A motivation is to regulate the flows of entering aircraft in the TRACON area in order to reduce air traffic controller’s workload and to avoid control tactical difficulties. This is already the aim of the Center TRACON Automation System (CTAS)[1] that provides automation tools for planning and controlling arrival air traffic. Many traffic control techniques and tools are applied to reduce traffic congestion. Ground Delay Program (GDP) [2] is used to decrease the rate of incoming flights into an airport by delaying takeoffs, when it is projected that arrival demand will exceed capacity. For en-route control, Traffic Management Advisor (TMA) [3] and Multi-Center Traffic Management Advisor (McTMA) [4] are used to control arriving aircraft that enter the Center from an adjacent Center or depart from feeder airports within the Center. Those systems have already proven their capabilities [5]. TRACON area control can use programs such as Descent Advisers (DA) or Final Approach Spacing Tool (FAST) [6]. Finally, ground operations and efficient runway operation planning [7] can also improve landing capacities. The aim of those different layers of traffic control is to ensure an arrival flow as smooth as possible. We are interested in adjusting the density in the TRACON area and optimizing airports landing capacities by regulating the incoming traffic flow. Theoretically, runway capacities can be calculated using analytical formulas and nominal separation standards. In this paper, those capacities are determined and analyzed through available TRACON data. Then, we propose an experimental queuing model to highlight airport performance function of the demand. The airport performance is the effective landing capacity, which depends on the number of runway in use. This arrival model is based on a similarly model developed by Nicolas Puget in [8]. The model proposed is validated with San Francisco TRACON records. Finally, the model is used to show that limiting the number of aircrafts in the TRACON does not increase delays but reduces the controller’s workload and increases safety.
2 Data Presentation and Analysis
2.1 Data Source
The data used in this article were provided by San Francisco International Airport Noise Abatement Office. The data are the records of all the planes in the San Francisco Bay TRACON for the first 3 semesters of 2006.
2.2 Definitions
The focus is made on the arrival process. Hence, in this article, the term system will refer to the TRACON area which is a 50 Nm radius circle centered at Oakland Airport. The inputs to the system are the planes entering the TRACON, intending to land at SFO airport on 28L/R runways (figure 1), and the outputs are the planes actually land ing on 28L/R runways at SFO airport. 28R and 28L runway are only 750ft apart which does not allow simultaneous parallel automatic landings. Hence, if the weather is not good enough for sight landing, only one runway can be used.

Different parameters can be used to define the behavior of the system. The evolution of the outputs (planes landing) can be analyzed as a function of the inputs (planes entering the TRACON) and a function of parameters such as the number of runways in use. But we can also characterize it by the shape of planes trajectories with in the same parameters. Each plane has a different track leading to the runway. The analysis is made on 2D trajectories. For the analysis purpose, tracks can be defined as straight or rerouted. A straight track corresponds to the trajectory of a plane that could go directly from its entering point in the TRACON to the runway threshold just following the way points. A rerouted track corresponds to the trajectory of a plane that can not land directly and has to change its trajectory. It does not follow the nominal track and has to make a curved trajectory or even hippodromes (figure 2).

2.3 Data selection
The analysis presented in this paper focuses on the arrivals at San Francisco Airport. The presence of several airports (Oakland Intl Ap, San Francisco Intl At, San Jose Intl AP and many small airports) in a small perimeter such as San Francisco Bay implies dedicated routes for landing and taking off for each airport in the TRACON (figure 3). Those routes decrease the degrees of freedom to reroute planes. Moreover, for practical reasons such as fuel capacity and for financial reasons, it is required to minimize the number of waiting aircrafts and their waiting time. San Francisco International Airport (figure 1) has four runways arranged in two sets of parallel runways. The terrain configuration (presence of residential areas at west, north and south of the airport) is such that the “West” configuration is the most used in order to reduce the noise over residential areas. Actually, planes take off on 01L/R runways, departing over the bay and land on 28L/R runways, maximizing the distance over the water in order to reduce noise. We will use the planes landing in this configuration (i.e on 28L and 28R runways).
The routes for landings and takeoffs are well defined, hence we can assume there is no correlation between them: the planes flying to SFO do not interact with planes flying from or to another airport or just transiting.
The configuration of SFO airport is such that departures and landings are on separate runways. The runways are crossing but we will assume that taking off planes do not have influence on landing planes.

2.4 Radar track analysis
Each track is analyzed in order to determine whether it is a direct
track or a rerouted one. An algorithm has been developed to identify
rerouted tracks from direct tracks. The figure 4
presents the results of this algorithm on a given day of arrivals at
SFO.


Figure 4(a) presents the tracks identified as direct. Almost all the plotted tracks are pretty direct to the runway, considering the routes and way points that the airplanes must follow. Figure 4(b) presents the tracks identified as rerouted. All those tracks contain a change of direction not corresponding to the route the airplane should follow for a nominal approach. The rerouting is done either by smooth changes of trajectory, e.g S-turns, or either by important changes of trajectory, such as hippodromes (Figure 2).
2.5 Data Analysis
In this section, we investigate the evolution of the system in two different ways. One is time-based analysis and the other is aircraft-based.
2.5.1 Time based methodology
In this methodology, we divide the time in periods of fixed length during which we will count:
- •
The number of planes present in the system which corresponds to the number of planes that are, at some point of this period, in the TRACON area (figure 6(a)).
- •
The number of planes entering the system during this period.
- •
The number of planes landing during this period.
- •
The number of planes rerouted during that period.
It is to note that a same plane can be counted as present and rerouted on several time periods but enters or lands only once.
2.5.2 Time based evolution of the system
Figure (5) presents the results of the time based analysis. The time is on the abscises axis. The positive ordinates axis is a number of flight while the negative ordinates axis represents the proportion of the total number of planes in the system that is rerouted, scaled from 1 to 10. Each bar stands for a 15 minutes time period. The light blue bars represent the total number of aircrafts, the dark blue bars represent the number of planes entering the system, the red bars represent the number of rerouted planes. Yellow indicates that only one runway is in use while green stands for 2 runways.

As shown in figure 5, in case of one runway in use, the number of rerouted aircrafts increases with the number of planes in the system. As soon as the second runway opens, the number of rerouted aircrafts drops. In the two runways configuration, even a pick of incoming aircrafts or a large number of aircrafts present in the TRACON does not increase significantly the number of rerouted planes. This methodology is more developed and used in [9].
2.5.3 Aircraft based methodology
The evolution presented in this section is based on a “plane” point of view. We look at the flow of entering aircrafts, the flow of landing aircrafts, the number of planes present in the system, the number of planes rerouted. Those terms need to be well defined. To calculate flows, a time period is required. The term “for each aircraft” means that the count has been done for all the aircrafts contained in the data used. The total amount of selected aircraft is around 95,000.
- •
For each aircraft, the number of planes present in the system corresponds to the number of airplanes that are, at some point, at the same time in physically present the TRACON (figure 6(b)).
- •
For each aircraft, the flow of entering planes is equal to the number of planes entering the TRACON during a period of length centered on the entrance time of this plane in the TRACON, divided by the period T.
- •
For each aircraft, the flow of landing planes is equal to the number of planes landing at SFO airport during a period of length centered on the landing time of this plane at SFO airport, divided by the period T.
- •
For each aircraft, the number of rerouted planes that is equal to the number of planes present in the system that have a rerouted trajectory.
- •
For each aircraft, the number of runway used corresponds to an average on a period of length centered on the plane landing. If one runway is used more than 75% of the time during this period, we will say than only one runway is in use.


2.5.4 Aircraft based analysis of landing and rerouting
This section presents the results of the aircraft based methodology. The figure 7 plots the average flow of entering aircrafts in the TRACON (green diamonds), the average flow of landing aircrafts (red crosses) and its standard deviation (vertical red lines), and the average number of rerouted aircrafts (blue stars), as functions of the number of planes in the TRACON and of the number of runway in use. The definitions of those term are given in section 2.5.3. The blue line represents the data frequency (i.e the number of time this configuration happened). The period chosen is 15 minutes, to match with the average time in the system which is 14 minutes 30 seconds.

- One runway in use:
-
Up to 13 planes present in the TRACON, the flow of entering and landing aircrafts are very close and proportional to the number of planes in the system. The average flow of entering aircrafts is slightly bigger than the average flow of landing aircrafts. Over 14 planes present in the TRACON, the flow of landing aircrafts remains at 31 planes an hour whatever the number of entering aircrafts and the number of planes in the TRACON. The flow of entering planes goes up to 35 planes per hour. Up to 12 planes present in the TRACON, the number of rerouted planes increases slowly. Over 13 planes present in the TRACON, this number increases quickly and reaches 20 rerouted planes for 25 planes present in the TRACON. Over 25 planes in the system, the number of rerouted planes stabilizes around 15. The cases over 25 planes present in the TRACON are isolated cases (happened once or twice in 9 month). The standard deviation of the number of landing planes starts at 2.2 aircrafts and is almost all the time around 4.5 aircrafts.
- Two runways in use:
-
The flow of entering aircrafts and the flow of landing aircrafts are almost the same up to 29 planes in the system. The number of landing aircrafts increases almost proportionally with the number of planes in the TRACON. Over this number of planes in the TRACON, the data frequency is very low (isolated cases) so the results are not very relevant. The number of rerouted planes increases slowly and reaches at the maximum 10 for 30 planes in the system.
2.6 Airport characteristics
From the analysis of figures (5) and (7) we can show characteristics of San Francisco airport. First of all, the analysis gives a runway capacity a little above 30 planes per hour. This can be explained by the fact that the second runway can have been used a few time during the period, increasing the number of landing on one runway and by the fact that the capacity of 30 aircrafts is a recommandation. To reach the maximum capacity of landings in one runway configuration, 15 planes in the system are necessary. When this limit is reached, the number of rerouted planes increases very fast. The runway occupation has to be optimized and hence, planes have to be rerouted to arrive at the exact time they have been assigned by the controllers. When the number of planes entering the system is high, most of them have to be rerouted.
In the two runway configuration, whatever the number of planes in the system, the maximum capacity is hardly reached. Hence, the number of rerouted planes is not high. This configuration can handle a pick of arrivals or a large number of aircrafts in the TRACON without having to reroute all the planes.
2.7 TRACON characteristics
From the analysis of figures (5) and (7), it is clear that over 15 aircrafts in the system, the maximum landing capacity is reached. Letting more planes entering the TRACON leads to reroute them. This increases the TRACON controller workload, increase the density of aircrafts and the airspace complexity [11] and decreases the degrees of freedom for rerouting. An certain amount of planes is required to reach the maximum capacity of landings, but over it, it decreases the safety and does not improve performances.
2.8 Pros and cons of both methodologies
2.8.1 Time based methodology
- Pros
-
This methodology is easy to understand and to interpret. It is a usual way to analyze data. As shown in figure 5 the evolution of the number of rerouted planes in time is very clear.
- Cons
-
The time period is given and the start of the first period is arbitrary chosen: the first minute of the first day of records. As it is arbitrary, some limit phenomenon can appear and change in a slight way the values calculated. Figure 6 shows the impact of this arbitrary chosen time period.
2.8.2 Aircraft based methodology
- Pros
-
this methodology gets rid of the problem of arbitrary chosen time slot. The planes in the system correspond to the flying planes that interact which each other: all the planes flying simultaneously in the TRACON. This has a real meaning when talking about density or complexity. This method grants a very easy comparison of the results with a discrete time model. The analysis is exactly the same for all the aircrafts.
- Cons
-
For the number of planes in the system, we consider the planes flying in the TRACON. This means we assume that the planes already landed do not have any more incidence on the planes flying and neither the planes outside the TRACON.
3 Model Calibration and Validation
A model of the TRACON has been developed. One of the aim of developing such a model is to see if it is possible to reproduce with a simple model the phenomenon we observed on the real system. This model presents similarities with the push-back and departure process model in [8].
3.1 Description of the model
This model is a discrete time input-output model. The model has been developed and used with Matlab.
- System:
-
The modeled system is the TRACON with a 2 parallels runways airport. In a nominal configuration (i.e. the 2 runway are open and simultaneous landing are possible), the maximum landing capacity is 60 aircrafts per hour, 30 for each runway.
- Inputs:
-
The input to the system is the sequence of entering aircrafts in the TRACON.
- Outputs:
-
The output to the system is the sequence of landing aircrafts on the two runways.
- Time:
-
The time is divided in 30 seconds slots.
- Travel time:
-
When a plane enters the system, a nominal travel time is randomly drawn with a probability law describing the configuration of the TRACON (i.e the different possible routes leading aircrafts from the entrance to the runway threshold). This nominal time corresponds to the time the plane would spend in the TRACON if the runway is available without having to wait.
- Runway opening:
-
To degrade the system, it is possible to close one or both runways. If a runway is closed none aircraft can land on it.
- Runway availability:
-
Once a plane lands, the runway is unavailable for 2 minutes, which is 4 time slot.
- Runway attribution:
-
When a plane enters the system and is attributed a nominal travel time, it requests the runway for the 2 minutes period corresponding to the end of its travel time. If the runway is available, it can land and the runway becomes unavailable for this period. If none runway is available for this period, the plane has to queue.
- Queuing:
-
If the runway is not available, the plane will wait until one runway is available. As soon as one runway is available, the plane lands.
3.2 Model calibration
The probability law used to draw nominal travel times is presented in figure (8). In blue, the travel time for straight trajectories distribution extracted from the data and in red, the probability law used for the model.

3.3 Model validation
To validate the results of this model, the analysis of the data presented in the previous chapter have been used. From it, the entering sequence of aircrafts has been extracted and used as input for the model. The number of open runways has been extrapolated from the landing sequences in the data.
Figure (9) presents the evolution of the modeled system for a two days simulation. The top graph presents the entering sequence, the second graph presents the runway occupation: a dot for each time slot when the runway is occupied. The first runway which is always open is in red with value and the second runway has the value and is in blue. The green line presents the period where the second runway is open. The third graph presents the evolution of the system. Blue line represents the number of aircrafts in the system and red line represents the number of rerouted planes. The horizontal axis is the time, in 30 seconds time slots. One day = 2880 slots.

For figures (10) and (11), the model has run on 250 days, corresponding to 67218 planes, 22428 landing in one runway configuration and 44790 landing on two runways configuration.
Figure (10) presents for the model exactly the same analysis than section 2.2.5.2.5.4 . The figure plots the average flow of entering aircrafts in the TRACON (green diamonds), the average flow of landing aircrafts (red crosses) and its standard deviation (vertical red lines), and the average number of rerouted aircrafts (blue stars), as functions of the number of planes in the TRACON and of the number of runway in use. The definitions of those term are given in section 2.5.3. The blue line represents the data frequency. For the model, the period chosen is 16 minutes to catch the real flow of this discrete model.
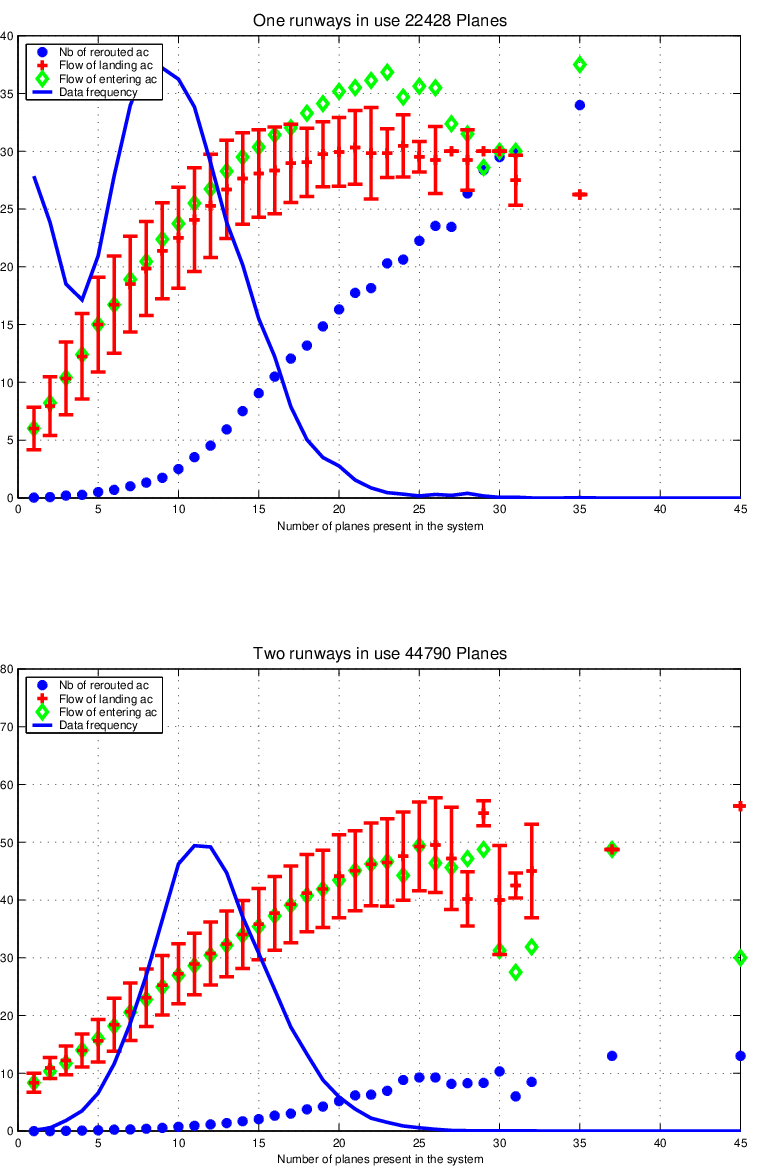
To compare the results, figure (11) presents the comparison between the model and the real system. Figures (11(a)) and (11(b)) present the comparison of the landing flow between the model and the real system. The blue line represents the average flow of landing aircraft in function of the number of planes in the system for the model and the red line is for the real system. The vertical lines represent the standard deviation. Figures (11(c)) and (11(d)) present the comparison of the landing flow between the model and the real system. The blue line represents the average flow of landing aircraft in function of the number of planes in the system for the model and the red line is for the real system. The vertical lines represent the standard deviation.


As shown in figures (11(a)) and
(11(b)), the behavior of the model concerning
the flow of landing aircrafts given by the model is very close to
the real system. When there is one runway in use, the model predicts
a flow a little lower than in the real system. For high numbers of
planes in the system, the average flow is 30 landings/hour which
corresponds to the specification. Notice that the standard deviation
of the model and the real system are always very close. When there
are two runways in use, up to 25 planes in the system, the model
predicts exactly the same behavior than the real system. Over 25,
there are some discrepancies but the number of realization is very
small.
On one runway configuration, figure (11(c)) shows that the predicted number of rerouted plane is pretty accurate up to 10 planes in the system. Between 10 and 22 planes in the system, prediction are slightly higher than the real system. Over 22 planes in the system, the prediction keeps increasing at the same rate while in the real system, it stabilizes. On the two runways configuration, figure (11(d)) shows that the prediction are accurate up to 20 planes in the system and over 20, slightly higher.
3.4 Analysis of the model results
The maximum number of planes present in the system is greater in the real system than in the model. An explanation could be that there is always one runway open in the model contrary to the real system where sometimes, both runway can be closed. On one runway configuration, the model predicts an always increasing number of rerouted planes with the number of planes in the system. This seems logical, while in the real system, it stops increasing.
3.5 Perspective of evolution
- •
Once a plane lands, the unavailability time of the runway is always exactly two minutes. This does not take in account the size of the aircraft. In a future model, the unavailability time could be dependant of the size of the aircraft. The size of the aircraft would be randomly drawn with a probability law based on the real distribution of aircrafts. A distribution in three kind of aircrafts is used in [8]: medium jets, large jets and heavy jets.
- •
The queuing is very deterministic. When a plane is queuing, as soon as the runway is available, the plane will land. It does not take in account the fact that planes have to keep moving and hence, if it is crowded, it can be difficult to arrive with such a accuracy. An small uncertainty could be added on the moment a plane queuing lands.
- •
The model does not include different routes in the TRACON. The time spend in the TRACON is randomly drawn with a certain probability law. This could be more representative if the entering sequence would include several entry points corresponding to different routes with different travel time probability law different for each route. Some route could be longer or more frequent.
4 Applications
4.1 Graceful degradation
An application for the model presented above is graceful degradation for air traffic control systems. To define graceful degradation, we introduce two systems (1) a nominal system (2) a degraded system. Graceful degradation happens when the transition from the nominal system to the degraded system is always smooth and with no event.
Degradation can occur for many reasons such as bad weather, breakdown of control systems (e.g radar) or communication systems… In our case, the nominal system is given by the TRACON, San Francisco airport with the two runways in use and the air traffic controllers managing the plane arrivals. The degraded system is still the TRACON but with only one or zero runway in use, and/or the controllers not able to manage the system for some reason. This degraded system must be sustainable. The current way to get a graceful degradation of this system is to reroute planes (i.e to modify their trajectories so that they can safely wait before landing) or even some ground slops for short haul traffic (e.g United shuttle from LAX to SFO). The interesting fact about San Francisco airport is that this phenomenon is tightly related to the weather. As the two runways are very close, as soon as the visibility is bad, which occurs very often due to the fog in San Francisco, it is impossible to use them at the same time. The system is hence very often degraded. The complexity [11] of the system must remain under a certain level so that if a degradation is to happen, the safety is still assured. A way to reduce complexity is to limit the number of aircrafts present in the system.
4.2 Decongestion of the TRACON
A study about the impact of the landing demand on landing capacity
is done in [9] for Newark Airport. This study
shows that when demand is higher than capacity of the runway, it
results in a drop of runway capacity. Plausible factors can be the
application of traffic flow restrictions and holding. Other factors
may include a high workload of air traffic controllers and airspace
complexity constraints.
To see the impact of a congested TRACON, arrivals
simulation have been made using San Francisco demand sequence. The
TRACON has been given a limit capacity : no plane can enter it if
this limit is reached. As soon as a plane lands, one plane waiting
out of the TRACON can enter. Waiting time refers to the time
the plane were asked to wait outside the TRACON and rerouting
time corresponds to the time the planes were asked to wait for the
runway to be available to land. The queue outside the TRACON is a
First-In First-Out queue. The simulations cover 243 days and 66,067
aircrafts.
Figure 12 presents the results of simulation for TRACON limit capacity varying from 6 to 12 aircrafts. Black bars stand for rerouting values and white bars for waiting waiting. Figure 12(a) presents the average delay and figure presents the percentage of delayed aircrafts 12(b).


A too low TRACON limit capacity has two effects. First, the number of planes waiting outside the TRACON is very high and second, the runway capacity will not be reached which results in an inefficient configuration. Then, when the TRACON capacity increases, the mean rerouting time decreases and stabilizes while the percentage of delayed flight slightly decreases. From 9 to 12 planes in the TRACON, the average rerouting time is almost the same, but, as the number aircrafts in the TRACON is smaller, the complexity of the system is smaller. The average rerouting time does not change much because the runway maximum capacity is reached and planes have to queue anyway. As shown in the first study, over a certain number of planes in the TRACON, the number of rerouted aircrafts increases very quickly. If the number of simultaneous rerouted planes is high, the controller workload increases. By reducing this workload, the controller could focus on fewer aircrafts and optimize better the trajectories which would result in an increase of the runway capacity. Moreover, the higher the number of present planes in a given area is, the less is the flexibility for an efficient rerouting process. TRACON are very congested area and limiting the number of aircraft present in those areas would increase the safety without generating extra delays.
5 Conclusion
The analysis of San Francisco bay’s TRACON records shows the landing capacity of the airport and the influence of the number of plane present simultaneously in the TRACON on the rerouting process and landing capacity. It is not useful to allow a large number of aircrafts simultaneously in the TRACON to increase performances. A validated TRACON input-output model is proposed, calibrated and validated. It is used to show that limiting the number of aircrafts in the TRACON does not increase the average delay, reduces the the controller workload and increases safety.
Acknowledgement
This research was supported by THALES. The author wish to thank Bert Ganoug from the Aircraft Noise Abatement Office of San Francisco International Airport pleasantly for providing the records of the TRACON of San Francisco bay.
References
- [1] NASA, Center TRACON Automation System, http://www.ctas.arc.nasa.gov/project_description/index.html#overview.
- [2] Michael O. Bally and Guglielmo Lulli, Ground Delay Programs: Optimizing over the Included Flight Set Based on Distance, 2001.
- [3] NASA, Center TRACON Automation System, Traffic Management Advisor, http://www.ctas.arc.nasa.gov/project_des- cription/tma.html.
- [4] NASA, Center TRACON Automation System, Multi-Center Traffic Management Advisor, http://www.ctas.arc.nasa.gov/project_description/mctma.html.
- [5] Todd C. Farley, Steven J. Landry, Ty Hoang, Monicarol Nickelson, Kerry M. Levin, Dr. Dennis Rowe and Dr. Jerry D. Welch, Multi-Center Traffic Management Advisor: Operational Test Results, AIAA 5th Aviation, Technology, Integration, and Operations Conference (ATIO), 2005.
- [6] NASA, Center TRACON Automation System, Final Approach Spacing Tool, http://http://www.ctas.arc.nasa.gov/project_description/fast.html.
- [7] Ioannis Anagnostakis, A Multi-Objective, Decomposition-Based Design Methodology and its Application to Runway Operations Planning, PhD thesis, September 2004
- [8] Nicolas Pujet, Bernard Delcaire, Eric Feron, Input-Output Modeling and Control of the Departure Process of Congested Airports, 1999.
- [9] Husni Idris and Antony Evans, Benefits assessment of multi-center traffic management advisor for Philadelphia and New York, AIAA Guidance, Navigation, and Control Conference and Exhibit, 2003.
- [10] Todd Farley, John D. Foster, Ty Hoang and Katharine K. Lee, A time-based approach to metering arrival traffic to Philadelphia, AIAA 2001-5241, 2001.
- [11] Keumjin Lee,Eric Feron and Amy Pritchett, Air traffic complexity: An Input-Output approach, American Control Conference, New York 2007. To be published, 2007.