Event-based Program Analysis with DeWiz
Abstract
Due to the increased complexity of parallel and distributed programs, debugging of them is considered to be the most difficult and time consuming part of the software lifecycle. Tool support is hence a crucial necessity to hide complexity from the user. However, most existing tools seem inadequate as soon as the program under consideration exploits more than a few processors over a long execution time. This problem is addressed by the novel debugging tool DeWiz (Debugging Wizard), whose focus lies on scalability. DeWiz has a modular, scalable architecture, and uses the event graph model as a representation of the investigated program. DeWiz provides a set of modules, which can be combined to generate, analyze, and visualize event graph data. Within this processing pipeline the toolset tries to extract useful information, which is presented to the user at an arbitrary level of abstraction. Additionally, DeWiz is a framework, which can be used to easily implement arbitrary user-defined modules.
Key Words.
Program analysis; Debugging; Parallel computing; Distributed computing0309027237
Schaubschläger, Kranzlmüller, Volkert Event-based Program Analysis with DeWiz
1 GUP, Joh. Kepler University Linz, Altenbergerstr. 69, A-4040 Linz, Austria/Europe schaubschlaeger@gup.uni-linz.ac.at
1 Introduction
It is well known, that performance analysis and program debugging, respectively, are two of the most time consuming and complex parts of the software life-cycle. This is especially true for parallel or distributed programs, since parallelism and (inter-process) communication introduce new obstacles which are unknown in sequential programs, and increase the complexity of the software development process.
During the past years many program analysis and debugging tools have been developed, using different approaches to hide the complexity of the analyzed or debugged program from the user. Due to the (at least) two-dimensional nature of the analysis data, namely time and space (in terms of processes), some kind of graphical representation has turned out to be the most useful way to present the analysis data to the user. Several approaches of graphical representation have been proposed, most of them visualize a given program execution as a two-dimensional space-time diagram. There is a broad range of tools in this field, for example Vampir NAWH 96 and Paradyn MHC 94, just to list two. Some tools use three dimensional environments like a CAVE to visualize a program execution, for example as a Time Tunnel as described in RSS+ 95.
A characteristic of parallel programs, which is becoming increasingly important for tool developers, is scalability. With multiprocessor machines and clusters deploying hundreds or thousands of processors, and grid infrastructures combining large numbers of distributed resources, scalability of program analysis tools seems a basic necessity. An important factor which limits scalability of tools, is the sheer amount of analysis data. Therefore it is inevitable for any analysis tool to keep the amount of data presented to the user at manageable sizes. This can be achieved in two ways: firstly by addressing the data collection phase, i.e. by reducing the actual amount of collected data. This approach is utilized in Paradyn, where the amount of collected data is reduced through dynamic instrumentation HMC 94. The underlying idea is to extract only those data items, that are actually needed for program analysis. This reduces the total amount of analysis data and thus permits to investigate even large scale programs.
On the other hand, even with data reduction applied in the collection phase, the amount of trace data can grow to an enormous size on large scale programs which utilize a large number of processors ofer a long execution time which may exceed days, weeks, or even months. This makes it necessary to focus on scalability also during the data analysis phase. Obviously trace data must be analyzed in a reasonable time and the results must be presented to the user in a meaningful way. Abstraction and graphical representation are the two most important concepts to achieve scalability. An example for such an abstraction mechanism can be found in EDL, the Event Definition Language introduced by Bates and Wileden BW 83. EDL uses two essential mechanisms for event abstraction: filtering and clustering. With filtering, all but a designated subset of events can be deleted from the original event stream. Clustering means, that one or more primitive events are gathered together into a higher level event. EDL has lead to the high-level debugging approach EBBA, Event Based Behavioural Abstraction Bat 95 and the program behaviour models of FORMAN Aug 98. Both models follow the idea that the behaviour observed in parallel programs may reveal useful patterns, which can be evaluated during program analysis. Another, more recent approach of program monitoring is EARL and has been proposed by Wolf and Mohr in WM 98. EARL stands for Event Analysis and Recognition Language and it allows to construct target independent monitoring and analysis tools by writing scripts in the EARL language.
In this paper we describe the scalable and modular debugging tool DeWiz (Debugging Wizard), which uses the event graph model to represent a program’s execution. Data analysis and presentation is done by independent modules, which try to automatically extract useful information. In Section 2 the architecture of DeWiz is discussed, while in Section 3 we give some examples that show how DeWiz can be used for program analysis. Finally, an outlook on future work concludes the paper.
2 Tool Architecture
The approach of DeWiz stems from our work on the Monitoring and Debugging environment MAD KGV 97. MAD is a collection of software tools for debugging message passing programs based on the MPI standard For 95. At the core of this toolset are the monitoring tool NOPE and the visualization tool ATEMPT. Although originally developed for message passing programs, the toolset, especially the monitor NOPE, recently has been extended so that also shared memory codes can be traced. The motivation for this extension was, that some of todays architectures are best utilized by using a hybrid MPI/OpenMP programming style Rab 02.
In the following we will describe the architecture, the theoretical model, as well as some implementation aspects of DeWiz in more detail.
2.1 Event Graph
As mentioned above, in DeWiz program executions as recorded with NOPE or event streams generated by online monitors are represented as event graph, which can be defined as follows:
Definition 1 (Event Graph Kra 00)
An event graph is a directed graph , where is the non-empty set of events , while is a relation connecting events, such that means that there is an edge from event to event in with the ”tail” at event and the ”head” at event .
The events of an event graph are the events observed during a program’s execution, like for example send or receive events in message passing programs, and read or write memory accesses in a shared memory program. In case of NOPE there is a standard set of events that will be traced, namely (amongst others) all MPI point-to-point communication events. However, it is easily possible to specify additional user-defined events to be recorded with NOPE, which adds great flexibility to the tool.
The relation connecting the events of an event graph is the happened-before relation, which is the transitive, irreflexive closure of the union of the relations and . It has been defined as follows:
Definition 2 (Happened-before relation Lam 78)
The happened-before relation is defined as
where is the sequential order of events relative to a particular responsible object, while is the concurrent order relation connecting events on arbitrary responsible objects.
In other words, the relation defines the sequential order of events on a particular process, with the meaning that if two events and occur on the same process and occurs before then . The concurrent order relation describes the order of corresponding events on different processes, which is established by communication and synchronization. If is a send event on process and is the corresponding receive event on process , then .
The DeWiz toolset uses the event graph model as its theoretical fundament. The tool itself consists of three main components, the modules, the protocol, and a framework, which are required to construct a DeWiz system for a concrete analysis task.
2.2 DeWiz System
A DeWiz system is built by connecting a set of DeWiz modules, which then act as a kind of event-graph processing pipeline, i.e. the DeWiz modules are responsible for the actual work in a DeWiz system. This modular approach has several advantages. It makes the DeWiz system flexible and easily extensible. Users can utilize existing modules or, if needed, implement their own modules, hence adding arbitrary functionality to the system.
Basically we distinguish three kinds of modules:
- •
Event graph generation modules
- •
Automatic analysis modules
- •
Data access modules
The modules in a DeWiz system communicate with each other using a specialized protocol, the DeWiz protocol. This protocol is based upon TCP/IP, which makes it possible to distribute a DeWiz system across several computers. Due to this approach, the monitoring and analysis tasks itself can utilize a potentially large number of resources, e.g. by putting the analysis tasks on the grid IF 98. For example it would be feasible to execute only the monitoring module on the computer where the monitored application is running. The monitoring module would then send the collected events to an analysis module which is executed on some other computer, and so on. Since analysis or processing of monitored events in general can be very time-consuming tasks, the distribution of these tasks can speed-up the analysis process significantly.
As mentioned above we distinguish three types of modules. These will be described in more detail in the following sections.
2.2.1 Event Graph Generation Modules
Event graph generation modules are those who produce the event graph data stream from a given program execution. This can be done in two ways, either online or post-mortem. In case of online tracing a DeWiz-Module connects to a running, instrumented program, collects events which are generated by the online monitor, and forwards these events to the next module in the DeWiz system. Currently DeWiz supports online monitors which correspond to the OMIS Compliant Monitor OCM WTL 98. There is also an interface to the OpenMP Pragma and Region Instrumentator OPARI MMSW 01.
In case of post-mortem tracing, events are read from tracefiles by a proper DeWiz module. Currently there is a module for reading tracefiles generated by NOPE.
2.2.2 Automatic Analysis Modules
Automatic analysis modules process an event graph stream and try to extract useful information like for example communication patterns, or erroneous behaviour like communication errors. The latter is relatively easy, for example by simply comparing the message lengths at a send event and at the corresponding receive event. If the lengths differ, it is an indication for a possible communication error. A more challenging task is to try to find communication patterns in an event graph. By applying pattern-matching algorithms to the event graph, we try to identify patterns like for example loops. If it is possible to find any irregularities in the pattern, this would again be a possible source for an error in the investigated program.
2.2.3 Data Access Modules
At the end of the processing pipeline we have data access modules. Their purpose is to display the various analysis-results, which were generated by the predecessing modules, to the user. Depending on the kind of analysis data a suitable form of visualisation will be chosen. In most cases this will be some form of graphical representation, for example in form of a space-time diagram of the event graph. Figure 4 shows a visualization of an example message-passing event-graph. On the vertical axes the participating processes are displayed, whereas the horizontal axes represent the time. The black arrows represent messages which are sent from one process to another, with the tail of the arrow at the send event on the source process, and the tip of the arrow at receive event on the destination process. The colored arrows indicate possible communication errors; these will be described in more detail below.
2.3 The DeWiz Protocol and Framework
The DeWiz Protocol is used between modules to transport the event graph stream.
For this purpose it is necessary to define data structures which represent the
observed events. In our case the following two data structures have been defined:
event:
concurrent order relation:
The variables and represent the responsible object (e.g. a process) on which the event occurred and its sequential order, respectively. The variable denotes the kind of event, in case of a message passing code a send or a receive operation for example, or a semaphore lock in a shared memory environment. Currently only message-passing and shared-memory events are supported, but due to its flexibility, the event graph can be used to model any kind of software system. Table 1 gives a short overview of several possible software systems, their corresponding event types and event data. The variable can be used to store additional information concerning the event, like for example timestamps or calling parameter of the function call that caused the event.
| target system | event type | event data |
|---|---|---|
| parallel/distributed message-passing program | send | message data, message-length, destination,message-type,data-type,… |
| multi-threaded shared memory program | lock | semaphore, waiting time,… |
| database/transaction system | read record | table, location of table, access time,… |
| file input/output | write | filename, device, buffer size,… |
The concurrent order relation connects corresponding objects as described above. In DeWiz we use logical vector clocks as described in Fid 91 by Fidge to implement the concurrent order relation.
With the DeWiz Framework it is possible to implement DeWiz modules for any desired functionality. The Framework is written in the Java programming language and provides a set of API functions which simplify the development of user-defined modules, for example by hiding the DeWiz protocol from the user.
3 Examples
3.1 Overview

In this section we present an example DeWiz system. If the modules for a concrete analysis task are available, the user may start to construct a corresponding DeWiz-System. The modules are placed and initialized on arbitrary networked computing nodes. A dedicated module, the DeWiz Sentinel is used to control a particular DeWiz System. With a controller interface, available modules may be arbitrarily interconnected by identifying corresponding input and output interfaces. An example for the DeWiz controller interface is shown in Figure 1. The smaller window in front shows the module table, including all registered modules (by id and name), their available interfaces and status, the implemented features (send, receive, or none), and the id’s of corresponding consumer or producer modules. The larger background window of Figure 1 provides the same information in form of a module diagram.
To use DeWiz in a particular programming environment, dedicated event graph generation modules have been implemented. As mentioned above, currently there is a trace-reader modules for NOPE, as well as an interface to OMIS compliant monitors and an extension to OPARI.
Concerning data access modules, DeWiz provides an interface to the analysis tool ATEMPT (Figure 4), a Java applet to display the event graph stream in arbitrary web browsers (Figure 2), and an SMS notifier for critical failures during program execution (Figure 3).


The analysis functionality already implemented in DeWiz is illustrated with the following two examples:
- •
Extraction of communication failures
- •
Pattern matching and loop detection
3.2 Communication Failures
Communication failures can be detected by pairwise analysis of communication events. An example of a possible communication failure is the detection of different message lengths at a send event and the corresponding receive event. Though this is not necessarily a communication failure, the default event-graph visualization module of DeWiz highlights such send or receive events, respectively, and the user can easily check whether this is intended or not. Another more obvious example of a communication failure is the detection of pending send or receive events, which are also highlighted in the event-graph visualization. Isolated events can originate for example from a wrong destination address given at a send event. The consequence would be that the corresponding receive event (in case it is a blocking receive event) would wait forever for the message, thus blocking the receiving process forever. In Figure 4 an example event-graph with several possible communication errors is shown.

3.3 Pattern Matching - Loop Detection
A more complex analysis activity compared to the extraction of communication
failures is pattern matching and loop detection. The goal of the corresponding
DeWiz modules is to identify repeated process interaction patterns in the event
graph. An example event graph is shown in Figure 5. This pattern is called
simple exchange pattern and can be defined as the event graph
with
and
where events occur on process and events occur on process with . The existence of this simple pattern in an event graph can easily be verified within a DeWiz module. More complex patterns can be specified and provided in a pattern database according to the needs of users and the characteristics of their programs.

The purpose of detecting patterns in an event-graph is two-fold. Firstly, if it is possible to detect repeated iterations of a pattern in an event graph, this knowledge can be used when the event-graph is visualized, e.g. as space-time diagram. By replacing the possible complicated patterns with simpler symbols, the complexity of the visual representation of the event-graph can be reduced greatly, which would give the user a better overview of the investigated program.
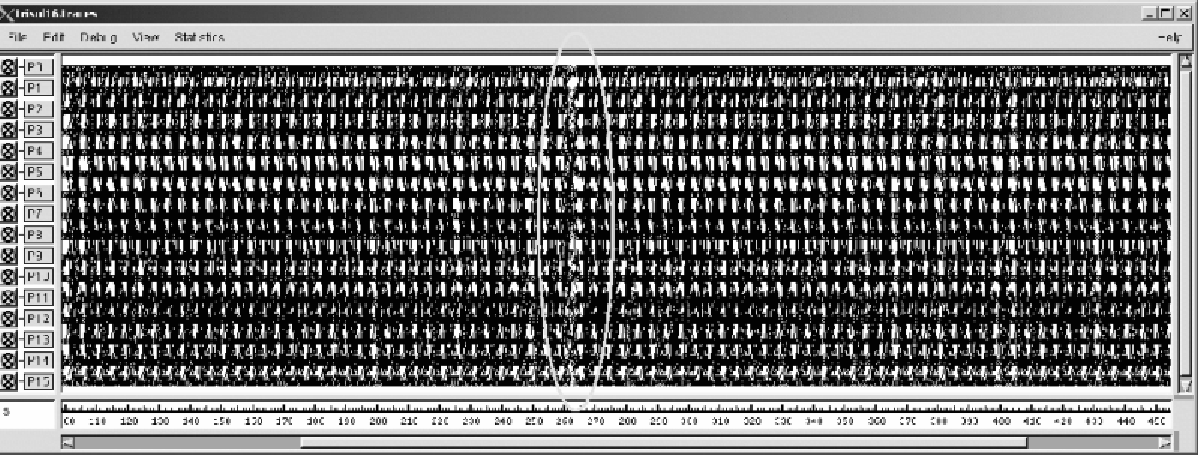
Secondly, the user could specify a communication pattern which is expected to occur in the investigated program. DeWiz will compare the given pattern with the event-graph and detect possible deviations, which could possibly originate from an error in the program. Another example is the repeated occurrence of any pattern, possibly within a loop. DeWiz will in a first step detect the pattern, and then check for irregularities in the sequence of this pattern. Figure 6 illustrates such a situation. We see a relatively complex event-graph, which is the trace of an execution of a finite-element message-passing program executed on 16 processes. Despite its complexity, one can relatively easy see the iterations of a pattern, as well as a significant irregularity (in the middle of the diagram). Again, this is an indication for a possible communication error.
4 Conclusion and Future Work
Performance analysis and debugging of parallel and distributed programs is a difficult activity. The problems are further increased, if program executions with large numbers of processes need to be investigated. For that reason, scalability of software analysis tools is an important characteristic.
The modular approach of DeWiz provides scalable parallel program analysis by abstracting the program’s behavior as an event graph and distributing the analysis activities of this graph across existing resources. With this approach, DeWiz is able to cope with very large amounts of analysis data, while providing capabilities comparable to existing analysis tools. The current implementation of DeWiz represents a first proof of concept. However, for actual application of DeWiz more examinations with real-world applications are needed. In addition, some more interfaces to existing analysis tools are required. With the flexible structure of DeWiz and the well-defined protocol, an interface to an already existing analysis tool can easily be established. In this way, the analysis tool benefits from the capabilities of DeWiz and achieves a higher level of scalability.
References
- Aug (98) M. Auguston. Building program behaviour models. In Proc. ECAI-98, European Conference on Artificial Intelligence, Workshop on Spatial and Temporal Reasoning, pages 19–26, August 1998.
- Bat (95) P. Bates. Debugging heterogeneous distributed systems using event-based models of behaviour. In ACM Transactions on Computer Systems, Vol. 13, No. 1, pages 1–31, February 1995.
- BW (83) P. Bates and J.S. Wileden. High-level debugging of distributed systems: The behavioral abstraction approach. In Journal of Systems and Software, Vol. 3, No. 4, pages 255–264, December 1983.
- Fid (91) C.J. Fidge. Logical time in distributed computing systems. In IEEE Computer Vol. 24, No. 8, pages 28–33, August 1991.
- For (95) Message Passing Interface Forum. Mpi: A message-passing interface standard - version 1.1, June 1995. http://www.mcs.anl.gov/mpi.
- HMC (94) J.K. Hollingsworth, B.P. Miller, and J. Cargille. Dynamic program instrumentation for scalable performance tools. In Proc. SHPCC, 1994 Scalable High Performance Computing Conference, pages 841–850, May 1994.
- IF (98) Carl Kesselman Ian Foster. The Grid: Blueprint for a New Computing Infrastructure. Morgan Kaufmann Publishers, 1998.
- KGV (97) D. Kranzlmüller, S. Grabner, and J. Volkert. Debugging with the mad environment. In Parallel Computing, Vol. 23, Nos. 1-2, pages 199–217, 1997.
- Kra (00) D. Kranzlmüller. Event graph analysis for debugging massively parallel programs, September 2000. PhD Thesis, GUP Linz, Joh. Kepler University Linz, http://www.gup.uni-linz.ac.at/ dk/thesis.
- Lam (78) L. Lamport. Time, clocks, and the ordering of events in a distributed system. In Communications of the ACM, Vol. 21, No. 7, pages 558–565, July 1978.
- MHC (94) P.B. Miller, J.K. Hollingsworth, and M.D. Callaghan. The paradyn parallel performance measurement tools and pvm. In Dongarra, J.J., Tourancheau, B., (Eds.), Environments and Tools for Parallel Scientific Computing II, 1994.
- MMSW (01) B. Mohr, A.D. Malony, S. Shende, and F. Wolf. Design and prototype of a performance tool interface for openmp. In Proc. LASCSI Symposium 2001, Los Alamos Computer Science Institute, Santa Fe, New Mexico, October 2001.
- NAWH (96) W.E. Nagel, A. Arnold, M. Weber, and H.-C. Hoppe. Vampir: Visualization and analysis of mpi resources. In Supercomputer 63, Volume XII, Number 1, pages 69–80, January 1996.
- Rab (02) R. Rabenseifner. Communication and optimization aspects on hybrid architectures. In Proc. EuroPVMMPI 2002, Springer-Verlag, LNCS, Vol. 2474, Linz, Austria, pages 410–420, September 2002.
- RSS+ (95) D.A. Reed, K.A. Shields, W.H. Scullin, L.F. Tavera, and C.L. Elford. Virtual reality and parallel systems performance analysis. In IEEE Computer, Vol. 28, No. 11, pages 57–67, November 1995.
- WM (98) F. Wolf and B. Mohr. Earl - a programmable and extensible toolkit for analyzing event traces of message passing programs. In Technical Report FZJ-ZAM-IB-9803, http://www.kfa-juelich.de/zam/docs/printable/ib/ib-98/ib-9803.ps, Forschungszentrum Jülich, Zentralinstitut für Angewandte Mathematik, April 1998.
- WTL (98) R. Wismüller, J. Trinitis, and T. Ludwig. Ocm - a monitoring system for interoperable tools. In Proc. SPDT 98, 2nd SIGMETRICS Symposium on Parallel and Distributed Tools, ACM Pross, Welches, Oregon, USA, pages 1–9, August 1998.