Mean first passage time analysis of protein folding Theory and modeling; computer simulation Stochastic and trajectory models; other theories and models
Mean first passage time analysis reveals rate-limiting steps, parallel pathways and dead ends in a simple model of protein folding
Abstract
We have analyzed dynamics on the complex free energy landscape of protein folding in the FOLD-X model, by calculating for each state of the system the mean first passage time to the folded state. The resulting kinetic map of the folding process shows that it proceeds in jumps between well-defined, local free energy minima. Closer analysis of the different local minima allows us to reveal secondary, parallel pathways as well as dead ends.
pacs
87.15.Aapacs
82.20.FdProteins are polymers with several hundred degrees of freedom, so it is natural to think of protein folding as (diffusive) motion on a complex potential energy surface. This landscape picture has become popular in the wider protein folding community during the last decade [1, 2], and clearly invites the question of the nature of the surface: ruggedness, presence of kinetic traps, funnels etc. One problem with answering such questions is that the concept of folding rate, used to describe simple two-state kinetics, can not be generalized to a property that is defined for each configuration of the protein, so it is not useful for describing local kinetics. In this Letter, we use the inverse rate, the mean first passage time (MFPT) which can be calculated for each configuration [3], to analyze the kinetics of folding. Our results clearly reveal kinetic barriers that can not be predicted from the one-dimensional projection of the free energy landscape, and allow us to construct an improved reaction coordinate.
Workable, detailed models of protein folding energetics and kinetics do not exist. Instead, we work with the FOLD-X model [4], which is rather simplified, but takes experimental knowledge into account. FOLD-X and similar models [5, 6, 7] are based on the observation that the folding rate of small proteins is correlated with the entropy cost of ordering the chain in a near-native geometry, implying that this happens before the transition state. Non-native interactions are hereby rendered less likely, and the models only consider interactions present in the folded structure. In these approximations, any residue can adopt only two states; folded/ordered or unfolded/disordered. The conformation a folded residue is always set to its native state, whereas a contiguous sequence of unfolded residues is treated as a disordered loop.
In FOLD-X, the total free energy, , of a specific protein state (defined by the binary sequence of folded/unfolded residues) is the sum of the interactions between the atoms of the folded residues plus terms accounting for the loss of chain entropy:
| (1) |
Here, is the sum of the van der Waals contributions of all atoms of the folded residues. and is the difference in solvation energy upon folding of apolar and polar groups, respectively. is the free energy difference between the formation of intra-molecular hydrogen-bonds compared to the inter-molecular formation of hydrogen-bonds with solvent. is the electrostatic contribution of charged groups interactions. and are the sum of the entropy-loss associated with the ordering of respectively the backbone and the side-chain of each folded residue. Finally, is the sum of the entropy cost associated with the closure of the disordered loops connecting the stretches of the folded residues. The strength of the various interactions (, , , ) and the entropy cost for ordering a residue (, ) are scaled the atomic occupancies [16] to take the effect of solvent expose into account [4]. The terms , , , and in eq. (1) are weighting factors applied to the raw energy/entropy terms. These weights have been obtained from a calibration against a comprehensive database of protein mutants [8]. The details of the different energy and entropy terms can be found in [4, 8].
In order to reduce the size of the state space, only states with one or two segments of ordered residues are considered. A comparison with an unrestricted Monte Carlo based sampling shows, that the two-segment approximation captures the thermodynamic behavior of small single domain proteins quite well [9]. We use the local kinetics of the energy model: in each step, the protein can add or remove a residue to an end of one of the ordered segments (including the possibility to remove a one-residue segment) or create a new one-residue segment if zero or one ordered segments are present. The move probabilities between states and are chosen so they fulfill the detailed balance condition
| (2) |
This is achieved by using
| (3) |
where and are the number of moves available from state and , respectively. This expression clearly fulfills (2), while also ensuring that the move probabilities out of state add up to at most 1. The probability for remaining is .
Since the kinetics are ergodic all trajectories starting in a particular state will sooner or later end up in any other given state . We can define the average time (number of steps) before this happens, the mean first passage time . If we advance one step along these trajectories we clearly get one step closer to the passage through state . Since we advance by the move probabilities the MFPT obeys [3]
| (4) |
where is the length of the time step. For the special condition must hold. If we define the matrix as follows:
| (5) |
and the vector by
| (6) |
the condition (4) and the special case for can be summarized in a matrix equation for the MFPT vector :
| (7) |
We solve this equation numerically using the linbcg sparse matrix routine [10] and with set to the completely folded state.

We here present results from the calculation on an SH3 domain, which has 57 amino acid residues and a total of 425924 different states in the 2-segment approximation. The x-ray structure is shown in Figure 1 (Protein Data Bank file 1shg [11]). In order to present the results in condensed form we sum the Boltzmann probability over states with same MFPT and number of ordered residues
| (8) |
where is the Kronecker delta. We also calculate the one-dimensional free energy
| (9) |
The upper panels in Figure 2 show contour plots of . The division with the relative probability for a given is done in order also to show the kinetics at the top of the barrier. The lower panels show total free energy as function of the number of ordered residues, with the free energy in the unfolded state normalized to zero.


In the left part of Figure 2 the reaction coordinate takes ordering of all residues into account, as is usual with this type of model [4, 5, 6, 7]. The free energy is seen to be a smooth function of the number of ordered residues, with minima at the unfolded and folded states and a maximum between them (the transition state). As expected, the MFPT to the folded state is high for states with few ordered residues and low for states with almost all residues ordered. Less expected is the formation of ’islands’ with gaps between them. The gaps show the presence of particular critical events that in one step reduce the MFPT significantly. This suggests that the smooth variation of the free energy seen in the lower panel might be a poor picture of the actual energetics.
Surprisingly, the relation between MFPT and residue ordering is not monotonous; for many states it is possible to find another state with fewer ordered residues but lower MFPT. We show in the following that this behaviour can have three reasons:
- i.
Parallel folding pathways
- ii.
Poor choice of reaction coordinate
- iii.
Dead ends
In order to determine the residues that must be ordered for the system to jump over a gap, we found for each island the states from which it is possible to jump to another island with lower MFPT, and for these states we calculated the average probability for each residue to be folded. The results are shown in the upper panel of Figure 3. The lower panel shows which residues on average become ordered right in the jump between islands.

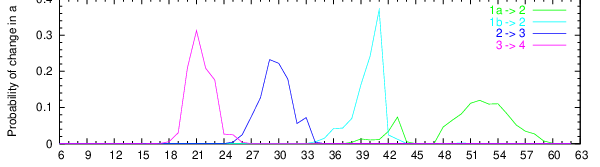
Passage from island 1a or 1b to island 2 is seen to involve ordering of residues 32-57, which constitute most of the three strands of the main -sheet. This finding is consistent with earlier folding studies of the SH3-domain [12, 13, 14]. In fact, experimental studies [17, 18] also demonstrate that the diffusive contribution from the unfolded residues (here 6-31) may play an important role in driving the initial folding event. Accounting for this contribution falls outside the scope of the present model.
Interestingly, the map shows that the initial folding event can happen by two parallel pathways: the dominant path (island 1b) is formation of the last two strands (cyan in Figure 1) followed by the first (blue in Figure 1), but a small fraction (island 1a, 3.5 %) initially form the first two strands followed by the last. It can be seen from the free energy diagram that these events happen around the top of the barrier, i. e. at the transition state. Subsequently, the part of the protein rendered in violet folds followed by the remainder, shown in red.
It is seen that for all islands ordering of the C-terminus is possible, but not necessary for jumping to the next island with shorter MFPT. This shows that folding can proceed with or without ordering of these residues, i.e. their ordering represent modes which are orthogonal to the reaction coordinate. In the island with the completely folded state (island 4) the N-terminus is also partially disordered. Inclusion of these residues will smear out both MFPT and plots in the -direction. We therefore plotted the data again but not counting ordering of 3 N-terminal and 6 C-terminal residues in the reaction coordinate.
The results are shown in the right part of Figure 2. The features of both MFPT and free energy plots are significantly sharper: the overlaps in the direction between islands is diminished, and is seen to have several local maxima. This explains the gaps in the MFPT plots: rather than a going over a smooth barrier, folding in fact proceeds through a number of local minima and the rate is determined by passage of the barriers in between. We have performed the identical analysis on chymotrypsin inhibitor 2 (PDB-file 2ci2) and obtained very similar results, except that the gaps between the islands were even more pronounced. Note that from the free energy curve in the right part of Figure 2 one would still predict experimental two-state folding, as is also observed [12, 13, 14]. The islands are not predicted to represent experimental folding intermediates, since the local free energy minima in all cases are significantly higher than the free energy of both the denatured and native states.
Even with the improved reaction coordinate there is still a considerable overlap in the -direction between islands 3 and 4; there are states with 36 ordered residues and a MFPT to the folded state above 2 steps, and other states with only 30 ordered residues and MFPT below 2 steps. It turns out that the states with 30-36 ordered residues and low MFPT to the folded state in fact represent a dead end that is not in direct kinetic contact with island 3. Calculation of the MFPT to the unfolded state shows that these states have longer MFPT than even the completely folded state, meaning that they must first refold before they can unfold correctly (data not shown). What happens is that in these states the loop 16-26 disorders while the residues 9-15 stay in place. Apparently, this is energetically just as favored as disordering from the N-terminus, but the barrier for further disordering along this route is higher, and so the protein instead refolds the loop and starts unfolding at the N-terminus. The kinetic connections are the same in both directions (microscopic reversibility) and so these states that can not directly unfold are also not reached on the folding pathway.
In conclusion, our results show that solution of the mean first passage time equation provides a new roadmap to protein folding landscapes. The landscape turns out to be rugged rather than smooth, secondary pathways and dead ends reveal themselves and it becomes possible to pinpoint the exact residues involved in barrier passage. The present work employs realistic free energies and a simplified representation of the ordering dynamics, but we believe that this type of approach should be valuable also in the analysis of models with realistic descriptions of structural change.
References
- [1] \NameOnuchic, J. N., Luthey-Schulten Z Wolynes, P. G. \ReviewAnn. Rev. Phys. Chem. \Vol48 \Page545 \Year1997
- [2] \NameOnuchic, J. N., Nymeyer, H., Garcia, A.E., Chahine, J. Socci, N.D. \ReviewAdv. Prot. Chem. \Vol53 \Page87 \Year2000
- [3] \NamePontryagin, L., Andronov, A. Vitt, A \ReviewZh. Eksp. Teor. Fiz. \Vol3 \Page165 \Year1933
- [4] \NameGuerois R. Serrano L. \ReviewJ. Mol. Biol. \Vol304 \Page967 \Year2000
- [5] \NameGalzitskaya, O. V. Finkelstein, A. V. \ReviewProc. Natl. Acad. Sci. USA \Vol96 \Page11299 \Year1999
- [6] \NameAlm, E. Baker, D. \ReviewProc. Natl. Acad. Sci. USA \Vol96 \Page11305 \Year1999
- [7] \NameMuñoz, V. Eaton, W. A. \ReviewProc. Natl. Acad. Sci. USA \Vol96 \Page11311 \Year1999
- [8] \NameGuerois, R., Nielsen, J. E. Serrano, L. \ReviewJ. Mol. Biol. \Vol320 \Page369 \Year2002
- [9] \NameBorg, J., Guerois., R., Nielsen, J.E. Serrano, L. \Reviewin preparation \Year2002
- [10] \NamePress, W. H., Teukolsky, S. A., Vetterling, W. T. Flannery, B. P. \BookNumerical Recipes in C \PublCambridge University Press \Year1992
- [11] \NameMusacchio, A., Noble, M., Pauptit, R., Wierenga, R. Saraste, M. \ReviewNature \Vol359 \Page851 \Year1992
- [12] \NameMartinez, J. Serrano, L. \ReviewNature Struct. Biol. \Vol6 \Page1010 \Year1999
- [13] \NameRiddle, D. S., Grantcharova, V. P., Santiago, J. V., Alm, E., Ruczinski, I. Baker, D. \ReviewNature Struct. Biol. \Vol6 \Page1016 \Year1999
- [14] \NameNölting, B. Andert, K. \ReviewProteins \Vol41 \Page288 \Year2000
- [15] \NameKoradi, R., Billeter, M., Wüthrich, K. \ReviewJ. Mol. Graphics \Vol14 \Page51 \Year1996
- [16] \NameColonna-Cesari, F. Sander, S. \ReviewBiophys. J. \Vol57 \Page1103 \Year1990
- [17] \NameNölting, B. \BookProtein Folding Kinetics \PublSpringer Verlag \Year2000
- [18] \NameViguera, V., Vega C. Serrano L. \ReviewPNAS \Vol99 \Page5349 \Year2002