A High Resolution Method for Measuring Cosmic Ray Composition beyond 10 TeVJournal: Astroparticle Physics
Abstract
The accurate determination of the elemental composition of cosmic rays at high energies is expected to provide crucial clues on the origin of these particles. Previous direct measurements of composition have been limited by experiment collecting power, resulting in marginal statistics above eV, precisely the region where the “knee” of the cosmic-ray energy spectrum is starting to develop. In contrast, indirect measurements using extensive air showers can produce sufficient statistics in this region but generate elemental measurements which have relatively large uncertainties. Here we discuss a technique which has become possible through the use of modern ground-based Čerenkov imaging detectors. We combine a measurement of the Čerenkov light produced by the incoming cosmic-ray nucleus in the upper atmosphere with an estimate of the total nucleus energy produced by the extensive air shower initiated when the particle interacts deeper in the atmosphere. The emission regions prior to and after the first hadronic interaction can be separated by an imaging Čerenkov system with sufficient angular and temporal resolution. Monte Carlo simulations indicate an expected charge resolution of for incident iron nuclei in the region of the “knee” of the cosmic-ray energy spectrum. This technique also has the intriguing possibility to unambiguously discover nuclei heavier than iron at energies above 1014 eV. The identification and rejection of background produced by charged particles in ground based gamma-ray telescopes is also discussed.
Keywords:
Cosmic Rays , measurement techniques , Cerenkov light , Gamma Ray Astronomy , Cosmic Ray OriginPACS
95.55.Vj , 95.55.Ka , 95.85.Ry, ,
1 Introduction
The origin of cosmic rays remains a central unresolved question in astrophysics. Nearly 90 years after the first observations, this population of charged particles remains an enigma; the heart of which is the huge dynamic range of fluxes and energies over which they have been observed. In the theoretical arena, a relatively recent paradigm has emerged, which involves the acceleration of cosmic rays via diffusive shock processes in supernovae remnants (SNR). This idea has been fueled both by a viable physical model of the acceleration process [1, 2, 3, 4] and a simple energetics argument in which galactic supernovae are the only galactic candidate with sufficient energy output to supply the staggering amount of power needed to sustain the cosmic-ray population (see e.g., [5]).
A key issue with the SNR idea is that supernova diffusive shock acceleration can only produce particles up to some maximum energy, limited either by the lifetime of the strong shock or by the particles becoming so energetic they can no longer be confined in the acceleration region [6]. Estimates of this upper energy limit vary, with typical values in the region of eV. However, the observed flux of cosmic rays extends more or less continuously for another five orders of magnitude beyond this; no plausible extrapolation of the standard parameters of SNR can generate cosmic rays of such energies.
Another aspect of the cosmic ray riddle is the existence of an observational “knee” at eV in the cosmic ray energy spectrum. The coincidence of this “knee” with the theoretical energy limit of SNR diffusive shock acceleration is intriguing and has actually served as evidence to support the theory. However the “knee” represents only a small change in the spectral slope of the overall flux, with the energy dependence changing from below the “knee” to above it. We are faced with a simple observational fact that the cosmic rays have an essentially continuous spectral slope for nearly 11 orders of magnitude.
In principle, additional mechanisms could provide the flux at high energies. The power budget for “post-knee” cosmic rays is only a fraction that of the total budget, so there is some freedom in selecting models. However, to result in an energy spectrum as smooth as is observed, these mechanisms would have to generate fluxes which are remarkably, perhaps implausibly, close to that of the SNR mechanism. Another problem exists at the highest energies, around eV, where an additional spectral break occurs (the “ankle”). It has been argued that particles above the “ankle” could be extragalactic. If so, they can be expected to exhibit a characteristic cutoff due to photo-pion production with the cosmic microwave background. This cutoff has yet to be observed [7].
An overall scheme which credibly addresses and unifies these issues remains elusive. More reliable and accurate measurements in the “knee” region, of abundant cosmic ray nuclei (1 26) could drastically revise our current ideas and provide a basis for such a unification. The accurate determination of the composition of cosmic rays has provided some of the key advances in this field at lower energies, where direct measurements are possible with detectors above the atmosphere. For example, the realization that the observed spectral slope of cosmic rays is significantly steeper than that produced in the cosmic ray sources themselves resulted from measurements with sufficient elemental resolution to separate primary source cosmic ray elements from those produced in the interstellar medium at eV [8].
In this paper we propose an idea which has become possible through advances in the imaging atmospheric Čerenkov technique. It is based on the concept that a detector of fine enough pixelation will be capable of observing Čerenkov light emitted directly from cosmic ray nuclei prior to their first interaction in the atmosphere. In general, this light is overwhelmed by the Čerenkov emission from the subsequent extensive air shower (EAS). However, with an appropriate detector, and within certain geometric constraints, this “direct Čerenkov”, or DČ, light can be sufficiently well separated from the background of EAS Čerenkov light to make relatively high-precision measurements of the traditional cosmic ray composition (). This technique may also provide new opportunities for the first measurement of higher charge nuclei (Z ) as well as possible improvements in ground based gamma-ray telescope sensitivity.
2 Method
2.1 History
Čerenkov light from extensive air showers was first predicted by Blackett in 1948 [9], and later observed by Galbraith and Jelley in 1952 [10]. In 1989, the Whipple telescope used the technique of Čerenkov light imaging to provide the first highly significant detection of the Crab Nebula in high energy gamma rays [11]. The imaging technique, which was proposed in 1977 [12], involves the use of an array of photomultiplier tubes at the focal plane of the telescope to reject the very large background of cosmic ray-induced air showers by the shape of their images in the field of view. A camera with fine enough pixelation has the capacity to not only discriminate between hadronic and electromagnetic showers, but to map the development of the showers as they penetrate into the atmosphere.
In the present work we propose a means to measure the direct Čerenkov (DČ) light produced by the incoming nucleus prior to its first interaction by using the imaging atmospheric Čerenkov techniques of VHE gamma ray astronomy. The targeting of DČ light is not a new idea. In 1965, Sitte [13] had proposed that this radiation might be observed in high-altitude balloon-borne instruments. His idea, which was revisited by Gough in 1976 [14], was to place detectors at a height in the atmosphere above the mean interaction point of heavy primary cosmic rays and to look for the direct production of Čerenkov light. In the absence of the large light backgrounds due to emission from EAS, it was expected that accurate composition measurements could be made by analysis of the direct Čerenkov light yields. After a pioneering flight by Sood in 1981 [15], the concept was unexploited until recent efforts by Seckel et al. in 1998 [16]. The fundamental challenge in the new approach discussed here is the identification of the DČ light against the much larger background of Čerenkov light produced in the associated EAS.
2.2 Čerenkov Radiation
A charged particle traveling in the atmosphere will produce Čerenkov radiation if it has a velocity greater than the local velocity of light. The threshold Lorentz factor, , at which the radiation starts to be emitted is approximately:
| (1) |
where , and is the local index of refraction in the atmosphere. At sea level, , while at an altitude of some 50 km, . For an Iron nucleus, this is equivalent to energies of 2 TeV and 36 TeV, respectively.
The rate of emission of Čerenkov light, , increases rapidly with above this threshold as:
| (2) |
where is the particle charge. For the amount of emitted light approaches a saturation level which scales exclusively with the square of the particle charge and the local atmospheric density. The Lorentz threshold, , is a function of the local density, which, in turn, is a function of the altitude. Therefore, because the atmospheric density scales with height, once in saturation, the amount of Čerenkov emission from a particle is determined entirely by the charge of the particle, and the altitude of emission. The Čerenkov angle too, is determined by the local density (and thus, on the emission height), and so the light pool from an emitting particle has a well-defined geometry determined entirely by the atmospheric density profile.

In contrast, the Čerenkov emission from an extensive air shower has a yield almost linearly proportional to the energy of the primary particle, with a weak dependence on the primary charge, and a geometry which varies primarily with the details of the shower development. Figure 1 shows a schematic depiction of the Čerenkov radiation from a primary cosmic ray and its subsequent EAS. In the interior regions of the Čerenkov light pool, the typical photon densities due to the EAS emission are many times greater than those associated with the direct emission. Thus, to discern the DČ photons against this background, some distinguishing characteristics must be identified.
2.2.1 Angular Characteristics
One of the fundamental characteristics of atmospheric DČ light is a simple correspondence between emission height and emission angle. As shown above, this stems from the density dependence of the Čerenkov emission angle and the height dependence of the atmospheric density. In practice, this means that for fixed geometries, single emitting particles can be matched by their emission angle to unique emission heights.
Figure 2 shows the characteristic features of DČ light from a relativistic () charged particle vertically incident on the top of the atmosphere. To illuminate the features of the DČ emission, the particle is constrained to not interact in the atmosphere; the intersection point of the particle trajectory with the observing plane is the point where the impact parameter is zero. The default CORSIKA Monte Carlo simulation atmospheric profile[17] is used.
The upper panel shows the impact parameter of photons at sea level produced as a function of the particle altitude in the atmosphere. The physics of atmospheric Čerenkov emission produces a narrow emission cone angle at high altitude which expands as the particle penetrates deeper into the atmosphere. At altitudes around 10 km, the interplay between increasing emission angle and decreasing emission height produce a pileup effect near the maximum geometrically-allowed radius, near m. This pileup is responsible for the so-called “Čerenkov ring”.
Since the rate of emission of Čerenkov light increases with atmospheric depth (because becomes smaller), the optimal impact parameter for viewing DČ, in the absence of an EAS, would be at this Čerenkov ring. However, since most nuclei, in reality, interact by altitudes of 25 km or so, the best impact parameter must be chosen as a compromise between high DČ density (low altitude), and low nuclei interaction probability (high altitude). A reasonable radius is m. At this radius, a 10 m diameter detector will view DČ light coming from an angular range of degrees with respect to the incoming trajectory, which corresponds to heights between roughly 29 and 34 km in the atmosphere. On average, this is about as deep as the cosmic ray primary can be expected to penetrate without interaction.
As Figure 2 shows, an additional component of secondary Čerenkov light which originates from emission at an altitude 4 km could also be observed at 80 m. However, this light is emitted at an angle of nearly 1 degree, which is distinguishable from the light produced at higher altitudes by using an imaging detector with fine enough pixels. In a telescope with 0.05 degree pixels, the DČ light from high altitude would be confined to a specific range of pixels. In the absence of EAS particles, measurements of photon densities in these angular bins would provide an unambiguous determination of the DČ yield from the primary particle, and therefore its charge.
However, the presence of the EAS acts to obscure the direct Čerenkov component, as electrons produced at lower altitudes get scattered, producing Čerenkov light which enters into the angular bin of the direct radiation. In lower energy showers, the effect is small compared to the densities of the DČ light. However, as the size of the EAS increases, the background grows to the point where the density of the scattered electron emission exceeds that of the DČ emission. Because the amplitude of the EAS light is set by the energy of the incoming nucleus, this background effectively provides an upper limit to the useful energy range for the DČ technique. This energy limit essentially scales with the square of the primary nuclear charge.
2.2.2 Temporal Characteristics
The lower panel of Figure 2 shows the time delay of Čerenkov photons emitted by the same particle as seen in the first panel. The delays are shown as a function of the photons’ final impact parameters at sea level. These are measured with respect to the time it takes the particle (assumed to be traveling at ) to reach sea level.

The DČ light has a very fast time structure at high altitude. All of the photons emitted from altitudes higher than 30 km arrive within roughly 300 ps of each other. Furthermore, this light is delayed with respect to the light emitted lower in the atmosphere (e.g., below 5 km) by 3 ns or more, depending on the observation radius. The effect of optical dispersion over a typical wavelength range for atmospheric Čerenkov measurements ( nm) has a negligible effect on these timing widths. This leads to a additional method for differentiating between the DČ light and that produced in the EAS. The DČ should be delayed from the main Čerenkov pulse, and should have a characteristic width over an order of magnitude shorter than the EAS Čerenkov pulse. The width of an EAS Čerenkov pulse depends on the width of the shower front. These fronts are typically m thick, leading to EAS Čerenkov pulses on order 6 ns wide.
The largest time separation between DČ and EAS Čerenkov light occurs closest to the core of the shower. However the total amount of DČ radiation collected is smaller closer to the core as discussed above. Again, an observation radius of m is a good compromise between providing an adequate DČ signal before the particle is likely to interact and maintaining some time separation between the DČ and EAS signal as shown in the lower panel of Figure 2.
3 Simulation
Since the dominant background for the DČ light is Čerenkov light from electrons scattered in the EAS development, we have used numerical simulations to study the levels and fluctuations in this background. The characteristics of DČ light in EAS have been modeled using a modified MOCCA Monte Carlo Simulation [18, 19, 20] and also the CORSIKA (Version 5.945, QGSJet98) simulation package [17]. Both of these codes demonstrate similar characteristics for the DČ light, and predict that DČ light should be observable against the background EAS Čerenkov light over an energy window which depends on the charge of the primary particle.

3.1 Average Behavior
First we consider the average behavior of the DČ light signal from various incoming particles observed at sea level. The left hand panel of Figure 3 illustrates the angular and time characteristics of DČ light emitted by a single 10 TeV vertical cosmic ray with (Mg) which interacts and produces an EAS deeper in the atmosphere. The time axis corresponds to the time delay compared to a reference arrival time at sea level of a particle traveling at a speed along the incoming nucleus path. The angular axis corresponds to the angle of entry of the photons into the detector compared to the incoming particle trajectory. The photon density of the light is averaged over an annulus extending from 67 m to 94 m from the shower axis, giving an 80m mean radius of the annulus, and the intensity is integrated over a wavelength band of nm. The DČ light emission is clearly seen as an arc on the left of the figure, separated from the Čerenkov emission produced by the EAS. The right hand panel of Figure 3 shows the signal from a single 5 TeV (Be) nucleus. This shower also has an obvious DČ signal, but the intensity of this feature is clearly less well separated from the background.
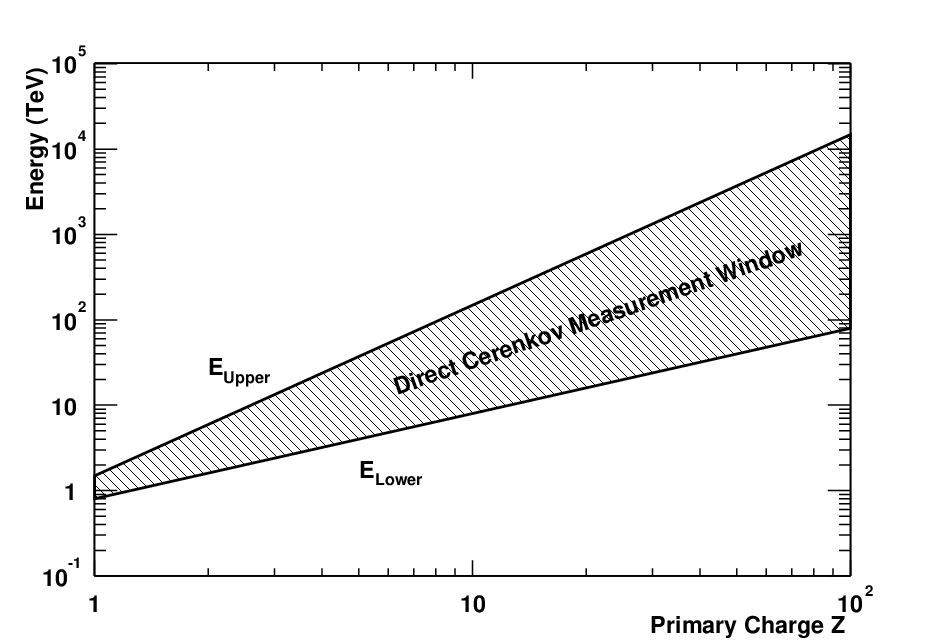
Above a certain energy, the light produced by the EAS development will provide a strong enough background to completely overwhelm the DČ light intensity, thereby making reliable measurements impossible. The DČ light can therefore only be determined over a limited energy window. The lower energy threshold is defined by the threshold for Čerenkov emission, set by (Figure 4), while the upper energy threshold is set as the energy at which the secondary EAS Čerenkov light overwhelms the DČ light.
For heavy nuclei the lower total particle energy threshold for the observation window, , can be described by where is a constant. The upper energy limit for DČ observation, , occurs when the DČ light level is essentially equal to the background light level. Since DČ light emission is proportional to , we can express this as The EAS Čerenkov light is proportional to E, Combining these last two equations gives an expression for the upper energy observation limit:
Hence the relative width of the observation window is
This window expands like for heavy nuclei. This arises because the DČ light scales like , whereas the background level scales like . The results of numerical simulations give similar results to this simple estimate. Figure 5 shows the upper and lower energy limits for DČ observation as a function of primary particle charge . A DČ measurement of Iron nuclei () is possible into the cosmic-ray “knee” region, around TeV.


The separation between the DČ light and the secondary Čerenkov light persists at relatively large cosmic ray zenith angles. The lower right panel of Figure 6 shows the image from a theoretical nucleus at to the zenith. Since both the DČ light radius and the size of the EAS Čerenkov disk grow proportionally with the distance to the observation level, the separation between these two light emission regions persists. An advantage in large angle observation is that the light pool size grows geometrically with zenith angle, thereby increasing the effective detection area for cosmic ray observation. This may prove important for increasing the detector collection area at the highest energies (large Z) where cosmic ray particle fluxes are expected to be low.


4 Resolution Considerations
Above threshold, the DČ light emission is independent of primary energy, making it an ideal measure of the primary charge. However, due to various background, detector resolution, and fluctuation processes, what one actually measures is not only the DČ light emission, but rather the integrated DČ light yield plus all background across the length of the primary cosmic track. We describe each of these effects and their Z dependence, and present a composite plot of the predicted charge resolution effects as a function of the primary charge Z.
4.1 Background Light Levels
Background light sources which may degrade the charge resolution of this technique include fluctuations in the night sky background level, fluctuations in the secondary Čerenkov light emitted by the extensive air shower, and secondary light which is scattered by the atmosphere to the same direction and arrival time as the DČ light signal.
4.1.1 Night Sky Background
The overall background expected by fluctuations in the night-sky light level can be determined from previous measurements at dark sites. The standard background value quoted is photons/(m2 sec sr) over the range nm. This translates to an overall rms intensity scale near 0.01 photons/m2 for the angle/time bin sizes used in Figure 8, substantially smaller than the typical DČ signal. This quantity is independent of the primary charge Z. Since the DČ signal increases as , the night sky background contribution to the charge resolution decreases like .
4.1.2 Secondary Čerenkov Background
Since the threshold energy for observing DČ light increases linearly with increasing Z, the secondary Čerenkov light background, which is proportional to primary energy, also increases linearly. In principle, since the primary cosmic ray energy is measured from the secondary Čerenkov light, the amount of secondary background light in the DČ pixel bins could be estimated. This could be subtracted out to yield a pure DČ light measurement. However, Poisson variations in the secondary Čerenkov background will generate fluctuations in the background-subtracted signal, thereby limiting the DČ light measurement resolution. Consequently, the contribution of the secondary Čerenkov background to the charge resolution has the form
In principle, optimal charge resolution is obtained by matching the detector pixel size and time resolution to the inherent width of the DČ light emission. In our simulation plots, we have used time bins of 500 ps and angular bins of 0.00375∘, close to the optimal values. However, a conservative estimate of the magnitude of the secondary light yield has been determined from the simulations using a coarse 0.2∘ by 6 ns square integration window about the DČ light yield position for a typical shower, in the absence of the DČ light signal. This larger bin size is typical of existing state-of-the-art ground based Čerenkov observatories.
4.1.3 Atmospheric Scattering
The emitted DČ light can possibly be scattered in the lower regions of the atmosphere. Mie and Rayleigh scattering are effects which scatter light from the EAS Čerenkov component into the DČ light beam and also in to the gap in the time versus angle image (see Figure 3) which separates the EAS emission and the DČ light. Rayleigh scattering by air molecules is essentially constant with respect to atmospheric conditions. The Rayleigh process scatters light to large angles (typically 90∘) with respect to the original light beam direction, and therefore should provide very little effect on the separation between DČ light and EAS Čerenkov light. Its main result is to increase the general background light level in every pixel rather than to favor a particular pixel. Less than 5% of the total Čerenkov light is scattered from the narrow image, essentially isotropically. The general increase in background light level due to Rayleigh scattering is negligible.
Mie scattering is scattering from small suspended particles (aerosols) in the atmosphere, and is highly dependent on the aerosol composition, particle size distribution and height distribution. The Mie process acts to deflect the original photon beam out to angles of 5–10∘ off-axis, which is substantially more narrow than the characteristic Rayleigh angle. Because the Mie-scattered light is deflected to relatively narrow angles with respect to the original beam it represents a more serious potential to degrade the performance of the DČ technique. The amount of light scattered from the original beam depends strongly on the aerosol concentration. There are times when absolutely no light is Mie scattered (“molecular” atmosphere), and there are times when the atmosphere may be essentially opaque due to rain, dust storms, pollution, etc. If one is careful to select observation sites which have a large number of purely molecular atmospheric condition at night, one may be able to avoid this problem altogether.
For example, the HiRes Fly’s Eye observatory, located at the Dugway Proving Grounds, Utah, has a large fraction of its observing time (%) with viewing conditions similar to or better than the “standard desert atmosphere” [21]. In this wind-driven aerosol model, typically % of the total light beam is diverted uniformly out to angles of off axis. Because the scattered beam is wider than the original Čerenkov beam width, the general effect is to slightly elevate the background light levels in all pixels rather than in just the pixels relevant for the DČ light measurement. Using small pixels, the effect of the Mie scattered light is substantially reduced. Figure 8 shows the level of background light, including atmospheric scattering, for a 100 TeV iron nucleus event. Clearly the DČ emission remains prominent. At this level, the Mie scattering will likely affect the DČ emission from the lighter nuclei (). Heavier nuclei will be unaffected as their DČ light is much stronger than the Mie scattered light from the EAS.
For purposes of this paper, the resolution limitations due to atmospheric scattering of the secondary Čerenkov light is included in the secondary Čerenkov background calculation (Section 4.1.2).
4.2 Detector Resolution Effects
The detector-induced limitations to the charge resolution include the core position resolution, angular reconstruction resolution, and the error in the measured signal due to fluctuations in the DČ signal photo-electron statistics (which depends upon the camera Quantum Efficiency () and the Mirror area ()). In the below calculations we assume m2 and .
4.2.1 Angular Reconstruction Error
For typical gamma-ray observatories like VERITAS[22] and HESS[23], a primary trajectory angular reconstruction error of is expected. In these simulations, we assume the high-resolution cosmic ray detector has a similar angular reconstruction error. The charge resolution error is then computed by comparing average DČ light yields at a mean radius of 80 m for an ensemble of vertical simulated showers with another ensemble of showers with identical charge and energy, but with a primary zenith angle trajectory of 0.1∘. The resulting error is independent of Z, and very small ().
4.2.2 Core Position Error
Given a gamma-ray observatory like VERITAS[22] with an array of 10 m diameter primary mirrors, the core position can only be localized to approximately 5 meters. Assuming a 5 meter core resolution error, we examine the change in the DČ light yield as a function of distance from the shower core using the Monte Carlo simulation. Figure 7 shows the results of simulations of several thousand vertically incident 100 TeV iron nuclei viewed in a angular by 6 ns delay-time bin centered on the DČ emission region. The dashed histogram shows the DČ light observed in an annulus of m (mean radius 80 m) of the particle path, the solid histogram shows the DČ light observed within an annulus of m (mean radius 57 m). Clearly both of these observations have well defined peaks. Simulations of different Z nuclei show virtually the same ratio of the peak DČ light yield at mean radii of 57 m to 80 m. Using a linear interpolation of the light yield variation with distance to the shower core, one derives a charge resolution error of 3.1% due to core position uncertainty. This charge resolution error is independent of the primary charge .
4.2.3 Photon Statistics
Fluctuations in the photon statistics play an important role for low DČ light emission levels (at small Z). Since the signal is proportional to , the charge resolution scales like
The magnitude of signal is determined from the Monte Carlo Simulation, assuming the above specified values for QE and A.
4.3 Hadronic Interaction Fluctuations
Because the primary particle will eventually suffer hadronic interaction, the length of the DČ light emitting region changes from event to event with the fluctuation in the depth of the first interaction. This leads to a subsequent fluctuation in the DČ light yield. If the interaction point can be identified in the track image (appearing as a sudden drop in emission rate in a sufficiently finely pixelation detector), the integrated yield could be normalized to path length. However, such an analysis in reality is complicated by a finite detector resolution, photon statistics, and the fact that the nucleus does not usually suffer a catastrophic collision in the first interaction. Typically, a nucleus of charge will break up into a charge nucleus and a Helium () nucleus, and therefore continue to emit DČ light at only a modestly reduced rate until it suffers further collisions. Fluctuations in this fragmentation process therefore affect the integrated DČ light yield in a fashion for which there may be no simple correction available.
The fluctuation effects are best illustrated by examining characteristics of a large ensemble of simulated showers. A scatter plot (Figure 9 ) illustrates the distribution of integrated DČ light measured between m from the shower core as a function of the depth of the first nuclear interaction of the primary. The scatter plot has essentially three regions of interest, depending upon the depth of the first interaction.
For cosmic rays which interact less than 7 g/cm2 deep (i.e., at altitudes above km), there are large fluctuations in the DČ light yield. Even nuclei with the same first interaction depth suffer from large fluctuations. The DČ light yield fluctuation is due mainly to the details on how the first interaction proceeds. If the initial interaction yields a large number of low Z fragments, the light yield is low. If the interaction yields only 1 or 2 low Z fragments and the original primary only loses a small amount of charge, then the DČ light yield is high. This region (interaction depth g/cm2) may be referred to as the ‘fragmentation region’ as the magnitude of the DČ light yield in this region is dominated by the details of the fragmentation process. The fragmentation region is illustrated in lower region of Figure 9.
For cosmic rays which interact between g/cm2 in the atmosphere, there is a tight linear relationship between depth of first interaction and the DČ light yield. In essence, as the particle penetrates deeper into the atmosphere, the total amount of DČ light emitted by the full nucleus begins to dominate any DČ light fluctuations generated by fluctuations in the fragmentation process. The DČ light yield can be though of purely geometrically, as the length of the path traveled between g/cm2 before the first interaction in this region. This region may be called the ‘cross-section’ region as the DČ light yield in this region is dominated by the value of the inelastic cross-section. The cross-section region is illustrated in middle region of Figure 9.
For first interactions occurring deeper than 18 g/cm2 (i.e., altitudes below km), the light yield is essentially independent of the interaction depth. This phenomena arises because the DČ light is emitted at a specific emission angle. The emission angle, when coupled with the height of emission, defines the radius at which the DČ light will be observed. When the particle passes beyond 18 g/cm2 without interacting, all the DČ light emitted beyond this depth falls outside the m radial bin used in this plot. Consequently, once the nucleus has passed through 18 g/cm2 without interacting, all light that can be emitted into the m annulus has been emitted, independent of where the subsequent first interaction takes place. This region may be referred to as the ‘saturation region’, as the DČ light yield is essentially saturated to its maximum value. The saturation region is illustrated in upper region of Figure 9.

.
If a detection annulus closer to the particle path is used, the DČ collected will be emitted higher in the atmosphere, as shown in Figure 2. The altitude or grammage boundaries between the fragmentation, cross-section, and saturation regions are therefore functions of the radial distance to the shower core. In this case a particle can interact higher in the atmosphere (still below 40 km), existing in the cross-section region for the outer radius (80 m) but still be in the saturation region for this inner radius (57 m). In addition, the overall light yield in these regions decrease as one decreases the observation radius.
Since particles can exist in the saturation region for one radius and be in the cross-section region for a larger radius, it is possible to extract additional information by examining the ratio of DČ light emitted in different radial bins. For instance, for a particle in the saturation region at 57 m but in the cross-section region at 80 m, the ratio of DČ light measured at the 80 m distance to the DČ light measured at the 57 m distance is strongly correlated with the depth of the first interaction. Consequently, a model-independent measurement of the inelastic nuclear cross-section is possible, even with moderately coarse camera pixels. Determination of size of the fluctuations in the fragmentation process may also be possible using three radial measurements: an outer radius measurement in the fragmentation region, a middle radius measurement in the cross-section region, and an inner radius measurement in the saturation region.
An important concept is that all possible interaction fluctuations can only result in a decrease in the observed DČ light level. This makes DČ light distribution in Figure 10 asymmetric at the lower DČ light intensity level. For example, although nucleus might occasionally yield a very low light DČ signal comparable to a or nucleus, a smaller charge (e.g., ) nucleus cannot emit the DČ light intensity of a nucleus. Consequently interaction fluctuations cannot result in an overestimation of the particle charge, it can only underestimate it.
The interaction fluctuation contribution to the overall resolution is determined from the width of each narrow peak distribution in Figure 10. The resulting Z dependence of the charge resolution is found to be well described by a power law

.
4.4 Overall Resolution
The charge resolution expected from the DČ technique is limited by the combination of the various effects described above. In order to be conservative, we have assumed a detection scheme with an effective collecting area of 100 m2, a core location capability of 5 m, a time resolution of 6 ns, and an angular pixel size of 0.2∘. Figure 11 shows the charge resolution expected resulting from these effects as a function of charge . For low charges the resolution is dominated by secondary Čerenkov light from the EAS. At higher the core resolution provides the charge resolution limitation. The overall resolution is calculated to be for , essentially independent of charge.

In principle, improved charge resolution could be obtained by matching the detector pixel size and time resolution to the inherent width of the DČ light emission (about 500 ps timing and 0.00375∘ wide pixels). Since the resolution function for high Z is dominated by core position error contribution, this would not improve the resolution at large Z. However, it could substantially improve the resolution for as it would reduce the effects of the secondary Čerenkov light in the charge resolution.
5 Detector Design and Applications
A possible design for a DČ imaging observatory can be constructed from the simulation work results. Such an observatory comprises a number of large (10 m diameter) front surface reflecting dishes in fixed mounts. The mounts point vertically for low energy composition measurements, but are adjustable to view at large zenith angles to increase detection area for measuring the higher energy cosmic ray heavy nuclei. The dishes are separated by a distance of 80 m for sea level operation, placed on a hexagonal grid pattern.
Each dish has an isochronous surface in order to preserve the incoming wavefront timing to approximately 2 ns or better. This timing requirement provides additional separation between the DČ light and the secondary Čerenkov light as shown in Figure 3. A highly pixelated optical camera built from small, fast photomultiplier tubes is used at the focal plane to image the Čerenkov light from the cosmic ray shower. In order to have the best resolution and signal-to-noise ratio for the DČ light, small pixels (typically ) are preferred. However, the DČ light measurements can be made with large pixels, up to . A field of view of degrees is needed to provide a sufficient collection aperture. For a field of view, and a fiducial area defined between m of a detector, each dish has an effective collection aperture of m2sr.
Light striking the individual pixels is read out by a fast FADC system, with 500 MHz sampling rate or faster, enabling an image to be constructed in time versus/angle like those shown in Figure 3. A key advantage of the DČ method over the observations of Čerenkov light high in the atmosphere is that the triggering of the system is relatively simple. Since a significant part of the EAS will develop in the field of view of the telescopes, this large light signal can be used to provide a simple trigger scheme. A Čerenkov light signal produced by an EAS with energies 10 TeV can be reliably discriminated from the night sky by simple logic on the camera pixels for a 10 m mirror size. Using individual-tube constant fraction discriminators, hit patterns from multiple pixels are combined using fast logic tables to look for sequences of pixels with characteristics similar to a Čerenkov image. Once a mirror is triggered, it retrieves a history of photon time slices from the FADC system for about nanoseconds around the trigger time to look for the delayed DČ light signal. Neighboring telescopes in the array would also be read out to look for coincidence measurement of the same Čerenkov image from different observation angles. The data from multiple telescopes is combined to determine the shower geometry, energy, and DČ light content. Importantly, events can be required to contain consistent amounts of DČ light intensity and location in multiple telescopes. This procedure can reject essentially all light signal contamination from local sources, for example local muons, and verify the level of DČ emission from independent measurements.
The total detection aperture is not only affected by the physical size of the obervatory and the field of view of each camera; it is also affected by additional constraints needed to observd the DČ, light such as requiring the shower core to strike in an annulus between 50-115 m from the individual detectors. Because we are using an array of multiple telescopes, in general the shower core will fall within an acceptable distance from more than one telescope over most of the area surrounding the array. Additional considerations, such as field of view, also restricts the detection aperture. These considerations are similar to those imposed on typical ground-based gamma ray observatories (e.g. VERITAS), and consequently we expect a similar detection aperture to these devices (i.e. several thousand m2sr). However, an accurate determination of the detector acceptance, including energy and charge dependence of the aperture, can only be accomplished through detailed Monte Carlo simulation. This simulation must include a detailed model of an assumed detector configuration (array spacing, mirror area, pixel size, electronic triggering charateristics, etc). Monte Carlo calculations for a typical strawman observatory configuration, modeled after the VERITAS observatory, are underway and will be presented in a subsequent paper.
We note that the next generation of imaging Čerenkov telescope arrays, including VERITAS[22], HESS[23], and CANGAROO[24] all begin to approach the strawman design, and will likely be able to provide a first measurement of DČ light. An intriguing possibility is to use the DČ light to reject background in these experiments. The ability to distinguish between the Čerenkov signals produced by electrons and gamma rays in the GeV energy range is important for substantial improvement in the sensitivity of ground-based gamma-ray astronomy. In this energy range, protons and heavy nuclei do not produce secondary particles with sufficient energies to generate substantial Čerenkov light. The majority of the background events for gamma ray instruments in this region are produced by cosmic ray electrons, which also generate pure electromagnetic air showers, with EAS Čerenkov image characteristics identical to a gamma ray primaries. The capability to identify even a small fraction of the electron events could make significant improvements in the sensitivity of gamma-ray telescopes in this energy range. The upper left hand panel of Figure 6 shows an angle/time image of a simulated vertical gamma-ray shower at 10 TeV. The upper left panel shows a vertical electron at 100 GeV. This second event could be identified as an electron if the faint DČ image arc at the left of the panel is detected. The intensity in this arc is 5 times the expected night sky background.
A similar background occurs in the 500 GeV TeV range for protons which transfer most of their primary energy to one or two secondaries in their first interaction, leaving little energy for further hadronic interaction (i.e., generation of which decay to muons). These types of events represents a substantial amount of the residual cosmic ray background after applying standard image analysis cuts to select gamma rays. Since these proton-induced events are pre-selected to have image characteristics similar to gamma rays, additional parameters must be used to reject these events. The lower left hand panel in Figure 6 shows an event in which the DČ signal from a proton has transferred most of its energy to an initial during the interaction. In comparison with the gamma-ray events these type of events might possibly be rejected using finely-grained timing and angular imaging.
6 Conclusions
We have discussed a new experimental technique which can potentially yield excellent charge resolution measurements ( for ) for ground-based observations of high energy cosmic rays. The technique relies upon the observation of the direct Čerenkov light emitted by the primary nucleus before the first nuclear interaction with the Earth’s atmosphere. The experimental technique works over an energy range in the TeV-PeV energy range, with the width of the energy window growing like for heavy nuclei. A dedicated observatory could be built to observe cosmic rays using his technique, while the next-generation ground-based imaging Čerenkov telescopes such as VERITAS, HESS, and CANGAROO will begin to approach the sensitivity required to begin initial observations.
The average intensity and fluctuations in the DČ light yield have been examined using Monte Carlo simulations. The yield contains the expected dependence with fluctuations that are easily understandable in terms of the radial distance of observation, variations in the depth of first hadronic interaction, and the details of the subsequent fragmentation process. Indeed, DČ light measurement appears to provide a method to measure the primary charge independent of any hadronic interaction or fragmentation model. This could potentially solve the most difficult systematic problem in the ground-based studies of TeV/PeV cosmic rays: the difficulty in distinguishing between actual changes in composition and systematic shifts of nuclear interaction models with energy. The high resolution nature of this measurement might allow the detection of changes in the propagation pathlength distribution at high energy. The pathlength distribution at PeV energies is unknown, but has a extremely strong effect on the predicted composition at the knee of the all-particle spectrum [25].
The DČ light measurement technique could provide researchers with a “tagged particle beam” of known energy and composition. By examining DČ light yield at various radial bins, one may be able to extract nucleon-air cross-section information as a function of primary mass and energy, independent of an interaction model. Fluctuations in the DČ light yield for small interaction depths could provide information concerning the fluctuations in the fragmentation processes of nucleus-air interactions.
The DČ light measurement technique may provide additional sensitivity to ground-based imaging air Čerenkov gamma-ray detector for the rejection of the dominant electron background in the GeV energy range, and residual proton background in the TeV energy range. Such an improvement could potentially increase the point source sensitivity of these telescopes by an order of magnitude or more.
The unique properties of DČ light (versus EAS light) may allow the observation of exotic cosmic ray particles, such as “strange quark matter” (see, e.g., [26, 27]) or magnetic monopoles [28]. These particles, which are thought to have large effective charges, would provide an extremely strong DČ signature due to the dependence of the light yield.
A technique which combines the collection power and logistical advantages of ground-based cosmic ray detectors with the high-precision charge resolution of balloon or satellite-borne experiments would be a valuable asset in the field of high-energy astrophysics. Such a technique, if scientifically and financially viable, has the potential to make great strides in the determination of cosmic ray composition across the “knee”, and subsequently, foster advances in the theory of cosmic ray origins. We believe that the development of imaging atmospheric Čerenkov telescopes has provided the means to target the Čerenkov light emitted directly from primary nuclei prior to their hadronic interaction in the atmosphere. A direct Čerenkov experiment, implemented as an array of 10 m reflectors imaged by high-resolution cameras with fast ADC systems may prove to be the next step towards understanding the nearly century-old mystery of cosmic rays.
Acknowledgements The authors express their appreciation for useful discussions with members of the VERITAS collaboration during the preparation of this paper. DBK acknowledges computational support from the Utah High Energy Astrophysics Institute.
References
- [1] A. R. Bell, MNRAS 182 (1978) 147.
- [2] A. R. Bell, MNRAS 182 (1978) 443.
- [3] R. D. Blandford, J. P. Ostriker, ApJ Lett. 221 (1978) L29.
- [4] G. F. Krymsky, Dokl. Akad. Nauk. USSR 236 (1977) 1306.
- [5] R. Schlickeiser, Ap. J. Suppl. 90 (1994) 929.
- [6] P. O. Lagage, C. J. Cesarsky, A & A 125 (1983) 249.
- [7] N. Hayashida, et al., Astrophys. J. 522 (1999) 225.
- [8] E. Juliusson, P. Meyer, D. Müller, Phys. Rev. Lett. 29 (1972) 445.
- [9] P. M. S. Blackett, Physical Society of London Gassiot Committee Report 1 (1948) 34.
- [10] W. Galbraith, J. V. Jelley, Nature 171 (1953) 349.
- [11] T. C. Weekes, et al., Astrophysical Journal 342 (1989) 379.
- [12] T. C. Weekes, K. E. Turver, Proc. 12th ESLAB Symp. (Frascati) ESA SP-124 (1977) 279.
- [13] K. Sitte, Proc. 9th ICRC (London) 2 (1965) 887.
- [14] M. P. Gough, J. Phys. G: Nucl. Phys. 2 (12) (1976) 965.
- [15] R. K. Sood, Nature 301 (1983) 44.
- [16] D. Seckel, et al., Proc. 26th ICRC (Salt Lake City) 3 (1999) 171.
- [17] D. Heck, et al., Forschungszentrum Karlsruhe Report FZKA 6019.
- [18] A. M. Hillas, J. Phys. G:Nucl. Phys. G8 (1982) 1461.
- [19] A. M. Hillas, J. Phys. G:Nucl. Phys. G8 (1982) 1475.
- [20] D. B. Kieda, Astroparticle Physics 4 (1995) 133.
- [21] P. Sokolsky, Extremely High Energy Cosmic rays:Astrophysics and Future Observatories, ICRR, Tokyo (1996) 253.
- [22] F. Krennrich, et al., GeV-TeV Gamma Ray Astrophysics Workshop, Snowbird: AIP Conference Proceedings 515 (2000) 515.
- [23] W. Hofmann, et al., GeV-TeV Gamma Ray Astrophysics Workshop, Snowbird: AIP Conference Proceedings 515 (2000) 500.
- [24] M. Mori, et al., GeV-TeV Gamma Ray Astrophysics Workshop, Snowbird: AIP Conference Proceedings 515 (2000) 485.
- [25] S. Swordy, Proc. 24th ICRC (Rome) 2 (1995) 697.
- [26] S. Banerjee, S. K. Ghosh, S. Raha, D. Syam, J. Phys. G G25 (1999) L15.
- [27] S. Banerjee, S. K. Ghosh, S. Raha, D. Syam, Phys. Rev. Lett. 85 (2000) 1384–1387.
- [28] S. D. Wick, et al., submitted to Astroparticle Physics .