Radiation pressure powers quasar broad absorption line winds but fails to drive galaxy feedback
Abstract
Most cosmological simulations invoke quasar-driven winds as the primary mechanism quenching star formation in massive galaxies, assuming wind momentum flux approaches the radiation-pressure maximum, . Using 81,388 broad absorption line troughs from the SDSS-IV DR16 quasar catalog and detailed mock trough spectra, we detect line locking, a spectral signature of radiation-pressure-driven outflows, in 60 to 70 percent of troughs, demonstrating that radiative line driving dominates wind acceleration and ruling out alternative mechanisms. Direct measurement of the wind energy budget yields a median kinetic luminosity of only 0.01 percent of bolometric luminosity, 50 times below the level required for effective feedback. Line-driven quasar winds are therefore insufficiently powerful to quench star formation, challenging the primary physical mechanism invoked for black hole feedback in galaxy formation models.
The “overcooling problem,” in which early galaxy formation models without feedback mechanisms predicted far too many massive, actively star-forming galaxies, motivated the adoption of active galactic nucleus (AGN) feedback as a cornerstone of modern cosmological simulations [75, 14, 76]. Over the last decade, simulations modeling galaxy populations across cosmic time and over cosmological volumes have incorporated AGN feedback prescriptions to reproduce the observed scaling relations between black hole mass and host galaxy properties [64, 73, 15]. In practice, “quasar mode” feedback in these simulations is understood to operate through broad absorption line (BAL) winds – high velocity, blueshifted outflows observed in 20 to 40 percent of luminous quasars [5] – with sub-grid feedback prescriptions tuned to match observed black hole and galaxy scaling relations under the assumption that wind momentum fluxes approach [30, 40]. These prescriptions are calibrated to reproduce observations rather than derived from first principles of wind physics, and whether the assumed wind properties are physically achievable has remained an open question.
Several physical mechanisms have been proposed to drive BAL winds, including radiation pressure on resonance lines, radiation pressure on electrons, or on dust grains, magnetic fields, and thermally driven winds [66, 55, 37, 58, 6]. Identifying which mechanism dominates has important implications, as the dominant mechanism sets the maximum momentum and energy the wind can deliver to its host galaxy, and therefore determines whether quasar winds can plausibly produce the feedback invoked in galaxy formation simulations.
Line locking provides a decisive observational test of the driving mechanism. When two gas clouds in a radially accelerating outflow are separated by a relative velocity equal to the rest-frame wavelength splitting of a resonance doublet, e.g., the splitting of the C IV doublet, the upstream cloud casts a shadow on the downstream cloud at the wavelength of its red doublet component. This shadow reduces the downstream cloud’s radiative acceleration and can lock the relative velocity of the two clouds at the doublet splitting velocity [8, 47]. This phenomenon arises uniquely through radiation pressure acting on resonance lines, and as such, its detection in an outflow constitutes direct evidence that line driving dominates the acceleration of that outflow, simultaneously constraining the contribution of any other proposed mechanism.
Earlier work [47] reported a ubiquitous line-locking signature in stacked BAL spectra, but the physical reality of the detection could not be confirmed because stacking artifacts, such as contamination from accidentally aligning on the red doublet component rather than the blue, could in principle mimic the signal. Here we present a definitive detection of C IV line locking using 81,388 BAL troughs drawn from the SDSS-IV DR16 quasar catalog [43], measuring a line locking fraction of 60 to 70 percent and validating the result against an extensive kernel-density-estimation-based mock spectral framework. We then use the confirmed dominance of radiative line driving to derive a robust measurement of the kinetic energy budget of these winds. Our results directly challenge the physical basis of quasar-mode AGN feedback as implemented in many current galaxy formation models.
Most broad absorption line outflows show line locking
We searched for C IV (1548, 1551 Å) broad ( km s-1) absorption troughs in the Sloan Digital Sky Survey (SDSS-IV) Data Release 16 (DR16) quasar catalog [43], which contains approximately 750,000 confirmed quasars spanning redshifts . Using the baltools software [27, 46] to identify and characterize absorption troughs, and applying quality cuts on continuum fit quality, signal-to-noise ratio, and BAL probability (Table S1; see Materials and Methods), we assembled a final sample of 81,388 C IV absorption troughs. Constructing weighted composite (stacked) spectra by centering each trough on its flux minimum (see Materials and Methods), we detect a triplet absorption feature with components at the C IV blue doublet wavelength ( Å), red doublet wavelength ( Å), and the wavelength expected for line-locked absorption ( Å, corresponding to a velocity separation of 497 km s-1; Fig. 1).
To rigorously verify that the observed signal at is physical rather than a stacking artifact, we constructed 29,332 mock absorption spectra without line locking using a six-parameter Gaussian kernel density estimator (KDE) trained on the real trough parameter distributions, including their pairwise correlations (see Materials and Methods). When stacked, these mocks reproduce the C IV doublet structure but produce no absorption at (Fig. 1, green line). Three independent tests confirm the physical origin of the signal (see Materials and Methods): accidental red-doublet-line contamination in the stack is below 1 percent; the feature persists independent of trough width, ruling out extended trough morphology; and mocks incorporating a line-locked third absorption component reproduce the real data only when that component is present.
To quantify the prevalence of line locking, we fit the stacked spectrum with a physically motivated model combining line-locked two-cloud systems, single-cloud systems, and contamination from misaligned stacking (see Materials and Methods). Evaluating this model at , , and for covering fractions between 80 and 100 percent and contamination fractions between 0 and 1 percent, we measure a line locking fraction of 60 to 70 percent (Fig. 2). The fitted C IV optical depths are of order unity, consistent with theoretical expectations for line-driven winds at high outflow velocities [55]. This prevalence, approximately two thirds of all BAL troughs exhibiting a sustained velocity lock, indicates that radiative line driving is the dominant acceleration mechanism for the majority of quasar outflows. Combined with the 20 to 40 percent of luminous quasars that exhibit broad absorption troughs, this implies that radiative line driving observably operates in roughly one quarter of all quasars, a lower limit given the factors that can suppress the line locking signature even when present (Supplementary Text).
Broad absorption line winds cannot power galaxy feedback
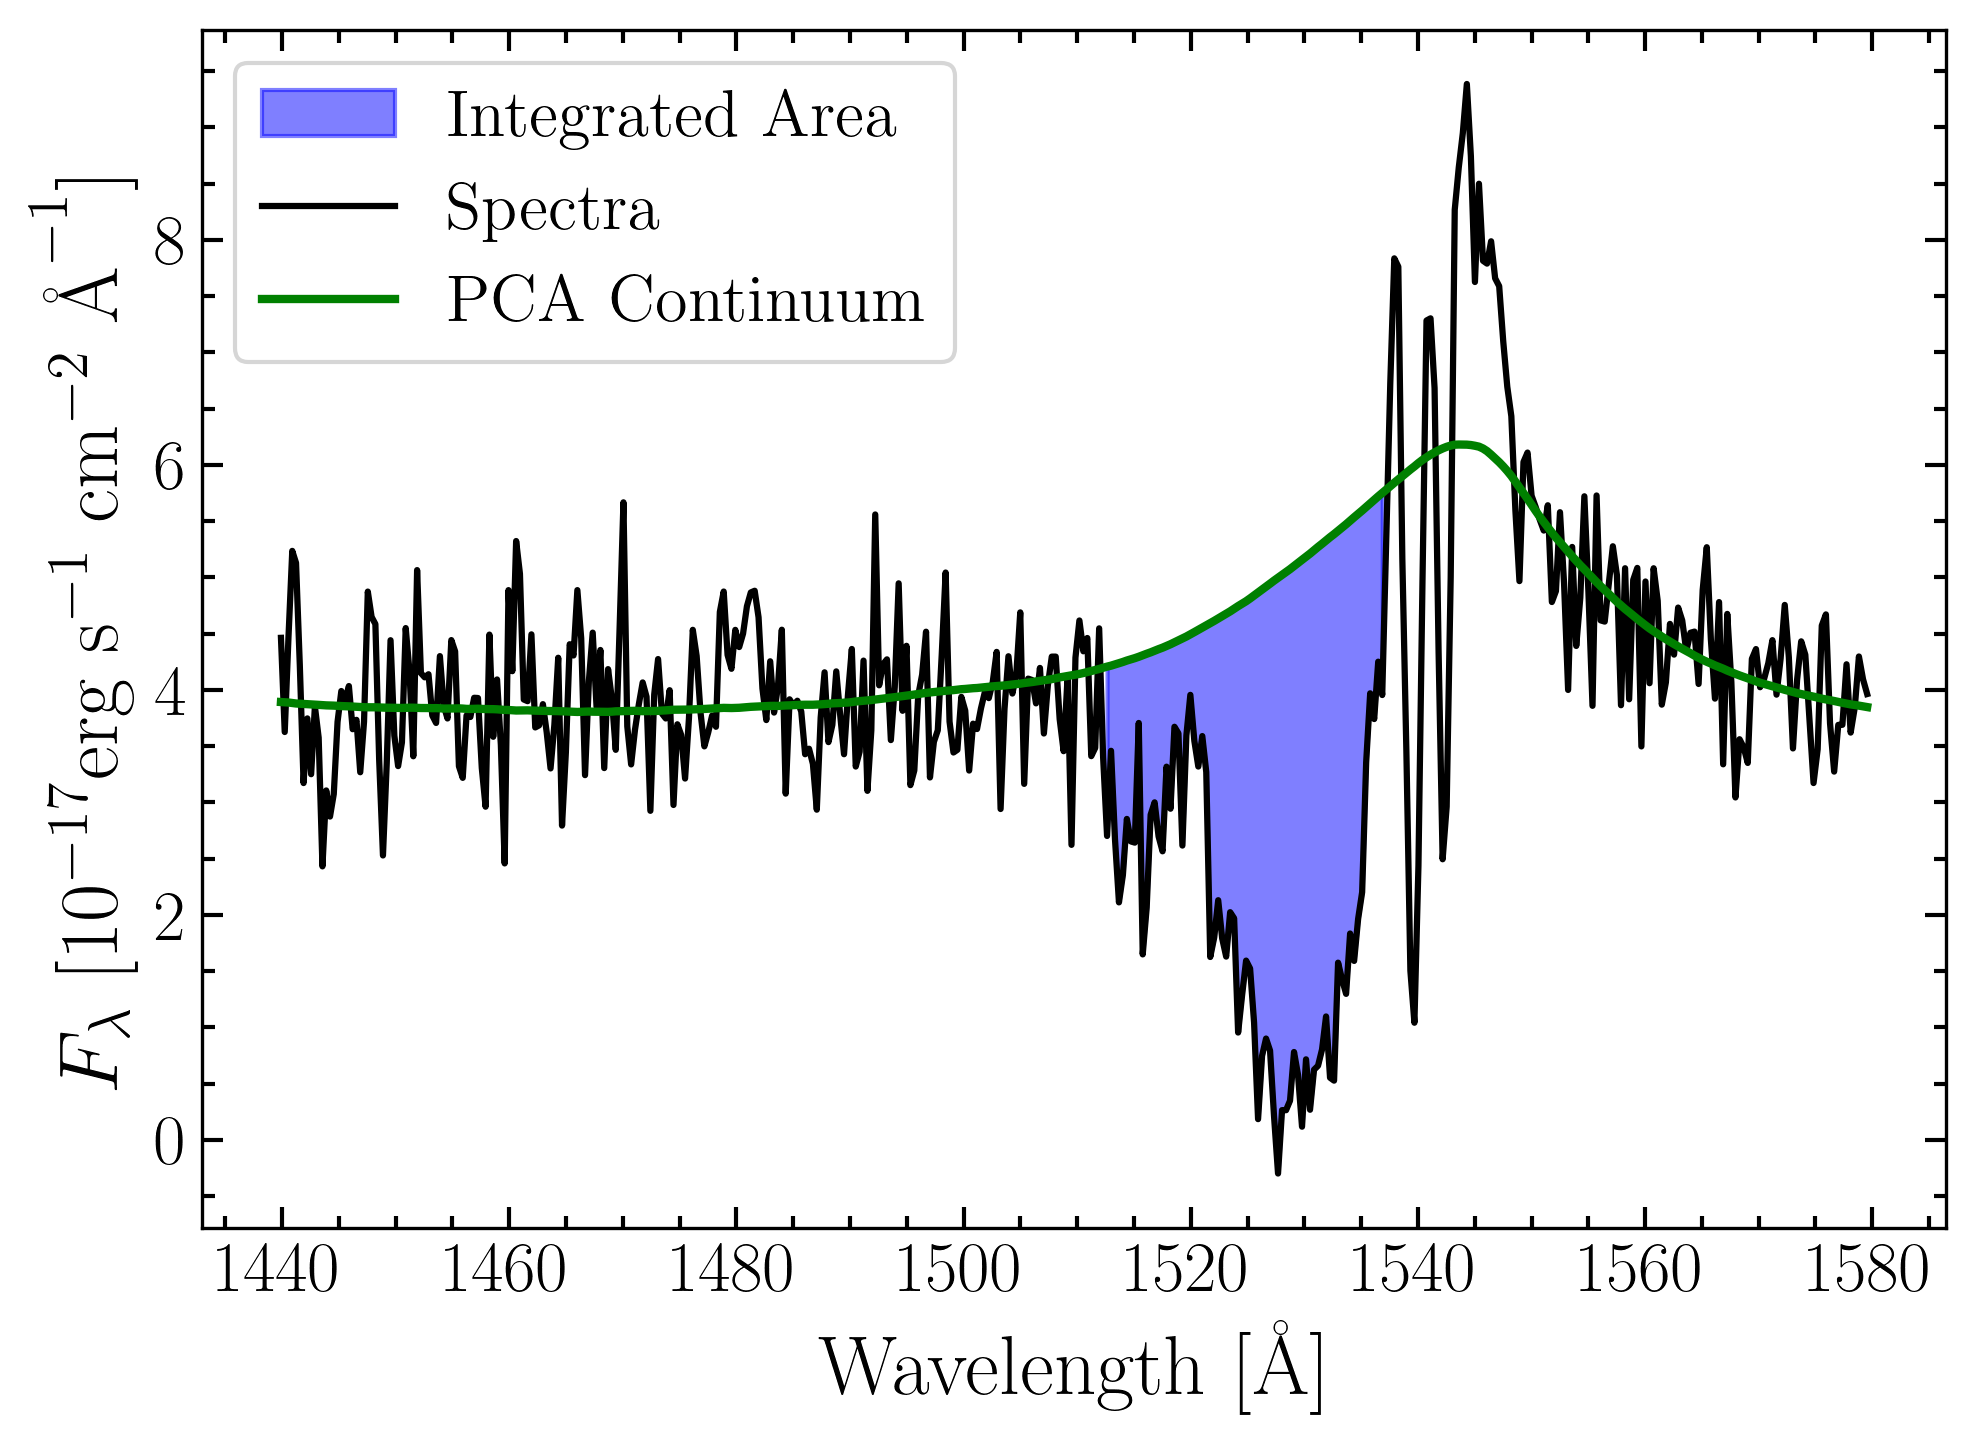
Having established that radiative line driving dominates the acceleration of these outflows, we measured their momentum and energy budget. For 116,428 troughs identified in 73,442 quasars, we measured the absorbed C IV flux by integrating the area between the quasar continuum and the observed trough spectrum, and extended this measurement across the full rest-frame range of 900 to 1600 Å to account for absorption from N V , O VI , and other ionic species, using velocity-dependent corrections for the fractional contribution of C IV to the total absorbed flux (see Materials and Methods). Applying a covering fraction , derived from the fraction of DR16 quasars exhibiting outflow absorption features, and invoking momentum conservation under the assumption of single scattering, we derived a mass outflow rate for each trough.
The resulting distribution of mass outflow rates spans to 5 yr-1, with a median of 0.08 yr-1, corresponding to approximately 10 percent of the inferred mass accretion rate (Fig. 3). The absorbed luminosity comprises approximately 1 percent of the bolometric luminosity, and the resulting wind kinetic luminosities, , have a median value of 0.01 percent of (Fig. 3).
Current theoretical models and cosmological simulations of AGN feedback require kinetic luminosities of 0.5 to 5 percent of to reproduce the observed relation between black hole mass and host galaxy velocity dispersion, and to quench star formation in massive galaxies [30, 40]. Our measured median value falls 50 to 500 times below this required range. This shortfall persists under the most generous possible correction: assuming 100 percent covering fraction rather than 38 percent raises to only 0.03 percent, still an order of magnitude below the lowest feedback threshold invoked in the literature.
The demonstrated dominance of radiative line driving is what makes this shortfall a firm conclusion rather than a lower limit subject to revision. If the dominant driving mechanism were uncertain, a low measured momentum flux could in principle be rescued by invoking unmeasured contributions from dust radiation pressure, magnetic driving, or thermal pressure. The 60 to 70 percent line locking fraction instead demonstrates observationally that radiation pressure on lines is the dominant mechanism operating in the large majority of these outflows, which places a firm upper limit on the contribution any alternative mechanism can be making. A kinetic luminosity deficit of 50 to 500 times cannot be closed by appealing to mechanisms that the data show are not operating at significant levels.
Density-based clustering of the outflow sample (DBSCAN [20]; see Materials and Methods) reveals two distinct populations (Fig. 3). A high-mass-outflow-rate population exhibits wider, slower troughs, a clear line locking signature, and significant dust reddening. A low-mass-outflow-rate population consists of narrow (2,000 km s-1), high-velocity (8,000 km s-1) troughs with no detectable line locking and minimal dust extinction, properties more consistent with intervening absorbers than with genuine outflowing wind material (Supplementary Text). The kinetic luminosity deficit is concentrated in the high-mass population where line locking is confirmed, demonstrating that our feedback conclusion applies specifically to genuine line-driven winds.
Radiative driving dominates the acceleration region
To characterize the physical conditions required for line locking, we modeled the wind kinematics using the standard Castor, Abbott & Klein (CAK) formalism for line-driven winds [11], adapted for the geometry and rotational support of an AGN accretion disk [55] (see Materials and Methods). For fiducial parameters appropriate to a luminous quasar (, ), the wind is launched at a radius cm and reaches a terminal velocity of order 30,000 km s-1 (Fig. 4).
Line locking requires that the fractional reduction in acceleration produced by shadowing, , exceed the relative difference in acceleration between two clouds separated by the C IV doublet velocity [8]. We estimate from three independently measurable quantities (see Materials and Methods): the relative importance of line driving compared to other forces (, justified self-consistently below); the fractional contribution of C IV to the total absorbed flux (, measured directly from our extended absorption spectra); and the fraction of C IV photon flux actually blocked during a lock (, from the measured difference between line-locked and single-cloud absorption profiles). Together these give , which satisfies the line locking condition for outflow velocities greater than up to approximately 10,000 km s-1 (Fig. 4, green region).
We observe line locking signatures across a substantially wider range, from below 2,100 km s-1 to above 13,200 km s-1 (Fig. 5). This broad observed velocity range is inconsistent with any scenario in which line driving is subdominant: if continuum scattering, magnetic forces, or dust absorption contributed comparably to the wind acceleration, would be substantially smaller, restricting line locking to a much narrower velocity range than is observed. The wide velocity range over which line locking is detected therefore self-consistently validates the assumption on which our mass outflow measurement depends.
The persistence of the signature beyond 10,000 km s-1 is consistent with finite cloud dispersion timescales: gas clouds leaving the actively line-locked region at 10,000 km s-1 continue to drift with their relative velocity separation intact, and can travel to 22,000 km s-1 before the configuration disperses (see Materials and Methods). The observation of line locking at velocities below shows that our simple dynamical model is inadequate. One clear oversimplification that might be relevant is the assumption of purely radial flow lines. Since the likely source of the outflowing gas is the accretion disk, we would expect the flow to be non-radial, particularly near the launching radii. In that case, the line of sight velocity may be well below the local wind speed, resulting in line locking appearing to occur at very low velocity.
A challenge to galaxy formation models
Our results present a direct empirical challenge to a foundational assumption of current galaxy formation models. Simulations reproduce the observed relations between black hole mass and host galaxy properties by invoking AGN feedback winds carrying momentum flux approaching [64, 73, 15, 30, 40]. We show that the kinetic luminosity of line-driven quasar winds, the mechanism conventionally invoked for this feedback, falls 50 to 500 times below the level simulations require to reproduce observed black hole and galaxy scaling relations. Reproducing the observed feedback energy budget therefore requires either a different physical mechanism or a substantial revision to how feedback is implemented.
Two physical mechanisms remain plausible candidates for supplying the additional feedback energy galaxy formation models require. Ultra-fast outflows detected in X-ray spectra at velocities of order one tenth the speed of light [70, 50, 25] potentially carry substantially more kinetic energy than the UV-absorbing BAL winds characterized here. Radio jets are established drivers of feedback in galaxy groups and clusters [51] and may contribute during the quasar phase in radio-loud systems. Our results shift the observational burden onto these mechanisms, and motivate both comprehensive characterization of ultra-fast outflow energetics and theoretical work connecting small-scale jets to galaxy-scale quenching.
Line-driven BAL winds remain a ubiquitous and now physically well-characterized component of quasar activity. Direct observational proof of their dominant driving mechanism, combined with a measurement of their resulting energy budget, demonstrates that they cannot supply the feedback energy current cosmological simulations require, fundamentally constraining the landscape of viable AGN feedback physics in galaxy formation.


References and Notes
- [1] (2015) On the Interplay between Star Formation and Feedback in Galaxy Formation Simulations. Astrophys. J. 804 (1), pp. 18. External Links: Document, 1404.2613 Cited by: Extended background on AGN feedback.
- [2] (1989) Abundances of the elements: Meteoritic and solar. Geochim. Cosmochim. Acta 53 (1), pp. 197–214. External Links: Document Cited by: Column density measurements.
- [3] (1999) What Determines the Depth of Broad Absorption Lines? Keck HIRES Observations of BALQSO 1603+3002. Astrophys. J. 524 (2), pp. 566–571. External Links: Document, astro-ph/9903140 Cited by: Line locking fraction model.
- [4] (2010) A Comprehensive Analysis of Uncertainties Affecting the Stellar Mass-Halo Mass Relation for 0 ¡ z ¡ 4. Astrophys. J. 717 (1), pp. 379–403. External Links: Document, 1001.0015 Cited by: Extended background on AGN feedback.
- [5] (2023) The Fraction and Kinematics of Broad Absorption Line Quasars across Cosmic Time. Astrophys. J. 952 (1), pp. 44. External Links: Document, 2301.09731 Cited by: Interpretation of the line locking fraction, Radiation pressure powers quasar broad absorption line winds but fails to drive galaxy feedback.
- [6] (1982) Hydromagnetic flows from accretion disks and the production of radio jets.. Mon. Not. R. Astron. Soc. 199, pp. 883–903. External Links: Document Cited by: Extended background on AGN feedback, Radiation pressure powers quasar broad absorption line winds but fails to drive galaxy feedback.
- [7] (2006) Breaking the hierarchy of galaxy formation. Mon. Not. R. Astron. Soc. 370 (2), pp. 645–655. External Links: Document, astro-ph/0511338 Cited by: Extended background on AGN feedback.
- [8] (1989) A Non–Steady State Line Locking in Broad Absorption Line Quasi-stellar Objects. Astrophys. J. 342, pp. 100. External Links: Document Cited by: Radiative driving dominates the acceleration region, Line locking formalism, Line locking formalism, Radiation pressure powers quasar broad absorption line winds but fails to drive galaxy feedback.
- [9] (2023) Performance of the Quasar Spectral Templates for the Dark Energy Spectroscopic Instrument. Astron. J. 166 (2), pp. 66. External Links: Document, 2305.10426 Cited by: Quasar spectra and trough selection.
- [10] (2013) Density-based clustering based on hierarchical density estimates. In Advances in Knowledge Discovery and Data Mining, J. Pei, V. S. Tseng, L. Cao, H. Motoda, and G. Xu (Eds.), Berlin, Heidelberg, pp. 160–172. Cited by: Two-population clustering and dust reddening.
- [11] (1975) Radiation-driven winds in Of stars.. Astrophys. J. 195, pp. 157–174. External Links: Document Cited by: Figure 4, Radiative driving dominates the acceleration region, CAK wind dynamics and line locking.
- [12] (2025) Tracking Outflow Using Line Locking (TOLL). II. Large Line-locking Web Identified in Quasar J151352+085555. Astrophys. J. 980 (1), pp. 28. External Links: Document, 2501.06734 Cited by: Line locking formalism, Limitations.
- [13] (2022) Evidence for the connection between star formation rate and the evolutionary phases of quasars. Nature Astronomy 6, pp. 339–343. External Links: Document, 2111.09594 Cited by: Extended background on AGN feedback.
- [14] (1991) Modeling Galaxy Formation in Evolving Dark Matter Halos. Astrophys. J. 367, pp. 45. External Links: Document Cited by: Extended background on AGN feedback, Radiation pressure powers quasar broad absorption line winds but fails to drive galaxy feedback.
- [15] (2015) The EAGLE simulations of galaxy formation: calibration of subgrid physics and model variations. Mon. Not. R. Astron. Soc. 450 (2), pp. 1937–1961. External Links: Document, 1501.01311 Cited by: A challenge to galaxy formation models, Radiation pressure powers quasar broad absorption line winds but fails to drive galaxy feedback.
- [16] (2006) The many lives of active galactic nuclei: cooling flows, black holes and the luminosities and colours of galaxies. Mon. Not. R. Astron. Soc. 365 (1), pp. 11–28. External Links: Document, astro-ph/0508046 Cited by: Extended background on AGN feedback.
- [17] (2016) The SDSS-IV Extended Baryon Oscillation Spectroscopic Survey: Overview and Early Data. Astron. J. 151 (2), pp. 44. External Links: Document, 1508.04473 Cited by: Quasar spectra and trough selection.
- [18] (2005) Energy input from quasars regulates the growth and activity of black holes and their host galaxies. Nature 433 (7026), pp. 604–607. External Links: Document, astro-ph/0502199 Cited by: Extended background on AGN feedback.
- [19] (1992) Magnetic Acceleration of Broad Emission-Line Clouds in Active Galactic Nuclei. Astrophys. J. 385, pp. 460. External Links: Document Cited by: Extended background on AGN feedback.
- [20] (1996) A density-based algorithm for discovering clusters in large spatial databases with noise.. In KDD, E. Simoudis, J. Han, and U. M. Fayyad (Eds.), pp. 226–231. External Links: ISBN 1-57735-004-9, Link Cited by: Broad absorption line winds cannot power galaxy feedback, Two-population clustering and dust reddening.
- [21] (2002) On the detectability of distant Compton-thick obscured quasars. Mon. Not. R. Astron. Soc. 329 (1), pp. L18–L22. External Links: Document, astro-ph/0111422 Cited by: Extended background on AGN feedback.
- [22] (2012) Observational Evidence of Active Galactic Nuclei Feedback. Annu. Rev. Astron. Astrophys. 50, pp. 455–489. External Links: Document, 1204.4114 Cited by: Extended background on AGN feedback.
- [23] (2024) Broad absorption line quasars in the Dark Energy Spectroscopic Instrument Early Data Release. Mon. Not. R. Astron. Soc. 532 (4), pp. 3669–3681. External Links: Document, 2309.03434 Cited by: Quasar spectra and trough selection.
- [24] (2000) A Relationship between Nuclear Black Hole Mass and Galaxy Velocity Dispersion. Astrophys. J. Lett. 539 (1), pp. L13–L16. External Links: Document, astro-ph/0006289 Cited by: Extended background on AGN feedback.
- [25] (2024) Supermassive Black Hole Winds in X-rays: SUBWAYS. III. A population study on ultra-fast outflows. Astron. Astrophys. 687, pp. A235. External Links: Document, 2403.09538 Cited by: A challenge to galaxy formation models.
- [26] (2009) A Catalog of Broad Absorption Line Quasars in Sloan Digital Sky Survey Data Release 5. Astrophys. J. 692 (1), pp. 758–777. External Links: Document, 0810.2747 Cited by: Mass outflow rate measurement.
- [27] (2019) Classification of Broad Absorption Line Quasars with a Convolutional Neural Network. Astrophys. J. 879 (2), pp. 72. External Links: Document, 1901.04506 Cited by: Most broad absorption line outflows show line locking, Quasar spectra and trough selection.
- [28] (1997) Metal Abundances and Ionization in Quasar Intrinsic Absorbers. Astrophys. J. Suppl. 109 (2), pp. 279–305. External Links: Document, astro-ph/9704249 Cited by: Column density measurements.
- [29] (2003) The Frequency and Radio Properties of Broad Absorption Line Quasars. Astron. J. 125 (4), pp. 1784–1794. External Links: Document, astro-ph/0301191 Cited by: Mass outflow rate measurement.
- [30] (2010) Quasar feedback: more bang for your buck. Mon. Not. R. Astron. Soc. 401 (1), pp. 7–14. External Links: Document, 0904.0649 Cited by: Broad absorption line winds cannot power galaxy feedback, A challenge to galaxy formation models, Radiation pressure powers quasar broad absorption line winds but fails to drive galaxy feedback.
- [31] (2014) Galaxies on FIRE (Feedback In Realistic Environments): stellar feedback explains cosmologically inefficient star formation. Mon. Not. R. Astron. Soc. 445 (1), pp. 581–603. External Links: Document, 1311.2073 Cited by: Extended background on AGN feedback.
- [32] (2011) Self-regulated star formation in galaxies via momentum input from massive stars. Mon. Not. R. Astron. Soc. 417 (2), pp. 950–973. External Links: Document, 1101.4940 Cited by: Extended background on AGN feedback.
- [33] (2012) Stellar feedback in galaxies and the origin of galaxy-scale winds. Mon. Not. R. Astron. Soc. 421 (4), pp. 3522–3537. External Links: Document, 1110.4638 Cited by: Extended background on AGN feedback.
- [34] (2024) Are BAL outflows powered by radiation pressure on dust?. Mon. Not. R. Astron. Soc. 533 (4), pp. 4384–4392. External Links: Document, 2409.03842 Cited by: Extended background on AGN feedback.
- [35] (2014) The MaGICC volume: reproducing statistical properties of high-redshift galaxies. Mon. Not. R. Astron. Soc. 437 (4), pp. 3529–3539. External Links: Document, 1302.2618 Cited by: Extended background on AGN feedback.
- [36] (2000) A unified model for the evolution of galaxies and quasars. Mon. Not. R. Astron. Soc. 311 (3), pp. 576–588. External Links: Document, astro-ph/9906493 Cited by: Extended background on AGN feedback.
- [37] (2003) Black Holes, Galaxy Formation, and the M- Relation. Astrophys. J. Lett. 596 (1), pp. L27–L29. External Links: Document, astro-ph/0308342 Cited by: Extended background on AGN feedback, Extended background on AGN feedback, Radiation pressure powers quasar broad absorption line winds but fails to drive galaxy feedback.
- [38] (2008) The intrinsic fraction of broad-absorption line quasars. Monthly Notices of the Royal Astronomical Society 386 (3), pp. 1426–1435. External Links: ISSN 1365-2966, Link, Document Cited by: Status of the low-mass-outflow-rate population.
- [39] (2013) Coevolution (Or Not) of Supermassive Black Holes and Host Galaxies. Annu. Rev. Astron. Astrophys. 51 (1), pp. 511–653. External Links: Document, 1304.7762 Cited by: Extended background on AGN feedback.
- [40] (2014) Line-driven winds and the UV turnover in AGN accretion discs. Mon. Not. R. Astron. Soc. 438 (4), pp. 3024–3038. External Links: Document, 1312.3556 Cited by: Broad absorption line winds cannot power galaxy feedback, A challenge to galaxy formation models, Radiation pressure powers quasar broad absorption line winds but fails to drive galaxy feedback.
- [41] (2013) Observations of feedback from radio-quiet quasars - I. Extents and morphologies of ionized gas nebulae. Mon. Not. R. Astron. Soc. 430 (3), pp. 2327–2345. External Links: Document, 1301.1677 Cited by: Extended background on AGN feedback.
- [42] (2013) Observations of feedback from radio-quiet quasars - II. Kinematics of ionized gas nebulae. Mon. Not. R. Astron. Soc. 436 (3), pp. 2576–2597. External Links: Document, 1305.6922 Cited by: Extended background on AGN feedback.
- [43] (2020) The Sloan Digital Sky Survey Quasar Catalog: Sixteenth Data Release. Astrophys. J. Suppl. 250 (1), pp. 8. External Links: Document, 2007.09001 Cited by: Most broad absorption line outflows show line locking, Quasar spectra and trough selection, Quasar spectra and trough selection, Table S1, Radiation pressure powers quasar broad absorption line winds but fails to drive galaxy feedback.
- [44] (1998) The Demography of Massive Dark Objects in Galaxy Centers. Astron. J. 115 (6), pp. 2285–2305. External Links: Document, astro-ph/9708072 Cited by: Extended background on AGN feedback.
- [45] (2002) The Mass-to-Light Function of Virialized Systems and the Relationship between Their Optical and X-Ray Properties. Astrophys. J. 569 (1), pp. 101–111. External Links: Document, astro-ph/0109134 Cited by: Extended background on AGN feedback.
- [46] (2025) Validation of the DESI 2024 Lyman alpha forest BAL masking strategy. J. Cosmol. Astropart. Phys. 2025 (1), pp. 137. External Links: Document, 2405.09737 Cited by: Most broad absorption line outflows show line locking, Quasar spectra and trough selection.
- [47] (2019) The Ubiquitous Imprint of Radiative Acceleration in the Mean Absorption Spectrum of Quasar Outflows. Astrophys. J. 886 (2), pp. 151. External Links: Document, 1902.04085 Cited by: Quasar spectra and trough selection, Mock absorption trough construction, Mock absorption trough construction, Stacking methodology and validation tests, Radiation pressure powers quasar broad absorption line winds but fails to drive galaxy feedback, Radiation pressure powers quasar broad absorption line winds but fails to drive galaxy feedback.
- [48] (2017) The Mean Metal-line Absorption Spectrum of Damped Ly Systems in BOSS. Astrophys. J. 846 (1), pp. 4. External Links: Document, 1610.02711 Cited by: Stacking methodology and validation tests.
- [49] (2019) Radiation-pressure Waves and Multiphase Quasar Outflows. Astrophys. J. 885 (1), pp. 95. External Links: Document, 1903.08170 Cited by: Mock absorption trough construction, Column density measurements, Limitations.
- [50] (2023) Supermassive Black Hole Winds in X-rays: SUBWAYS. I. Ultra-fast outflows in quasars beyond the local Universe. Astron. Astrophys. 670, pp. A182. External Links: Document, 2212.02960 Cited by: A challenge to galaxy formation models.
- [51] (2007) Heating Hot Atmospheres with Active Galactic Nuclei. Annu. Rev. Astron. Astrophys. 45 (1), pp. 117–175. External Links: Document, 0709.2152 Cited by: A challenge to galaxy formation models, Extended background on AGN feedback.
- [52] (2000) Chandra X-Ray Observations of the Hydra A Cluster: An Interaction between the Radio Source and the X-Ray-emitting Gas. Astrophys. J. Lett. 534 (2), pp. L135–L138. External Links: Document, astro-ph/0001402 Cited by: Extended background on AGN feedback.
- [53] (2010) Measuring the galaxy-mass and galaxy-dust correlations through magnification and reddening. Mon. Not. R. Astron. Soc. 405 (2), pp. 1025–1039. External Links: Document, 0902.4240 Cited by: Extended background on AGN feedback.
- [54] (2010) Constraints on the Relationship between Stellar Mass and Halo Mass at Low and High Redshift. Astrophys. J. 710 (2), pp. 903–923. External Links: Document, 0903.4682 Cited by: Extended background on AGN feedback.
- [55] (1995) Accretion Disk Winds from Active Galactic Nuclei. Astrophys. J. 451, pp. 498. External Links: Document Cited by: Figure 4, Most broad absorption line outflows show line locking, Radiative driving dominates the acceleration region, Line locking fraction model, CAK wind dynamics and line locking, CAK wind dynamics and line locking, CAK wind dynamics and line locking, Extended background on AGN feedback, Radiation pressure powers quasar broad absorption line winds but fails to drive galaxy feedback.
- [56] (2005) On the Maximum Luminosity of Galaxies and Their Central Black Holes: Feedback from Momentum-driven Winds. Astrophys. J. 618 (2), pp. 569–585. External Links: Document, astro-ph/0406070 Cited by: Extended background on AGN feedback, Extended background on AGN feedback.
- [57] (1997) The Effects of a Photoionizing Ultraviolet Background on the Formation of Disk Galaxies. Astrophys. J. 478 (1), pp. 13–28. External Links: Document, astro-ph/9605043 Cited by: Extended background on AGN feedback.
- [58] (2007) Conference Summary: The Central Engine of Active Galactic Nuclei. arXiv e-prints, pp. arXiv:0705.2192. External Links: Document, 0705.2192 Cited by: Extended background on AGN feedback, Radiation pressure powers quasar broad absorption line winds but fails to drive galaxy feedback.
- [59] (2016) Radiation hydrodynamic simulations of line-driven disk winds for ultra-fast outflows. Publ. Astron. Soc. Jpn. 68 (1), pp. 16. External Links: Document, 1511.08815 Cited by: Extended background on AGN feedback.
- [60] (2017) The Sloan Digital Sky Survey Quasar Catalog: Twelfth data release. Astron. Astrophys. 597, pp. A79. External Links: Document, 1608.06483 Cited by: Quasar spectra and trough selection.
- [61] (2000) Dynamics of Line-driven Disk Winds in Active Galactic Nuclei. Astrophys. J. 543 (2), pp. 686–696. External Links: Document, astro-ph/0005315 Cited by: Extended background on AGN feedback.
- [62] (2003) A Catalog of Broad Absorption Line Quasars from the Sloan Digital Sky Survey Early Data Release. Astron. J. 125 (4), pp. 1711–1728. External Links: Document, astro-ph/0301019 Cited by: Two-population clustering and dust reddening.
- [63] (2026) Analysis code for “line-driven radiation pressure powers quasar outflows but fails to drive galaxy feedback”. Zenodo. External Links: Document, Link Cited by: Data, code and materials availability:.
- [64] (2007) A unified model for AGN feedback in cosmological simulations of structure formation. Mon. Not. R. Astron. Soc. 380 (3), pp. 877–900. External Links: Document, 0705.2238 Cited by: A challenge to galaxy formation models, Radiation pressure powers quasar broad absorption line winds but fails to drive galaxy feedback.
- [65] (1989) Relativistic Neutrons in Active Galactic Nuclei. Astrophys. J. Lett. 341, pp. L33. External Links: Document Cited by: Extended background on AGN feedback.
- [66] (1998) Quasars and galaxy formation. Astron. Astrophys. 331, pp. L1–L4. External Links: Document, astro-ph/9801013 Cited by: Extended background on AGN feedback, Extended background on AGN feedback, Radiation pressure powers quasar broad absorption line winds but fails to drive galaxy feedback.
- [67] (2013) The Multi-object, Fiber-fed Spectrographs for the Sloan Digital Sky Survey and the Baryon Oscillation Spectroscopic Survey. Astron. J. 146 (2), pp. 32. External Links: Document, 1208.2233 Cited by: Quasar spectra and trough selection.
- [68] (2011) Massive Molecular Outflows and Negative Feedback in ULIRGs Observed by Herschel-PACS. Astrophys. J. Lett. 733 (1), pp. L16. External Links: Document, 1105.1731 Cited by: Extended background on AGN feedback.
- [69] (1993) Elliptical galaxy cooling flows without mass drop-out.. Mon. Not. R. Astron. Soc. 263, pp. 323–334. External Links: Document Cited by: Extended background on AGN feedback.
- [70] (2010) Evidence for ultra-fast outflows in radio-quiet AGNs. I. Detection and statistical incidence of Fe K-shell absorption lines. Astron. Astrophys. 521, pp. A57. External Links: Document, 1006.2858 Cited by: A challenge to galaxy formation models.
- [71] (2008) Visualizing data using t-sne. Journal of Machine Learning Research 9 (86), pp. 2579–2605. External Links: Link Cited by: Two-population clustering and dust reddening.
- [72] (2025) Powerful Nuclear Outflows and Circumgalactic Medium Shocks Driven by the Most Luminous Known Obscured Quasar in the Universe. Astrophys. J. 989 (2), pp. 230. External Links: Document, 2412.02862 Cited by: Extended background on AGN feedback.
- [73] (2014) Introducing the Illustris Project: simulating the coevolution of dark and visible matter in the Universe. Mon. Not. R. Astron. Soc. 444 (2), pp. 1518–1547. External Links: Document, 1405.2921 Cited by: A challenge to galaxy formation models, Radiation pressure powers quasar broad absorption line winds but fails to drive galaxy feedback.
- [74] (1991) Comparisons of the Emission-Line and Continuum Properties of Broad Absorption Line and Normal Quasi-stellar Objects. Astrophys. J. 373, pp. 23. External Links: Document Cited by: Two-population clustering and dust reddening.
- [75] (1978) Core condensation in heavy halos: a two-stage theory for galaxy formation and clustering.. Mon. Not. R. Astron. Soc. 183, pp. 341–358. External Links: Document Cited by: Extended background on AGN feedback, Radiation pressure powers quasar broad absorption line winds but fails to drive galaxy feedback.
- [76] (1991) Galaxy Formation through Hierarchical Clustering. Astrophys. J. 379, pp. 52. External Links: Document Cited by: Extended background on AGN feedback, Radiation pressure powers quasar broad absorption line winds but fails to drive galaxy feedback.
Acknowledgments
We are grateful to Paul Martini and Allyson Brodzeller for their help with baltools, for sharing their PCA templates, and for discussions about BALs and quasar continua. We also thank Martin Gaskill and Xavier Prochaska for their comments and discussions, and Gwendolyn Eadie for her insight into the statistical analysis and comparison of our mock spectra. We thank Alicia Savelli for insightful conversations throughout the project and for her careful reading of the manuscript, and Matthew Nesom for careful proofreading.
Funding:
B. Seefeldt-Gail and N. Murray acknowledge the support of the Natural Sciences and Engineering Research Council of Canada (NSERC), RGPIN-2023-04901.
Author contributions:
B.S.-G. led the data analysis, developed the KDE-based mock spectral framework, performed the line locking detection and statistical characterization, and carried out the mass outflow rate calculations. L.M.-R. contributed to the spectroscopic analysis methodology and outflow property measurements. N.M. contributed to the theoretical framework for line-driven wind dynamics and the physical interpretation of the results. All authors contributed to writing the manuscript.
Competing interests:
There are no competing interests to declare.
Use of AI-assisted technology:
A large language model (Claude, Anthropic) was used an aid in editing prose, and restructuring and reformatting the text for this journal. It was not used to generate or analyze data, produce figures, or draw scientific conclusions. The authors take full responsibility for the content of this work.
Data, code and materials availability:
SDSS-IV DR16 quasar spectra are publicly available at https://www.sdss.org/dr16/. The baltools software used to identify absorption troughs is publicly available at https://github.com/paulmartini/baltools. Analysis code for the mock spectral construction, KDE framework, and stacking pipeline is available at https://github.com/BradenSeefeldt/Line-Locking-Final-Code and archived at https://doi.org/10.5281/zenodo.21417626 [63].
Supplementary materials
Materials and Methods
Supplementary Text
Figs. S1 to S17
Tables S1 and S2
References (24-0)
Supplementary Materials for
Radiation pressure powers quasar broad absorption line winds but fails to drive galaxy feedback
B. Seefeldt-Gail∗,
L. Mas-Ribas,
N. Murray
∗Corresponding author. Email: braden.gail@mail.utoronto.ca
This PDF file includes:
Materials and Methods
Supplementary Text
Figures S1 to S17
Tables S1 and S2
Materials and Methods
Line locking formalism
We focus on line locking caused by an atomic doublet, where two spectral lines arise from transitions between a common ground state and two excited states differing only in total angular momentum. Relevant doublets in AGN outflows include C IV , Si IV , O VI , and N V [8, 12].
We consider two absorbing gas elements (“clouds”), at radii and , moving along the line of sight with velocities and and accelerations and , respectively (Fig. S1). For a given doublet we define the two transition wavelengths in the wind frame such that . We are interested in the shadowing of the red wing of the doublet in cloud 2 by gas in cloud 1 scattering radiation via the blue doublet component. This shadowing occurs due to the Doppler shift corresponding to the velocity difference between the two clouds,
| (S1) |
where corresponds to either (cloud 2) or (cloud 1), and is the wavelength in the AGN frame.
For in a radially accelerating outflow, line locking can occur when the upstream (slower) gas at absorbs light at the wavelength corresponding to the red doublet component of the downstream (faster) gas at . The downstream element then experiences a reduction in its acceleration by an amount relative to an unshadowed parcel. If this reduction is large enough that , the relative velocity between the two parcels vanishes, producing a metastable state in which both velocities increase with time while their relative velocity remains fixed.
The equilibrium velocity offset is
| (S2) |
where the sign depends on whether or . For the C IV , N V , O VI , and Si IV doublets, 497, 962, 1632, and 1933 km s-1, respectively.
The difference in acceleration between the two clouds at the onset of shadowing (when ) is [8], while at the point of maximal shadowing it is . During an actual lock, , but is just large enough that . Line locking is therefore possible only if has the opposite sign to , giving the condition
| (S3) |
This condition is used below to determine the velocity range over which line locking can be sustained.
Quasar spectra and trough selection
We use spectra from the SDSS-IV Data Release 16 (DR16) quasar catalog [43], containing approximately 750,000 confirmed quasars spanning . DR16 of the extended Baryon Oscillation Spectroscopic Survey [17] improves on earlier releases [60] through expanded sky coverage, refined spectroscopic reductions, and updated redshifts. The BOSS spectrographs provide moderate-resolution () spectra covering 3,600 to 10,400 Å [67], well suited to broad ultraviolet absorption lines redshifted into the optical.
We used baltools [27, 43, 23, 46] to identify C IV outflow absorption troughs. The code considers quasars whose spectra cover the wavelength range out to 25,000 km s-1 blueward of the C IV emission line, corresponding to ; most quasars in our sample have to 2.5. For these, baltools reconstructs each quasar continuum via minimization using principal component analysis (PCA) templates. We use the PCA templates of [9], which we find improve performance relative to those used by [43], consistent with results reported for DESI data by [46]. Broad (450 km s-1) absorption troughs are located blueward of the C IV emission line and iteratively masked to improve the subsequent PCA fits; see [27] and [46] for full procedural details.
Starting from 397,039 quasars satisfying the redshift requirement above, baltools identifies 159,690 C IV troughs. We apply the quality and selection cuts listed in Table S1, reducing the sample to a final 81,388 C IV troughs, a 35 percent increase over the sample size used by [47]. Figure S2 shows the resulting distributions of trough outflow velocity and width, which broadly match the DR12-based distributions of [47].
Mock absorption trough construction
To test whether the observed line locking signature could instead arise from stacking artifacts, we constructed a detailed mock spectral framework reproducing the statistical properties of real troughs in the absence of line locking.
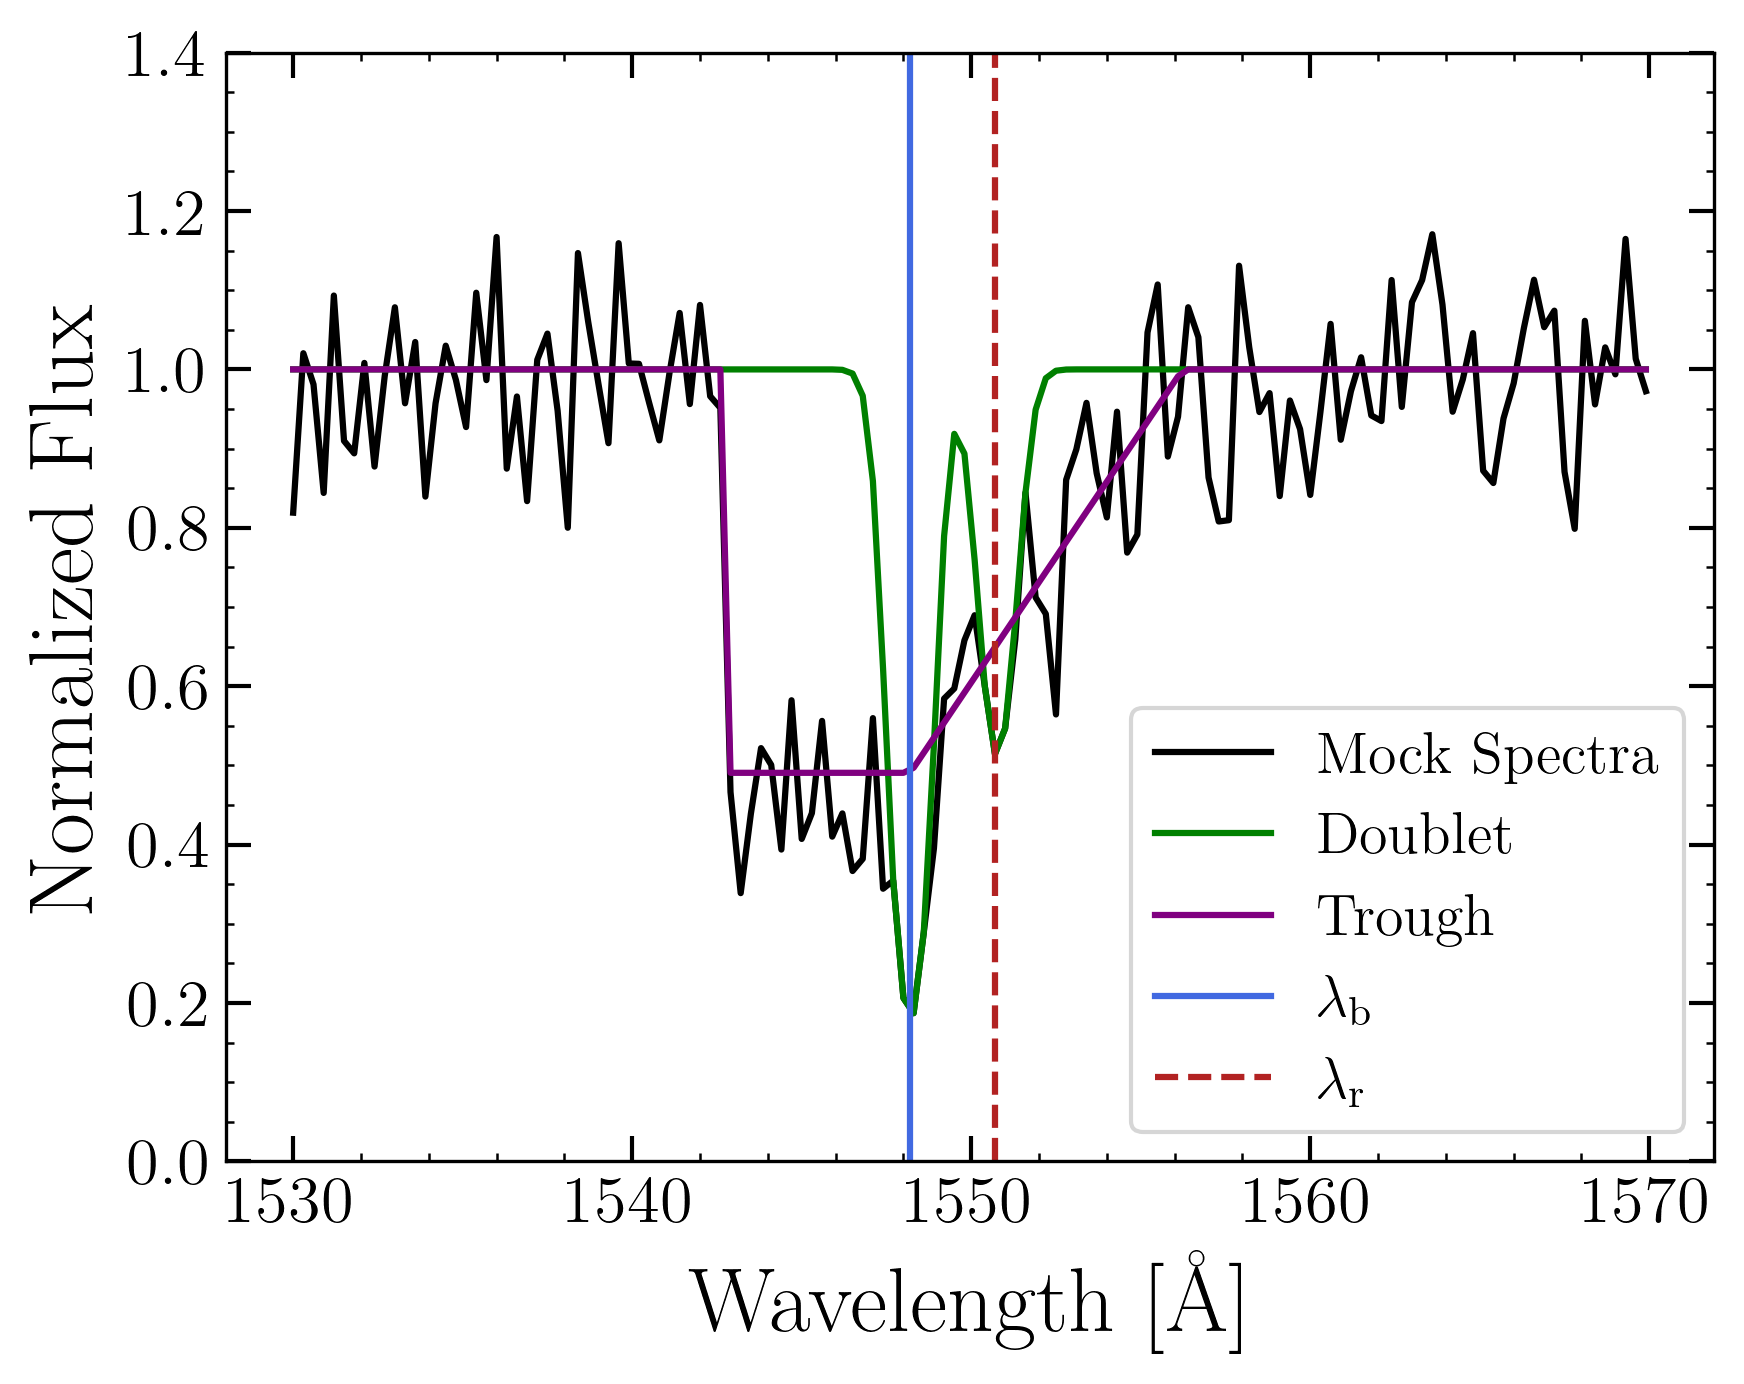
Our mocks consist of two components: a C IV doublet without line locking, , and a broad absorption trough, (Fig. S4). The doublet is modeled as two inverted Gaussians centered on and ,
| (S4) |
where sets the width of the absorption features and , are depth parameters for the blue and red components. The broad trough is modeled as an inverted boxcar centered at wavelength ,
| (S5) |
where is the trough width and is the trough depth. The term is
| (S6) |
which connects the bottom of the trough at back to the continuum when the red line depth is less than the trough depth; is the equivalent expression for the blue side. We compare this choice against simpler alternatives in Fig. S6 below.
Gaussian noise , with zero mean and standard deviation , is added to the trough but not to the doublet, since and are measured from real (already noisy) spectra; represents both spectral noise and the physical variability of the trough bottom. and are evaluated over Å, and the mock spectrum takes the lower value of and , except far from the doublet where only is used:
| (S7) |
with the restriction at and , so that the mocks exactly match the doublet at the tips of the absorption lines.
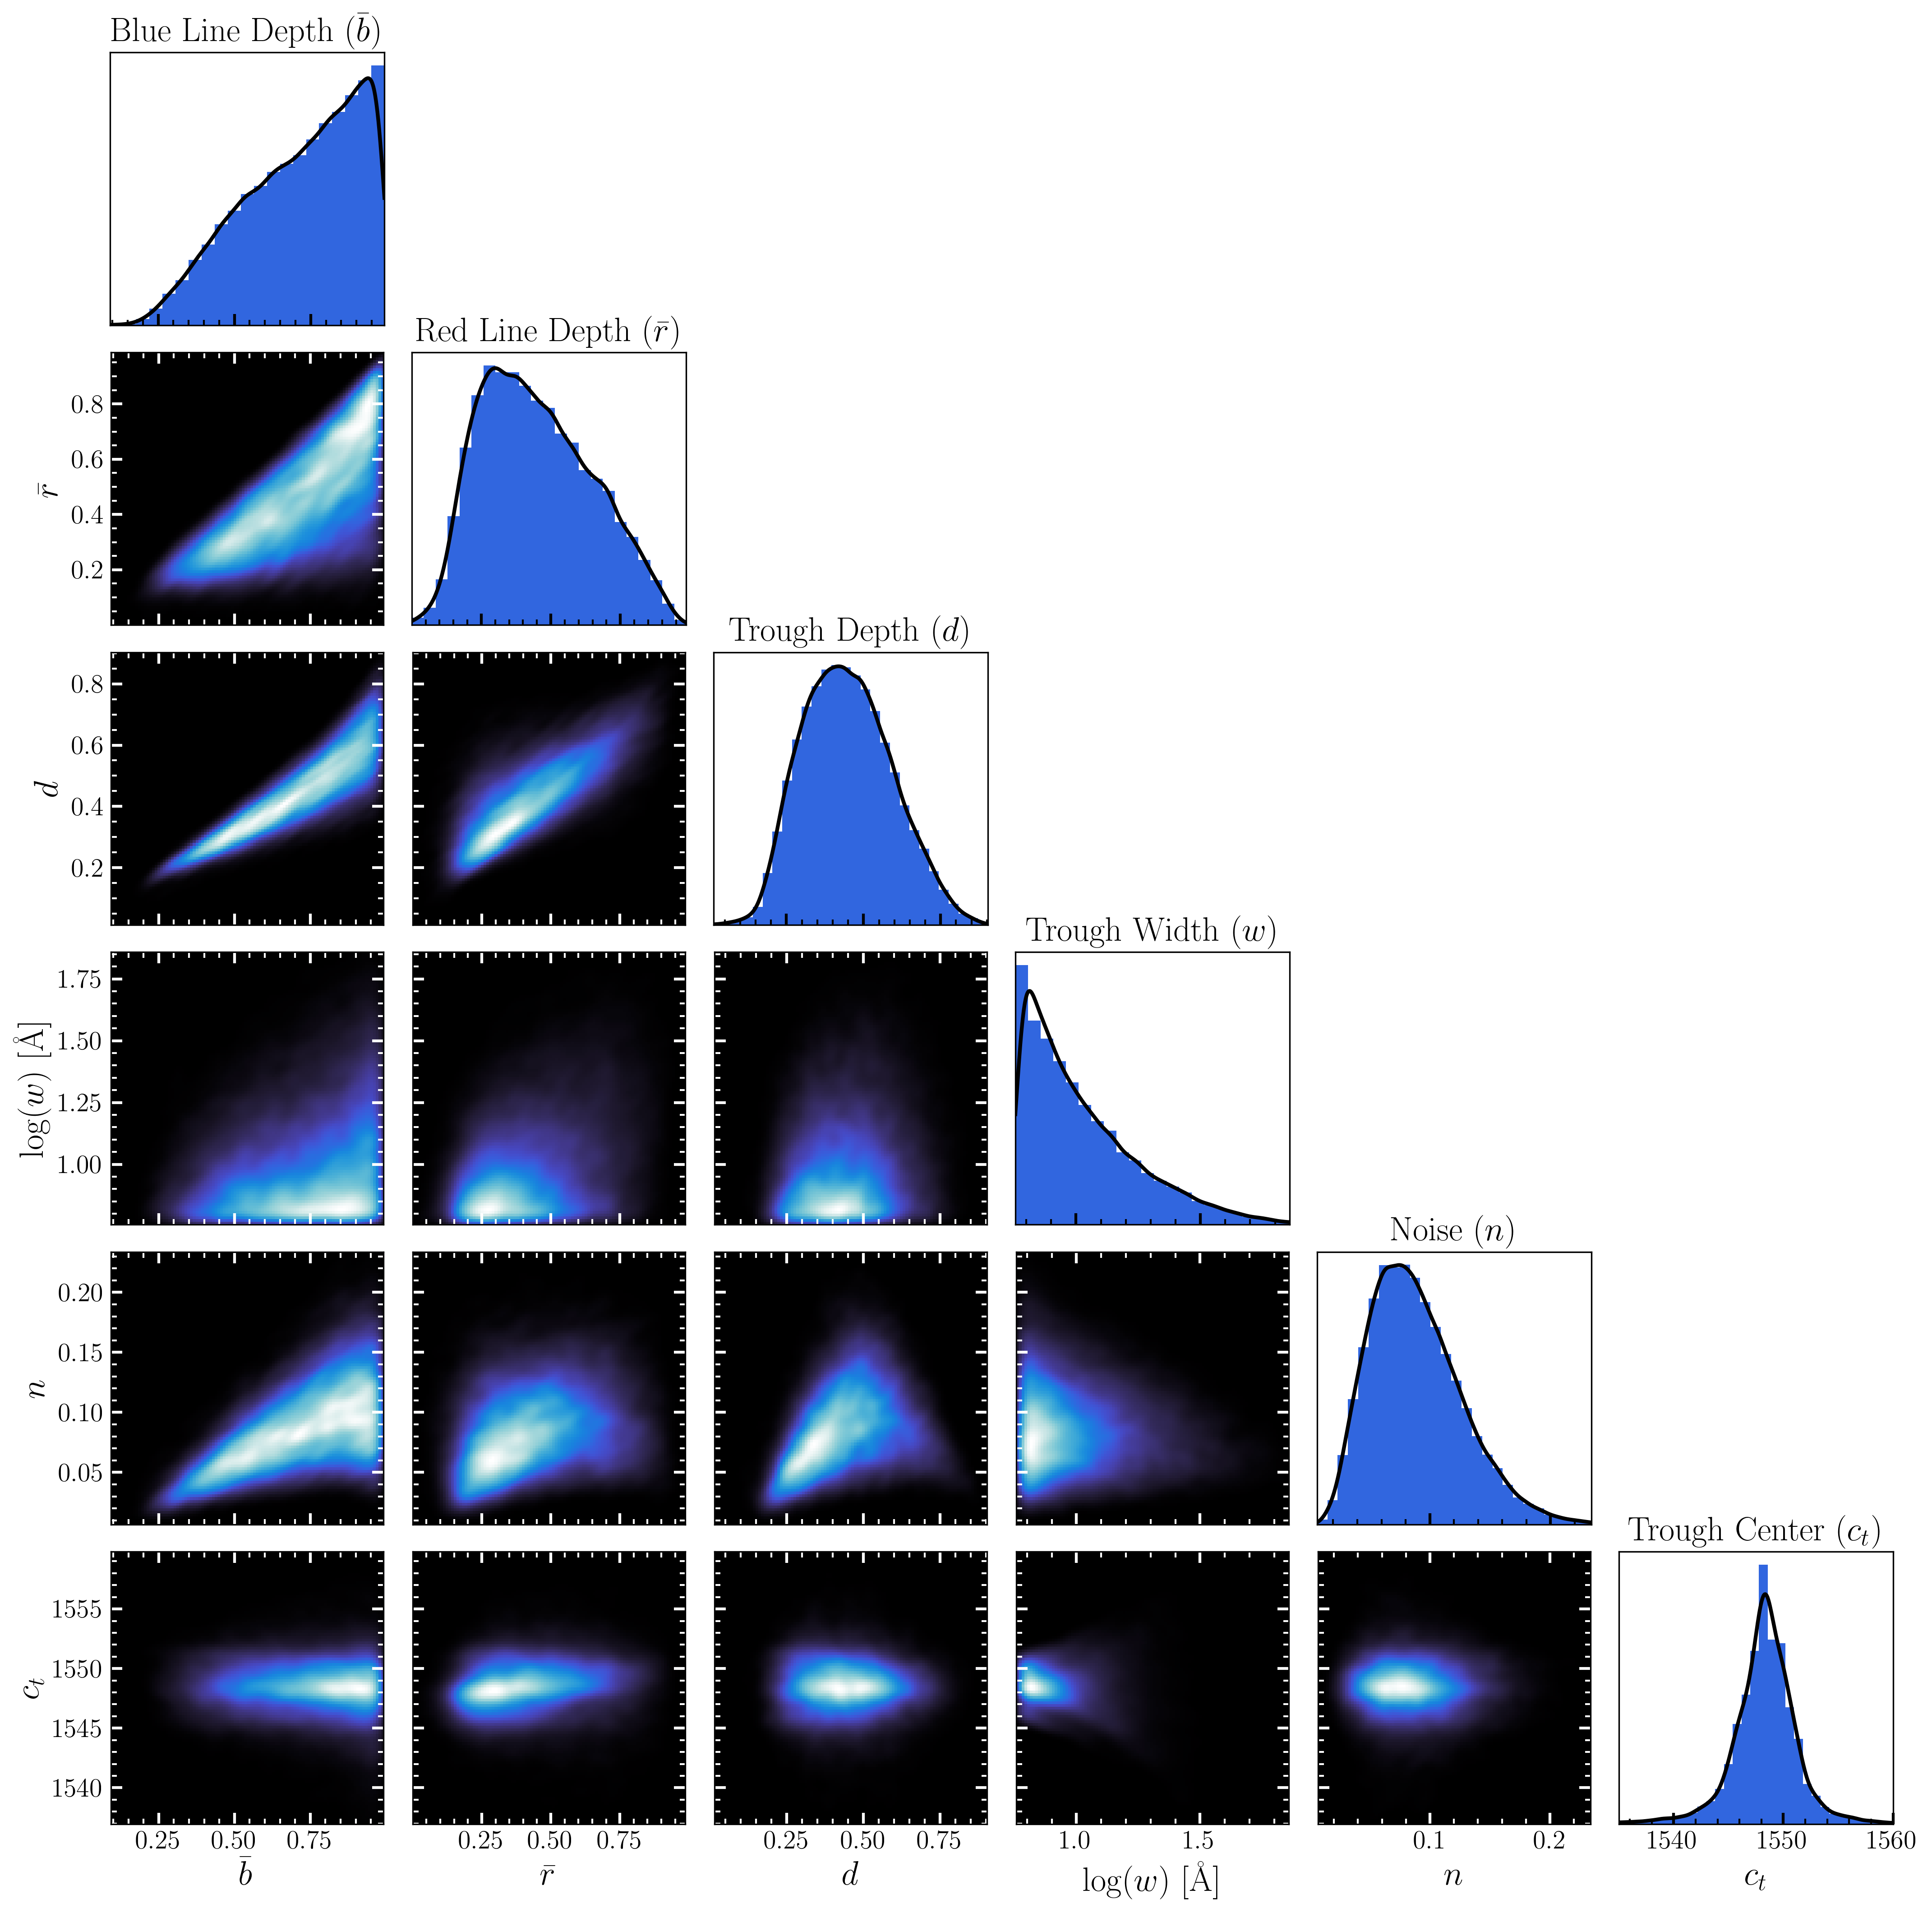
Mock troughs are characterized by seven parameters: width , depth , center , noise , blue and red doublet depth parameters and , and Gaussian width . We employ a six-parameter Gaussian KDE (bandwidth 1/8) to replicate the joint parameter space of the real data, including correlations between parameters (Fig. S3). The bandwidth is chosen narrow to capture non-Gaussian behavior near the boundaries of the blue-line-depth and trough-width distributions. Å is fixed from Gaussian fits to stacked real spectra in [47, 49], since it cannot be extracted reliably from individual spectra and we find moderate variations around this value do not affect our results.
To construct the KDE, each spectrum is shifted to the trough rest frame using the redshift associated with the flux minimum, rebinned at 0.3 Å (the BOSS spectral resolution, 70 km s-1), and continuum-normalized to give . Trough boundaries and are determined from the velocities of the flux minimum and trough edges reported by baltools, giving and . The normalized line depths and are converted to depth parameters via
| (S8) |
where . Trough depth and noise are measured from a Gaussian-smoothed version of over , excluding the edge points and (for noise) the minimum flux point and its neighbors, following the procedure described in [47]. We require at least nine points after these exclusions, which imposes a minimum trough width of 1,200 km s-1. Troughs below this width are excluded from the KDE only, leaving 29,322 troughs contributing to the KDE while all 81,388 troughs are retained for the outflow property analysis described below. We expect our results to hold for narrower troughs, since the width threshold is a measurement constraint rather than a physical one.
We generated 29,332 mock troughs by sampling the KDE. Figure S4 compares an example mock trough to a real DR16 trough. We find a small, systematic offset between mock and real trough-depth distributions, traced to the simplified slanted/boxcar trough shape; adding a constant offset of 0.0505 to the sampled trough depth (applied only to , not to the doublet or triplet depth parameters) removes this offset and yields good agreement between the mock and real distributions across all parameters (Fig. S5; Table S2).
Stacking methodology and validation tests
We constructed composite (stacked) spectra following [47]. Each of the 29,332 mock spectra is centered at its flux minimum and assigned a weight
| (S9) |
where is the measured median noise of spectrum and the 0.1 term represents a 10 percent spectral variability floor that prevents very-low-noise spectra from disproportionately dominating the stack [48]. The stacked spectrum is the weighted mean,
| (S10) |
with and . The same procedure is applied to the real (PCA-normalized) spectra , using the inverse square of the median spectral signal-to-noise ratio in place of the noise estimate in Eqs. S9 and S10.
Figure 1 (main text) shows that the doublet-only mock stack fails to reproduce the absorption seen at in the real data. From 50 independent bootstrap realizations of , the stacking algorithm aligns on the blue line ( Å) for 81.80.10 percent of troughs, on the red line ( Å) for 0.440.06 percent, and on noise for 17.70.21 percent. Widening the red-line contamination window to 0.6 or 0.9 Å roughly doubles or triples this contamination fraction, but it remains below a few percent in all cases. We additionally tested three different trough-edge models (a strict boxcar, a fully slanted boxcar, and our fiducial mixed model; Fig. S6); all three give red-line contamination at the few-percent level (3 to 4 percent), and the fiducial model gives the best match to the real stack morphology (Fig. S7).
To construct line-locked mock troughs, we replace the doublet profile with a triplet profile, , with components at , , and (see “Mock triplet construction” below). A mock sample built entirely from this triplet profile correctly produces absorption at , but the resulting feature is more pronounced than in the real data. We find through visual inspection that a combination of roughly two thirds triplet and one third doublet mocks provides the best match (main text, Fig. 1), supporting a line locking fraction of approximately two thirds, consistent with the independent fraction measurement described in the main text.
Line locking fraction model
We model the fraction of troughs exhibiting line locking using the two-cloud framework above. We assume a homogeneous absorbing clump of spatially uniform optical depth covering a fraction of a uniformly illuminating background source [3]. The observed intensity for a single (non-line-locked) cloud is
| (S11) |
with , the line-center optical depths of the blue and red components. For a line-locked system, in which the second cloud’s red component overlaps the first cloud’s blue component,
| (S12) |
Contamination from misaligned (red-line) stacking is modeled as
| (S13) |
The total intensity in the real-data stack is
| (S14) |
where and are the line-locked and contamination fractions. Writing , , , , , and normalizing , Eq. S14 becomes
| (S15) |
There are six unknowns: , , , , , and . We evaluate this equation on the real stacked spectrum at , giving three equations solved numerically for , , and , while fixing , Å, and . We repeat this for 80, 90, and 100 percent, and 0 and 1 percent. The resulting line locking fraction is 60 to 72 percent (main text, Fig. 2), and the inferred optical depths sit at for both doublet components (Fig. S8), as expected for line-driven winds at high blueshifted velocities [55].
Column density measurements
Assuming an optically thin line with Doppler width Å, the optical depth at line center is
| (S16) |
where is the C IV column density and is the oscillator strength ( and 0.09520 for the blue and red C IV components, respectively). Using the optical depths from the fraction-fitting procedure above, the implied average column density is to (Fig. S9), essentially independent of whether or is used.
To examine the velocity dependence of the column density, troughs are sorted by outflow velocity (position of the flux minimum), and a window of 3,000 troughs is slid across the sorted sample, stacking the spectra within each window and extracting via the fitting procedure above. The resulting column density (Fig. S10) increases with outflow velocity to a peak of at 3,500 km s-1, then declines at higher velocities, consistent with increasing ionization parameter forcing carbon to a higher ionization state ( C V ) as the gas accelerates, and consistent with the equivalent-width trend reported by [49]. A window size of 3,000 troughs balances smoothing against noise; smaller windows introduce features that are difficult to distinguish from noise, while larger windows reduce the sharpness of the observed peak.
Integrating the C IV column density over the full velocity range gives a total , which we can then use to find the corresponding hydrogen column:
| (S17) |
where is the carbon abundance, scaled to the solar value [2], and has a maximum value of 0.4 at ionization parameter [28].
If the gas-to-dust ratio in the outflow matched the Milky Way value, the continuum optical depth in the ultraviolet would be , where is the dust opacity near 1000 Å. This is a factor of four larger than the observed optical depth, to 0.2 (Fig. S15), suggesting an enhanced gas-to-dust ratio – though we show below that this is an underestimate.
Our stacked spectra extend beyond the Lyman edge at 912 Å (Fig. S15), where the flux varies by less than 10 percent, giving . At the maximum value of , the predicted edge optical depth is , clearly excluded by the data. Since the observations fix (and hence ), reconciling this requires increasing the ionization parameter, which decreases and correspondingly increases the inferred via Eq. S17. We find is required to satisfy the observed edge optical depth, giving
| (S18) |
with a corresponding , comfortably within observational limits assuming four times solar metallicity. For this larger , a Milky Way gas-to-dust ratio would predict , clearly excluded by our spectra, which constrain to be at least 40 times smaller. We conclude that the outflowing gas has a gas-to-dust ratio at least 40 (and, accounting for the assumed metallicity, up to 160) times the Milky Way value – that is, the outflow gas is essentially dust-free, as expected if the wind is launched from inside the dust sublimation radius.
This allows us to constrain the wind launch radius. The mass loss rate is , scaled to the dust sublimation radius for at sublimation temperature 1,500 K. Since the wind is radiatively driven, this mass loss rate must be smaller than , requiring a launch radius , implying a terminal velocity of 30,000 km s-1, consistent with observations and well inside the dust sublimation radius.
Mass outflow rate measurement
We measured the flux absorbed by each C IV trough by integrating the area between the PCA continuum and the observed spectrum (Fig. S11), applying the cuts in Table S1 except for the two flux-minimum conditions, since we wish to capture all absorption including possible noise contributions. This selection yields 116,428 troughs in 73,442 quasars.
To account for absorption from ionic species other than C IV , we constructed a composite spectrum from 900 to 1,600 Å rest-frame using SDSS-pipeline continua (rather than the PCA continua, which do not cover this full range), renormalized using a 50-pixel median boxcar smoothing after masking absorption features (Fig. S12, top panel). We then multiplied this renormalized absorption spectrum by the mean DR16 non-BAL quasar emission spectrum (selected to have null BAL probability), constructed using the same weighted-stacking procedure (Eqs. S9 and S10) as above (Fig. S12, bottom panel). The difference between the resulting product and the non-BAL emission spectrum gives the average flux absorption at a given outflow velocity from all ions. Comparing this to the known C IV absorption then gives the average C IV fractional contribution to total absorption as a function of velocity (Fig. S13), found to range between approximately 11 and 17 percent.
The total absorbed luminosity along each quasar sightline is , where is obtained by applying the velocity-dependent C IV -to-total absorption ratio above. We estimate the covering fraction of the central engine by the outflow, , from the fraction of quality-selected DR16 quasars showing at least one outflow trough: of 295,690 quasars passing our signal-quality cuts, 112,789 (38 percent) show outflow absorption features, giving (this is twice the covering fraction obtained when considering only strictly broad, 2,000 km s-1, troughs; [29, 26]). The total absorbed luminosity for each trough is then , and the mass loss rate follows from momentum conservation under the assumption of single scattering,
| (S19) |
Each BAL quasar has on average 1.6 troughs. The resulting distributions of mass outflow rate, quasar bolometric luminosity, absorbed luminosity fraction, mass outflow to accretion rate ratio, and kinetic to bolometric luminosity ratio are shown in main text Fig. 3. The mass accretion rate is with mass-to-energy efficiency .
Two-population clustering and dust reddening
The distributions in main text Fig. 3 show clear bimodality (except for bolometric luminosity and kinetic-to-bolometric ratio). We applied the DBSCAN density-based clustering algorithm [20] to the three-dimensional space of outflow mass rate, absorbed luminosity fraction, and mass ratio. We tested DBSCAN against K-means, spectral clustering, and HDBSCAN [10], both on the raw data and after dimensionality reduction via PCA and t-SNE [71]; all methods consistently identify the same two cluster cores, but DBSCAN requires the least hyperparameter tuning and, importantly, labels ambiguous points as unassigned rather than forcing them into one cluster or the other.
The low-mass-outflow-rate population is composed mostly of one or two narrow (2,000 km s-1) troughs in quasars with BAL probability near 0.9, with 90 percent of these troughs at outflow velocities above 8,500 km s-1 (Fig. S14). The high-mass-outflow-rate population extends to larger trough widths and lower velocities. Stacking the real data for each population separately (Fig. S15) shows that line locking is clearly visible in the high-mass-outflow-rate stack but not in the low-mass-outflow-rate stack.
To assess dust content, we computed the mean quasar emission spectrum for each population, masking the C IV , N V , H I , O VI , and Si IV trough regions to mitigate their effect on the continuum (Fig. S15, top panel). The high-mass-outflow-rate stack is notably redder than the non-BAL quasar continuum, indicating substantial dust absorption [74, 62], while the low-mass-outflow-rate stack is very similar to the non-BAL continuum. Quantifying this via the extinction (Fig. S15, middle panel), and integrating over the continuum, the low-mass population absorbs 4.61 percent of the non-BAL flux and the high-mass population absorbs 9.63 percent. Applying our cover fraction , this corresponds to dust absorption of 1.75 and 3.66 percent of for the two populations, respectively, a factor of 5.83 and 2.44 times larger than the corresponding line absorption fractions. The bottom panel of Fig. S15 shows the fraction of spectra contributing to each stack as a function of wavelength, illustrating the effect of trough masking.
CAK wind dynamics and line locking
We model the wind acceleration using a simplified, steady-state version of the standard Castor, Abbott & Klein (CAK) formalism [11], assuming a radial flow emerging from a rotationally supported disk and driven primarily by line absorption. The momentum equation is [55]
| (S20) |
where is the black hole mass, the angular velocity, and the gas pressure and density, and , the line-driving and electron-scattering acceleration terms. Neglecting the gas pressure term (valid in the supersonic limit) and assuming single-scattering for both driving terms, , and , where the force multiplier is
| (S21) |
with the wind thermal velocity, the electron density, the geometric dilution factor, and , , constants. Using mass conservation, , to eliminate , and the Eddington ratio , and using with const., together with the boundary condition at the launch radius (which gives ), the momentum equation reduces to
| (S22) |
This nonlinear first-order equation has a unique outflow solution passing through a critical point, approximated by [55] as
| (S23) |
| (S24) |
indicating that line driving can accelerate winds to a couple of times their initial escape velocity. For , , and fiducial [55] and , matching the observed terminal velocities of order 30,000 km s-1 requires cm and (main text Fig. 4).
We use this acceleration profile, together with the line locking condition (Eq. S3), to determine the velocity range over which line locking can be sustained, parameterized as
| (S25) |
with km s-1 half the C IV doublet velocity separation. To estimate in the real data, we consider three physical factors limiting the fractional reduction in during shadowing: (i) the importance of line driving relative to other forces, ; (ii) the contribution of C IV to the total line-driving force, ; and (iii) the fraction of C IV flux actually masked during a lock, , giving
| (S26) |
We take (line driving as the only force acting), (Fig. S13), and estimate by constructing single-cloud and line-locked two-cloud C IV absorption profiles at covering fraction using the fitted optical depths (Fig. S16): the integrated absorption areas are and , giving . Combining these gives , which intercepts the acceleration curve at 7,000 km s-1 and enters the disallowed (red) region at 10,000 km s-1 (main text Fig. 4).
Composite spectra in narrow velocity bins (main text Fig. 5) show line locking signatures well above and below 7,000 km s-1 and above 10,000 km s-1, a wider range than this simple estimate of active locking alone predicts. We account for this using the Sobolev length and corresponding cloud dispersion timescale , which, using Eq. S23, can be written
| (S27) |
At km s-1 this gives s. The corresponding travel time between two velocities is
| (S28) |
For , km s-1, and cm, gas leaving the actively line-locked region at 10,000 km s-1 can travel to 18,500 km s-1 before . Thus, while active line locking occurs only over a narrow velocity range, the locked velocity configuration can be passively maintained over a substantially larger range before dispersing, consistent with the observed persistence of line locking at our largest velocity bin in the main text Fig. 5.
Mock triplet construction
The line-locked mock model is
| (S29) |
where the triplet absorption profile is
| (S30) |
with , , the depth parameters of the blue, red, and line-locked components. Constructing a triplet mock trough requires an eighth parameter, the locked-line depth , measured from the real data and added to the KDE described above. Converting , , to depth parameters , , requires inverting the system obtained by evaluating Eq. S30 at , , ; the inverted relation is
| (S31) |
where and . We built 29,332 triplet mock troughs (applying the same depth offset described above) using a mixture of two thirds triplet and one third doublet troughs, matching the proportion found to best reproduce the real stack (main text Fig. 1). Figure S17 compares the resulting mock and real parameter distributions, showing good overall agreement, similar to the doublet-only case (Fig. S5).
Supplementary Text
Extended background on AGN feedback
Beyond the galaxy-scale simulations discussed in the main text, there is substantial direct observational evidence that quasars affect their host galaxies [69, 68, 22, 39, 13], the surrounding circumgalactic medium [42, 72], and even, indirectly, the intergalactic medium [53]. For example, [68] report p-Cygni profiles from OH molecules in nearby ultra-luminous infrared galaxies, evidence of outflows exceeding 1,000 km s-1 with mass loss rates of up to 1,200 , comparable to or exceeding the star formation rate, with more powerful AGN hosting more massive, higher-velocity outflows. Separately, [41] present integral field spectroscopy of [O III] emission extending to 15 kpc with a median outflow velocity of 760 km s-1, used to rule out starburst-driven winds in favor of an AGN origin. Indirect evidence comes from the scaling relations between black hole mass and host bulge stellar mass [44] and stellar velocity dispersion [24], which motivated early black hole feedback theories [66] and later momentum-driven models [21, 37, 56]. A further hint comes from the relation between stellar and dark matter halo mass [45, 4, 54], likely shaped by the powerful jets that operate in galaxy groups and clusters, where feedback from large-scale radio jets is unambiguously responsible for offsetting the cooling of hot intracluster gas [51].
Early galaxy formation models lacking any feedback mechanism predicted far too many low-mass, actively star-forming galaxies, the “overcooling problem” [75, 14, 76], while simultaneously predicting too many massive galaxies. Semi-analytic models that track supermassive black hole growth [36], and later models motivated by the interaction of radio jets with intracluster gas [52, 16, 7], reproduce the observed cutoff in the space density of massive galaxies but do not model feedback from AGN in their most luminous, quasar phase. Numerical simulations lacking stellar and AGN feedback similarly overcool [57]; resolving stellar feedback removes this overcooling in small cosmological volumes [32, 33, 31, 35, 1], but such simulations still overproduce stars in more massive halos unless AGN feedback is also included, motivating its incorporation in the cosmological simulations discussed in the main text.
Proposed physical mechanisms for AGN feedback span a wide range of scales: heating of host-galaxy gas by AGN radiation [18] and radiation pressure on dust grains in the host interstellar medium [56, 34] operate on kiloparsec scales, while sub-parsec-scale winds have been proposed to be driven by unspecified means [66], by radiation pressure on resonance lines [55, 61, 59], by electron scattering in Eddington or super-Eddington sources [37], thermally [58], or by magnetic fields [6, 19]; neutron-driven winds have also been proposed on somewhat larger scales [65]. This work addresses which of these mechanisms dominates in observed broad absorption line winds.
Interpretation of the line locking fraction
A line locking fraction below 100 percent does not necessarily indicate that radiative acceleration is subdominant in the remaining outflows. Ionization stratification within an outflow could deplete C IV in some regions while other ionic species continue to be radiatively accelerated, breaking the C IV line locking signature without the underlying driving mechanism becoming subdominant. Signal-to-noise limitations in individual spectra may also cause us to underestimate the true line locking fraction, since weaker line-locked systems may not produce detectable absorption at the expected position in the stacks. Our measured fraction of 60 to 70 percent should therefore be regarded as a lower limit on the prevalence of line-driven outflows.
Combining this fraction with the 20 to 40 percent of luminous quasars that exhibit broad absorption troughs [5] implies that radiative line driving observably operates in approximately 25 percent of all quasars, again a lower limit, since some systems may be driven by radiation pressure without producing the specific velocity alignment required to detect line locking.
Sensitivity to the mock trough model
We tested three trough-edge models against the same KDE sample: a strict inverted boxcar with no slanted modification on either side; a boxcar with the slanted modification always applied on the red side regardless of relative depth; and our fiducial model, in which the modification is applied only when the red (or blue) line depth is shallower than the trough depth (Fig. S6). The strict boxcar produces a smearing effect because the trough is deeper than the red line itself, while the always-slanted model produces an artificially pronounced red line. The fiducial model best reproduces the red side of the real stack (Fig. S7) and gives the closest match between mock and real trough-parameter distributions. The fraction of spectra on which the stacking algorithm aligns on the blue line, red line, or noise varies modestly across these three models (65/3/32 percent, 77/4/19 percent, and 72/3/25 percent, respectively), but the red-line contamination fraction remains at the few-percent level in every case, supporting the robustness of our contamination estimate to this modeling choice.
Status of the low-mass-outflow-rate population
[38] previously identified two classes of BAL outflow based on trough strength, broadly corresponding in our formalism to quasars with BAL probability at or above 0.9. Our low-mass-outflow-rate population corresponds only to the narrow, high-velocity tail of this group, while our high-mass-outflow-rate population spans both of the classes identified by [38]. The absence of line locking, minimal dust reddening, and the narrow, high-velocity character of the low-mass-outflow-rate troughs together suggest that this population may not represent genuine outflowing wind material, but rather intervening absorption systems associated with the host galaxy or other foreground structures along the line of sight. We do not include this population in our feedback conclusions, which are based on the line-locking-confirmed, high-mass-outflow-rate population.
Limitations
Our stacking methodology necessarily averages over a diverse population of individual systems with different physical properties and evolutionary states; reported values represent averages over the full sample rather than properties of any single system. High-resolution, high-signal-to-noise observations of individual quasars, which enable direct detection of line locking in specific systems and study of its correlation with other quasar properties [12], provide an important complement to our stacked analysis and could help establish whether our averaged measurements are representative of the full population. Our mass outflow rate calculation assumes single scattering in converting absorbed luminosity to outflow momentum; multiple scattering, if present, would increase the inferred momentum transfer efficiency. We measure absorbed flux only over the rest-frame ultraviolet range covered by the BOSS spectrograph and do not account for any additional absorption outside this window. The line-driven outflow we characterize may also represent only one phase of a more complex, multi-phase structure: if the ultraviolet-absorbing gas is the swept-up sheath of a faster, hotter wind driven by a different mechanism [49], our measurements would underestimate the total energy injected by the outflow. Our CAK wind model is a simplified, steady-state, single-fluid treatment that neglects non-radial flow, detailed ionization stratification, and any dynamical effects of the accretion disk; while these simplifications could alter the detailed shape of the acceleration profile and the corresponding range of , the self-consistency of the wide observed line-locking velocity range with (main text) is unlikely to be altered by relaxing them.






| Selection criterion | Threshold |
| from PCA continuum model | |
| from SDSS continuum model | |
| Median signal-to-noise ratio (full spectrum) | |
| PCA-normalized flux minimum | |
| PCA-normalized flux minimum | |
| BAL probability [43] | |
| Final number of C IV troughs | 81,388 |
| Statistic | Blue depth | Red depth | Trough depth | Trough width | Noise |
|---|---|---|---|---|---|
| Real mean | 0.718 | 0.450 | 0.448 | 1.027 | 0.089 |
| Mock mean | 0.713 | 0.435 | 0.448 | 1.047 | 0.085 |
| Real std. dev. | 0.191 | 0.198 | 0.143 | 0.227 | 0.038 |
| Mock std. dev. | 0.192 | 0.204 | 0.152 | 0.227 | 0.039 |
| Real skewness | 0.520 | 0.330 | 0.251 | 1.141 | 0.751 |
| Mock skewness | 0.524 | 0.232 | 0.262 | 1.141 | 0.944 |
| Real kurtosis | 0.673 | 0.693 | 0.403 | 0.903 | 0.773 |
| Mock kurtosis | 0.643 | 0.644 | 0.537 | 0.917 | 0.923 |