Does Gradient Conflict Predict the
Understanding–Generation Trade-off?
A Controlled Audit of Conflict-Metric Validity in Unified Multimodal Models
Abstract
Unified multimodal models (UMMs) are increasingly designed and optimized around the notion of gradient conflict between the understanding and generation objectives, measured as cosine similarities between task gradients or conflict rates across layers. The premise that reducing these metrics improves the downstream understanding–generation trade-off has never been tested directly. We audit it in a controlled testbed, GridUMM, which mirrors the structural ingredients of UMM training—a fully shared trunk serving two objectives with asymmetric token budgets and task difficulty—while making the ground-truth trade-off exactly computable. Across 63 configurations (7 gradient-combination strategies 3 data-mixing ratios 3 seeds) and 372 measured checkpoints, no directional conflict metric—global or per-layer cosine, conflict rate, removed energy—reaches with a confidence interval excluding zero for conflict measured during training against the eventual trade-off (strongest , interval crossing zero), and the larger concurrent configuration-level associations are mutually sign-inconsistent. A dose–response intervention that monotonically suppresses conflict (level ) leaves the trade-off flat, separating correlation from causation. The one gradient-geometric quantity with association, the norm ratio, is a generation-failure detector, null among configurations that master generation. The functional interference measure eff_rank leads every directional conflict metric ( CI 0.729–1.041) and retains its advantage inside that regime. Training loss, the outcome most often reported in place of benchmarks, tracks the trade-off strongly—the failure is specific to gradient-conflict geometry. Our results do not show that conflict is useless; they show that its validity as a diagnostic target must be established, not assumed, and we release the audit protocol as a reusable standard.
1 Introduction
Unified multimodal models (UMMs) such as Show-o (Xie et al., 2025a), Emu3 (Wang et al., 2024), Janus and Janus-Pro (Wu et al., 2025; Chen et al., 2025), Chameleon (Team, 2025), Transfusion (Zhou et al., 2025), and Unified-IO 2 (Lu et al., 2024) serve visual understanding and visual generation from a single transformer, and a growing family of work motivates interventions by pointing to gradient conflict: during joint training, the understanding and generation objectives produce gradients whose cosine similarity is near zero or negative, with magnitude ratios that can exceed an order of magnitude (Rao & Rachuri, 2026). Uni-X (Hao et al., 2026) separates conflicting shallow and deep layers architecturally; Symbiotic-MoE (Liu et al., 2026) shields conflict-driven forgetting with expert disentanglement; ML-FOP-SOAP (Lu & Armour, 2026) suppresses modality conflicts with Fisher-orthogonal projection and second-order preconditioning; Pareto LoRA (Wei et al., 2026) rebalances modality gradients by Pareto-optimal integration. Across this literature one premise recurs untested: that lowering a gradient-conflict metric moves the model toward a better understanding–generation trade-off.
The premise deserves scrutiny because its two ends are measured on different scales: conflict metrics describe gradient geometry on a fixed probe batch, while the trade-off is a property of two benchmark families evaluated after training under an evaluation practice that treats the two objectives independently (Wang et al., 2026; Li et al., 2025). Existing evidence is consistent with decoupling: across seven training strategies and two post-hoc methods on Janus-Pro, none improved generation CLIPScore () even though all modify conflict (Rao & Rachuri, 2026); Lu & Armour (2026) report training-loss gains without downstream evaluation; and high understanding and high generation scores do not imply alignment (Wang et al., 2026). But no study has measured the quantity that would settle the premise—the correlation between conflict metrics and trade-off position across a controlled population of training runs—because on production-scale UMMs this requires dozens of full training runs.
This paper performs that audit in a controlled testbed, organized around three design requirements. First, the ground-truth trade-off must be computable exactly, ruling out benchmark noise from dominating a correlation analysis: we construct GridUMM, a synthetic environment whose two tasks have exactly measurable accuracies and whose Pareto frontier over configurations can be computed without approximation (Deb et al., 2002, cf.), while reproducing the structural ingredients of UMM training—a fully shared trunk, two asymmetric objectives, an order-of-magnitude token-budget asymmetry, and autoregressive generation against single-token classification—so that the conflict phenomenology matches what has been reported on production UMMs (Rao & Rachuri, 2026). Second, the audit must include an intervention, not only an observational correlation: we suppress conflict by projecting the generative gradient with controlled strength , moving the conflict level monotonically while holding data, schedule, and parameters fixed. Third, the audit must be honest about measurement noise: we quantify the test–retest reliability of every downstream metric and report the ceiling that any correlation cannot exceed (Spearman, 1904; Shrout & Fleiss, 1979).
Our contributions are as follows.
- •
An audit framework combining observational correlations with bootstrap intervals, partial correlations controlling for training progress, reliability ceilings, and a causal dose–response intervention; the field’s implicit premise becomes four falsifiable hypotheses, each with a killing experiment.
- •
A controlled testbed, GridUMM, reproducing the gradient-conflict phenomenology reported on production UMMs at a compute scale that permits 63 configurations; we release the world, the protocol, and all measurement code.
- •
The audit result: the directional conflict metrics—global and per-layer cosines, conflict rate, removed energy—are weak, fragile predictors of the trade-off, and suppressing conflict does not improve it; the norm ratio, the one gradient-geometric quantity with association, is a generation-failure detector. Training loss tracks the trade-off strongly, locating the failure in gradient-conflict geometry specifically, while functional interference measures predict it better than every conflict metric and retain that advantage in the regime that masters generation.
- •
A diagnostic standard: a protocol any UMM practitioner can run to decide whether conflict reduction is a valid intermediate target in their setting, and what to measure instead.
A controlled testbed cannot establish that any particular production-scale conflict-metric claim is false; it establishes what a validity claim must demonstrate, shows that the demonstration is absent from the literature, and makes such a demonstration routine. Section 5 returns to the implications for current conflict-motivated UMM designs.
2 Related Work
Unified architectures.
A first family of UMMs trains one transformer over interleaved discrete tokens for both objectives: Show-o unifies autoregressive and discrete-diffusion modeling (Xie et al., 2025a), Emu3 demonstrates pure next-token prediction over interleaved tokens (Wang et al., 2024), and Janus, Janus-Pro, Chameleon, and Transfusion establish decoupled visual encoding, early-fusion token mixing, and combined language-modeling plus diffusion objectives (Wu et al., 2025; Chen et al., 2025; Team, 2025; Zhou et al., 2025); later systems add progressive vocabularies, continuous tokens, visual autoregression, instruction tuning, and native unified generation (Tang et al., 2025; Fan et al., 2025; Zhuang et al., 2025; Xie et al., 2025b; Tong et al., 2025; Team, 2026; Xu et al., 2025) (Zhao et al., 2026, cf.). Our testbed abstracts the shared structure common to these designs—one trunk, one parameter space, two objectives with unequal token budgets (Appendix A)—while replacing natural data with a grammar whose ground-truth trade-off is exactly computable.
Conflict-motivated UMM design and diagnosis without validation.
A family of 2025–2026 works takes gradient conflict between the two objectives as the design driver: Uni-X separates conflicting shallow and deep layers (Hao et al., 2026), Symbiotic-MoE shields conflict-driven forgetting (Liu et al., 2026), ML-FOP-SOAP suppresses variance-induced conflicts with Fisher-orthogonal projection and SOAP-style preconditioning (Lu & Armour, 2026; Vyas et al., 2025), Pareto LoRA integrates imbalanced modality gradients (Wei et al., 2026), and task-aware MoE routing resolves task-objective conflicts (Zhang & Tang, 2026). For each, the conflict metric is a premise and the trade-off is reported separately. Closest to questioning the premise, Rao & Rachuri (2026) measure near-orthogonal gradients and find no DPO variant improves generation CLIPScore, and cross-task consistency benchmarks (Wang et al., 2026; Li et al., 2025) show that the two scores do not imply alignment; synergy, adversary, and continual-training studies characterize the phenomenon or mitigate its symptoms (Wu et al., 2026; Su et al., 2026; Wei et al., 2025a). None validates the diagnostic metric itself.
Multi-task optimization.
The optimizer-side interventions borrowed by UMM work originate in multi-task learning (Caruana, 1997; Vandenhende et al., 2021), with shared architectures from routing (Ma et al., 2018) to task-interaction networks (Vandenhende et al., 2020), loss weights adapted by uncertainty (Kendall et al., 2018) or auxiliary-gradient magnitudes (He et al., 2022), and gradient manipulation reshaping geometry directly: minimum-norm combinations (Sener & Koltun, 2018), gradient surgery and conflict-averse updates (Vandenhende et al., 2021; Liu et al., 2021, see), bargaining-game solutions (Navon et al., 2022), independent-component alignment (Senushkin et al., 2023), with Pareto concepts from multi-objective optimization (Deb et al., 2002). Our audit uses faithful implementations of these methods as the population over which conflict metrics vary—if conflict metrics fail to predict trade-offs even across methods whose entire purpose is to reshape gradient geometry, the metric’s diagnostic value is in doubt.
Modality imbalance.
Joint multimodal training is known to favor the faster-learning modality: the greedy-dynamics analysis of Wang et al. (2020) explains why multimodal networks can underperform unimodal ones, and balancing methods modulate gradients or prototypes on the fly (Peng et al., 2022; Fan et al., 2023; Wei et al., 2025b; Yang et al., 2025; Yang et al., 2026). Our norm-ratio finding connects to this literature: magnitude imbalance is real and diagnostic, but of generation failure, not of a directional conflict signal (Section 4.2).
Audits of benchmark validity.
Our protocol follows the tradition of audits that re-examine whether an accepted evaluation practice measures what it claims: rebuilt test sets revealed overfitting to reused ImageNet splits (Recht et al., 2019; Vasudevan et al., 2022), controlled re-evaluation collapsed metric-learning gains (Musgrave et al., 2020), and methodological reviews document the cost of unvalidated proxies (Varoquaux & Cheplygina, 2022). To our knowledge, no analogous audit exists for training-time conflict metrics in UMMs; this paper supplies one. Appendix A discusses each of these five literatures in more detail.
3 A Controlled Testbed for Conflict-Metric Validity
3.1 Why a controlled testbed
Auditing the validity of a diagnostic metric requires varying the metric while holding everything else fixed, measuring the ground-truth target without noise, and intervening on the metric causally. On a production UMM the correlation analysis alone would require 63 full training runs per design point, and the trade-off is observed through benchmarks whose seed-to-seed variance can exceed the differences being measured (Section 4.7). A controlled environment solves both problems at once and makes the audit pre-registerable; the price is external validity, managed by matching the structural ingredients of UMM training and verifying that the testbed’s conflict phenomenology reproduces production measurements (Section 4).
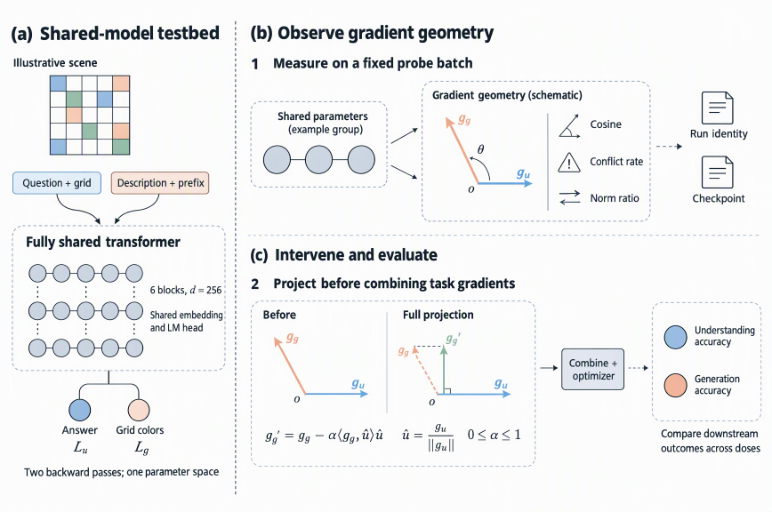
GridUMM places two objectives over one decoder-only transformer. The data world is a grid over eight colors; a scene contains 6–8 non-overlapping rectangular objects, and both tasks share a single interleaved marker/color token representation whose learned position markers anchor each output slot to its coordinate. Generation maps a description—objects enumerated in randomized order—to the marker/color stream autoregressively (25 color tokens plus end-of-stream, against 33–61 description tokens); understanding answers a question about the same stream (cell color, color count, or color-pair adjacency) with a single-token answer. Held-out sets are exact samples of the same grammar under fixed seeds, so downstream accuracies are unbiased estimates of generalization. Two regime facts matter for reading the audit: generation is mastered well before the budget ends by every configuration that trains its gradient at natural scale—the one weighting scheme that scales it down by the token-count ratio (token-normalized) fails to master it in a subset of seeds, an imbalance pathology visible in Table 1—so most trade-off variation lives on the understanding axis; and the conflict phenomenology’s magnitude is concentrated in the learning phase, exactly where the field’s premise operates (Figure 6, Appendix E). Every parameter is shared by both tasks: the strongest form of the UMM design point and the one under which conflict claims are made.
3.2 Training protocol
All runs use a two-backward protocol: each step draws a batch of 64 samples with the configuration’s data-mixing ratio, computes and in separate forward/backward passes, and captures per-group gradients (embedding, each of 6 blocks, and the output head) per objective. The update direction is the combination produced by the configuration’s method (Appendix C); conflict statistics are measured on a fixed probe batch (32+32 samples, identical across all runs) every 50 steps, so cross-configuration comparisons are not confounded by batch composition.
Because the generation objective is autoregressive, we train it with a teacher/student-forcing mixture: before step 200 the loss is pure teacher forcing (Williams & Zipser, 1989) on the ground-truth prefix; the student-forced share then ramps linearly to 0.400, i.e., for that share of samples the loss is computed on the model’s own sampled prefix while the targets remain ground truth. The mixture keeps the generation gradient alive throughout training; Appendix D documents the schedule. Training runs 900 steps with AdamW (, warmup 100, cosine decay), batch 64, and the understanding-to-generation data ratio drawn from .
3.3 Conflict metrics
At every snapshot we compute, over the shared parameters,
| (1) | ||||
| conflict rate | (2) |
and the removed energy, the fraction of a gradient-surgery-style projection would remove, aggregated over groups; indexes the 8 parameter groups. The norm ratio is reported in the direction generation/understanding; in GridUMM the generation side has the larger token budget (26 target tokens versus one answer token) but the smaller gradient norm at convergence, reproducing the imbalance structure reported on production UMMs (Rao & Rachuri, 2026).
3.4 Downstream trade-off
Each run is evaluated at four checkpoints (900/4 through 900) on a fixed held-out set: understanding accuracy over 512 questions and generation , the object-cell accuracy of greedy free-run decoding over 256 held-out descriptions. To compare configurations on a single axis we define the Pareto score ; the two-dimensional plane and its empirical Pareto frontier are analyzed directly as well (Figure 10). A configuration is Pareto dominated by another if the latter matches or exceeds it on both axes with at least one strict inequality. We avoid min–max normalization: with a saturating generation axis it would amplify resampling noise into the ranking (Appendix D).
3.5 Functional interference measures
Because our hypotheses contrast parameter-space gradient geometry with functional interference, we measure four candidates at each checkpoint, drawing on the probing and representation-similarity literature (Belinkov, 2022; Klabunde et al., 2025). (i) Probe separability: accuracy of a linear probe on the trunk’s mean-pooled last-block features predicting the answer token of held-out questions (2-fold cross-validated). (ii) Subspace overlap: mean principal-angle cosine between the top-8 singular subspaces of the two tasks’ last-block feature matrices. (iii) Effective rank: participation ratio of the covariance spectrum of the pooled feature matrix. (iv) Self-consistency: the fraction of questions about the model’s own generated scenes that it answers correctly—a functional analogue of the cross-task consistency XTC-Bench measures at the benchmark level (Wang et al., 2026).
3.6 Hypotheses
The premise decomposes into four falsifiable hypotheses, each with a designated experiment. HA-1 (the premise): some conflict metric correlates strongly () with the Pareto score across a controlled population; killed by E1, a correlation sweep with bootstrap intervals over 63 configurations and 252 checkpoint rows, with partial correlations controlling for training progress. HA-2: training loss is a valid surrogate; tested by E2, the rank correlation of final joint loss with Pareto score plus its predictive form and a dominance analysis. HA-3: if HA-1 fails, functional measures predict better; established or refuted by E4, a predictor competition with paired bootstrap tests. HA-4 (the adversarial converse, stated before measurement to prevent post-hoc rationalization): conflict metrics are predictive once appropriately weighted—by depth or stage; tested inside E1 with depth-weighted cosines and stage-conditional analyses. E3 supplies causal evidence: if conflict is monotonically suppressed by an intervention that changes nothing else and the trade-off does not respond monotonically, no reweighting rescue can be purely causal. E5 replicates the E1 sign structure at a second model scale.
4 Experiments
4.1 Setup
The population consists of 63 base-scale configurations—7 gradient-combination strategies 3 data ratios (1:2, 1:1, 2:1) 3 seeds—plus 12 intervention configurations (E3) and 18 configurations at a second scale (E5): 93 training runs, 372 measured checkpoints, each with the full conflict-metric and downstream vectors (Table 4, Appendix E). The compute budget was a single Apple M4 Max laptop (MPS, float32), up to six concurrent configurations, 18.8 aggregate run-hours; every manifest records device, software, and wall-clock time. Methods are faithful implementations of the published algorithms (Appendix C); two documented simplifications are noted there.
| Method | understanding | generation (obj.) | joint score | rate | norm ratio | |
|---|---|---|---|---|---|---|
| Naive | 0.630 | 0.998 | 0.814 | 0.001 | 0.417 | 0.025 |
| Token-normalized | 0.622 | 0.607 | 0.614 | 0.000 | 0.542 | 0.339 |
| GradNorm-style | 0.633 | 0.996 | 0.815 | 0.002 | 0.514 | 0.112 |
| PCGrad-style | 0.641 | 0.999 | 0.820 | 0.000 | 0.639 | 0.027 |
| CAGrad | 0.636 | 0.999 | 0.818 | -0.003 | 0.708 | 0.029 |
| MGDA | 0.389 | 1.000 | 0.694 | 0.123 | 0.208 | 0.004 |
| SOAP-style | 0.543 | 0.000 | 0.271 | 0.002 | 0.389 | 0.476 |
4.2 E1: does conflict predict the trade-off?
The operative premise is predictive: practitioners measure conflict during training and read it as a signal about the eventual trade-off. We test both readings. The predictive analysis correlates conflict statistics measured at 25% of the budget with the final Pareto score (); the concurrent analysis correlates conflict and trade-off at the same checkpoint across all 252 rows with cluster-bootstrap intervals, and a partial Spearman correlation removes the training-progress component (rank-regressing out the step index), addressing the trivial concern that both quantities simply improve with training.
Figure 2 shows the core result: conflict magnitude measured during the learning phase against the final trade-off, every configuration plotted. The rank correlation is (95% CI [-0.463, 0.079]). Table 5 reports the full conflict-metric vector at both levels (Appendix E): at the predictive level—the field’s operative reading—no directional conflict metric reaches with a confidence interval excluding zero. The early-concurrent HA-4 weighted analysis gives (with the shallow-weighted variant the exception: , CI [-0.55, -0.01], below the threshold); the per-layer profile (Figure 5) shows an otherwise flat profile with block 5 the exception (, CI [-0.59, -0.11]). The exception is the norm ratio, a magnitude-imbalance quantity rather than a directional conflict measure—and its mechanism is failure detection, not interference: across the full checkpoint population it reaches (95% CI [-0.72, -0.57]), but it correlates with generation accuracy at , and within the configurations that master generation—the regime in which the field would actually deploy it—it is null (, CI [-0.17, 0.18]). The concurrent configuration-level associations are larger but mutually sign-inconsistent (concurrent configuration level: cos global [-0.52, -0.10]; conflict rate [0.13, 0.54]; removed energy [0.16, 0.56]—moderate, mutually sign-inconsistent, and unstable under the regime cut below). Repeating the checkpoint-level analysis within the 135 checkpoints of configurations that master generation sharpens the picture: every directional conflict metric stays weak and sign-inconsistent (largest ), the norm ratio drops to null (), and the functional measures stay strong (probe separability , effective rank ). At the concurrent checkpoint level the partial correlations controlling for progress are (global cosine) and (conflict rate), with and 0.049 respectively.
4.3 E2: is training loss a valid surrogate?
Training loss is the outcome most often reported when benchmarks are skipped—the practice our audit tests, following Lu & Armour (2026). At the configuration level, the rank correlation of the final joint probe loss with the Pareto score is (95% CI -0.959—0.883, ); task-resolved correlations are (understanding) and (generation). The predictive form—joint loss at 25% of the budget read as a forecast of the eventual trade-off, which is what a loss curve is used for—correlates at (95% CI -0.623—0.173). The run-level pairing (Figure 4) shows 90 of 1953 loss-ordered pairs (0.046) with the better-loss configuration Pareto-dominated. A lower training loss is therefore a strong configuration-level surrogate in this testbed ( within the 47 generation-mastering configurations), although 74 of 1081 loss-ordered pairs still reverse. The contrast with E1 is itself informative: in the same testbed where every directional conflict metric fails, the loss surrogate tracks the trade-off, so the invalidity exposed by this audit is specific to gradient-conflict geometry, not a generic consequence of using cheap proxies.
4.4 E3: intervention—suppressing conflict causally
Correlation, however weak, cannot separate “conflict is uninformative” from “conflict is informative but confounded.” We therefore intervene: at every step, the generative gradient is projected against the understanding gradient with strength , scaling every group’s task-gradient cosine by and hence monotonically suppressing conflict while holding data, schedule, and parameters fixed. The manipulation check (Figure 7, left) confirms the monotone dose: as the learning-phase mean over snapshots at steps 200–500, the effective conflict magnitude falls from 0.005 at to 0.000 at (Spearman between dose and suppressed conflict: ). The raw, unprojected level—also plotted—does not fall with the dose: the adapted gradients re-create conflict at comparable levels, so the readout must come from the intervention itself. The causal readout (right): does the trade-off follow? It does not—the Pareto score across doses is flat within seed noise (total range 0.005 against a mean per-dose s.d. of 0.028), with a dose–outcome correlation of (). Comparing full suppression () with no intervention (, identical to the matched E1 configurations) by seed moves the joint score by only -0.002 (understanding -0.004, generation object-cell 0.001), against a seed-to-seed spread of 0.037. Suppressing conflict completely moves the joint score by -0.002 (understanding -0.004, generation object-cell +0.001), a shift within the seed-to-seed spread (0.037) of the un-intervened configuration.
4.5 E4: what does predict the trade-off?
If gradient-geometric conflict metrics fail, the constructive question is what succeeds. We compare four functional measures against the conflict metrics at the checkpoint level (Table 2; visual comparison in Figure 8): probe separability, subspace overlap, effective rank, self-consistency (Section 3.5). The best functional predictor (eff_rank) reaches (CI 0.603–0.782) versus -0.187 for the best directional conflict metric (conflict_mag), a difference of large and statistically significant ( gap 0.51) (paired bootstrap CI on : 0.729–1.041). The strongest gradient-geometric competitor is the norm ratio (, CI -0.721—0.573), comparable in absolute strength (, paired bootstrap CI -0.044–0.140)—but the regime cut dissolves its interest: as E1 established, the norm ratio is a generation-failure detector, null within the configurations that master generation, where the functional measures retain their advantage (self_consistency at versus 0.230, paired CI 0.470–0.784). Self-consistency shows why the cut matters: the collapsed SOAP-style runs are trivially self-consistent—they render uniform background scenes and answer questions about them correctly—flipping the measure’s sign in the full population ().
| Predictor | 95% CI | |
|---|---|---|
| Probe separability | 0.534 | [0.406, 0.639] |
| Subspace overlap | 0.132 | [-0.037, 0.281] |
| Effective rank | 0.702 | [0.603, 0.782] |
| Self-consistency | -0.117 | [-0.259, 0.034] |
| Norm ratio | -0.651 | [-0.721, -0.573] |
| Conflict magnitude | -0.187 | [-0.318, -0.046] |
| Removed energy | 0.179 | [0.062, 0.294] |
| Conflict rate | 0.123 | [0.007, 0.239] |
| Global cosine | -0.074 | [-0.190, 0.045] |
4.6 E5: does the conclusion survive a scale change?
Replicating the audit at a larger scale (, 8 layers, 18 runs of three representative methods) yields the same sign structure: the directional conflict metrics remain within noise at the larger scale (largest , CI [-0.33, 0.04], against 0.19 at the base scale), and the norm-ratio association persists (, CI [-0.64, -0.20]) (per-metric bars for both scales in Figure 9).
4.7 Reliability ceiling and statistical power
A correlation cannot exceed the reliability of its measures (Spearman, 1904), and an audit that ignores this can mistake measurement noise for a null result. We resample the held-out sets five times per final checkpoint and compute ICC(1,1) (Shrout & Fleiss, 1979): 0.982 for understanding accuracy, 1.000 for generation object-cell accuracy. The geometric-mean reliability implies a correlation ceiling of ; disattenuating the observed config-level correlation gives -0.324—the association remains weak after crediting the metrics for all attenuation benchmark noise can explain. On power: with configurations the minimum detectable at , power is 0.362; the checkpoint level () reaches 0.178. The audit is therefore powered to detect moderate associations and the reported CIs are informative, not vacuous.
5 Discussion and Limitations
What the audit does and does not show.
The result is a statement about metric validity, not about the usefulness of any intervention. In the controlled regime we can establish the premise’s operational content—that a conflict metric measured during training carries information about the eventual trade-off—and find it unsupported for the directional metrics the field keys on: the association is weak at the predictive level (largest , interval crossing zero) and unstable where it is larger (the concurrent configuration-level associations are sign-inconsistent and dissolve under the regime cut), and it does not survive the reliability ceiling correction, the progress control, or a per-layer reweighting. The causal intervention shows that even removing conflict does not move the trade-off, ruling out the strongest rescue (”the correlation is diluted but causally real”). None of this contradicts the possibility that on production-scale UMMs conflict metrics behave differently; it establishes that the burden of demonstration sits with the claimant, and provides the protocol that makes the demonstration routine rather than an act of faith.
Why the field adopted an unvalidated proxy.
Conflict metrics are cheap, continuous, and measurable every step, whereas the trade-off requires benchmark suites with known reliability problems (Recht et al., 2019; Musgrave et al., 2020; Varoquaux & Cheplygina, 2022), and the proxy has an intuitive mechanism story. Our results do not make the proxy useless; they show that its validity is setting-dependent, and that the settings where it was adopted never checked it. The protocol of Section 3.6 costs a fraction of the intervention methods’ compute and returns an explicit go/no-go signal.
The method population exhibits the pathologies the field fears.
The method rows are themselves informative. Under an order-of-magnitude task-norm imbalance, MGDA’s minimum-norm combination collapses onto the minority-gradient task: understanding stalls at 0.389 while generation reaches 1.000—a pathology mirroring, in miniature, the modality-imbalance complaints that motivated balancing methods (Wei et al., 2026; Peng et al., 2022; Fan et al., 2023). SOAP-style preconditioning collapses the generation axis outright (object-cell accuracy 0.000, joint score 0.271 in all nine runs)—and its conflict statistics sit inside the healthy range (cosine 0.002, rate 0.389, versus naive training’s 0.001 and 0.417): the worst method is invisible to every directional conflict metric, and only the norm ratio flags it, for the failure-detection reason established in E1. Method choice changes where a configuration lands on the two axes (Table 1) without any conflict metric tracking those differences—precisely the decoupling the audit is designed to expose.
Functional measures won—carefully interpreted.
The best functional predictor (eff_rank, ) outperformed every directional conflict metric by a clear paired-bootstrap margin and retains its advantage in the regime that masters generation (self_consistency, ). The strongest gradient-geometric competitor, the norm ratio (), is a generation-failure detector, null among configurations that master generation. The functional measures stay strong exactly where the field would deploy them. We read this as evidence for the construct the field was reaching for: interference between the tasks’ computations, manifesting in representation geometry and cross-task functional consistency rather than parameter-space gradient directions. We do not claim these measures are the answer; they are the leading candidates in a competition that, to our knowledge, had never been run.
Limitations.
(i) Scale: the testbed is 3.2M–6.7M parameters on a synthetic grammar; the audit’s logic and protocol transfer to production scales, its quantitative conclusions do not automatically; we mitigate by reproducing the conflict phenomenology and releasing a protocol whose cost scales linearly in the number of configurations. (ii) Regime: generation is mastered by every configuration training its gradient at natural scale (the token-normalized weighting collapses it in a subset of seeds), so trade-off variation mostly lives on the understanding axis; the audit’s machinery is unchanged when both axes vary. (iii) Method coverage: seven gradient-combination strategies spanning the families used by the examined literature (Vandenhende et al., 2021); architecture and data-scheduling interventions are not swept. (iv) Power: with 63 configurations the minimum detectable correlation is 0.362; the CIs are the honest statement of what the design can and cannot rule out, and the checkpoint-level analysis with 252 rows tightens detection to 0.178.
6 Conclusion
A family of UMM designs and optimizers is built on an assumption that has never been tested: that lowering a gradient-conflict metric improves the understanding–generation trade-off. We turned that assumption into four falsifiable hypotheses, built a controlled testbed in which each has a designated experiment, ran the audit across 93 training configurations with reliability ceilings and a causal intervention, and found the assumption unsupported: directional conflict metrics carry no more than weak and statistically fragile signal about the trade-off, suppressing conflict causally does not improve it, and functional interference measures predict it better—while training loss, in the same testbed, tracks the trade-off strongly, locating the failure in gradient-conflict geometry specifically.
AI use statement
In this work we used generative AI tools for the following tasks with disclosure. AI tools were used to (i) implement the testbed code, training protocol, measurement pipeline, and analysis scripts from a detailed written research design; (ii) execute the training and evaluation runs on local hardware and assemble the results into figures and tables; (iii) draft and edit the manuscript text. We did not use AI tools for formulating the core research hypotheses, which derive from the authors’ literature audit documented in the project’s research-design files, and we did not use AI tools to select or cite literature without verification: every citation was checked against the arXiv or publisher record, and no results, statistics, or bibliographic entries were generated without being traceable to an executed computation or a verified record. All AI-assisted code was tested for correctness—including end-to-end unit checks of data-to-target alignment, teacher-forcing alignment, and cached-versus-full decoding equivalence—and the audit’s claims were read against the raw measurement tables by the authors. We take full responsibility for the final content of this work, including text, claims, and artifacts produced with the aid of generative AI.
Reproducibility statement
The complete audit is reproducible from the released artifact: the world and model definitions, the seven gradient-combination methods and the intervention, the fixed probe batch, all random seeds, the run manifest, and the analysis script that regenerates every number, figure, and table in this paper from raw measurement CSVs. Appendix B lists all hyperparameters; Appendix D documents the teacher/student-forcing schedule and the per-method update rules, including our two documented deviations from canonical implementations (norm restoration for MGDA and RMS-normalized SOAP-style preconditioning). Each run’s configuration, hardware, wall-clock time, and software versions are recorded in its manifest, and the full compute budget was a single Apple M4 Max laptop (MPS) run with up to six concurrent training processes over 18.8 aggregate run-hours of wall-clock time.
Ethics statement
This work is a negative-result audit of a diagnostic practice in multimodal model training. It involves no human subjects, no personal data, and no new data collection; the testbed is fully synthetic. The main ethical exposure is scholarly: negative results that contradict widely repeated premises can be unwelcome to the works whose premises are examined, and we have therefore restricted every claim to what the controlled setting demonstrates, cited the examined works precisely and verifiably, and provided the protocol by which any of our conclusions can be re-tested at other scales. We release the audit protocol publicly so that practitioners with different compute budgets can apply it to their own settings.
References
- Belinkov (2022) Yonatan Belinkov. Probing classifiers: Promises, shortcomings, and advances. Computational Linguistics, 48(1):207–219, 2022. URL https://arxiv.org/abs/2102.12452.
- Caruana (1997) Rich Caruana. Multitask learning. Machine Learning, 28(1):41–75, 1997. ISSN 1573-0565. doi: 10.1023/a:1007379606734. URL http://dx.doi.org/10.1023/A:1007379606734.
- Chen et al. (2025) Xiaokang Chen, Zhiyu Wu, Xingchao Liu, Zizheng Pan, Wen Liu, Zhenda Xie, Xingkai Yu, and Chong Ruan. Janus-pro: Unified multimodal understanding and generation with data and model scaling, 2025. URL https://arxiv.org/abs/2501.17811.
- Deb et al. (2002) K. Deb, A. Pratap, S. Agarwal, and T. Meyarivan. A fast and elitist multiobjective genetic algorithm: Nsga-ii. IEEE Transactions on Evolutionary Computation, 6(2):182–197, April 2002. ISSN 1089-778X. doi: 10.1109/4235.996017. URL http://dx.doi.org/10.1109/4235.996017.
- Efron (1979) B. Efron. Bootstrap methods: Another look at the jackknife. The Annals of Statistics, 7(1), January 1979. ISSN 0090-5364. doi: 10.1214/aos/1176344552. URL http://dx.doi.org/10.1214/aos/1176344552.
- Fan et al. (2025) Lijie Fan, Luming Tang, Siyang Qin, Tianhong Li, Xuan Yang, Siyuan Qiao, Andreas Steiner, Chen Sun, Yuanzhen Li, Tao Zhu, Michael Rubinstein, Michalis Raptis, Deqing Sun, and Radu Soricut. Unified autoregressive visual generation and understanding with continuous tokens, 2025. URL https://arxiv.org/abs/2503.13436.
- Fan et al. (2023) Yunfeng Fan, Wenchao Xu, Haozhao Wang, Junxiao Wang, and Song Guo. Pmr: Prototypical modal rebalance for multimodal learning. In 2023 IEEE/CVF Conference on Computer Vision and Pattern Recognition (CVPR), pp. 20029–20038. IEEE, 2023. doi: 10.1109/cvpr52729.2023.01918. URL http://dx.doi.org/10.1109/cvpr52729.2023.01918.
- Hao et al. (2026) Jitai Hao, Hao Liu, Xinyan Xiao, Qiang Huang, and Jun Yu. Uni-x: Mitigating modality conflict with a two-end-separated architecture for unified multimodal models. In International Conference on Learning Representations (ICLR), 2026. URL https://arxiv.org/abs/2509.24365.
- He et al. (2022) Yun He, Xue Feng, Cheng Cheng, Geng Ji, Yunsong Guo, and James Caverlee. Metabalance: Improving multi-task recommendations via adapting gradient magnitudes of auxiliary tasks. In Proceedings of the ACM Web Conference 2022, WWW ’22, pp. 2205–2215. ACM, April 2022. doi: 10.1145/3485447.3512093. URL http://dx.doi.org/10.1145/3485447.3512093.
- Kendall et al. (2018) Alex Kendall, Yarin Gal, and Roberto Cipolla. Multi-task learning using uncertainty to weigh losses for scene geometry and semantics. In Proceedings of the IEEE/CVF Conference on Computer Vision and Pattern Recognition (CVPR), pp. 7482–7491, 2018. URL https://arxiv.org/abs/1705.07115.
- Klabunde et al. (2025) Max Klabunde, Tobias Schumacher, Markus Strohmaier, and Florian Lemmerich. Similarity of neural network models: A survey of functional and representational measures. ACM Computing Surveys, 57(9):1–52, May 2025. ISSN 1557-7341. doi: 10.1145/3728458. URL http://dx.doi.org/10.1145/3728458.
- Li et al. (2025) Yi Li, Haonan Wang, Qixiang Zhang, Boyu Xiao, Chenchang Hu, Hualiang Wang, and Xiaomeng Li. Unieval: Unified holistic evaluation for unified multimodal understanding and generation, 2025. URL https://arxiv.org/abs/2505.10483.
- Liu et al. (2021) Bo Liu, Xingchao Liu, Xiaojie Jin, Peter Stone, and Qiang Liu. Conflict-averse gradient descent for multi-task learning. In Advances in Neural Information Processing Systems, volume 34, pp. 18878–18890, 2021. URL https://arxiv.org/abs/2110.14048.
- Liu et al. (2026) Xiangyue Liu, Zijian Zhang, Miles Yang, Zhao Zhong, Liefeng Bo, and Ping Tan. Symbiotic-moe: Unlocking the synergy between generation and understanding, 2026. URL https://arxiv.org/abs/2604.07753.
- Lu et al. (2024) Jiasen Lu, Christopher Clark, Sangho Lee, Zichen Zhang, Savya Khosla, Ryan Marten, Derek Hoiem, and Aniruddha Kembhavi. Unified-io 2: Scaling autoregressive multimodal models with vision, language, audio, and action. In 2024 IEEE/CVF Conference on Computer Vision and Pattern Recognition (CVPR), pp. 26429–26445. IEEE, 2024. doi: 10.1109/cvpr52733.2024.02497. URL http://dx.doi.org/10.1109/cvpr52733.2024.02497.
- Lu & Armour (2026) Yishun Lu and Wes Armour. Second-order multi-level variance correction for modality competition in multimodal models, 2026. URL https://arxiv.org/abs/2605.16165.
- Ma et al. (2018) Jiaqi Ma, Zhe Zhao, Xinyang Yi, Jilin Chen, Lichan Hong, and Ed H. Chi. Modeling task relationships in multi-task learning with multi-gate mixture-of-experts. In Proceedings of the 24th ACM SIGKDD International Conference on Knowledge Discovery & Data Mining, KDD ’18, pp. 1930–1939. ACM, 2018. doi: 10.1145/3219819.3220007. URL http://dx.doi.org/10.1145/3219819.3220007.
- Musgrave et al. (2020) Kevin Musgrave, Serge Belongie, and Ser-Nam Lim. A metric learning reality check. In Computer Vision – ECCV 2020, pp. 681–699. Springer International Publishing, 2020. URL https://arxiv.org/abs/2003.08505.
- Navon et al. (2022) Aviv Navon, Aviv Shamsian, Idan Achituve, Haggai Maron, Kenji Kawaguchi, Gal Chechik, and Ethan Fetaya. Multi-task learning as a bargaining game. In Proceedings of the 39th International Conference on Machine Learning (ICML), volume 162 of Proceedings of Machine Learning Research, pp. 16428–16446. PMLR, 2022. URL https://arxiv.org/abs/2202.01017.
- Peng et al. (2022) Xiaokang Peng, Yake Wei, Andong Deng, Dong Wang, and Di Hu. Balanced multimodal learning via on-the-fly gradient modulation. In Proceedings of the IEEE/CVF Conference on Computer Vision and Pattern Recognition (CVPR), 2022. URL https://arxiv.org/abs/2203.15332.
- Rao & Rachuri (2026) Abinav Rao and Sujan Rachuri. Do understanding and generation fight? a diagnostic study of dpo for unified multimodal models, 2026. URL https://arxiv.org/abs/2603.17044.
- Recht et al. (2019) Benjamin Recht, Rebecca Roelofs, Ludwig Schmidt, and Vaishaal Shankar. Do imagenet classifiers generalize to imagenet? In Proceedings of the 36th International Conference on Machine Learning (ICML), volume 97 of Proceedings of Machine Learning Research, pp. 5389–5400. PMLR, 2019. URL https://arxiv.org/abs/1902.10811.
- Sener & Koltun (2018) Ozan Sener and Vladlen Koltun. Multi-task learning as multi-objective optimization. In Advances in Neural Information Processing Systems, volume 31, 2018. URL https://arxiv.org/abs/1810.04650.
- Senushkin et al. (2023) Dmitry Senushkin, Nikolay Patakin, Arseny Kuznetsov, and Anton Konushin. Independent component alignment for multi-task learning. In Proceedings of the IEEE/CVF Conference on Computer Vision and Pattern Recognition (CVPR), pp. 20083–20093, 2023. URL https://arxiv.org/abs/2305.19000.
- Shrout & Fleiss (1979) Patrick E. Shrout and Joseph L. Fleiss. Intraclass correlations: Uses in assessing rater reliability. Psychological Bulletin, 86(2):420–428, 1979. ISSN 0033-2909. doi: 10.1037/0033-2909.86.2.420. URL http://dx.doi.org/10.1037/0033-2909.86.2.420.
- Spearman (1904) C. Spearman. The proof and measurement of association between two things. The American Journal of Psychology, 15(1):72, January 1904. ISSN 0002-9556. doi: 10.2307/1412159. URL http://dx.doi.org/10.2307/1412159.
- Su et al. (2026) Zhaolong Su, Wang Lu, Hao Chen, Sharon Li, and Jindong Wang. Unigame: Turning a unified multimodal model into its own adversary. In Proceedings of the IEEE/CVF Conference on Computer Vision and Pattern Recognition (CVPR), 2026. URL https://arxiv.org/abs/2511.19413.
- Tang et al. (2025) Hongxuan Tang, Hao Liu, and Xinyan Xiao. Ugen: Unified autoregressive multimodal model with progressive vocabulary learning, 2025. URL https://arxiv.org/abs/2503.21193.
- Team (2025) Chameleon Team. Chameleon: Mixed-modal early-fusion foundation models, 2025. URL https://arxiv.org/abs/2405.09818.
- Team (2026) Tencent Hunyuan Foundation Model Team. Hunyuanimage 3.0 technical report, 2026. URL https://arxiv.org/abs/2509.23951.
- Tong et al. (2025) Shengbang Tong, David Fan, Jiachen Zhu, Yunyang Xiong, Xinlei Chen, Koustuv Sinha, Michael Rabbat, Yann LeCun, Saining Xie, and Zhuang Liu. Metamorph: Multimodal understanding and generation via instruction tuning. In Proceedings of the IEEE/CVF International Conference on Computer Vision (ICCV), pp. 17001–17012, 2025. URL https://arxiv.org/abs/2412.14164.
- Vandenhende et al. (2020) Simon Vandenhende, Stamatios Georgoulis, and Luc Van Gool. MTI-Net: Multi-scale Task Interaction Networks for Multi-task Learning, pp. 527–543. Springer International Publishing, 2020. ISBN 9783030585488. doi: 10.1007/978-3-030-58548-8_31. URL http://dx.doi.org/10.1007/978-3-030-58548-8_31.
- Vandenhende et al. (2021) Simon Vandenhende, Stamatios Georgoulis, Wouter Van Gansbeke, Marc Proesmans, Dengxin Dai, and Luc Van Gool. Multi-task learning for dense prediction tasks: A survey. IEEE Transactions on Pattern Analysis and Machine Intelligence, pp. 1–1, 2021. ISSN 1939-3539. doi: 10.1109/tpami.2021.3054719. URL http://dx.doi.org/10.1109/tpami.2021.3054719.
- Varoquaux & Cheplygina (2022) Gaël Varoquaux and Veronika Cheplygina. Machine learning for medical imaging: methodological failures and recommendations for the future. npj Digital Medicine, 5(1), April 2022. ISSN 2398-6352. doi: 10.1038/s41746-022-00592-y. URL http://dx.doi.org/10.1038/s41746-022-00592-y.
- Vasudevan et al. (2022) Vijay Vasudevan, Benjamin Caine, Raphael Lopes, Sara Fridovich-Keil, and Rebecca Roelofs. When does dough become a bagel? analyzing the remaining mistakes on imagenet. In Advances in Neural Information Processing Systems, volume 35, 2022. URL https://arxiv.org/abs/2205.04596.
- Vyas et al. (2025) Nikhil Vyas, Depen Morwani, Rosie Zhao, Mujin Kwun, Itai Shapira, David Brandfonbrener, Lucas Janson, and Sham Kakade. Soap: Improving and stabilizing shampoo using adam. In International Conference on Learning Representations (ICLR), 2025. URL https://arxiv.org/abs/2409.11321.
- Wang et al. (2026) Weixing Wang, Liudvikas Zekas, Anton Hackl, Constantin Alexander Auga, Parisa Shahabinejad, Jona Otholt, Antonio Rueda-Toicen, and Gerard de Melo. Beyond accuracy: Benchmarking cross-task consistency in unified multimodal models, 2026. URL https://arxiv.org/abs/2604.25072.
- Wang et al. (2020) Weiyao Wang, Du Tran, and Matt Feiszli. What makes training multi-modal classification networks hard? In Proceedings of the IEEE/CVF Conference on Computer Vision and Pattern Recognition (CVPR), 2020. URL https://arxiv.org/abs/1905.12681.
- Wang et al. (2024) Xinlong Wang, Xiaosong Zhang, Zhengxiong Luo, Quan Sun, Yufeng Cui, Jinsheng Wang, Fan Zhang, Yueze Wang, Zhen Li, Qiying Yu, Yingli Zhao, Yulong Ao, Xuebin Min, Tao Li, Boya Wu, Bo Zhao, Bowen Zhang, Liangdong Wang, Guang Liu, Zheqi He, Xi Yang, Jingjing Liu, Yonghua Lin, Tiejun Huang, and Zhongyuan Wang. Emu3: Next-token prediction is all you need, 2024. URL https://arxiv.org/abs/2409.18869.
- Wei et al. (2025a) Xiwen Wei, Mustafa Munir, and Radu Marculescu. Mitigating intra- and inter-modal forgetting in continual learning of unified multimodal models. In Advances in Neural Information Processing Systems, volume 38, 2025a. URL https://arxiv.org/abs/2512.03125.
- Wei et al. (2026) Xiwen Wei, Mark Nutter, Madhusudhanan Srinivasan, and Radu Marculescu. Pareto lora: Mitigating modality imbalance in unified multimodal models via pareto-optimal gradient integration, 2026. URL https://arxiv.org/abs/2606.17296.
- Wei et al. (2025b) Yake Wei, Di Hu, Henghui Du, and Ji-Rong Wen. On-the-fly modulation for balanced multimodal learning. IEEE Transactions on Pattern Analysis and Machine Intelligence, 47(1):469–485, 2025b. URL https://arxiv.org/abs/2410.11582.
- Williams & Zipser (1989) Ronald J. Williams and David Zipser. A learning algorithm for continually running fully recurrent neural networks. Neural Computation, 1(2):270–280, 1989. ISSN 1530-888X. doi: 10.1162/neco.1989.1.2.270. URL http://dx.doi.org/10.1162/neco.1989.1.2.270.
- Wu et al. (2025) Chengyue Wu, Xiaokang Chen, Zhiyu Wu, Yiyang Ma, Xingchao Liu, Zizheng Pan, Wen Liu, Zhenda Xie, Xingkai Yu, Chong Ruan, and Ping Luo. Janus: Decoupling visual encoding for unified multimodal understanding and generation. In 2025 IEEE/CVF Conference on Computer Vision and Pattern Recognition (CVPR), pp. 12966–12977. IEEE, 2025. doi: 10.1109/cvpr52734.2025.01210. URL http://dx.doi.org/10.1109/cvpr52734.2025.01210.
- Wu et al. (2026) Penghao Wu, Haiwen Diao, Weichen Fan, Lewei Lu, Dahua Lin, and Ziwei Liu. Uncovering understanding-generation synergy in native unified multimodal models: From representation, task to system, 2026. URL https://arxiv.org/abs/2609.01607.
- Xie et al. (2025a) Jinheng Xie, Weijia Mao, Zechen Bai, David Junhao Zhang, Weihao Wang, Kevin Qinghong Lin, Yuchao Gu, Zhijie Chen, Zhenheng Yang, and Mike Zheng Shou. Show-o: One single transformer to unify multimodal understanding and generation. In International Conference on Learning Representations (ICLR), 2025a. URL https://arxiv.org/abs/2408.12528.
- Xie et al. (2025b) Jinheng Xie, Zhenheng Yang, and Mike Zheng Shou. Show-o2: Improved native unified multimodal models. In Advances in Neural Information Processing Systems, volume 38, 2025b. URL https://arxiv.org/abs/2506.15564.
- Xu et al. (2025) Zhiyang Xu, Jiuhai Chen, Zhaojiang Lin, Xichen Pan, Lifu Huang, Tianyi Zhou, Madian Khabsa, Qifan Wang, Di Jin, Michihiro Yasunaga, Lili Yu, Xi Victoria Lin, and Shaoliang Nie. Pisces: An auto-regressive foundation model for image understanding and generation, 2025. URL https://arxiv.org/abs/2506.10395.
- Yang et al. (2026) Jingfan Yang, Rui Zhang, Liang Hong, and Ke Yuan. Scope: Preserving modality-specific cues to mitigate modality laziness in multimodal learning. In Findings of the Association for Computational Linguistics: ACL 2026, pp. 29066–29078. Association for Computational Linguistics, 2026. doi: 10.18653/v1/2026.findings-acl.1453. URL http://dx.doi.org/10.18653/v1/2026.findings-acl.1453.
- Yang et al. (2025) Yang Yang, Xixian Wu, and Qing-Yuan Jiang. Towards equilibrium: An instantaneous probe-and-rebalance multimodal learning approach. In Proceedings of the Thirty-Fourth International Joint Conference on Artificial Intelligence, IJCAI-2025, pp. 3552–3560. International Joint Conferences on Artificial Intelligence Organization, 2025. doi: 10.24963/ijcai.2025/395. URL http://dx.doi.org/10.24963/ijcai.2025/395.
- Zhang & Tang (2026) Jiaxing Zhang and Hao Tang. Resolving task objective conflicts in unified model via task-aware mixture-of-experts. In Proceedings of the 25th International Conference on Autonomous Agents and Multiagent Systems (AAMAS). IFAAMAS, 2026. URL https://arxiv.org/abs/2506.03591. Extended abstract.
- Zhao et al. (2026) Shanshan Zhao, Xinjie Zhang, Jintao Guo, Jiakui Hu, Lunhao Duan, Minghao Fu, Yong Xien Chng, Guo-Hua Wang, Qing-Guo Chen, Zhao Xu, Weihua Luo, and Kaifu Zhang. Unified multimodal understanding and generation models: Advances, challenges, and opportunities, 2026. URL https://arxiv.org/abs/2505.02567.
- Zhou et al. (2025) Chunting Zhou, Lili Yu, Arun Babu, Kushal Tirumala, Michihiro Yasunaga, Leonid Shamis, Jacob Kahn, Xuezhe Ma, Luke Zettlemoyer, and Omer Levy. Transfusion: Predict the next token and diffuse images with one multi-modal model. In International Conference on Learning Representations (ICLR), 2025. URL https://arxiv.org/abs/2408.11039.
- Zhuang et al. (2025) Xianwei Zhuang, Yuxin Xie, Yufan Deng, Liming Liang, Jinghan Ru, Yuguo Yin, and Yuexian Zou. Vargpt: Unified understanding and generation in a visual autoregressive multimodal large language model, 2025. URL https://arxiv.org/abs/2501.12327.
Appendix A Extended Related Work
Unified architectures, in detail.
Show-o (Xie et al., 2025a) unifies autoregressive and discrete-diffusion modeling in one transformer; Emu3 (Wang et al., 2024) demonstrates pure next-token prediction over interleaved visual and textual tokens; Janus (Wu et al., 2025) separates understanding- and generation-oriented visual encoders while unifying the trunk, and Janus-Pro (Chen et al., 2025) scales that recipe with data and parameter scaling. Chameleon (Team, 2025) establishes early-fusion token-based mixed-modal training with a stability recipe for image-text interleaves; Transfusion (Zhou et al., 2025) combines a language-modeling objective over text with a diffusion objective over image patches in one model; Unified-IO 2 (Lu et al., 2024) extends autoregressive multimodality across vision, language, audio, and action. Later unified systems pursue progressive vocabulary learning (Tang et al., 2025), continuous-token autoregression (Fan et al., 2025), visual-autoregressive generation inside an MLLM (Zhuang et al., 2025), improved native unified modeling (Xie et al., 2025b), visual-predictive instruction tuning (Tong et al., 2025), native unified image generation at scale (Team, 2026), and decoupled autoregressive understanding-generation foundation models (Xu et al., 2025); surveys consolidate this rapidly growing family (Zhao et al., 2026). Across all of these designs, one trunk (or one tied trunk family) serves objectives with very different token budgets and output structures; our testbed isolates exactly that shared structure.
Conflict-motivated UMM design, in detail.
Uni-X (Hao et al., 2026) reports that gradient conflicts between vision and text concentrate in shallow and deep layers of a shared autoregressive transformer and diminish in middle layers, and proposes a two-end-separated, middle-shared architecture; its evidence for downstream benefit is training efficiency and benchmark scores, not a measured link between conflict reduction and trade-off improvement. Symbiotic-MoE (Liu et al., 2026) frames understanding-side catastrophic forgetting as the consequence of severe gradient conflicts and introduces modality-aware expert disentanglement with early-stage gradient shielding. ML-FOP-SOAP (Lu & Armour, 2026) shows that first-order optimizers are vulnerable to cross-modality gradient heterogeneity and proposes Fisher-orthogonal projection with SOAP-style preconditioning (Vyas et al., 2025); its reported evidence is training-loss sample efficiency and wall-clock speed on Janus and Emu3, without downstream benchmark evaluation. Pareto LoRA (Wei et al., 2026) measures order-of-magnitude modality-specific gradient imbalance under LoRA fine-tuning and integrates text- and image-side gradients by Pareto optimality. Task-aware MoE routing (Zhang & Tang, 2026) resolves task-objective conflicts by routing.
Diagnosis without validation, in detail.
Rao & Rachuri (2026) perform a gradient analysis of DPO on Janus-Pro, finding near-orthogonal understanding–generation gradients with 11–14 magnitude imbalance driven by visual token count asymmetry, and report that no DPO variant improves generation CLIPScore (); their analysis is confined to preference tuning on a single architecture and does not measure the conflict–trade-off correlation across a controlled population. XTC-Bench (Wang et al., 2026) demonstrates that existing evaluation treats understanding and generation independently and that high scores on both do not imply cross-task consistency; UniEval similarly argues for holistic evaluation of unified models (Li et al., 2025). Wu et al. (2026) study when the two objectives reinforce or compete in controlled native settings and find one objective tends to dominate when both are forced through the same computation path; Su et al. (2026) exploit the understanding–generation inconsistency for post-training; Wei et al. (2025a) study intra- and inter-modal forgetting in continual UMM training. These works characterize the phenomenon or mitigate its downstream symptoms; none validates the diagnostic metric itself.
Multi-task optimization, in detail.
Joint training of multiple tasks predates deep multimodal models (Caruana, 1997) and is surveyed for dense prediction (Vandenhende et al., 2021). Architectural sharing ranges from multi-gate mixture of experts (Ma et al., 2018) to multi-scale task-interaction networks (Vandenhende et al., 2020). On the optimization side, uncertainty-based loss weighting (Kendall et al., 2018) and auxiliary-gradient-magnitude balancing (He et al., 2022) adapt scalar weights; gradient manipulation rescales or projects the vectors themselves: minimum-norm convex combinations (Sener & Koltun, 2018), projection-based gradient surgery and conflict-averse cone constraints (Vandenhende et al., 2021; Liu et al., 2021, see), bargaining-game Nash solutions (Navon et al., 2022), and independent-component alignment that upweights conflict-prone gradient components (Senushkin et al., 2023). Pareto-dominance concepts enter multi-task evaluation from multi-objective optimization (Deb et al., 2002). Our method population spans these families at faithful implementations, so that conflict metrics vary across methods designed precisely to reshape conflict.
Modality imbalance, in detail.
Wang et al. (2020) show that end-to-end multimodal training can underperform unimodal training because the gradient is dominated by the faster-learning modality, and propose gradient modulation to rebalance it; their on-the-fly modulation line continues with generalized-median balancing (Peng et al., 2022) and intra-network modulation (Wei et al., 2025b). Prototypical rebalancing addresses the imbalance at the decision level (Fan et al., 2023), instantaneous probe-and-rebalance methods monitor and correct imbalance during training (Yang et al., 2025), and modality-laziness analyses document when the model ignores one modality entirely (Yang et al., 2026). These works establish that magnitude imbalance between task gradients is real and consequential—the premise our norm-ratio finding refines: in our testbed the imbalance statistic is diagnostic of generation failure rather than of directional conflict, and is null exactly where the field would deploy it.
Audits of benchmark validity, in detail.
Recht et al. (Recht et al., 2019) rebuilt ImageNet and CIFAR-10 test sets and showed that classifier accuracy drops substantially, revealing overfitting to reused evaluation data; follow-up work characterized the remaining mistakes and their distribution (Vasudevan et al., 2022). In metric learning, Musgrave et al. (2020) re-evaluated four years of claimed improvements under a controlled protocol and found the ranking of methods largely unchanged. Methodological reviews in medical imaging trace systematic failures to unvalidated proxies and evaluation practices (Varoquaux & Cheplygina, 2022). Our audit imports this discipline into UMM training diagnostics: the target quantity (the trade-off) is measured without benchmark idiosyncrasy, the predictor family (conflict metrics) is fixed before analysis, and the conclusion is scoped by explicit reliability and power statements.
Appendix B Hyperparameters and Implementation Details
| Base | Large (E5) | |
| Transformer | , 6 blocks, 4 heads, FFN 512 | , 8 blocks, FFN 640 |
| Parameters | 3.2M | 6.7M |
| Optimizer | AdamW (, , wd ) | same |
| Learning rate | , warmup 100, cosine to | same |
| Batch | 64 (mixed tasks) | same |
| Steps | 900 | 1080 |
| Student-forcing cap | 0.400 of samples, max 16/step | same |
| Data ratios | 1:2, 1:1, 2:1 (understanding:generation) | same |
| Seeds | (base), (large) | — |
| Conflict snapshots | every 50 steps, fixed probe batch (32+32) | every 50 |
| Eval checkpoints | 225/450/675/900 | 270/540/810/1080 |
| Held-out sets | 512 questions, 256 descriptions | same |
| Reliability resamples | 5 per final checkpoint | — |
| Hardware | Apple M4 Max; MPS (up to 6 concurrent runs) | same |
| Precision | float32 | float32 |
The vocabulary has 108 tokens: 8 grid symbols, 25 position markers, 25 cell tokens, and 50 text tokens. Descriptions list 6–8 rectangular objects by their cell tokens in randomized order; understanding questions are of three types (cell color lookup, color count over the full scene, color-pair adjacency). The fixed probe batch (seed 1234) and the fixed evaluation sets (seed 777) are identical across all runs; reliability resamples use seeds 5101–5105; the student-forcing rollout generator is seeded per run (training batch rollouts) and per snapshot with a run-independent seed (probe measurements), so probe statistics are comparable across configurations.
Appendix C Method Implementations and Documented Deviations
All methods receive per-group task gradients (embedding, each of 6 blocks, output head) from two independent backward passes and produce the update written into the shared parameters. Method descriptions follow the published algorithms and standard reviews (Vandenhende et al., 2021; Senushkin et al., 2023).
Naive joint. .
Token-normalized weighting. Loss weights normalized to sum to 2, where is the number of answer tokens and the number of generation tokens in the batch; this is the -normalized variant of token balancing used in multimodal joint training.
GradNorm-style adaptive weighting (Vandenhende et al., 2021, see). Loss weights are updated by gradient descent on the rate residual , with reference norms frozen after 100 steps, target rates , using the closed form ; weights are clamped to .
PCGrad-style gradient surgery (Vandenhende et al., 2021; Senushkin et al., 2023, see). When , each task gradient is projected onto the other’s normal plane and the projections are summed; otherwise the naive sum. We use the original form without magnitude renormalization.
CAGrad (Liu et al., 2021). With and radius at : each task’s component orthogonal to is capped at and added to .
MGDA-UB (Sener & Koltun, 2018). The two-task convex weights solve in closed form. Documented deviation: the convex combination is rescaled to the norm of the average gradient. Without this, the update magnitude collapses as gradients anti-align, confounding method comparisons at a fixed step budget; norm restoration is the standard practice in MGDA implementations. Note that restoration does not repair the direction pathology: when one task’s gradient norm dominates, the convex solution still allocates the update to the minority direction; only the magnitude is restored.
SOAP-style preconditioning (Vyas et al., 2025). For 2-D weight matrices, Adam moments (with , , unlike the AdamW runs) are maintained in the eigenbasis of EMA covariances and with basis refresh every 50 steps and bias-corrected moments; 1-D parameters use plain Adam; the update is RMS-normalized per step. Documented deviation: we omit SOAP’s momentum-translation scaling and apply RMS normalization instead, which keeps the learning rate comparable across optimizer families; we refer to this variant as SOAP-style preconditioning throughout.
The -intervention (E3). Per gradient group, the generative gradient is replaced by with ; the intervention is applied before the method combination (with the naive combiner). Every group’s task-gradient cosine scales by up to a norm correction, so the conflict level is monotonically suppressed in ; reproduces the matched E1 configuration exactly.
Appendix D Protocol Details
Teacher/student-forcing mixture. Before step 200 the generation loss is pure teacher forcing on the ground-truth color tokens at the marker anchors; the student-forced share then ramps linearly to 0.400 by step 500 and stays there (capped at 16 of the batch’s generation samples per step). Student-forced rows render colors by sampling from the model at temperature 1.0 (masked to the color alphabet) at the true marker anchors, while the targets remain the ground-truth colors; the rendering loss is computed at the marker positions and the end-of-stream position (Section 3). Probe snapshots use the same mixture with a run-independent generator seed per snapshot, making conflict statistics comparable across configurations.
Measurement alignment. The audit required three correctness invariants, each covered by a unit check in the released code (selfcheck.py): (i) the causal mask in every attention path (full-sequence forwards and KV-cached prefill), verified by exact equality (float64) of cached and full-forward greedy decoding over equal-length batches, the calling convention used by evaluation; (ii) the grid-value-to-color convention, verified by a 500-scene round trip from scene integers to tokens and back; (iii) loss alignment, verified by asserting that the batched rendering loss reproduces a brute-force per-row computation in which color is read at the position of marker and the end-of-stream target at the last color-token position, for rows of differing description lengths inside one padded batch.
Pareto score and frontier. The score is the mean of the two raw accuracies, ; the empirical Pareto frontier is computed on the raw two-dimensional accuracy plane over all E1 configurations at the final checkpoint, and a configuration is Pareto-dominated by another if the latter matches or exceeds it on both axes with one strict inequality (Deb et al., 2002). We deliberately avoid min–max normalization: with a saturating generation axis it would amplify resample noise into the score.
Statistics. Spearman rank correlations (Spearman, 1904); percentile bootstrap confidence intervals with (Efron, 1979) (pairs resampled at the configuration level, clusters resampled at the checkpoint level so that all checkpoints of a run move together); exact -values from the permutation-free normal approximation of the rank correlation under the null; partial Spearman by rank-regressing out the step index. ICC(1,1) from five resamples (Shrout & Fleiss, 1979); attenuation analysis via ; minimum detectable effect from the Fisher- two-sample approximation at , power .
Appendix E Audit Design and Supplementary Experiment Material
| Population (E1) | 7 methods 3 ratios 3 seeds runs |
|---|---|
| Training budget | 900 steps, batch 64, AdamW |
| Conflict snapshots | every 50 steps on a fixed probe batch |
| Checkpoints | steps 225/450/675/900 (fraction of budget 0.25/0.5/0.75/1) |
| Interventions (E3) | , 3 seeds |
| Cross-scale (E5) | , 8 layers, 18 runs |
| Reliability | 5 independent held-out resamples per final checkpoint |
| Metric | 95% CI | 95% CI | partial (ckpt) | ||
| Global cosine | -0.146 | [-0.411, 0.147] | -0.321 | [-0.523, -0.097] | -0.147 |
| Conflict rate | 0.022 | [-0.210, 0.260] | 0.338 | [0.131, 0.537] | 0.124 |
| Conflict magnitude | -0.198 | [-0.463, 0.079] | -0.009 | [-0.266, 0.268] | -0.192 |
| Norm ratio | -0.006 | [-0.264, 0.246] | -0.293 | [-0.507, -0.035] | -0.528 |
| Logged energy statistic | 0.052 | [-0.185, 0.287] | 0.366 | [0.159, 0.559] | 0.178 |
| Depth-weighted cosine | — | — | -0.295 | [-0.535, -0.040] | — |
| Shallow-weighted cosine | — | — | -0.171 | [-0.428, 0.083] | — |
Weighted and per-layer analyses (HA-4). The separately stored, early-concurrent weighted-cosine analysis referenced in E1 gives (with the shallow-weighted variant the exception: , CI [-0.55, -0.01], below the threshold); Table 5 lists the full conflict-metric vector at both analysis levels, Figure 3 shows the signed correlation bars, and Figure 5 the per-layer profile that contextualizes the layer-wise claims.
Training dynamics. Figure 6 documents the two regime facts used in Section 3: the conflict rate stays elevated throughout training while the generation-to-understanding norm ratio decays as the generation objective converges, confining the learning phase as the window in which the field’s premise operates.
Dose–response detail. Figure 7 shows the E3 manipulation check and causal readout summarized in Section 4.4: the effective conflict level follows the dose, the raw level shows co-adaptation, and the downstream Pareto score is flat across doses.
Predictor competition and cross-scale replication. Figure 8 visualizes the checkpoint-level predictor competition summarized in Table 2; Figure 9 shows the per-metric correlations underlying the E5 statement: the directional conflict metrics remain within noise at the larger scale (largest , CI [-0.33, 0.04], against 0.19 at the base scale), and the norm-ratio association persists (, CI [-0.64, -0.20])