InvestorNerd: An Investment and Financial Insights System Based on User Profiles
Abstract
InvestorNerd is a web-based platform (investornerd.org) designed to educate and democratize financial understanding by providing accessible, AI-powered investment and personal finance insights tailored to potential user profiles. The system addresses a key challenge in helping everyday individuals, especially those without formal financial education, make sense of investment options and personal financial decisions. The platform offers three interactive tools:
- 1.
Stock Insights - Allows users to input any Stock, Mutual Fund, or Exchange Traded Fund (ETF) ticker to receive a summary of relevant news sentiment and quantitative metrics.
- 2.
Stock Insights Questionnaire - Builds on stock insights by letting users specify a preferred risk tolerance and sector interest. It returns categorized investment tables based on volatility and sector, sortable by dividend yield, return percentages, and others.
- 3.
General Insights Questionnaire - Provides users with personalized insights based on answers to an age-income-expenditure-savings questionnaire. Outputs include possible actions regarding savings strategies, account types (e.g., Roth IRA, UTMA), and potential loan options (e.g., FHA).
The output is designed to be clear, unbiased, and educational, empowering novice investors with practical insights. This paper details the design, implementation, and evaluation of InvestorNerd, demonstrating how generative AI and open financial data can be integrated to create scalable, insight-rich tools for financial literacy.
Video abstract: https://www.dropbox.com/scl/fi/zc30nznq3vjw0p3az630s/2025-12-07investornerd_abstract.mov?rlkey=aop3tiwp419bdrwc2lpg6plbt&st=6oqdyetp&dl=0
Keywords: financial literacy; large language models; generative AI; question-answering; personal investment; stocks; mutual funds; ETFs
1 Introduction
While financial education has become increasingly accessible through platforms like Investopedia , Ramsey Solutions, and other online financial literacy websites, general financial planning or interpreting investment vehicles (e.g., stocks) remains a complex and fragmented task. Novice public market investors often find a gap between understanding basic investment principles and applying that knowledge to evaluate specific companies or market sectors. Although raw financial data, earnings reports, and news headlines are readily available, synthesizing this information into coherent, actionable insights demands time and expertise.
InvestorNerd addresses this gap by providing real-time insights on Stocks, Mutual Funds, and ETFs in an accessible format. InvestorNerd accesses financial data through YFinance and applies a large language model-based analysis to generate educational overviews regarding investment possibilities.
The platform is designed around three primary use cases:
- 1.
Individual Stock Exploration – Users can search for a stock to review publicly available news and high-level educational summaries that highlight both qualitative and quantitative factors relevant to the company.
- 2.
Sector-Based Discovery – Users can explore one or more sectors (e.g. technology and finance) to view a list of widely tracked companies separated by risk class and then obtain an analysis of one or more individual stocks.
- 3.
Financial Literacy Questionnaire – Users may complete a short questionnaire that, when processed, provides general educational material. These outputs are designed to improve financial literacy, suggest broad areas of consideration, and help users generate ideas for their own independent research.
Unlike tools designed for high-frequency trading, portfolio optimization, or algorithmic stock selection, InvestorNerd is built explicitly to help novice to intermediate investors, students, and individuals who want to understand financial markets. The platform provides overviews of stock performances, risk profiles, and sector trends (e.g., for technology, financial services, and utilities) grounded in both financial metrics and summarized market commentary.
This paper first shows how a user navigates the (live) system, then presents the full-stack implementation of InvestorNerd. That implementation includes its user interface design, backend architecture, large language model prompt engineering strategies, and the use of two external tools: (OpenAI and Perplexity AI).
The contributions of this work are:
- •
A working system at InvestorNerd that can be accessed for free by the general public for informational and educational purposes.
- •
A description of the algorithms, software architecture, prompts, and interface of a system designed to provide accessible content about stock market data and general financial literacy topics.
- •
A comparison with state-of-the-art investment insight tools with respect to functionality, content, and user appreciation.
2 InvestorNerd in Action
InvestorNerd can be accessed at https://www.investornerd.org/. When users open the landing page, as shown in Figure 1, they are prompted to choose between Stock Insights, Stock Insights Questionnaire, or General Insights Questionnaire.
If users have a specific stock in mind and select Stock Insight, they are prompted to enter a stock ticker, along with an optional question related to that stock. Figure 2 illustrates the landing page with Nvidia entered. The user gets the same answer as they would have had when asking for Nvidia from the stock insights questionnaire, i.e. from Figure 3.
If the user selects the Stock Insights Questionnaire, they are prompted to complete a form where they specify their risk tolerance and sectors of interest. Figure 4 shows a completed questionnaire for a user who is willing to take risks and is interested in the Technology sector. Based on these inputs, InvestorNerd generates a spreadsheet (Figure 5a and Figure 5b) containing stocks that have historically met the user’s risk profile and sector preference. Panels Figure 7a and Figure 7b show the resulting spreadsheet tailored to this profile. Figure 8 displays the analysis generated after selecting EA, an aggressive stock. EA was determined an aggressive stock based on how InvestorNerd calculates risk, outlined in 4.3.
If the General Insights Questionnaire is selected, the user is presented with a questionnaire. Figure 9 depicts a completed questionnaire for a user who is young, single, and in debt. InvestorNerd sends the result of this questionnaire to a Perplexity.ai back-end which generates an analysis (please see Figure 10).
For this option, Perplexity is doing most of the work. Our contribution is to design the questionnaire to steer Perplexity to respond appropriately depending on the questionnaire answers.
To illustrate the result of this “steering”, Figure 11 shows another completed questionnaire for a user who is financially well off, approximately 50 years old, and has a family. The corresponding Perplexity AI response is presented in Figure 12. These examples highlight how the questionnaire responses shape the AI’s language and focus.
Stock Insights, Stock Insights Questionnaire, or General Insights
Questionnaire.
containing technology stocks.
across risk levels.
containing communication stocks at all levels of risk.
over all risk categories.
has a family.
3 Related Work
The following are the highest quality and accessible investment information systems that are open to the public or have a free tier that we have found. As of mid-2025, the systems that are closest to InvestorNerd in Functionality are AI Financial Planning, Kavout, You.com, and FinanceWizard.
Kavout
Kavout is an AI-driven investment analytics platform that applies machine learning models to market and fundamental data in order to generate predictive stock rankings, most notably through its proprietary Kai Score. The system emphasizes quantitative pattern recognition and factor-based modeling to forecast stock performance. However, Kavout primarily presents outputs as numerical scores or rankings, offering limited explanation of contributing factors. The platform does not provide conversational interaction, user-specific synthesis, or explicit risk categorization, requiring users to independently interpret model outputs.
You.com
You.com is a general-purpose AI-powered search and question-answering engine that supports conversational queries across a wide range of domains, including finance. For financial queries, the system retrieves and summarizes publicly available information from multiple sources in a natural language format. While this conversational interface improves accessibility, You.com is not specialized for investment analysis. It does not incorporate investor profiling, structured risk assessment, or domain-specific financial modeling, and its responses are not tailored to long-term investment decision-making.
FinanceWizard
FinanceWizard represents a class of consumer-focused AI tools designed to simplify financial concepts through conversational explanations and high-level guidance. The platform emphasizes ease of use and accessibility, often providing brief summaries or recommendations in response to user questions. However, FinanceWizard does not support deep personalization, formal risk modeling, or systematic comparison across risk categories. Its outputs are primarily descriptive rather than analytical, limiting its applicability for investors seeking structured and repeatable decision support.
AI Financial Planning
AI Financial Planning is a GPT-powered conversational tool that addresses general personal finance questions and introductory investment concepts. The platform pairs a natural language interface with a curated directory of third-party financial products, directing users toward external services in response to their queries. While the system supports open-ended dialogue, it does not perform stock analysis, risk profiling, or portfolio modeling. Its outputs consist of general educational responses and product referrals rather than structured investment guidance, and the platform explicitly disclaims the provision of personalized financial or investment advice.
4 Materials and Methods
We first state the principles underlying our design and then explain the implementation.
4.1 Design Principles of InvestorNerd
InvestorNerd makes extensive use of two concepts to support accuracy and adaptability in financial contexts: structured contextual prompting and integration of external retrieval mechanisms.
Structured contextual prompting involves crafting prompts with predefined templates that organize user inputs into fields that the model can interpret unambiguously. In the absence of this technique, a user might type, for example: "Can I invest in tech stocks? I’m 25 and not afraid of risk.". The model would then have to infer context from unstructured prose, risking misinterpretation. With structured contextual prompting, the same request is transformed into an input format such as:
Age: 25
Employment status: Full-time
Risk tolerance: High
Investment focus: Technology sector
Question: Can I invest in tech stocks?
This structured form ensures that the model receives explicit, machine-readable parameters, enabling tailored responses.
InvestorNerd applies this idea by encoding all user inputs (e.g., risk tolerance, investment horizon, and financial constraints) into predefined prompt templates that guide the LLM toward generating structured and relevant responses. These templates explicitly specify financial goals, constraints, and risk parameters. Full prompt templates used by the system are provided in Appendix A.
External retrieval mechanisms pertain to a pipeline that dynamically queries and integrates external data sources into the model’s context at inference time. In our case, the primary source is Yahoo Finance (YFinance), which provides both real-time market data and access to relevant historical datasets. Retrieved information is parsed, summarized, and then queried by the prompt so the LLM can ground its answers in both up-to-date market conditions and a broader financial context.
InvestorNerd adopts a structured approach divided into discrete stages: user input collection, financial data retrieval, contextual prompt assembly, and response generation. This form of prompt chaining between modules helps achieve coherence in system output. In addition, InvestorNerd’s responses are framed as educational summaries rather than advice. These methods allow InvestorNerd (i) to personalize its responses to specific user profiles, (ii) to adapt its response to evolving financial news, and (iii) to make use of authoritative data in a coherent way.
4.2 Implementation
InvestorNerd is built on FastAPI and integrates real-time financial data from Yahoo Finance (yfinance), large language models (ChatGPT or Perplexity), and interactive questionnaire logic to generate financial insights for users. InvestorNerd supports three primary workflows, based on the three choices from the landing page: (1) the Stock Insights for individual stock analysis, (2) the Stock Insights Questionnaire for sector-based investment classification, and (3) the General Insights Questionnaire for general insight generation. For (1) and (2) we use ChatGPT and for (3) we use Perplexity.
All workflows deliver real-time feedback to the user. The responses contain financial summaries, risk classifications, and article links. These responses are parsed from back-end JSON responses and provided as interactive tables or expandable markdown sections.
4.3 General Stock Investing by Sector
In "Stock Insight Questionnaire" mode, InvestorNerd prompts the user to select one or more market sectors (e.g., financials, technology) as well as a risk tolerance level. The front end captures these inputs and submits them to the back end, then the back end invokes a risk classifying function to separate each selected sector’s stocks into risk categories. The information comes from yfinance. This is all shown in Algorithm 1 and Figure 12. Each stock’s risk is computed by taking standard deviation of its daily closing price over roughly the past six months of trading data. Then the stocks are assigned to five risk categories using fixed volatility thresholds: 5 (Very Conservative), 5–10 (Conservative), 10–15 (Moderate), 15–20 (Aggressive), and 20 (Very Aggressive). As shown in the Appendix C the riskiness is ’sticky’ in the sense that risky stocks tend to stay risky and conservative stocks remain conservative. Although not surprising, the numerical results are still interesting.
After InvestorNerd lists the stocks that satisfy the user’s request in the form of a spreadsheet. The user may then choose specific stocks to get an analysis based on real-time data and analysis of the stock as described in Section 4.4 whose workflow is shown in Figure 12 and whose user interface is shown in Figure 5a, Figure 5b, Figure 7a, and Figure 7b.
4.4 Algorithm 3: Single Stock Analysis via GPT and News
Objective: When a user clicks a specific stock, either based on the sector workflow or by directly querying the landing page, InvestorNerd conducts a qualitative analysis via scraped news and yfinance metrics using GPT-4 Turbo. The algorithm is shown in Algorithm 2 whose workflow is shown in Figure 12 and whose user interface is shown in Figure 3 and Figure 8.
4.5 Algorithm: General Insight Workflow via Questionnaire
This choice is aimed at collecting data about a hypothetical individual’s financial profile through a structured form and generating holistic investment insight using Perplexity AI perplexity.ai
The front end presents the users with a questionnaire composed of questions about a hypothetical person’s age group, income, savings, debt status, planning goals, and risk tolerance. As seen earlier, Figure 9 shows one complete example for a young person having few assets. Input values are captured and submitted in JSON format to the back end’s /questionnaire endpoint. Then the back end routes the information to the Perplexity API for analysis as shown in Algorithm 3 whose workflow is shown in Figure 12 and whose result for that same young person is shown in Figure 10.
5 InvestorNerd Compared to Other State-of-the-Art Systems
The assessment of InvestorNerd compared to the state of the art comprises two components:
- 1.
This section presents a multi-dimensional functionality comparison of InvestorNerd with other state-of-the-art systems. The new functionality is our primary contribution.
- 2.
Regarding the functionality that InvestorNerd shares with other financial education systems, namely general financial insight, two sections compare our system with the state of the art. Section 7 provides a Semantic Textual Similarity (STS) evaluation [17] of how closely InvestorNerd recommendations align with the responses generated by other AI financial planning systems.
5.1 Functionality Comparison of InvestorNerd with the State of the Art
State-of-the-art AI financial planning and advisory platforms focus on high-level, goal-driven financial guidance such as retirement planning, budgeting, and asset allocation. While effective for broad financial planning, they do not support individual stock-level exploration, qualitative synthesis of financial news, or explicit breakdowns of risk across multiple dimensions.
InvestorNerd tries to make information about particular financial assets interpretable and includes a risk assessment based on historical data. Our approach does not provide a chat feature. We avoid keeping state about users to protect their privacy. Table 1 summarizes the functionality comparison between InvestorNerd and other state-of-the-art systems. Our main contribution compared to other financial education system is introducing a simple document-based analysis of both individual stocks and sectors of stocks.
| System | Quantitative Stock Analysis | Stock Analysis by Sector | Stock Analysis by Risk | Conversational | General Financial Education |
| AI Financial Planning | ✓ | ||||
| Kavout | ✓ | ||||
| You.com | ✓ | ✓ | |||
| FinanceWizard | ✓ | ✓ | |||
| InvestorNerd | ✓ | ✓ | ✓ | ✓ |
5.2 Stock Classification Tools
To contextualize the stock classification feature of InvestorNerd, Table 2 presents a targeted comparison against state-of-the-art AI-driven investment platforms that perform some form of stock scoring or categorization. Unlike the broader functionality comparison in Table 1, this comparison focuses specifically on whether existing systems support explicit risk-tier classification, investor profiling, and explainable outputs — the dimensions most relevant to our contribution. As the table shows, existing platforms that do classify stocks rely on numerical scores or buy/sell signals rather than named risk categories, and none combine explicit risk classification with investor profiling and explainable outputs in a single system.
| System | Stock Classification | Explicit Risk Categories | Investor Profiling | Fundamental Analysis | Free Tier |
|---|---|---|---|---|---|
| Kavout | ✓ (Kai Score 1–9) | ✓ | ✓ | ||
| Danelfin | ✓ (AI Score 1–10) | ✓ | ✓ | ||
| Seeking Alpha | ✓ (Strong Buy – Strong Sell) | ✓ | ✓ | ||
| Finviz | ✓ (sector/fundamental filters) | ✓ | ✓ | ||
| Yahoo Finance Screener | ✓ (sector/technical filters) | ✓ | ✓ | ||
| InvestorNerd | ✓ (conservative/ moderate/aggressive) | ✓ | ✓ | ✓ | ✓ |
Stock Classification: Whether the platform assigns stocks to categories or scores, and the type of classification used.
Explicit Risk Categories: Whether outputs are labeled using named investor risk tiers (e.g., conservative, aggressive) rather than numerical scores or buy/sell signals.
Investor Profiling: Whether the platform accounts for the individual user’s risk tolerance, investment goals, or time horizon when generating outputs.
Fundamental Analysis: Whether the platform incorporates company financials or quantitative metrics such as volatility, valuation ratios, or ticker-level data.
Free Tier: Whether a usable free version is publicly available.
6 Comparing InvestorNerd to the Certified Financial Planner (CFP) Board’s Seven-Step Financial Planning Process
6.1 Overview
In order to understand the experiment described in this section, the reader should refer to the following primary materials. The Certified Financial Planner (CFP) Board’s Guide to the Seven-Step Financial Planning Process [3] serves as the gold standard against which InvestorNerd is evaluated. Appendix D shows the questionnaire input. Appendix E shows the final report.
The CFP Board’s Guide to the Seven-Step Financial Planning Process (2022) provides a comprehensive, procedure-driven gold standard for delivering personalized financial insight. Using the Miller family case study, a dual-income couple, both age 32, with a daughter, a mortgage, retirement accounts, college savings aspirations, a lake-cabin goal, and significant insurance and estate-planning gaps, the guide illustrates how a CFP professional moves systematically through seven steps: (1) understanding the client’s personal and financial circumstances, (2) identifying and selecting goals, (3) analyzing the current course of action and potential alternatives, (4) developing recommendations, (5) presenting recommendations, (6) implementing recommendations, and (7) monitoring progress and updating the plan.
To evaluate InvestorNerd under conditions comparable to the gold standard, a household profile mirroring the Miller case was entered as closely as the questionnaire permitted. The personal information section captured an age range of 25–34, full-time employment, 35 more years planned in the workforce (matching the Millers’ retirement horizon), W-2 tax status, and a 22–24% federal tax bracket. Annual income was entered as $200,000–$250,000 and annual expenses as $150,000–$200,000, ranges that contain the Millers’ combined income of $230,000 and total annual expenses of $195,500. The optional net worth snapshot was completed with total assets of $250,000–$1,000,000 and total liabilities of $50,000–$250,000, which likewise contain the Millers’ assets of $530,000 and liabilities of $240,000. Debt status was reported as some debt that is manageable, and savings exceeded six months of expenses. Current financial actions included 401(k) contributions, saving in a high-yield savings account, and paying down a mortgage. Selected goals were buying a house, saving for children’s education, saving for retirement, and paying off debt, and selected challenges were uncertainty about how to invest and planning for major expenses. The profile specified a 10+ year time horizon and moderate risk tolerance. Finally, the insurance and estate planning sections were completed with health and disability insurance in place and no estate planning documents. The optional free-text field was left blank so that the output reflects only the structured inputs.
The analysis that follows evaluates InvestorNerd’s output against each of the seven CFP steps, then synthesizes an overall assessment. The output is a General Financial Insight report organized into seven sections: a summary of strengths and gaps, account options, execution principles, milestone-based stages, an estate planning checklist, advanced concepts, and goals with an implementation and monitoring plan, followed by a summary table.
6.2 Step 1: Understanding the Client’s Personal and Financial Circumstances
The first step of the CFP process requires the practitioner to gather both quantitative information (income, assets, liabilities, cash flow, taxes, insurance coverage, retirement balances) and qualitative information (health, life expectancy, values, risk tolerance, goals, family circumstances). In the Miller case, the CFP professional documents exact salaries ($120,000 and $110,000), a $70,000 low-yield savings account partitioned into a $30,000 emergency reserve, $30,000 for the cabin, and $10,000 earmarked for college, combined 401(k) balances of $150,000, a $10,000 taxable investment account, $240,000 in mortgage debt, a 50/50 equity-to-fixed-income allocation, employer-provided life and disability coverage, and an absence of any estate planning documents. Qualitative factors such as the couple’s risk tolerance, their emotional attachment to the lake cabin, Martha’s career promotion prospects, and family longevity differences are also formally assessed.
The InvestorNerd questionnaire asks about employment status and the number of years the respondent plans to keep working, tax situation and bracket, annual income and expense ranges, a net worth snapshot (assets and liabilities in separate ranges), debt status, savings level, current financial actions, goals, challenges, time horizon, risk tolerance, insurance types by category, and estate planning document status. InvestorNerd doesn’t ask for exact numbers to avoid impinging on user privacy. For example, income is recorded as “$200,000–$250,000” and expenses as “$150,000–$200,000” rather than as exact figures, masking the Millers’ $230,000 combined household income and $195,500 in total expenses. The years-to-work question does capture a retirement horizon (35 years, matching the Millers’ timeline to age 67), but the questionnaire does not ask for a target retirement age, health, or family longevity. Debt is categorized as “some debt, manageable” without specifying whether it comprises a mortgage, student loans, or consumer debt. The questionnaire has no mechanism for capturing individual insurance policy terms, existing account balances, current asset allocation, mortgage interest rate, or employer match percentage, all of which the CFP professional treats as foundational inputs. The questionnaire also has no mechanism to capture two separate earners, two separate insurance policies, or per-spouse coverage gaps; while a couple could fill out the tool together, the questionnaire collects no information that would distinguish their individual circumstances, so dual-income dynamics and joint account structures remain invisible to InvestorNerd.
InvestorNerd’s output is transparent about these limitations. The report does not contain a dedicated section listing missing inputs; instead, it acknowledges gaps inline and states its working assumptions. It notes that debt interest rates are unknown and that the retirement savings rate and beneficiary designations were not provided, and it announces that it uses the midpoints of the selected ranges ($225,000 income and $175,000 expenses) to illustrate an annual surplus of roughly $50,000. Several of its action items, such as calculating the actual annual surplus and confirming beneficiaries on existing accounts, return the missing fact-finding to the user, which parallels the CFP professional’s follow-up on incomplete information such as the Millers’ unverified beneficiary designations.
These coarse inputs shape the output in ways that diverge from the case study. The midpoint-based surplus of about $50,000 exceeds the Millers’ actual unallocated cash flow of $34,500 by roughly $15,500. The open-ended “more than 6 months of expenses” answer, combined with the expense range, led the report to infer at least $75,000–$100,000 in short-term reserves and to propose a nine-month reserve target of roughly $135,000–$150,000, whereas the Millers hold $70,000 in total savings, of which they intend to keep $30,000 as an emergency fund. Because debt composition and rates were not captured, the report sorts debt into hypothetical interest tiers and speculates that medium-interest debt likely includes auto or student loans, neither of which the Millers carry. Its guidance on mortgage prepayment is likewise conditioned on an assumed “typical low-to-mid range” rate, whereas the Millers’ rate is high relative to the market, although a later stage of the report does prompt a refinancing review if the rate is above market.
Assessment. The questionnaire captures income and expense ranges, years remaining in the workforce, tax bracket, net worth ranges, insurance categories, and estate planning status as explicit inputs, and the report states the assumptions it makes where inputs are missing. Thus, InvestorNerd replicates the structure of CFP fact-finding without achieving its depth: ranges and missing details propagate into the output as approximations that diverge from the Millers’ actual figures.
6.3 Step 2: Identifying and Selecting Goals
In the CFP case, the practitioner helps the Millers expand an initial list of three goals (cabin, college, retirement) into five prioritized objectives by identifying insurance and estate-planning gaps the clients had not articulated. The final priority order, insurance coverage first, estate plan second, lake cabin third, college funding fourth, and retirement fifth, reflects a deliberate balancing of urgency, impact, and feasibility, with the practitioner explicitly noting the tradeoff between accelerating the cabin timeline and achieving retirement and education targets.
The InvestorNerd questionnaire invites users to self-select goals from a predefined menu. In the proxy profile, selections included home purchase, children’s education, retirement, and debt payoff. Estate planning and insurance adequacy appear within the questionnaire as standalone sections rather than as user-selected goals. The output flags both as gaps in its summary, includes drafting a will, powers of attorney, and a beneficiary review in its 30-day action plan, and places life insurance and estate planning in the second stage of its milestone sequence, ahead of the retirement, home, and education stages. This is consistent with the CFP practitioner’s proactive goal-surfacing behavior, although the ordering is not uniform across the report: its “Right Order of Operations” lists protection last of five steps, and insurance does not appear in the 30-day action list. The “Key Trade-offs” section explicitly addresses the tension between competing goals, namely retirement saving versus an accelerated home purchase and mortgage paydown versus investing. It does not address the tradeoff the CFP case treats as central, education spending versus retirement, because the questionnaire has not captured the type of school or its cost.
The output also converts the selected goals into illustrative dollar targets: a $4,000,000–$5,000,000 retirement portfolio, a $200,000 down payment on an assumed $1,000,000 home to be purchased in 7–10 years, and $100,000–$150,000 of education savings per child. These targets rest on range midpoints and assumptions rather than user inputs, and they differ from the Millers’ stated goals: a $150,000 lake cabin purchased without a mortgage within six years, and four years of elite private university at a current cost of $71,000 per year. The questionnaire also asks for a single time horizon (10+ years was selected), so it cannot represent the six-year cabin deadline or the 17-year horizon to Emily’s college enrollment separately.
Assessment. InvestorNerd correctly identifies the major planning domains and flags insurance and estate planning as near-term concerns, though its sequencing is not consistent across sections and does not match the CFP case’s ordering of insurance first and estate planning second. The output’s explicit treatment of goal tradeoffs, particularly the house-versus-retirement and mortgage-versus-investing tensions, and its conversion of selected goals into dollar targets partially replicate the reasoning that a CFP practitioner applies when helping clients prioritize. However, the tool surfaces only the gaps its structured sections probe, does not engage in the iterative advisor-guided goal-selection process central to Step 2, and, because its goal menu and single time horizon are coarse, substitutes assumed targets for the client’s own.
6.4 Step 3: Analyzing the Current Course of Action and Potential Alternatives
Step 3 requires the CFP professional to assess the advantages and disadvantages of both the client’s status quo and a range of alternative strategies. In the Miller case, the practitioner identifies six advantages of the current course (cash reserves, no credit card debt, steady savings rate, some insurance coverage, home equity, excellent credit) and seven disadvantages (misaligned asset allocation, high mortgage rate, expensive and tax-inefficient mutual funds, college savings in a taxable low-yield account, inadequate insurance, no estate documents, and failure to budget for second-home costs). Ten distinct alternative courses of action are enumerated and analyzed, each with explicit advantages and disadvantages.
The InvestorNerd output pairs a “Strengths” list with a “Risks & Gaps” list, which mirrors the CFP advantages-and-disadvantages format at a coarser grain: four strengths and four gaps, compared with the six and seven in the Miller case. Strengths identified include strong earning power, positive cash flow, an existing foundation of 401(k) contributions, high-yield savings, and mortgage paydown, and liquidity exceeding six months of expenses. Gaps identified include the absence of estate documents, insurance gaps (no life or umbrella liability coverage among the types reported), unstructured investing given the respondent’s uncertainty about how to invest, and major expenses without dollar targets or timelines. The output also evaluates alternatives in explicit pro-and-con form. Its account options section presents four vehicles (employer 401(k), IRA, high-yield savings account, and 529 plan), each with eligibility, tax treatment, pros, cons and watch-outs, and a priority rating for the client. The “Key Trade-offs” section sets out two competing choices, retirement saving versus an accelerated home purchase and mortgage paydown versus investing surplus, each with two sides and a stated recommendation. Its advanced concepts section briefly weighs the benefits and cautions of a backdoor Roth IRA, asset location, and the balance of Roth and Traditional 401(k) contributions. Finally, the summary table pairs each focus area’s current situation with a recommended action and estimated impact. Collectively, these elements move the output substantially closer to a structured current-course analysis.
The output does not, however, perform a formal current-course analysis in the CFP sense. Its strengths and gaps are drawn from categorical questionnaire inputs, so it cannot judge the quality of what the household is already doing. The CFP practitioner determines that the Millers contribute roughly 15.5% of gross income to savings, that their asset allocation is misaligned with their risk tolerance, and that their mortgage rate is high. The output instead sets a target retirement savings rate of 15–20% of gross income, notes that the respondent’s actual rate was not provided, and defers review of asset allocation to later stages of the plan. The mortgage illustrates the point. The output treats it as likely low-interest debt and favors investing over extra principal payments “assuming the mortgage rate is in a typical low-to-mid range,” and it raises refinancing only conditionally, if the rate is significantly above market, without analyzing closing costs or a break-even horizon. The CFP practitioner’s refinancing alternative rests on a fact the questionnaire never collects. Likewise, the high expense ratios and tax inefficiency of the Millers’ taxable mutual funds are not examined, and the Millers’ low-yield savings account cannot be represented because the questionnaire offers a high-yield savings account as its only savings-account option. The proxy profile’s account was therefore entered as high-yield, and the report lists it as a strength rather than identifying its replacement as one of the ten alternatives.
The alternatives the output addresses are also more generic than the CFP practitioner’s. It covers, in general form, a life insurance increase, an estate plan, a 529 plan, allocation targets by goal, and a slower or faster home-purchase timeline (7 versus 10 years, at monthly savings of roughly $2,380 versus $1,670). It names umbrella coverage as a gap and raises refinancing conditionally, as described above. It does not address a disability coverage gap specific to one spouse, purchasing a second home with cash versus a mortgage, or the cost of owning a second home. Nor does it state whether the current course is likely to meet the household’s goals, which is the conclusion the CFP practitioner reaches (a low probability of meeting all targeted goals). The goal-level savings targets it derives are not reconciled with its assumed $50,000 annual surplus.
Assessment. InvestorNerd’s output supplies a structured, if coarse, analogue of the CFP current-course analysis: paired Strengths and Risks & Gaps lists, account options with explicit pros and cons, and side-by-side trade-offs with stated recommendations. These elements distinguish effective behaviors from areas requiring intervention and compare a small set of alternatives. However, because its strengths and gaps rest on categorical inputs, it cannot evaluate the household’s actual contribution rate, allocation, mortgage rate, or account costs. Its alternatives are generic account types and general trade-offs rather than strategies tested against the household’s specific goals, and it does not assess whether the current course is likely to succeed. This remains a meaningful divergence from the CFP gold standard.
6.5 Step 4: Developing the Financial Planning Recommendations
The CFP process requires that each recommendation be grounded in explicit assumptions (life expectancy, inflation rate, tax rate, investment-return projections), a stated basis, a timeline and priority designation, and a specification of whether it is independent or contingent on another action. In the Miller case, twelve numbered recommendations are developed, spanning insurance, estate planning, mortgage refinancing, asset reallocation, 529 plan funding, lake-cabin savings escalation, and retirement maximization. Each recommendation includes the reasoning, the expected benefit, and a concrete disadvantage or tradeoff. The CFP process also performs stress testing and probability analysis under uncontrollable factors (inflation, tax-law changes, Social Security solvency, bear markets).
The InvestorNerd output produces a staged planning framework (Stages 1 through 5), each with an entry condition, a focus, three to four key actions, and an exit condition, together with a tiered Priority Action Plan organized by 30-day, 3–12 month, and 12–24 month horizons. It provides account-specific guidance with cited 2026 IRS limits ($24,500 for 401(k) employee deferrals and $7,500 across IRAs), guidance on Traditional versus Roth contributions framed around the stated 22–24% bracket (with a recommended mix for tax diversification), and a “Right Order of Operations” section that sequences funding priorities. Its retirement recommendation is a savings rate of 15–20% of gross income (approximately $33,750–$45,000 per year), tied to a target portfolio of $4,000,000–$5,000,000 that rests on a stated 3.5–4% withdrawal rate and a 6–7% real return. It also recommends target allocations by goal: 70–80% equities for retirement, 40–60% for the home fund, and 80–100% for education savings, shifting toward conservative holdings as the purchase or enrollment date nears, which parallels the CFP practitioner’s glide path for Emily’s 529 plan. Rather than listing missing inputs in a separate section, the output states its assumptions where they are made (range midpoints, the assumed home price and education cost, and the return and withdrawal rates), which partially replicates the CFP requirement to document the basis and assumptions underlying each recommendation.
Coverage of the CFP practitioner’s twelve recommendations is uneven. Estate planning is the closest match: the output lists a will, financial and medical powers of attorney, a living will, a review of beneficiary designations on all accounts, a revocable trust as a consideration, and guardianship designations, and it directs the user to an estate planning attorney. Life insurance and a 529 plan are also recommended, although without a needs analysis or coverage amount. Umbrella liability coverage is recommended, whereas the CFP practitioner deferred it given the Millers’ net worth ($290,000) and risk profile. The CFP practitioner’s first recommendation, raising property and casualty liability limits, is not addressed, because the questionnaire records only whether a policy category is held, not its limits. Likewise, the questionnaire combines short- and long-term disability coverage in a single option, so the output can say only that disability policies should match income and cannot identify a long-term coverage gap for one spouse. Mortgage refinancing appears only as a conditional review item (Section 6.4), and investment expense-ratio analysis is absent; tax efficiency appears only as an asset-location concept.
Timing and priority are specified, but not consistently. The stages gate progress on completed milestones and so treat the recommendations as sequential, whereas the CFP practitioner concludes that the Millers’ recommendations are independent and assigns each its own timeframe. The output’s own sections also disagree. The “Right Order of Operations” places capturing the 401(k) match second and protection last, while the stages place protection in Stage 2 and the match in Stage 3. The gate to home and education saving (Stage 4) requires 12 consecutive months of retirement saving at 15% of gross income, yet the 3–12 month action plan starts home-fund transfers and 529 contributions within that same window. The dollar amounts are likewise not reconciled. Annual retirement savings are given as $20,000, $20,000–$24,500, $25,000–$30,000, $33,750–$45,000, and $36,000–$45,000 in different sections, and the goal-level targets (retirement at $36,000–$45,000, a home fund of roughly $20,000–$28,600, and education savings of roughly $3,000–$4,800) sum to about $59,000–$78,000 per year, or $4,900–$6,500 per month. This exceeds the output’s assumed $50,000 surplus and sits at or above the top of its own $4,000–$5,000 monthly savings benchmark (the output does not say whether employer match counts toward the retirement figures). The education target of $250–$400 per month also falls well short of the $15,000 per year the CFP practitioner directs to Emily’s 529 plan, a consequence of the lower education cost assumed (Section 6.3).
Assessment. InvestorNerd’s output is explicitly grounded with cited contribution limits, dollar targets with stated return and withdrawal assumptions, goal-specific allocation ranges, a sequenced funding order, and a dated action plan, and its estate planning checklist closely tracks the CFP recommendation. The staged planning framework and time-horizoned action plan are well-organized and actionable. However, the recommendations remain anchored to general heuristics applied to an income band rather than to household-specific modeling. Several protection and mortgage recommendations are absent or conditional because the questionnaire cannot capture policy limits, disability type, or the mortgage rate, and the sequencing and dollar amounts are not consistent across sections. The output does not perform the stress testing and probability analysis that characterize the CFP gold standard.
6.6 Step 5: Presenting the Financial Planning Recommendations
In the CFP process, presentation is an interactive, client-centered activity. The practitioner tailors communication to the clients’ financial sophistication, reviews the balance sheet and cash-flow statement, uses technical reports and graphs, walks through each recommendation individually, addresses the Millers’ questions about bitcoin and meme stocks, explains the tradeoff between prioritizing Emily’s education and earlier retirement, and discloses the compensation the firm will receive. The goal is to ensure informed client understanding and consent before implementation begins.
The InvestorNerd output is a structured report delivered immediately following questionnaire submission. It is organized into seven numbered sections: a summary of strengths and risks; account options, each with eligibility, tax treatment, pros and cons, and a priority rating for the client; execution principles (a “Right Order of Operations,” dos and don’ts, and key trade-offs); a milestone-based sequence of stages; an estate planning checklist; advanced concepts; and goals with a priority action plan and monitoring checkpoints. A summary table follows. The report is clearly written, uses concrete dollar figures throughout, and is accessible to a financially literate but non-expert reader. Because the respondent reported uncertainty about how to invest, the account options and advanced concepts sections explain each vehicle and strategy in plain terms, which is a form of tailoring, although it is driven by a single questionnaire answer rather than by observing the client. The report also shows its arithmetic, stating that it works from range midpoints and computing the monthly savings needed for each goal, which parallels the CFP practitioner’s explanation of assumptions and calculations. The summary table presenting current situation, recommended action, and estimated impact side by side is a useful presentational device.
The report does not, however, engage in dialogue, cannot clarify misunderstandings, and does not verify that the user has understood the assumptions underlying each recommendation. The questionnaire’s optional free-text field invites the respondent’s questions, but it is a single input rather than a conversation, and it was left blank in this experiment, so the report answers no user questions of the kind the Millers raise. The report also contains no charts or projections of how the household’s assets might change over time and no estimate of the probability that the plan meets the household’s goals, both of which the CFP practitioner presents. The “Estimated Impact” column of its summary table is largely qualitative; only the retirement row gives a figure, a portfolio potentially in the $4,000,000–$5,000,000 range. With respect to disclosure, the questionnaire page carries a disclaimer that the tool is exploratory, informational only, and intended to support a conversation with a registered financial advisor, and the report notes that a CFP can help refine the savings amounts, asset allocation, and tax strategies. Neither discloses compensation or conflicts of interest, nor provides regulatory documents comparable to the Form ADV and Form CRS the CFP practitioner delivers. The presentation is fundamentally one-directional.
Assessment. The InvestorNerd output’s presentation format is well-organized, readable, comprehensive, and actionable. The breadth and structure of the report, spanning account explainers, a milestone-based stage path, an estate planning checklist, tradeoff analysis, monitoring checkpoints, and a summary table, represent substantial presentational depth for an automated tool. The disclaimer frames the tool as a complement to a conversation with an advisor rather than a replacement for one. Nonetheless, the interactive, consent-driven, and disclosure-compliant presentation required by the CFP Practice Standards is not replicable by a static AI-generated report.
6.7 Step 6: Implementing the Financial Planning Recommendations
The CFP process assigns specific implementation responsibilities to both the advisor and the client, organized along a defined timeline (within one month, within three months, within six months, within nine months). The practitioner introduces the Millers to a vetted life insurance agent and estate-planning attorney, reviews mortgage quotes, helps one spouse obtain long-term disability coverage, confirms that 401(k) reallocations and beneficiary updates have been completed, and schedules follow-up meetings to address any unimplemented items.
The InvestorNerd output includes a Priority Action Plan with three explicit time horizons (next 30 days, next 3–12 months, and 12–24 months), each containing three specific action items. The 30-day actions, calculate the actual annual surplus, set numeric targets and timelines for the retirement, home, and education goals, and begin basic estate planning while confirming beneficiaries on the 401(k) and savings account, are appropriately concrete. The 3–12 month actions raise 401(k) contributions to at least $25,000–$30,000 per year, set up automatic monthly transfers of roughly $1,700–$2,400 to a home down payment fund, and open and fund a 529 plan with an initial automatic contribution of $250–$400 per month. The 12–24 month actions review asset allocation across accounts, reassess debt structure and repayment progress, and execute the estate documents and communicate key roles (power of attorney, healthcare proxy, executor) to the individuals involved. The plan specifies dollar amounts and automates transfers, which parallels the CFP practitioner’s implementation plan (for example, the Millers’ increase in savings to $1,666.67 per month). Taken together, the monthly transfers in the 3–12 month plan total roughly $4,050–$5,300, which overlaps the report’s own monthly benchmark of $4,000–$5,000, although its 401(k) amount is lower than the retirement target in its goals subsection (Section 6.5). The milestone-based stages add implementation detail of their own: each lists three to four key actions and an exit condition, such as engaging an estate planning attorney or a reputable online platform, considering term life insurance sized to income and liabilities, and setting up automatic IRA contributions of $625 per month.
Coverage and timing diverge from the CFP plan. The CFP practitioner schedules within one month the actions that protect the household from large losses: raising property and casualty liability limits, increasing life insurance, and refinancing the mortgage. None of these appears in InvestorNerd’s action plan. Assessing life insurance needs and reviewing mortgage terms appear only in Stage 2, and insurance adequacy is revisited in the annual review described in Section 6.8. Estate planning is also slower: the CFP practitioner targets one to three months, whereas the action plan begins it within 30 days but schedules execution of the documents for months 12–24. This conflicts with the report’s own stages, since Stage 3, which includes raising 401(k) contributions, is entered only after basic estate documents and appropriate life insurance are in place, yet the action plan schedules the 401(k) increase for months 3–12.
InvestorNerd does not assign responsibilities. Every action is addressed to the user, and the report does not divide tasks among the user, an advisor, and other professionals. It names the professional to engage in one case (an estate planning attorney), but it does not vet or introduce an attorney, insurance agent, or mortgage professional. It also stays at the level of account types, such as a 529 plan or term coverage, rather than selecting a specific plan, provider, or fund lineup, which the CFP practitioner does when identifying a high-yield account and recommending a 529 plan. Confirmation of completion is self-directed: the stage exit conditions (for example, 12 consecutive months of saving at least 15% of gross income) and the annual, event-driven, and monthly checkpoints give the user criteria to check against, but no one verifies them, and nothing corresponds to the CFP practitioner’s six- and nine-month meetings to address recommendations that were not implemented.
Assessment. The InvestorNerd output regarding implementation is concrete, with dollar amounts, automated transfers, and dated horizons, and its stage exit conditions and monitoring checkpoints give the user a self-directed way to track progress. However, its sequencing is not fully consistent with its own stages, and it omits insurance and mortgage actions from the near-term plan. It functions as a detailed educational resource that informs the user what to do and in what order. By contrast, the CFP process is a coordinated engagement in which the advisor actively manages implementation and accountability. This human-rich interactive element remains a fundamental distinguishing advantage of the CFP process.
6.8 Step 7: Monitoring Progress and Updating
The final CFP step establishes ongoing monitoring and updating obligations. The practitioner conducts periodic reviews of asset allocation, investment performance, and insurance adequacy; obtains updated qualitative and quantitative information at each meeting; and revises recommendations when life events, market conditions, or goal changes require it.
The InvestorNerd output includes a “Monitoring Checkpoints” subsection within its goals and implementation section. It specifies an annual review of four items: the savings rate (checked against a target share of gross income, for example 15–20% for retirement, or $33,750–$45,000 per year); debt progress (balances and rates, including a check that any debt above 10% interest has been eliminated or substantially reduced); insurance adequacy (life, disability, health, and liability coverage in light of changes in income, dependents, and assets); and net worth and tax position (an annual net worth calculation and a review of the balance of Roth and Traditional contributions and of itemized deductions). It also lists trigger events that should prompt an immediate review: marriage, divorce, or the birth or adoption of a child, which it ties to updates to estate documents, beneficiary designations, and insurance; a change in income of more than roughly 20% from current levels, such as a promotion, job loss, or business start; and a home purchase or major relocation, which it ties to the debt profile, cash needs, and insurance requirements. Finally, it proposes a monthly benchmark: total monthly savings across 401(k), IRA, high-yield savings goal accounts, and 529 contributions, compared against the planned level (for example, $4,000–$5,000 per month). The savings-rate check and the 20% income trigger are quantified, which gives the user concrete criteria; the CFP guide specifies only that the practitioner checks in at appropriate intervals.
The framework covers less ground than the CFP practitioner’s monitoring duties in several respects. The annual review does not include asset allocation or investment performance, which the CFP engagement letter makes a periodic review item; allocation appears in the output only as a one-time review in months 12–24 of the action plan and in Stage 5. The annual review also omits emergency fund adequacy and beneficiary designations, the latter appearing only as an update following a life event. The trigger events do not include changes in the household’s goals or in market conditions, both of which prompt the CFP practitioner to revise the plan. The milestone stages described in Section 6.7 add exit conditions that the user can check against, but no one verifies them. There is no mechanism within InvestorNerd for tracking progress toward goals over time, scheduling follow-up sessions, or updating recommendations as circumstances evolve. The closest the report comes to an updating process is its closing note that a CFP can help refine the savings amounts, asset allocation, and tax strategies as income, family, and housing circumstances change, which hands the updating function back to a human professional. The monitoring guidance is best understood as a framework that a motivated user could apply independently.
Assessment. InvestorNerd includes an explicit and quantified monitoring framework with annual review criteria, a monthly benchmark metric, and trigger-event guidance that links each event to the plan components it affects. It is narrower than the CFP practitioner’s review, however, omitting recurring review of asset allocation and investment performance as well as goal and market-driven updates. Step 7 also remains structurally absent from InvestorNerd’s design in the sense that the tool itself performs no monitoring. This is an inherent limitation of a single-session, questionnaire-based tool rather than a deficiency in the quality of the guidance it provides.
7 Comparative Semantic Similarity Evaluation of State-of-the-Art System Responses
Different financial education tools often produce answers that vary in tone and style: some are highly encouraging and conversational, while others are more formal and purely informational. To move beyond these superficial differences and quantify how closely the underlying recommendations align with the CFP guidelines, we evaluated the General Insight responses of InvestorNerd and sister tools against the Miller Case Study using a claim-level Semantic Textual Similarity (STS) procedure. All systems were given the same input information describing the Miller family’s financial situation and goals. InvestorNerd’s response can be found in Appendix E.
Claim-level methodology.
A naïve approach would encode each system’s entire response and the entire gold standard as single embedding vectors and compute one document-level cosine similarity. We found this unsuitable for our setting: document-level embeddings reward responses that share vocabulary and topical breadth with the gold standard while washing out whether each specific recommendation was actually made. A response that addresses three of ten CFP recommendations can score higher than one that succinctly addresses eight. We therefore adopt a claim-level formulation inspired by atomic-fact decomposition methods for evaluating long-form generation [12].
We first decompose the CFP gold-standard response into atomic recommendations , where each is a single, self-contained piece of advice (e.g., “Start a 529 savings plan to invest for Emily’s college education”). The Miller gold standard yields such claims. Each system response is segmented into sentences after stripping formatting markup and discarding fragments (e.g., section headers) too short to carry a recommendation.
We encode each claim and each response sentence using
dmlls/all-mpnet-base-v2-negation [7], a sentence-transformer fine-tuned for semantic similarity with additional training on negated sentence pairs. The negation-aware training is important in a financial context: statements such as “this strategy is appropriate for your situation” and “this strategy is not appropriate for your situation” share nearly all surface words while carrying opposite meanings, and standard similarity models tend to assign such pairs high similarity. Denoting the resulting embeddings and , we record for each gold claim the similarity of its best-matching sentence in the response:
| (1) |
and define the system’s STS recall as the mean over all gold claims:
| (2) |
Intuitively, measures the extent to which each expert recommendation is semantically addressed somewhere in the system’s response, independent of the response’s length, ordering, tone, or formatting. A score near 1 indicates that every CFP recommendation has a close semantic counterpart in the response; scores decrease as recommendations go unaddressed or are contradicted.
| System | STS Recall |
|---|---|
| InvestorNerd | 0.623 |
| You.com | 0.594 |
| Finance Wizard | 0.569 |
| AI Financial Planning | 0.530 |
| Kavout | 0.421 |
Table 3 reports the results. InvestorNerd, You.com, and Finance Wizard form a closely grouped top cluster (0.57–0.60), indicating broadly comparable semantic coverage of the CFP recommendations; differences of this magnitude at the top of the range should be interpreted as approximate parity rather than a strict ranking. AI Financial Planning scores moderately lower, reflecting a response that establishes a sound planning framework but leaves several specific recommendations (e.g., estate planning documents, emergency fund yield) unaddressed. Kavout scores markedly lower than all other systems: its response consists primarily of individual stock recommendations, addressing the family’s planning needs only in a brief closing note. The claim-level metric correctly identifies this as a substantive divergence from the expert guidance rather than a difference in tone or verbosity.
CFP Standard Theme InvestorNerd AI Fin. Planning Kavout You.com Finance Wizard Emergency fund (enhance yield) – Refinance / mortgage strategy ✓ ✓ – – Retirement accounts (401k / IRA) ✓ ✓ ✓ ✓ Tax optimization ✓ – – ✓ ✓ Portfolio diversification / allocation ✓ ✓ ✓ ✓ Life insurance (increase coverage) ✓ ✓ – ✓ ✓ Long-term disability insurance ✓ ✓ – ✓ ✓ Property & casualty / umbrella insurance ✓ ✓ – ✓ – Estate planning (will, POA) ✓ – – – ✓ College savings (529) ✓ ✓ ✓ Lake cabin (finance, don’t delay/cash) ✓ – – – Goal prioritization & funding sequence ✓ ✓ – ✓ ✓ Ongoing review & monitoring ✓ ✓ – ✓ ✓ Aligned with CFP (of 13) 11 10 0 9 9 Aligned or partially aligned 13 11 3 11 12
8 Synthesis and Overall Assessment
The comparison reveals a consistent pattern: InvestorNerd is directionally aligned with the CFP gold standard across most financial planning domains and has narrowed the gap observed in prior evaluations in several meaningful ways. It is not, however, equivalent to a full CFP-style planning engagement in depth, personalization, or procedural rigor. Three dimensions capture the nature of the remaining gap.
Personalization.
The CFP process derives every recommendation from the household’s exact facts. InvestorNerd, constrained by categorical questionnaire inputs, substitutes general heuristics, standard contribution limits, range midpoints, and assumed investment returns and withdrawal rates, for household-specific modeling. The questionnaire captures several important categories of information, including income and expense ranges, years remaining in the workforce, tax bracket, net worth ranges by asset and liability type, insurance types, and estate planning status, and the tool uses these inputs visibly in its output (for example, the Roth versus Traditional recommendation is explicitly conditioned on the stated 22–24% bracket). Nevertheless, the practical effect of range rather than exact inputs is that monthly contribution targets and projected outcomes remain rough approximations. The midpoint-based annual surplus of $50,000, for example, exceeds the Millers’ actual unallocated cash flow of $34,500, and the goal-level savings targets the output derives sum to more than that surplus (Section 6.5). For households whose financial situations deviate meaningfully from assumed averages, households with high mortgage balances, tax-inefficient legacy investments, atypical insurance gaps, or dual-income dynamics, the degree of approximation error increases.
Coverage.
InvestorNerd’s strongest matches are in areas that its questionnaire explicitly captures and that its output addresses with concrete guidance: the estate planning document checklist (will, powers of attorney, healthcare directive, beneficiary review, and guardianship), life insurance, a 529 plan for education savings, retirement account funding, goal-specific asset allocation ranges, and a staged implementation timeline with a monitoring framework. The most significant remaining coverage gaps are property and casualty liability limits and a long-term disability gap for one spouse (the questionnaire records only whether a policy category is held, and combines short- and long-term disability in a single option); mortgage refinancing, which appears only as a conditional review item because the mortgage rate was not captured; investment expense-ratio and tax-efficiency analysis of existing accounts; and the sequencing of retirement contributions around the college funding goal. Whether a more detailed questionnaire would close these gaps was not tested in this experiment.
Process versus Product.
The most fundamental distinction remains structural. The CFP process is a dynamic, iterative engagement in which the advisor and client co-create goals, the advisor surfaces latent risks, implementation is coordinated with professional referrals, and the plan is updated as life evolves. InvestorNerd produces a well-organized, actionable planning product but does not replicate the process that gives rise to a CFP-standard plan. Goal selection (Step 2), interactive presentation (Step 5), coordinated implementation (Step 6), and ongoing monitoring (Step 7) are either absent or abbreviated in InvestorNerd’s design, though the milestone-based stages, the tiered action plan, and a monitoring framework partly replicate the process dimensions of the gold standard. The static report also has no counterpart to the CFP practitioner’s quantitative review and reconciliation: its sections sometimes disagree on sequencing and dollar amounts (Sections 6.5 and 6.7), and it performs no stress testing or probability analysis of its recommendations.
9 Conclusions
InvestorNerd is an expertise-based tool that examines the financial news literature as well as quantitative information about companies to educate beginner and intermediate stock market investors regarding stocks in different sectors (e.g. financials, tech) and different risk levels. As far as we can tell, InvestorNerd is unique in this regard.
In addition to offering functionality that other systems do not, InvestorNerd gives general information about financial planning depending on the answers to an 18-question questionnaire. Two experiments suggest that the system gives educational results that are of similar quality to state-of-the-art financial insight systems, but of somewhat greater depth. In other words, InvestorNerd was, well, nerdy.
The main limitation of InvestorNerd is that there is information that cannot be gleaned from the literature. For example, is the management of a particular company good? Are company officers causing the company to buy stock back in order to increase the price and therefore the cashout value of their options? Sophisticated investors will be sensitive to these nuances, but our target audience consists primarily of novice to intermediate investors. That said, InvestorNerd might serve as an initial filter for sophisticated investors as well.
Conceptualization, D.S. and J.C.; formal analysis, J.C., R.G., and X.W.; investigation, J.C., R.G., and X.W.; methodology, J.C., R.G., X.W., and H.K.; software, J.C., R.G., X.W., and H.K; supervision, D.S.; validation, R.G. and J.C.; visualization, J.C., R.G., and X.W.; writing—original draft preparation, D.S., J.C., R.G., and X.W.; writing—review and editing, D.S., J.C., R.G., and X.W.. All authors have read and agreed to the published version of the manuscript.
This work was partly supported by NYU Wireless
Based on 45 CFR 46 of the United States Department of Health and Human Services exemption 46.104 (https://www.ecfr.gov/current/title-45/subtitle-A/subchapter-A/part-46/subpart-A/section-46.104) Our surveys did not retain user names satisfying point (i). Further the surveys consisted of anonymous evaluations of various systems so ”would not reasonably place the subjects at risk of criminal or civil liability or be damaging to the subjects’ financial standing, employability, educational advancement, or reputation” The study involved a non-interventional questionnaire, and informed consent and anonymity were strictly maintained. Thus, the study falls under the category of research that does not require formal ethics committee approval.
The data presented in this study are openly available in the InvestorNerd repository at https://github.com/johncast14/InvestorNerd.git.
We thank Shela Wu for her many helpful suggestions.
The authors declare no conflicts of interest. The funders had no role in the design of the study; in the collection, analyses, or interpretation of data; in the writing of the manuscript; or in the decision to publish the results.
References
- [1] (2026) Yfinance: download market data from yahoo! finance’s api. Note: GitHub repositoryAccessed 2026-02-04 External Links: Link
- [2] (2026) Candlestick: ai-powered stock picks. Note: WebsiteAccessed 2026-02-04 External Links: Link
- [3] (2022) Guide to the 7-step financial planning process: a case study illustration for solo practitioners. Technical report Certified Financial Planner Board of Standards, Inc., 1425 K St NW #800, Washington, DC 20005. Note: Accessed 2026-02-04 External Links: Link Cited by: §6.1.
- [4] (2026) Danelfin: ai stock picker. Note: WebsiteAccessed 2026-02-04 External Links: Link
- [5] (2017) Robust permutation tests for correlation and regression coefficients. Journal of the American Statistical Association. External Links: Document, Link
- [6] (1996) Bootstrap confidence intervals. Statistical Science. External Links: Link
- [7] (2026) Dmlls/all-mpnet-base-v2-negation. Note: Hugging Face model cardAccessed 2026-02-04 External Links: Link Cited by: §7.
- [8] (2025) Large language models in equity markets: applications, techniques, and insights. Note: Preprint / online manuscriptAccessed 2026-02-04 External Links: Link
- [9] (2026) Kavout. Note: WebsiteAccessed 2026-02-04 External Links: Link
- [10] (2025) Integrating large language models in financial investments and market analysis: a survey. External Links: 2507.01990, Link
- [11] (2016) Semantic textual similarity methods, tools, and applications: a survey. Computacion y Sistemas 20 (1), pp. 647–665. External Links: Document
- [12] (2023) FActScore: fine-grained atomic evaluation of factual precision in long form text generation. External Links: 2305.14251, Link Cited by: §7.
- [13] (2015) Better summarization evaluation with word embeddings for rouge. External Links: 1508.06034, Link
- [14] (2026) AI financial planning. Note: Custom GPT on ChatGPTAccessed 2026-02-04 External Links: Link
- [15] (2026) Finance wizard. Note: Custom GPT on ChatGPTAccessed 2026-02-04 External Links: Link
- [16] (2026) Perplexity api platform overview. Note: DocumentationAccessed 2026-02-04 External Links: Link
- [17] (2019) Sentence-bert: sentence embeddings using siamese bert-networks. Association for Computational Linguistics. External Links: Link Cited by: item 2.
- [18] (2026) Seeking alpha: stock market research and analysis. Note: WebsiteAccessed 2026-02-04 External Links: Link
- [19] (2010) Statistics is easy! second edition. Morgan & Claypool. Cited by: Figure 12, §C.0.2.
- [20] (2026) Simply wall st: visual stock analysis. Note: WebsiteAccessed 2026-02-04 External Links: Link
- [21] (2020) MPNet: masked and permuted pre-training for language understanding. External Links: 2004.09297, Link
- [22] (2026) Toggle ai: institutional-grade market intelligence. Note: WebsiteAccessed 2026-02-04 External Links: Link
- [23] (2015) Learning similarity with cosine similarity ensemble. Information Sciences 307, pp. 39–52. External Links: ISSN 0020-0255, Document, Link
- [24] (2026) You.com. Note: WebsiteAccessed 2026-02-04 External Links: Link
- [25] (2025) A method for semantic textual similarity on long texts. Note: Accessed 2026-02-04 External Links: Link
- [26] (2020) BERTScore: evaluating text generation with bert. External Links: 1904.09675, Link
Appendix A LLM Prompt
A.1 General Financial Insight Prompt
Functionality Overview:
- –
One prompt generates personalized financial planning advice when the user chooses the money management primer path. The system returns a structured action plan based on user goals, income, risk tolerance, and retirement horizon.
- *
The General Insight LLM evaluates the user’s financial position and produces targeted, risk-adjusted investment strategies, debt management guidance, and tax-efficient account recommendations.
- *
Input Variables:
- –
question (str): A free-text financial query from the user (e.g., ”How should I plan for early retirement?”)
Output Variables:
- –
insight_response (str): A customized financial plan addressing the question, presented in structured bullet-point format.
LLM Settings—General Financial Insight:
- –
gpt-4-turbo
- –
Prompt Strategy: few-shot learning
- –
temperature = 0.5
- –
top_p = 1
Prompt—General Financial Insight:
A.2 Trend and Risk Evaluation Prompt
Functionality Overview:
- –
One prompt interprets financial ratios and volatility metrics to assess an asset’s overall trend direction (e.g., increasing or stable) and risk level (e.g., moderate or high).
- *
The Trend & Risk LLM uses GPT-4 to evaluate parameters such as beta, P/E ratio, debt-to-equity, and recent price movement to assign both trend and risk categories.
- *
Input Variables:
- –
data (str): A text representation of financial metadata extracted from the asset’s yFinance profile, including volatility, beta, P/E, and debt ratios.
Output Variables:
- –
trend_risk (str): A concise paragraph summarizing both the price trend and risk classification.
LLM Settings—Trend & Risk Evaluation:
- –
gpt-4-turbo
- –
Prompt Strategy: few-shot learning
- –
temperature = 0.2
- –
top_p = 0.5
Prompt—Trend & Risk Evaluation:
A.3 Article-Based Stock Analysis Prompt
Functionality Overview:
- –
One prompt synthesizes recent financial news about a stock, mutual fund, or ETF to assess sentiment and extract relevant investment signals. It uses scraped articles to provide a market overview and highlight performance drivers.
- *
The Article Synthesis LLM combines multiple sources into a coherent response, identifying both positive and negative trends such as earnings growth, volatility, competition, and regulatory risk.
- *
Input Variables:
- –
articles (list): A list of dictionaries, each containing a scraped news article’s title, URL, and paragraph content.
- –
question (str): A user-submitted question related to a specific asset, or a default system prompt if none is provided.
Output Variables:
- –
stock_analysis (str): A structured response summarizing financial sentiment, performance drivers, and risk factors.
LLM Settings—Article Synthesis:
- –
gpt-4-turbo
- –
Prompt Strategy: few-shot learning
- –
temperature = 0.5
- –
top_p = 1
Prompt—Article Synthesis:
Appendix B Backend Implementation
The backend is implemented using FastAPI and exposes two primary POST endpoints: /query and /questionnaire, each responsible for handling different branches of the user workflow.
The /query endpoint is used to generate both general financial insight and single-stock analysis, and always invokes the run_program() function. Within run_program(), conditional logic determines which analyses are executed. If the symbol field (denoted as ticker_sym in the code) is not equal to ’none’, the system retrieves quantitative stock metrics and recent news using yfinance and invokes GPT-4 to generate qualitative stock summaries, trend assessments, and risk interpretations. If the questionGeneral field (denoted as user_question_general) is not equal to ’none’, the system calls general_insights(), which formats the user’s questionnaire responses into a structured prompt and queries the Perplexity API (sonar-pro model) for structured general financial insight. Both branches may be executed within the same request, enabling combined general and stock-level analysis.
The /questionnaire endpoint supports questionnaire-driven workflows, including the Stock Insights Questionnaire. When the user provides both a risk tolerance and one or more selected sectors, the endpoint invokes the classify_risk_sector() function. This function first retrieves the top 50 companies for each selected sector using the yfinance sector API and downloads six months of historical daily price data. For each ticker, the system computes historical volatility, recent price change, dividend yield, return on capital, and earnings yield, and derives a combined Magic Formula rank based on return-on-capital and earnings-yield rankings.
Each stock is assigned to one of five volatility-based risk categories—Very Conservative, Conservative, Moderate, Aggressive, or Very Aggressive—according to fixed volatility thresholds. The results are returned as a structured dictionary mapping risk categories to lists of qualifying stocks along with their associated metrics. If the user submits the Stock Insights Questionnaire without specifying both a risk tolerance and at least one sector, the back end returns the form payload without generating sector-level stock tables; in practice, the Stock Insights workflow assumes that users select at least one sector in order to receive categorized stock results.
B.1 General Insight Generation via Perplexity
When users select the General Insight workflow or submit a query under mode=both, the back end routes the request through the /query endpoint. If the submitted payload contains a non-empty questionGeneral field, the back end invokes the general_insights() function. This function synthesizes a structured prompt by concatenating the user’s responses to the financial questionnaire—age group, employment status, debt, savings, investment goals, risk tolerance, and planning challenges—using labeled text formatting. If the user has not entered a specific financial query, a default fallback question (“Please give me general insight.”) is inserted automatically. The fully composed prompt is passed to the Perplexity API, using the Sonar-Pro model.
The system prompt instructs Perplexity to return structured strategic financial insights with the following format: Key Findings, Action Options, Cost/Benefit Analysis, Strategic Considerations, and a list of Reference URLs. The model response is parsed as plain text and split into these constituent blocks using hardcoded section headers. The parsed insight is returned to the front end in JSON format under the insightText and insightUrls fields.
When running in mode=both, the system combines the Perplexity-generated general insight with the stock evaluations and then shows them together on the summary page. This pathway tries to ensure that user context is faithfully encoded into the LLM prompt, and that the output remains structured and interpretable by both the front end and end user.
B.2 Sector-Level Investment Classification
When the user selects the Stock Insight workflow, the front end sends their selected sectors and risk tolerance to the /questionnaire endpoint. The back end calls the classify_risk_sector() function, which matches the user’s risk preference to specific volatility categories. Choosing safeAssets means the user is limited to conservative options (very conservative, conservative and moderate). Selecting riskyAssets gives the user only higher-volatility choices (moderate, aggressive, and very aggresive). If the user selects both, the system considers the full range of categories.
For each selected sector, the function pulls a list of companies using the predefined sector_to_companies dictionary.
Then, for each ticker, it retrieves 6-month historical price data via the yfinance API and computes three metrics: historical volatility (standard deviation of percentage price changes), overall price change, and dividend yield.
Volatility values are then used to assign each company into one of five discrete risk categories: Very Conservative, Conservative, Moderate, Aggressive, or Very Aggressive, based on hardcoded threshold values. These buckets allow the system to match individual stocks to the user’s stated risk preference. The output for each sector is a dictionary mapping risk categories to lists of qualifying stock tickers. These results are combined across all sectors and returned to the front end as a JSON object. The front end renders this as a spreadsheet-style interactive table, with each ticker linked to the single-stock analysis view. This pathway forms the core of Algorithm 1 and enables targeted investment exploration based on both user intent and historical price dynamics.
B.3 Single Stock Evaluation via GPT
When a user inputs a specific stock ticker or clicks a company name from the sector spreadsheet interface, the front end triggers a POST request to the /query endpoint with the symbol field populated. The back end then executes the run_program() function, which handles stock-specific data aggregation and GPT-powered synthesis. First, it uses yfinance to fetch the historical price data for the past six months. It then runs get_price_change_volatility_dividend(), which calculates the asset’s price change percentage, historical volatility (standard deviation of returns), and average dividend yield. These metrics are formatted as a string and later analyzed by GPT.
Next, fetch_yfinance_urls() extracts recent news article URLs from the ticker’s news metadata. These links are parsed by scrape_urls_content(), which uses BeautifulSoup to extract and truncate article content to manageable input size. The resulting corpus is passed to article_output_synthesis(), which sends a prompt to OpenAI’s gpt-4-turbo model to summarize news themes and respond to the user’s original stock-related question. Separately, the numerical stock metrics string is fed to determine_trend_and_risk(), which prompts GPT-4 to assess recent performance and implied volatility in qualitative terms.
The outputs of both GPT prompts are concatenated to form a comprehensive stock analysis, which is returned to the front end along with a dictionary of referenced article titles and URLs. The final result is provided in the summary page. This pathway constitutes Algorithm 3 and enables qualitative interpretation of financial signals and news narratives for any stock ticker.
B.4 PDF Report Generation
InvestorNerd provides built-in PDF export functionality that allows users to download summaries of their financial insights and stock classifications. This feature is implemented entirely on the front end using the jsPDF and autotable JavaScript libraries. In summary_page.html, a button labeled “Download PDF” triggers a function that initializes a new jsPDF document, injects section headers such as General Insight, Trend and Risk, and News Summary, and appends the corresponding textual content retrieved from sessionStorage (keys like insightText and insightUrls). The PDF is then automatically downloaded with a timestamped filename.
In spreadSheet.html, a similar export workflow is implemented for sector classification results. When the user clicks the “Download PDF” button, the front end parses the hierarchical risk-bucketed dictionary of classified stocks from sessionStorage, formats the content into a tabular structure grouped by sector and risk level, and uses autotable to render the content in the PDF. Each ticker symbol, sector name, and classification label is included in the final document. The PDF files are generated entirely client-side, without additional back end processing, ensuring fast and private data handling. This feature supports both single-mode (sector or insight) and combined workflows, enabling users to export all relevant findings in a consolidated offline format.
Appendix C Quantitative Risk Evaluation
The data-driven evaluation measures how well the volatility-based classifications of InvestorNerd in one six-month period correlate with the volatility of the same stocks in the following six-month period. Intuitively, low risk companies should continue to be low risk (and often low reward) and conversely for high risk companies. That is in fact what we find.
C.0.1 Data Setup
For each six-month categorization period , InvestorNerd assigns stocks to one of five risk categories based on their observed historical volatility, computed as the standard deviation of daily closing prices over the preceding six months. Here, denotes the historical return volatility, which is computed as the standard deviation of daily percentage return for each stock over the preceding six-month window. The volatility thresholds are fixed and consistent across all periods: Very Conservative (), Conservative (), Moderate (), Aggressive (), and Very Aggressive (), as implemented in the InvestorNerd classification engine.
Figure 5 visualizes this categorization by plotting, for each risk group, the average volatility of all stocks assigned to that group during period . Each bar therefore represents an aggregate volatility level produced by the classification rules, rather than individual stock outcomes. The corresponding values for the subsequent six-month window () are shown to evaluate whether stocks assigned to lower- or higher-risk buckets in period continue to exhibit similar relative volatility behavior in the following period.
This benchmark was structured to allow a direct comparison between the average volatility of stocks within each risk category during period and the observed average volatility during period . This design enables an assessment of whether InvestorNerd ’s volatility-based classification remains informative across adjacent time horizons.
The benchmark dataset includes:
- •
Ten 6-month time periods between July 2020 and June 2025.
- •
Five volatility-based risk groups per period: Very Conservative, Conservative, Moderate, Aggressive, and Very Aggressive.
- •
Matched average volatility values for each group in both period and period .
C.0.2 Consistency Measurement Method
To evaluate the consistency between the classification periods and the future average volatilities, we computed the linear correlation coefficient (r) between:
- •
Volatility during Period of the five groups
- •
Volatility of the same stock groups during period .
For example, for the first half of 2021 (2021-01-01 to 2021-06-30), the five category averages are
and for the second half of 2021 (2021-07-01 to 2021-12-31) they are
The correlation coefficient (r) measures how strongly average volatility in a time period predicts the volatility in the next six month period for the same stocks. A value closer to 1 indicates a strong positive consistency, which means that InvestorNerd’s classification in period is predictive of volatility for those same stocks in period .
Using a non-parametric statistical test [19] to avoid the need for statistical distribution assumptions, we compute the correlation between the above five-dimensional vectors to be having a 90% confidence interval of . At the stock level for the same pair (across the common tickers in both periods P and P+1), the correlation based on the data of Table 5 is with a p-value of For the next pair (second half of 2021 vs. first half of 2022), the category averages
yield a correlation with a 90% confidence interval of , while the stock-level correlation in Table 5 is with p-value .
To further assess the reliability of each of the correlation scores, we computed a 90% confidence intervals using bootstrapped error estimates.
The linear correlation coefficients for each of the ten six-month windows ranged from 0.9924 to 0.9991, with every interval showing positive correlation between past and future average volatility. These findings show that InvestorNerd’s risk classification framework is predictive of future volatility behavior. Admittedly, this is not very surprising, but the level of correlation surprised us. Stock picking is not entirely random: a volatile (respectively, stable) stock now will likely remain volatile (respectively, stable) six months from now.
Table 5 shows a bar chart visualizing the correlation values for all tested time periods. The complete underlying data—including the volatility averages for each risk category in and is shown in Table 5.
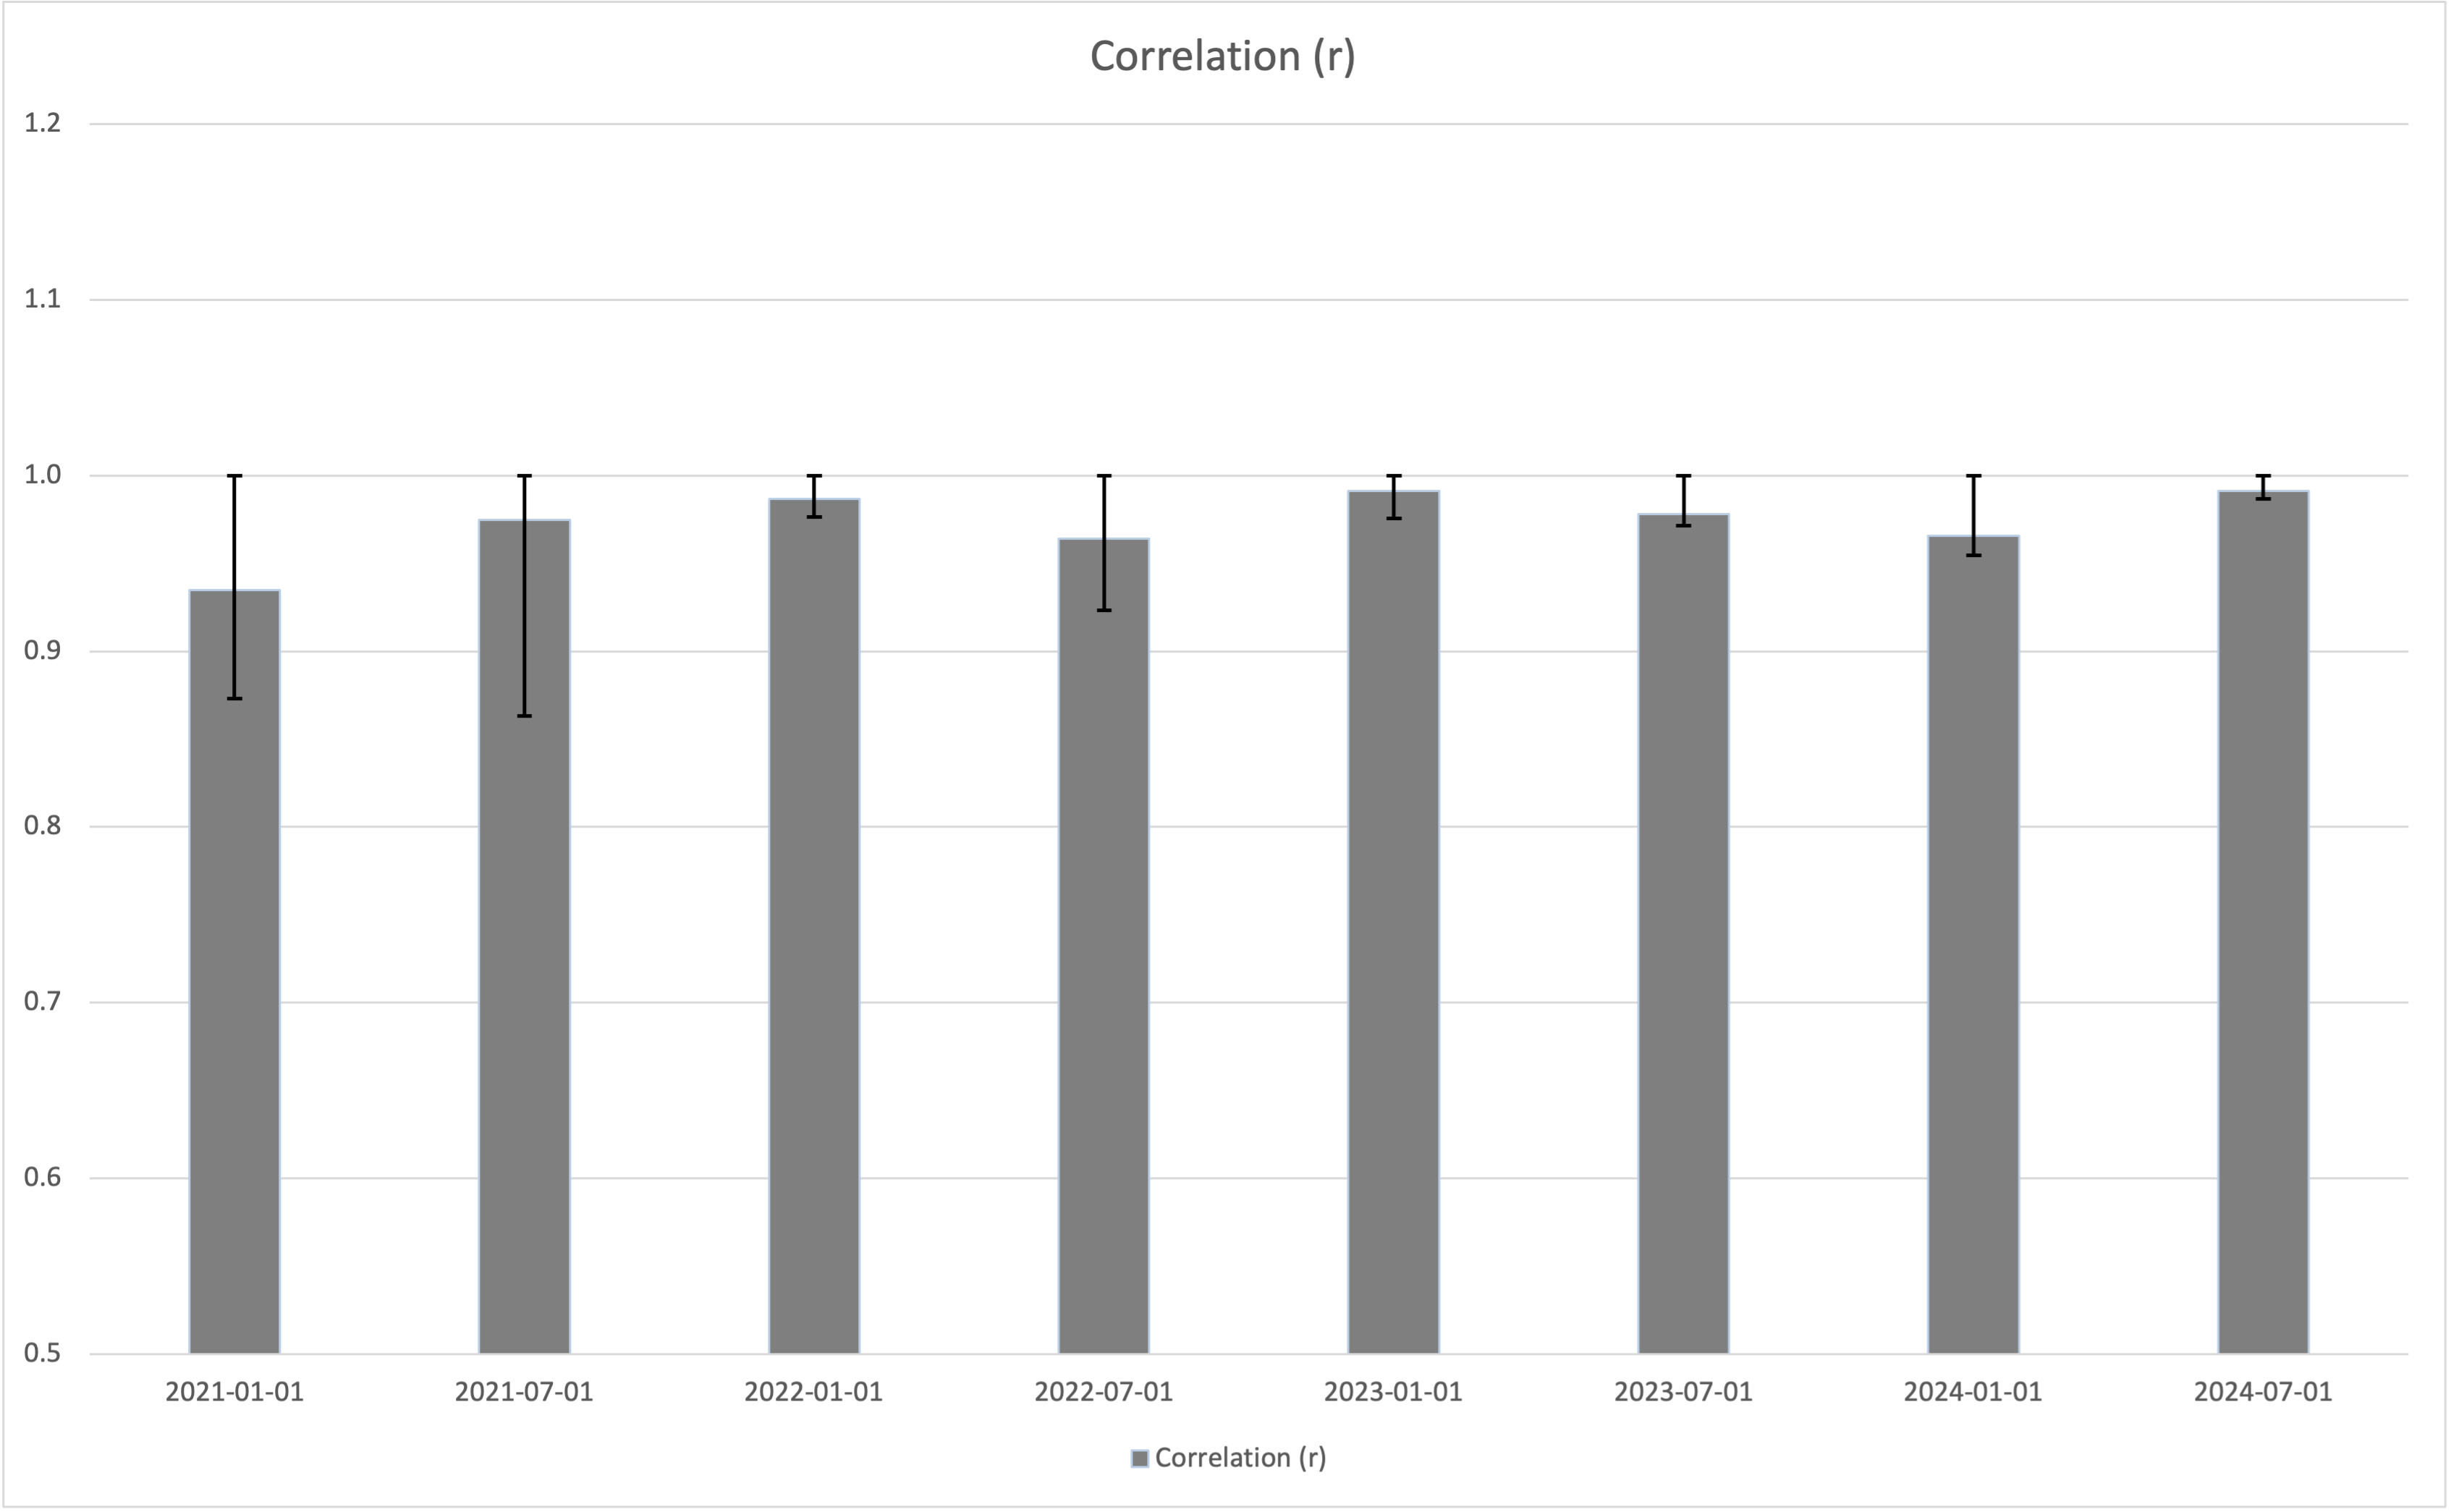
P P+1 Average vals P Average vals P+1 Correlation r P-value 2020-07-01 2021-01-01 2.7 7.6 11.7 17.7 28.8 3.3 7.1 13.1 17.1 30.7 0.846618 2021-01-01 2021-07-01 3.3 7.1 13.1 17.1 30.7 3.2 7.2 12.1 17.0 33.2 0.773347 2021-07-01 2022-01-01 3.2 7.2 12.1 17.0 33.2 3.8 7.4 12.0 17.3 38.1 0.915305 2022-01-01 2022-07-01 3.8 7.4 12.0 17.3 38.1 3.3 7.3 12.4 17.1 36.6 0.753808 2022-07-01 2023-01-01 3.3 7.3 12.4 17.1 36.6 3.3 7.2 12.0 17.1 37.0 0.834358 2023-01-01 2023-07-01 3.3 7.2 12.0 17.1 37.0 3.1 7.4 11.8 17.1 36.1 0.902431 2023-07-01 2024-01-01 3.1 7.4 11.8 17.1 36.1 3.0 6.6 12.4 16.8 32.6 0.755046 2024-01-01 2024-07-01 3.0 6.6 12.4 16.8 32.6 4.1 8.2 12.8 17.4 44.9 0.743741 2024-07-01 2025-01-01 4.1 8.2 12.8 17.4 44.9 2.8 6.8 12.5 17.1 38.3 0.814570
Appendix D InvestorNerd Questionnaire Inputs
The following pages reproduce the InvestorNerd questionnaire as completed for this experiment. The selected responses, highlighted in green, represent the household profile used to generate the report in Section 6.
See pages - of InvestorNerd_Questionaire.pdf
Appendix E InvestorNerd Report
The following pages show the InvestorNerd report using the questionnaire inputs described in Appendix D. This report forms the primary basis of the comparative analysis conducted in Section 6.
See pages - of InvestorNerd_NEW_Questionnaire_OUTPUT.pdf
*