SceneBench: A Hierarchical Benchmark for Vision-Language Understanding of 3D Scenes
Abstract
Vision-language models have achieved strong performance on 2D image understanding, but their ability to reason about 3D environments remains limited. Progress in spatial intelligence is hindered by limitations in existing benchmarks. First, many 3D datasets rely on point clouds, which capture geometry but discard rich visual appearance such as texture, text, and materials. Second, annotations typically treat objects in isolation and overlook the hierarchical organization of real environments into scenes, rooms, functional areas, and object groups. Third, current evaluation tasks focus largely on recognition or localization and do not test multi-step spatial reasoning within complex scenes.
In this context, we introduce SceneBench, a benchmark of 966 photorealistic 3D scenes reconstructed with Gaussian Splatting and densely annotated with hierarchical semantics spanning scenes, rooms, functional areas, object groups, and individual objects. These annotations are produced through a human-in-the-loop pipeline combining vision-language models with roughly 1,500 human-hours of iterative refinement and verification, producing over 183K annotated nodes with textual descriptions and 3D bounding boxes. Building on this representation, we define three evaluation tasks: Existence-Based Questions probing object attributes, Spatial Intelligence Questions covering counting, size comparison, distance, and directional relations, and Grounded Question-Reasoning-Answer (QRA) triplets requiring multi-step reasoning across semantic levels. Experiments with state-of-the-art vision-language models show that while models perform well on basic recognition tasks (e.g., up to 85% accuracy for detection), performance drops substantially on hierarchical and compositional reasoning (e.g., down to 60% for counting), revealing limitations not captured by existing benchmarks. SceneBench provides a realistic testbed for developing and evaluating models capable of fine-grained spatial reasoning in photorealistic 3D environments. Our dataset and benchmark will be made publicly available upon acceptance.

1 Introduction
Recent multimodal vision-language models can associate language with visual observations, but their performance degrades when moving from image-level analysis to 3D scenes [7]. Consequently, they remain unsuitable for real-world deployment, where intelligent agents require spatial intelligence: the ability to jointly reason about geometry, appearance, scale, and object relationships in 3D spaces. Evaluating and improving these capabilities therefore requires benchmarks that capture both the visual detail and structural organization of real-world scenes.
However, existing benchmarks do not meet these requirements. Most rely on 2D images or video, which lack a persistent 3D structure and do not support reasoning across viewpoints. Others rely on geometry-only 3D representations such as point clouds [3, 8, 10, 28, 9, 17], which capture coarse spatial layout but discard important visual cues such as text, texture, material properties, and lighting. In contrast, high-fidelity 3D representations such as Gaussian Splatting (GS) [20] preserve detailed appearance across arbitrary viewpoints while maintaining explicit 3D structure, making them well suited for holistic spatial reasoning in realistic environments. However, few GS-based datasets provide rich semantic annotations, largely due to the lack of scalable annotation pipelines.
Beyond representation, current benchmarks also suffer from two additional limitations. First, most annotations are limited to individual object categories, ignoring the hierarchical organization of real environments into scenes, rooms, functional areas, object groups, and parts [3]. By treating objects in isolation, these datasets fail to capture the semantic structure of real-world environments. Second, existing benchmarks primarily evaluate recognition or localization queries, which do not test the multi-step reasoning required to navigate a scene, resolve ambiguities, and identify fine-grained targets based on both visual and spatial cues.
To address these gaps, we introduce SceneBench, a new benchmark for immersive and hierarchical 3D vision-language understanding, illustrated in Fig. 1. SceneBench consists of 966 photorealistic 3D scenes with 183K text-annotated nodes arranged hierarchically, represented using 3D Gaussian Splatting and densely annotated with semantics spanning scenes, rooms, functional areas, object groups, and individual objects. Our contributions are twofold:
- •
A hierarchical, tree-based vision-language representation that organizes semantics from scene-level concepts down to object parts and attributes. Each leaf node corresponds to an object, while inner nodes represent hierarchical regions grounded in 3D with both textual descriptions and spatial localization.
- •
A benchmark for spatial intelligence in photorealistic 3D scenes that evaluates both core spatial reasoning (e.g., relative arrangements, counts, distances) and advanced multi-step reasoning requiring cross-object references and fine-detail analysis. Furthermore, we show that existing methods struggle on our benchmark, and provide a detailed analysis.
2 Related Work
The field of 3D scene understanding has transitioned from task-specific architectures operating on point clouds [32, 12] toward unified multimodal representations. This shift occurred with the emergence of neural scene representations such as NeRF [30] and 3D GS [20]. Building on this idea, several works have distilled language and semantic information into these representations to support open-vocabulary queries and zero-shot reasoning in 3D environments [33, 53, 35, 46, 6, 21, 11, 42, 27, 24, 39]. Recent datasets have followed the same direction by offering large-scale 3DGS scenes with dense object-level annotations [34]. However, such datasets remain largely limited to flat object structures, discarding the multi-level semantic hierarchies and fine-grained visual details necessary for complex spatial intelligence.
Hierarchical 3D Scene Graphs structure environments into multiple levels of abstraction. Early works introduced hierarchical scene graphs to support long-range navigation and overcome LLM context limits [2, 40, 41]. More recently, datasets have leveraged scene graphs to automatically generate large multimodal perception suites and dense grounded annotations [44, 37, 18].
Some approaches go beyond object-level grounding and incorporate fine-grained parts [49]. A quantitative comparison of these 3D visual grounding datasets is provided in Tab. 2.
While algorithmic scene graph generation over 3D Gaussians is actively being explored [38], explicit, multi-level relational hierarchies natively embedded within a dataset benchmark remain limited to mesh or point-cloud environments.
To leverage structured 3D environments, recent research has explored grounding large language models (LLMs) for spatial reasoning and question answering, as summarized in Tab. 1. Early benchmarks introduced object-grounded queries over point clouds and egocentric views [3, 29]. Subsequent work expanded these tasks toward multi-view and compositional reasoning [14, 50]. Other studies emphasize the importance of explicit cognitive mapping for spatial reasoning, proposing benchmarks based on 2D videos or large image collections [45, 13, 26]. In parallel, advanced reasoning frameworks incorporate reinforcement learning and internal visualization-of-thought to improve multi-step embodied task performance [16, 15]. Despite these advances, no existing dataset combines photorealistic 3D rendering with densely grounded and structured question answering, leaving a gap between visual fidelity and spatial reasoning.
To address these limitations, we introduce SceneBench, the first dataset combining the high-fidelity visual rendering of 3DGS with densely annotated hierarchical scene graphs. By explicitly modeling multi-scale relational dependencies and defining Existence, Spatial Intelligence, and Grounded Question-Reasoning-Answer tasks, SceneBench establishes a benchmark that connects simple 3D localization with higher-level spatial reasoning.
| Dataset | Q. | 3D Repr. | Descr. | Gr. | Q. Types | Reason. |
|---|---|---|---|---|---|---|
| Thinking in Space [45] | ✓ | Vid | S | ✗ | Sp, Ct, AO, RP, Ms | ✓(Sp) |
| ExCap3D [49] | ✗ | PC | O, P | ✓ | N/A | ✗ |
| 3D-R1 [16] | ✓ | Img, PC, Txt | S | ✓ | Sp, Dr, At, Ex, Ct | ✓(CoT) |
| 3D-GRAND [43] | ✗ | PC | S | ✓ | Sp, Dr, Ex, At, Ct | ✓ |
| 3DMV-VQA [14] | ✓ | MV-Img | S, R | ✓ | Ex, Ct, Sp, Ms | ✓ |
| ScanQA [3] | ✓ | PC | S, O | ✓ | At, Sp, Dr, Ex, Ct | ✗ |
| InternSpatial [13] | ✓ | Img | S, O | ✓ | Sp, Ct, Tm, Ex | ✗ |
| MIRAGE [26] | ✓ | Img | O | ✗ | Cb, Ct, Rl | ✗ |
| SceneVerse [18] | ✗ | PC | S, O | ✓ | N/A | ✗ |
| SURPRISE3D [15] | ✓ | PC | O | ✓ | Sp, CSR | ✓ |
| Ours | ✓ | 3DGS | S, R, G, O | ✓ | Sp, Ex, Ct, Dr | ✓(MS) |
| Dataset | Objects | Descr. | Avg. Len. | Scene Type |
|---|---|---|---|---|
| ScanRefer [8] | 11,046 | 51,583 | 20.27 | 3D Scan |
| ReferIt3D [1] | 96,654 | 130,364 | 3.51 | Image |
| RioRefer [31] | 31,801 | 63,602 | 14.78 | Image |
| ArkitSceneRefer [19] | 15,553 | 15,553 | 14.43 | 3D Scan |
| SceneVerse [18] | 1.5M | 2.5M | - | Point Cloud |
| 3D-Grand [43] | 6.2M | 6.2M | - | Point Cloud |
| Ours | 128,966 | 183,540 | 60 | 3DGS |

3 Dataset
To support more granular 3D scene understanding, we propose a tree-based representation for vision-language annotations, as illustrated in Fig. 1. Each leaf node in the tree corresponds to an object, and inner nodes correspond to a hierarchy of objects, paired with a 3D-grounded textual description. When a node appears within the description of another, it is grounded as a constituent part of that inner node.
The dataset comprises 966 scenes containing 584 real-world scenes from ScanNet++ [48] and 382 synthetic scenes from InteriorGS [34]. All scenes are represented as 3D Gaussian Splats. For ScanNet++, we utilize the splats provided by SceneSplat [23]; for InteriorGS, the scenes are natively available in the Gaussian Splatting format.
Through extensive manual curation and multi-stage verification, in which all model calls are checked for errors and iteratively refined, we developed a human-in-the-loop pipeline (approximately 1,500 human-hours in total) to generate highly detailed, accurate free-form text descriptions and a hierarchical scene structure. This pipeline consists of two primary components: Object Description Generation and Object Hierarchy Generation, as illustrated in Fig. 2.
Object Description Generation
To generate descriptions of objects in the scene, we employ a Vision-Language Model (VLM), Gemini 3.0, providing it with the semantic labels of objects, the count per label (ensuring no unique instance is missed), and a video of the scene with overlaid instance IDs to explicitly ground the visual data. The source of the visual input depends on the scene type. For ScanNet++ [48], we use the ground-truth videos captured during the scanning process. For InteriorGS [34], we automatically generate camera trajectories and render images along these paths to create synthetic videos.
To handle the high complexity of InteriorGS scenes, we partition large scenes into subregions using dataset room metadata; if a room remains too complex, we manually divide it into intuitive sub-sections. During inspection of initial outputs, we observed that high-density clusters (e.g., a stack of books) often suffered from spatial inaccuracies, such as misattributing one object’s description to another. To resolve these mapping errors and provide needed visual context, we supplied multi-view images for those dense regions. Finally, we checked for missing or incorrectly classified descriptions and re-ran the generation pipeline for those objects to ensure complete and accurate coverage.
Object Hierarchy Generation
To model the global context, we organize individual objects into a multi-level hierarchy where the topmost node represents the entire scene and the leaf nodes represent individual objects. Following prior work [18], we first establish structural relationships, including attached to (e.g., ceiling lights), hanging from (e.g., wall art), supported by, contained by, and grouped with (e.g., a single book within a collection). This initial structural hierarchy is then verified by a human and refined by a VLM. By providing the model with the structural tree and the scene video, we prompt it to identify and add functional areas (e.g., ”dining area” or ”workspace”), transitioning the hierarchy from purely spatial to semantic. This refinement is performed in multiple passes to ensure logical consistency. Finally, to ensure that every description is grounded, we perform a final pass in which the model revises parent node descriptions to explicitly reference all underlying child nodes.
4 Benchmarking Tasks

4.1 Existence-Based Questions
These questions ask whether a particular visual attribute of an object exists in the scene. They take the form of yes/no queries about properties such as color, material, or other visual characteristics.
To generate these questions, we first use the textual descriptions of objects in the scene, which contain detailed attributes. Given these descriptions, we prompt a vision-language model to generate both positive and negative questions for a given object category.
For positive (“yes”) questions, the model selects an attribute that uniquely describes one instance of the object in the scene. For negative (“no”) questions, it generates an attribute that does not appear in any instance of that object category within the scene. Finally, all the generated questions for the test set are verified by the annotators.
| Task | Core Definition |
|---|---|
| NCS | Narrative and Contextual Synthesis: Infers the ”big picture” story, including user profiles and socioeconomic values reflected in the space. |
| BWA | Behavior and Workflow Analysis: Decodes patterns of action, such as daily habits or workflow efficiency in commercial spaces. |
| DCI | Design and Curation Intent: Analyzes deliberate aesthetic choices to understand the intended mood or brand identity. |
| TFA | Temporal Forensic Analysis: Focuses on recent activity by identifying transient evidence. |
| FGA | Functional and Goal-Oriented Analysis: Evaluates how effectively the layout achieves its primary purpose. |
| CA | Comparative Analysis: Compares two or more objects/areas to infer meaning from their differences. |
| CR | Counterfactual Reasoning: Tests the space’s limitations by posing ”what if” scenarios. |
| AAA | Anomaly and Absence Analysis: Identifies objects that are contextually out of place or missing. |
| DOM | Dependent Object Manipulation: Analyzes physical constraints and consequences of moving objects. |
| SLC | Structural Load and Capacity: Verifies if containment relationships are physically viable. |
| FOA | Functional Occlusion and Accessibility: Determines if object arrangements block the usage of a target. |
| SHP | Systemic Hazard Propagation: Traces potential damage paths in hypothetical failure scenarios. |
4.2 Spatial Intelligence Questions
Inspired by [45], we design questions that evaluate the model’s spatial intelligence, covering object size, object count, absolute distance, relative distance, and relative direction. Ground truth for these tasks is derived directly from object metadata.
In contrast to [45], our scenes contain multiple instances of objects from the same category. To address this complexity, we do not refer to objects by their class labels alone; instead, we utilize unique referring expressions based on visual attributes. These attributes encompass text, color, pattern, depicted content, material, and lighting effects.
To generate referring expressions, we feed free-form descriptions and object images to a Vision-Language Model (VLM) to produce expressions that uniquely isolate the target within the scene. In the specific case of object counting, we employ a VLM to identify subsets of objects sharing a common attribute (e.g., ”red shoes” rather than just ”shoes”). This allows us to formulate precise counting queries that require the model to disentangle objects based on fine-grained visual features. All the generated questions are verified by the annotators.
4.3 Reasoning-Based Questions
We generate complex reasoning questions that require a deep understanding of a scene’s context, design, and implicit narratives. As illustrated in Table 3, these tasks are classified into twelve distinct reasoning types. We utilize a vision-language model, prompted with both the scene video and our generated hierarchical descriptions, to produce one question per category for each scene where possible. Each entry is formatted as a Question-Reasoning-Answer (QRA) triplet, where the reasoning process justifies the final answer through a structured sequence of observations.
The reasoning steps are designed to mimic a human-like cognitive flow: starting with a Scene Overview to establish global context (Root level), followed by an Area Inspection to narrow focus to a specific zone (Child level), and Target Identification to pinpoint the object in question (Leaf level). To further refine the context, the model performs an Adjacent Observation of neighboring items (Sibling level) and a Fine Detail Observation of specific attributes such as text, brands, or material states. Finally, the model engages in Inference to apply deductive logic based on these observations, culminating in a Synthesis that combines all gathered evidence into a final conclusion.
4.4 Quality and Statistics
To ensure the quality of our generated questions and answers, we conducted a user study involving 100 questions across 10 distinct 3D scenes. Participants evaluated the accuracy and relevance of the content on a 5-point scale. To verify the reliability of these assessments, we included both clean samples and intentionally perturbed samples as a quality control measure.
As shown in Figure 2, users rated clean samples significantly higher than perturbed samples. More details can be found in the supplementary material.
5 Experiments
We evaluate the capacity of vision-language models for 3D scene understanding by benchmarking performance across three core dimensions: object existence, spatial intelligence, and complex reasoning. Our evaluation utilizes two distinct datasets—ScanNet++, representing real-world reconstructions, and InteriorGS, featuring high-fidelity synthetic Gaussian splats—to test the models across varied environmental complexities. Of the 966 scenes in total, we use 766 scenes (26,311 questions) for training and reserve the remaining 200 scenes (7,213 questions) for testing.

| ScanNet++ | InteriorGS | ||||||||||||||||||
| Existence | Spatial Intelligence | Existence | Spatial Intelligence | ||||||||||||||||
| Method | Prec | Rec | F1 | Acc | Cnt | Sz | Abs | Rel-D | Rel-Dir | Prec | Rec | F1 | Acc | Cnt | Sz | Abs | Rel-D | Rel-Dir | |
| Gemini-Based Models | |||||||||||||||||||
| Video (Basic) | 0.65 | 0.87 | 0.75 | 0.71 | 0.48 | 0.61 | 0.31 | 0.48 | 0.48 | 0.65 | 0.91 | 0.76 | 0.70 | 0.50 | 0.60 | 0.34 | 0.42 | 0.39 | |
| Video (CoT) | 0.76 | 0.90 | 0.82 | 0.81 | 0.47 | 0.60 | 0.32 | 0.38 | 0.43 | 0.76 | 0.84 | 0.80 | 0.78 | 0.54 | 0.64 | 0.28 | 0.36 | 0.44 | |
| Panoramic | 0.66 | 0.95 | 0.78 | 0.74 | 0.45 | 0.57 | 0.27 | 0.52 | 0.43 | 0.68 | 0.78 | 0.73 | 0.70 | 0.50 | 0.56 | 0.17 | 0.37 | 0.30 | |
| Qwen-Based Models | |||||||||||||||||||
| Video (Basic) | 0.85 | 0.56 | 0.67 | 0.73 | 0.50 | 0.59 | 0.29 | 0.38 | 0.29 | 0.83 | 0.29 | 0.43 | 0.62 | 0.54 | 0.48 | 0.21 | 0.42 | 0.38 | |
| Panoramic | 0.82 | 0.54 | 0.65 | 0.71 | 0.47 | 0.57 | 0.24 | 0.37 | 0.23 | 0.81 | 0.41 | 0.54 | 0.66 | 0.47 | 0.49 | 0.26 | 0.43 | 0.30 | |
| Agentic Methods | |||||||||||||||||||
| CoV | 0.82 | 0.59 | 0.68 | 0.73 | 0.44 | 0.56 | 0.21 | 0.41 | 0.35 | 0.82 | 0.57 | 0.67 | 0.71 | 0.38 | 0.52 | 0.22 | 0.40 | 0.27 | |
| Think3D | 0.83 | 0.54 | 0.66 | 0.72 | 0.23 | 0.34 | 0.20 | 0.38 | 0.37 | 0.86 | 0.43 | 0.57 | 0.67 | 0.25 | 0.33 | 0.21 | 0.39 | 0.39 | |
| Geometry Integrated VLMs | |||||||||||||||||||
| GeoThinker (16 frames) | 0.60 | 0.86 | 0.71 | 0.65 | 0.19 | 0.57 | 0.33 | 0.47 | 0.51 | 0.66 | 0.77 | 0.71 | 0.67 | 0.24 | 0.48 | 0.16 | 0.28 | 0.36 | |
| Finetuned Model | |||||||||||||||||||
| GeoThinker (Finetuned) | 0.87 | 0.80 | 0.84 | 0.85 | 0.60 | 0.59 | 0.31 | 0.48 | 0.62 | 0.80 | 0.76 | 0.78 | 0.78 | 0.57 | 0.52 | 0.13 | 0.37 | 0.40 | |
| IntGS | SNet++ | |||||||
|---|---|---|---|---|---|---|---|---|
| Base | FT | Base | FT | |||||
| Type | Vid.B | CoV | GeoT | GT-FT | Vid.B | CoV | GeoT | GT-FT |
| AAA | 3.14 | 2.70 | 2.21 | 2.79 | 3.27 | 2.99 | 2.60 | 2.75 |
| BWA | 3.14 | 3.01 | 2.58 | 3.07 | 2.60 | 3.17 | 2.82 | 3.05 |
| CA | 2.97 | 2.82 | 2.54 | 2.79 | 3.47 | 2.91 | 2.43 | 2.94 |
| CR | 3.65 | 2.92 | 2.53 | 2.82 | 3.24 | 2.93 | 2.47 | 2.83 |
| DCI | 3.29 | 2.96 | 2.84 | 3.30 | 2.76 | 3.43 | 3.08 | 3.34 |
| DOM | 2.54 | 2.49 | 2.13 | 2.51 | 3.21 | 2.70 | 2.28 | 2.60 |
| FGA | 3.61 | 3.38 | 2.88 | 3.22 | 3.04 | 3.03 | 2.96 | 3.34 |
| FOA | 2.99 | 2.92 | 2.92 | 3.08 | 3.02 | 2.71 | 2.86 | 2.79 |
| NCS | 3.19 | 3.49 | 3.11 | 3.62 | 2.45 | 3.35 | 2.99 | 3.24 |
| SHP | 2.96 | 2.66 | 2.14 | 2.72 | 3.17 | 2.84 | 2.10 | 2.73 |
| SLC | 3.36 | 3.07 | 2.95 | 3.08 | 3.94 | 3.25 | 3.45 | 3.55 |
| TFA | 3.18 | 2.71 | 2.29 | 2.93 | 2.79 | 2.87 | 2.51 | 2.73 |
| Mean | 3.17 | 2.93 | 2.59 | 2.99 | 3.08 | 3.01 | 2.71 | 2.99 |
5.1 Evaluation Metrics
We employ three sets of metrics corresponding to our three question categories:
- •
Existence Questions: We evaluate performance using Precision, Recall, F1 Score, and Accuracy Score.
- •
Spatial Intelligence Questions: For spatial intelligence questions, we adopt the metrics from Thinking in Space [45]. We use Accuracy (ACC) for Multiple-Choice Answer (MCA) tasks. For Numerical Answer (NA) tasks, which involve continuous value prediction, we use Mean Relative Accuracy (MRA); this averages relative accuracy across confidence thresholds to measure proximity to the ground truth.
- •
Reasoning Questions: For our Reasoning-Grounded QRA Triplets, we assess the quality of generated free-form answers against ground-truth responses. We report scores using standard n-gram and consensus-based language metrics: BLEU-1, BLEU-4, CIDEr [36], METEOR [5], and ROUGE-L [25]. Besides this, we also use Qwen3-32B as an LLM-as-a-judge to rate the model responses compared to the ground truth for Gemini on video inputs, CoV, GeoThinker and GeoThinker finetuned on our data; we use a different model family for judging, rather than Gemini, which was also used for question generation, to avoid self-preference bias.
5.2 Methods
We evaluate spatial reasoning across a diverse suite of baselines, including proprietary and open-source VLMs (e.g., “gemini-3-flash-preview”, Qwen3-VL-8B [4]) tested with various visual inputs like video or panoramas. Additionally, for Gemini-3-flash-preview we also test a prompting technique, CoT. These are compared against specialized 3D-aware frameworks: Chain-of-View (CoV) [52], which employs an agentic exploration of the 3D scene (represented as Gaussian splats in our evaluation); Think3D [51], which utilizes an interactive 3D manipulation toolkit; and GeoThinker [22], which features an active geometry integration mechanism. We also finetune GeoThinker on our dataset.
5.3 Benchmark Results
We present the evaluation results in this section, separated by dataset (ScanNet++ and InteriorGS). InteriorGS consists of synthetic scenes featuring high-fidelity Gaussian splats, primarily focusing on large-scale apartments. In contrast, ScanNet++ is composed of reconstructions from real-world captures, typically representing smaller apartments and compact environments.
As illustrated in the Existence columns of Table 4, Vision-Language Models (VLMs) utilizing video-based methods achieve impressive results in object existence tasks. Proprietary models, such as Gemini-3-flash, generally perform slightly better than open-source alternatives like Qwen-3-8B-VL. The application of Chain-of-Thought (CoT) reasoning further improves these results, allowing Video (CoT) to achieve the best performance across all primary metrics. Utilizing panoramic images as an alternative input yields slightly worse results than video input. Agentic methods, such as CoV and Think3D, follow as the next-best-performing category; notably, CoV outperforms Think3D in this category. This performance gap is likely due to CoV’s ability to explore directly in high-fidelity Gaussian-splat environments, whereas Think3D relies on specialized 3D modules that may introduce noise during scene reconstruction. The disparity is particularly pronounced in synthetic scenes, where the quality of the underlying Gaussian splats provides a more reliable foundation for reasoning than the often fragmented or lower-resolution reconstructions found in real-world data. GeoThinker, which integrates geometric features, initially struggles on existence questions, but fine-tuning it on our data substantially increases its performance, as shown in Fig. 4.
As illustrated in the Spatial Intelligence columns of Table 4, VLMs demonstrate superior performance on counting-related tasks. This is likely because processing entire videos provides broader scene context; proprietary models like Gemini also consistently outperform open-source models like Qwen, except in some categories such as count. Consistent with Thinking in Space, applying Chain-of-Thought (CoT) reasoning tends to degrade performance on spatial intelligence tasks. For queries like relative distance, panoramic images often outperform the base Gemini model, particularly in smaller-scene datasets like ScanNet++, where all relevant objects fit within a single panoramic frame.
While video-based methods yield impressive results by leveraging extensive temporal context, they require a high volume of frames for evaluation, making them computationally heavy. In contrast, agentic methods that move around a scene do not perform well on spatial intelligence tasks, often struggling with spatial coherence as they transition between viewpoints. Conversely, methods that incorporate geometric features, such as GeoThinker, are better suited to fine-grained spatial queries like relative direction and distance, though the base model still struggles on others such as counting. Integrating a geometric encoder significantly boosts performance, and after fine-tuning on our data GeoThinker surpasses vision-language models that are provided with dense videos of the scene, as shown in Fig. 4. This indicates that actively fusing geometric information into the architecture is a highly effective strategy, allowing a specialized, geometry-aware model to outperform general-purpose LLMs. More fine-grained results and analysis based on object attributes can be found in the supplementary material.
As reported in Table 5, Gemini with dense visual input (Video (Basic)) is the best method overall, as its dense video sampling provides the most comprehensive scene context for reasoning. The main exception is Narrative and Contextual Synthesis (NCS), where CoV performs better, likely because its Bird’s Eye View input provides an immediate, holistic blueprint of the room’s layout. GeoThinker struggles with advanced reasoning, but fine-tuning it on our data increases its performance, as shown in Fig. 4 and Tab. 5. Text-based metrics have been provided in the supplementary material.
6 Conclusion
In this work, we introduce SceneBench, a novel large-scale benchmark of 966 photorealistic 3D scenes captured via Gaussian Splatting, designed to bridge the gap between 2D image analysis and true 3D spatial intelligence. By implementing a hierarchical, tree-based annotation structure spanning scenes, rooms, functional areas, and individual objects, we provide a benchmark that captures both fine-grained visual detail and the hierarchical structural organization of real-world environments. Our extensive evaluation of current vision-language models across existence, spatial intelligence, and multi-step reasoning tasks reveals significant performance bottlenecks, particularly as hierarchical complexity increases. While models perform reasonably well on basic recognition tasks, their performance drops substantially when required to reason across semantic levels or integrate fine visual details with spatial relationships. These findings highlight limitations that are not exposed by existing benchmarks and demonstrate the need for new evaluation settings that reflect the complexity of real environments. As such, SceneBench provides a realistic testbed for diagnosing model capabilities and guiding the development of future vision-language systems with stronger spatial intelligence. We hope SceneBench will enable the community to develop and evaluate vision-language models with stronger spatial intelligence in photorealistic 3D environments.
References
- [1] (2020) ReferIt3D: neural listeners for fine-grained 3d object identification in real-world scenes. 16th European Conference on Computer Vision (ECCV). Cited by: Table 2.
- [2] (2019) 3d scene graph: a structure for unified semantics, 3d space, and camera. In Proceedings of the IEEE/CVF international conference on computer vision, pp. 5664–5673. Cited by: §2.
- [3] (2022) ScanQA: 3d question answering for spatial scene understanding. In Proceedings of the IEEE/CVF Conference on Computer Vision and Pattern Recognition (CVPR), Cited by: §1, §1, Table 1, §2.
- [4] (2025) Qwen3-vl technical report. External Links: 2511.21631, Link Cited by: §5.2.
- [5] (2005) METEOR: an automatic metric for MT evaluation with improved correlation with human judgments. In Proceedings of the ACL Workshop on Intrinsic and Extrinsic Evaluation Measures for Machine Translation and/or Summarization, J. Goldstein, A. Lavie, C. Lin, and C. Voss (Eds.), Ann Arbor, Michigan, pp. 65–72. External Links: Link Cited by: 3rd item.
- [6] (2025) Segment any 3d gaussians. In Proceedings of the AAAI conference on artificial intelligence, Vol. 39, pp. 1971–1979. Cited by: §2.
- [7] (2024) SpatialVLM: endowing vision-language models with spatial reasoning capabilities. In Proceedings of the IEEE/CVF Conference on Computer Vision and Pattern Recognition (CVPR), Cited by: §1.
- [8] (2020) Scanrefer: 3d object localization in rgb-d scans using natural language. In Computer Vision–ECCV 2020: 16th European Conference, Glasgow, UK, August 23–28, 2020, Proceedings, Part XX 16, pp. 202–221. Cited by: §1, Table 2.
- [9] (2024) LL3DA: visual interactive instruction tuning for omni-3d understanding reasoning and planning. In Proceedings of the IEEE/CVF Conference on Computer Vision and Pattern Recognition (CVPR), pp. 26428–26438. Cited by: §1.
- [10] (2021) Scan2Cap: context-aware dense captioning in rgb-d scans. In Proceedings of the IEEE/CVF Conference on Computer Vision and Pattern Recognition, pp. 3193–3203. Cited by: §1.
- [11] (2025) Occam’s lgs: an efficient approach for language gaussian splatting. External Links: 2412.01807, Link Cited by: §2.
- [12] (2017) ScanNet: richly-annotated 3d reconstructions of indoor scenes. In Proceedings of the IEEE Conference on Computer Vision and Pattern Recognition (CVPR), Cited by: §2.
- [13] (2025) InternSpatial: a comprehensive dataset for spatial reasoning in vision-language models. External Links: 2506.18385, Link Cited by: Table 1, §2.
- [14] (2023) 3d concept learning and reasoning from multi-view images. In Proceedings of the IEEE/CVF Conference on Computer Vision and Pattern Recognition, pp. 9202–9212. Cited by: Table 1, §2.
- [15] (2025) Surprise3D: a dataset for spatial understanding and reasoning in complex 3d scenes. In The Thirty-ninth Annual Conference on Neural Information Processing Systems Datasets and Benchmarks Track, External Links: Link Cited by: Table 1, §2.
- [16] (2025) 3D-r1: enhancing reasoning in 3d vlms for unified scene understanding. arXiv preprint arXiv:2507.23478. Cited by: Table 1, §2.
- [17] (2025) 3D coca: contrastive learners are 3d captioners. arXiv preprint arXiv:2504.09518. Cited by: §1.
- [18] (2024) Sceneverse: scaling 3d vision-language learning for grounded scene understanding. In European Conference on Computer Vision (ECCV), Cited by: Table 1, Table 2, §2, §3.
- [19] (2023) ARKitSceneRefer: text-based localization of small objects in diverse real-world 3D indoor scenes. In Findings of the Association for Computational Linguistics: EMNLP 2023, H. Bouamor, J. Pino, and K. Bali (Eds.), Singapore, pp. 784–799. External Links: Link, Document Cited by: Table 2.
- [20] (2023) 3D gaussian splatting for real-time radiance field rendering. ACM Transactions on Graphics 42 (4). Cited by: §1, §2.
- [21] (2023) Lerf: language embedded radiance fields. In Proceedings of the IEEE/CVF international conference on computer vision, pp. 19729–19739. Cited by: §2.
- [22] (2026) Thinking with geometry: active geometry integration for spatial reasoning. External Links: 2602.06037, Link Cited by: §10.3, §5.2.
- [23] (2025) SceneSplat: gaussian splatting-based scene understanding with vision-language pretraining. External Links: 2503.18052, Link Cited by: §3.
- [24] (2025) Spc-gs: gaussian splatting with semantic-prompt consistency for indoor open-world free-view synthesis from sparse inputs. In Proceedings of the Computer Vision and Pattern Recognition Conference, pp. 11264–11274. Cited by: §2.
- [25] (2004) ROUGE: a package for automatic evaluation of summaries. In Text Summarization Branches Out, Barcelona, Spain, pp. 74–81. External Links: Link Cited by: 3rd item.
- [26] (2025) MIRAGE: a multi-modal benchmark for spatial perception, reasoning, and intelligence. External Links: 2505.10604, Link Cited by: Table 1, §2.
- [27] (2025) Segment then splat: a unified approach for 3d open-vocabulary segmentation based on gaussian splatting. arXiv e-prints, pp. arXiv–2503. Cited by: §2.
- [28] (2022) Sqa3d: situated question answering in 3d scenes. arXiv preprint arXiv:2210.07474. Cited by: §1.
- [29] (2023) SQA3D: situated question answering in 3d scenes. In International Conference on Learning Representations (ICLR), Cited by: §2.
- [30] (2021) Nerf: representing scenes as neural radiance fields for view synthesis. Communications of the ACM 65 (1), pp. 99–106. Cited by: §2.
- [31] (2024) Cross3DVG: cross-dataset 3d visual grounding on different rgb-d scans. External Links: 2305.13876, Link Cited by: Table 2.
- [32] (2017) Pointnet++: deep hierarchical feature learning on point sets in a metric space. Advances in neural information processing systems 30. Cited by: §2.
- [33] (2024) LangSplat: 3d language gaussian splatting. In Proceedings of the IEEE/CVF Conference on Computer Vision and Pattern Recognition (CVPR), Cited by: §2.
- [34] (2025) InteriorGS: a 3d gaussian splatting dataset of semantically labeled indoor scenes. Hugging Face. External Links: Link Cited by: §2, §3, §3, §8.1, §8.2.4, §9.
- [35] (2025) SplatTalk: 3d vqa with gaussian splatting. In Proceedings of the IEEE/CVF International Conference on Computer Vision (ICCV), Cited by: §2.
- [36] (2015) CIDEr: consensus-based image description evaluation. External Links: 1411.5726, Link Cited by: 3rd item.
- [37] (2024) Embodiedscan: a holistic multi-modal 3d perception suite towards embodied ai. In Proceedings of the IEEE/CVF Conference on Computer Vision and Pattern Recognition, pp. 19757–19767. Cited by: §2.
- [38] (2025) GaussianGraph: 3d gaussian-based scene graph generation for open-world scene understanding. External Links: 2503.04034, Link Cited by: §2.
- [39] (2025) Plgs: robust panoptic lifting with 3d gaussian splatting. IEEE Transactions on Image Processing. Cited by: §2.
- [40] (2024) Hierarchical open-vocabulary 3d scene graphs for language-grounded robot navigation. In Robotics: Science and Systems (RSS), Cited by: §2.
- [41] (2025) KeySG: hierarchical keyframe-based 3d scene graphs. arXiv preprint arXiv:2510.01049. Cited by: §2.
- [42] (2024) Opengaussian: towards point-level 3d gaussian-based open vocabulary understanding. Advances in Neural Information Processing Systems 37, pp. 19114–19138. Cited by: §2.
- [43] (2025) 3D-grand: a million-scale dataset for 3d-llms with better grounding and less hallucination. External Links: 2406.05132, Link Cited by: Table 1, Table 2.
- [44] (2025) 3D-grand: a million-scale dataset for 3d-llms with better grounding and less hallucination. In Proceedings of the IEEE/CVF Conference on Computer Vision and Pattern Recognition (CVPR), pp. 29501–29512. Cited by: §2.
- [45] (2025) Thinking in space: how multimodal large language models see, remember, and recall spaces. In Proceedings of the IEEE/CVF Conference on Computer Vision and Pattern Recognition (CVPR), Cited by: Table 1, §2, §4.2, §4.2, 2nd item, §8.2.4.
- [46] (2024) Gaussian grouping: segment and edit anything in 3d scenes. In European conference on computer vision, pp. 162–179. Cited by: §2.
- [47] (2024) Gsplat: an open-source library for gaussian splatting. External Links: 2409.06765, Link Cited by: §8.1.
- [48] (2023) ScanNet++: a high-fidelity dataset of 3d indoor scenes. External Links: 2308.11417, Link Cited by: §3, §3, §8.1, §8.2.4, §9.
- [49] (2025) ExCap3D: expressive 3d scene understanding via object captioning with varying detail. In Proceedings of the IEEE/CVF International Conference on Computer Vision (ICCV), Cited by: Table 1, §2.
- [50] (2025) Open3D-vqa: a benchmark for comprehensive spatial reasoning with multimodal large language model in open space. External Links: 2503.11094, Link Cited by: §2.
- [51] (2026) Think3D: thinking with space for spatial reasoning. External Links: 2601.13029, Link Cited by: §10.4, §5.2.
- [52] (2026) CoV: chain-of-view prompting for spatial reasoning. External Links: 2601.05172, Link Cited by: §10.4, §5.2.
- [53] (2024) Feature 3dgs: supercharging 3d gaussian splatting to enable distilled feature fields. In Proceedings of the IEEE/CVF Conference on Computer Vision and Pattern Recognition (CVPR), Cited by: §2.
Supplementary Material
7 Overview
This supplementary includes additional materials not included in the main paper.
- •
Section 8: Details the Data Generation Process, covering scene video generation, hierarchy generation, and question generation.
- •
Section 9: Reports the Data Statistics of the released question set, broken down by question type, visual attribute, and reasoning sub-category.
- •
Section 10: Presents Additional Results not included in the main paper: reasoning text-similarity metrics, a granular per-attribute and per-hierarchy-level performance breakdown, results for GeoThinker with additional frames, and the average frame usage across methods.
- •
Section 11: Provides an overview of the Human Evaluation Interface used for rating the quality of question-answer pairs.
- •
Section 12: Displays Qualitative Results illustrating the performance of various methods on our benchmarking tasks.
8 Data Generation Process

8.1 Video Generation Process
For the ScanNet++ dataset [48], video sequences are constructed by leveraging the high-quality continuous frames natively provided by the dataset. In contrast, for the synthetic InteriorGS dataset [34], camera trajectories are programmatically generated by first processing the scene’s 2D occupancy map to identify navigable spaces at three heights: floor, mid-level, and flying. To define the path, each subregion is partitioned into a grid, from which the centroid of the largest connected navigable space in each cell is extracted as a waypoint. These waypoints are then linked using the A* pathfinding algorithm to create a raw, closed-loop navigation path that ensures comprehensive coverage of the interior space.
To transition these raw paths into smooth, natural motion, we apply B-spline interpolation combined with a curvature-aware sampling strategy. This method dynamically increases the density of points in high-curvature segments, effectively slowing the camera during sharp turns to mimic human-like observation. Finally, camera orientations are determined by calculating “look-at” vectors based on future path coordinates, which are smoothed via a moving average filter. These 2D trajectories are then projected into 3D space using height offsets from the occupancy metadata to generate the final world-to-camera matrices for rendering. On a sample of scenes we manually compared these automatically generated videos against videos recorded by moving a camera through the scene by hand, and found the two to be of comparable quality for annotation.
We overlay instance ids of the objects in the videos by projecting the center of the bounding box of the objects in the image. All the renderings for images are created using the gsplat [47] rasterizer.
8.2 Dataset Generation Process
Every stage described below is human-in-the-loop: we inspect the model outputs, revise the prompts and model inputs in response to recurring failure cases, and re-run the stage until its output is satisfactory before moving on.
8.2.1 Object Descriptions
We pass the videos with instance ids overlaid on them, a file containing the list of objects where each object is represented by its class label, instance id, bounding box represented using center and extent, and a list that specifies how many instances of a particular object are present in the scene to a VLM. The prompt used for this process is shown in Fig. 7. The model outputs a JSON containing a list of objects where each object contains a class label, an instance id, the description, and the location of the object. Then, we check whether the descriptions for all the objects are generated or not. For objects whose descriptions are missing, we sample images of those objects by rendering the objects from camera positions close to it. Once we have the descriptions of all the objects, we use a validation prompt as shown in Fig. 8, where we send descriptions and the video to ask the VLM to correct any incorrect descriptions.
8.2.2 Hierarchy Generation
Our Hierarchy Generation is a multi-step process. The steps are designed to produce a spatially and semantically grounded scene hierarchy.
In the first pass of this process, we group the objects together based on their label names and proximity/location of their bounding boxes. For example, if many objects with label book are close in the scene, they are grouped together in a books label. Because objects that share a label can still be visually distinct, wherever possible an annotator manually splits such a group into separate sub-groups, for example separating a tray of chocolate croissants from a tray of strawberry tarts even though both instances carry the label pastry. Additionally, we check for spatial relationships that can be derived from bounding box information. For example, if a wardrobe object has cloth, ornament and other such objects inside of it, they all will be grouped in a wardrobe and its parts label. This process continues until all objects are associated with one of the 3 parent classes: Floor, Wall, or Ceiling.
On the second pass, we take this algorithmically generated hierarchy, along with the object description json and video of the subregion and feed it to a VLM with the hierarchy generation prompt as shown in Fig. 10. This then gives us the hierarchy structure for each of the divided subregion.
We then join these hierarchies under a same parent node, and the description and label of this node is generated by providing the VLM with the scene video and the description of the immediate child objects of the root node. The prompt for generation of scene description is shown in Fig. 9.
Finally, to ensure proper grounded descriptions, we query whether each inner node has the mention of its immediate children or not and generate a list of ungrounded objects and its parent description that should contain them. Then, we provide the VLM with this information along with the subregion video to ensure proper grounded description at every level of the hierarchy. The prompt used for ensuring grounding in descriptions is shown in Fig. 11.
8.2.3 Existence Based Questions
For each unique object label in the scene (e.g., cushion, painting), all instances sharing that label are first aggregated into a single group, and two questions are generated per group, one positive and one negative. The positive question targets an attribute present in at least one instance of the group, while the negative question targets a plausible distractor attribute that is physically possible for the object category but visually absent from every instance in the group. This visual dependency constraint ensures that negative questions cannot be answered by common sense alone and require genuine visual inspection. As shown in Fig. 13, only attributes that require high-fidelity rendering to perceive are considered, while attributes such as shape, size, or object state are explicitly excluded. The annotators subsequently check all questions in the test set and correct them if needed.
8.2.4 Spatial Intelligence Based Questions
From the object descriptions, we use a label based filter to select objects that usually have high detailed visual features in them like paintings etc. After this we search for high detailed visual features key-words in the description of the objects to select additional objects. If there are multiple instances in a class then all instances are selected in this process. If there are multiple instances of an object class, then we render some representative images for each object. These images and the object descriptions are sent to a vision language model along with the prompt shown in Fig. 12 to generate unique referring expressions for each object in the class. Long free-form descriptions are converted into short, distinct referring expressions to refer to the objects. Additionally, we also extract the common features from the objects in this class during this step. The common features are used to create object count questions. We use the referring expressions together with the object geometry to generate the rest of the spatial intelligence questions (object size, absolute distance, relative distance, and relative direction). The ground-truth metric quantities for these questions (object dimensions and inter-object distances) are computed directly from the 3D object bounding boxes provided with the original datasets, ScanNet++ [48] and InteriorGS [34]. The questions are created using the same template as in this work [45]. The annotators subsequently check all questions in the test set and correct them if needed.
8.2.5 Reasoning Based Questions
Reasoning-based questions test deep spatial, functional, and causal understanding of the scene, going beyond simple attribute or count queries. As shown in Fig. 14, the VLM is provided with the scene video and the full scene hierarchy JSON, and is tasked with generating at least one question from each of 12 distinct reasoning categories. These categories span a broad spectrum of inferential difficulty, ranging from high-level narrative synthesis to fine-grained physical reasoning.
To ensure that answers are grounded in observable evidence rather than free-form speculation, each question is accompanied by a structured reasoning chain that follows a strict observational protocol, progressing from a broad scene overview down to specific object-level details, before arriving at an inference and final synthesis. Object instance IDs from the scene hierarchy are explicitly referenced at each step to anchor the reasoning in the scene’s spatial structure.
8.2.6 Question Attribute and Level
For each existence question we record which visual feature of the referenced object class the question probes; this may itself be more than one feature (e.g. color and material). For spatial intelligence questions the situation is richer: every referring expression carries its own list of features, and a question is built from several referring expressions, so it is associated with the features of multiple objects. This attribute mapping drives the statistics in Tabs. 8 and 9 and the fine-grained comparison in Fig. 6. Questions probing multiple attributes are counted redundantly across all relevant attribute categories for both existence and visual-spatial intelligence tasks. Furthermore, from the hierarchical descriptions of the objects in the scene, we can determine the depth level associated with each object. We use the maximum level over all the objects associated with a question as the level of that question. We present the level-based breakdown for existence and visual-spatial intelligence questions in Fig. 6.
9 Data Statistics
| Question type | Test | Train | Total |
|---|---|---|---|
| Existence | 1,470 | 4,300 | 5,770 |
| Count | 1,174 | 4,073 | 5,247 |
| Object Size | 678 | 2,750 | 3,428 |
| Absolute Distance | 583 | 2,187 | 2,770 |
| Relative Distance | 646 | 2,516 | 3,162 |
| Relative Direction | 291 | 1,577 | 1,868 |
| Reasoning | 2,371 | 8,908 | 11,279 |
| All types | 7,213 | 26,311 | 33,524 |
| Sub-category | Test | Train | Total | |
| NCS | Narrative and Contextual Synthesis | 203 | 743 | 946 |
| BWA | Behavior and Workflow Analysis | 195 | 741 | 936 |
| DCI | Design and Curation Intent | 203 | 743 | 946 |
| TFA | Temporal Forensic Analysis | 208 | 744 | 952 |
| FGA | Functional and Goal-Oriented Analysis | 195 | 743 | 938 |
| CA | Comparative Analysis | 195 | 742 | 937 |
| CR | Counterfactual Reasoning | 195 | 742 | 937 |
| AAA | Anomaly and Absence Analysis | 197 | 742 | 939 |
| DOM | Dependent Object Manipulation | 195 | 742 | 937 |
| SLC | Structural Load and Capacity | 195 | 742 | 937 |
| FOA | Functional Occlusion and Accessibility | 195 | 742 | 937 |
| SHP | Systemic Hazard Propagation | 195 | 742 | 937 |
| All reasoning | 2,371 | 8,908 | 11,279 | |
| Feature bucket | Test | Train |
|---|---|---|
| color | 496 | 1,626 |
| material | 645 | 2,286 |
| texture | 81 | 270 |
| text | 92 | 82 |
| depicted content | 259 | 221 |
| lighting properties | 29 | 84 |
| questions | 1,470 | 4,300 |
| Count | Obj. Size | Abs. Dist. | Rel. Dist. | Rel. Dir. | ||||||
|---|---|---|---|---|---|---|---|---|---|---|
| Feature bucket | Test | Train | Test | Train | Test | Train | Test | Train | Test | Train |
| color | 771 | 2,994 | 543 | 2,251 | 553 | 2,062 | 646 | 2,514 | 286 | 1,532 |
| material | 497 | 1,862 | 260 | 1,035 | 347 | 1,249 | 571 | 2,151 | 230 | 1,120 |
| texture | 314 | 1,176 | 121 | 467 | 178 | 619 | 345 | 1,220 | 149 | 629 |
| text | 361 | 1,327 | 147 | 560 | 214 | 750 | 406 | 1,471 | 164 | 728 |
| depicted content | 365 | 1,544 | 182 | 735 | 268 | 984 | 462 | 1,805 | 139 | 980 |
| lighting properties | 21 | 92 | 6 | 28 | 18 | 55 | 29 | 107 | 8 | 56 |
| Other | 223 | 615 | 112 | 520 | 218 | 773 | 343 | 1,409 | 104 | 816 |
| questions | 1,174 | 4,073 | 678 | 2,750 | 583 | 2,187 | 646 | 2,516 | 291 | 1,577 |
Table 6 summarizes the composition of the benchmark. The dataset contains 33,524 question–answer pairs (7,213 test and 26,311 train) drawn from 966 scenes: 584 real-world scenes from ScanNet++ [48] and 382 synthetic scenes from InteriorGS [34], split into 766 training and 200 held-out test scenes. Reasoning is the largest category (11,279 questions); its per-sub-category counts are given in Tab. 7, where the twelve categories are seen to be sampled near-uniformly, one question per category per scene wherever possible.
Tables 8 and 9 report which features are used to pick out the objects each question refers to. A question that names two features (e.g. a white marble vase, referenced by color and material) is counted under both, so a question can appear in more than one row and a column need not sum to the question total.
Each Existence question probes a single visual feature of the referenced object class. Color and material are more frequent compared to texture, depicted content, text, and lighting properties attributes. Visual–Spatial Intelligence questions contain multiple objects referred to by different visual attributes, and attributes besides color and material are also well represented. Entries in the Other category primarily contain non-visual properties, such as object positions.
10 Additional Results
10.1 Reasoning Text-Similarity Metrics
Table 11 reports the n-gram and consensus-based text-similarity metrics for the free-form reasoning answers, complementing the LLM-as-a-judge ratings reported in the main paper. Across both datasets, the agentic method CoV and the fine-tuned GeoThinker produce answers that most closely match the ground-truth phrasing, with GeoThinker (Finetuned) achieving the highest BLEU-1, CIDEr, METEOR, and ROUGE-L scores on both ScanNet++ and InteriorGS. Conversely, the dense-video VLM (Gemini) scores lower on text-based metrics despite being the top-performing model under the LLM-as-a-judge evaluation. This discrepancy is likely due to Gemini’s responses being significantly longer because they contain more detailed step-by-step reasoning than those of other models (Table 10), which is penalized by n-gram matching scores.
| Mean | Median | |
|---|---|---|
| Ground-truth answer | 31.6 | 31 |
| Gemini Video (Basic) | 129.7 | 88 |
| CoV | 37.3 | 36 |
| GeoThinker (16 frames) | 29.9 | 23 |
| GeoThinker (Finetuned) | 28.7 | 29 |
| ScanNet++ | InteriorGS | ||||||||||
| Method | B1 | B4 | C | M | R-L | B1 | B4 | C | M | R-L | |
| Gemini-Based Models | |||||||||||
| Video (Basic) | 10.32 | 1.83 | 6.79 | 13.58 | 16.03 | 12.45 | 2.33 | 7.88 | 15.19 | 18.15 | |
| Video (CoT) | 11.16 | 1.55 | 3.03 | 11.81 | 12.53 | 10.74 | 1.50 | 4.06 | 13.71 | 15.96 | |
| Panoramic | 8.92 | 1.60 | 3.58 | 14.03 | 16.01 | 9.80 | 1.63 | 6.41 | 14.51 | 17.29 | |
| Qwen-Based Models | |||||||||||
| Video (Basic) | 6.88 | 1.32 | 0.00 | 12.38 | 11.69 | 7.48 | 1.35 | 0.00 | 12.57 | 12.62 | |
| Panoramic | 5.56 | 1.08 | 0.00 | 10.98 | 9.22 | 5.34 | 1.01 | 0.00 | 10.85 | 8.91 | |
| Agentic Methods | |||||||||||
| CoV | 28.27 | 5.24 | 23.00 | 15.14 | 23.10 | 27.21 | 4.80 | 19.82 | 14.83 | 22.54 | |
| Think3D | 1.38 | 0.25 | 2.58 | 2.92 | 4.05 | 0.47 | 0.09 | 2.69 | 2.76 | 4.26 | |
| Geometry Integrated VLMs | |||||||||||
| GeoThinker (16 frames) | 22.12 | 3.88 | 14.27 | 10.25 | 18.74 | 25.96 | 4.67 | 16.46 | 11.53 | 20.42 | |
| GeoThinker (Finetuned) | 35.52 | 9.81 | 58.53 | 16.19 | 30.44 | 36.01 | 0.97 | 61.73 | 16.52 | 31.52 | |
10.2 Granular Performance Breakdown
Figure 6 presents model performance along two axes: the visual attribute a question probes, and the depth of the referenced object in the scene hierarchy. In visual-attribute recognition, video-based VLMs are consistent across all attribute categories, indicating a robust ability to perceive fine-grained visual detail; GeoThinker reaches a comparable profile only after fine-tuning on our data. Along the hierarchy-depth axis, most models perform well up to levels 4–5 and struggle at higher depths. Video (CoT) and GeoThinker (Finetuned) are the only methods that retain accuracy at the deepest (leaf) levels.
10.3 Results of GeoThinker with more frames
10.4 Frame Usage Across Methods
Table 15 reports the average number of frames consumed per question for all evaluated methods. Non-agentic methods such as Video (Basic) consume a fixed frame budget determined entirely by the video length, resulting in substantially higher frame counts (165–330 frames on ScanNet++). In contrast, agentic and geometry-aware methods operate on much smaller budgets. GeoThinker uses a fixed number of frames regardless of scene complexity (16, 32 or 64), while CoV [52] adaptively selects frames based on the scene, consuming an average of 18.6 and 20.34 frames on ScanNet++ and InteriorGS, respectively. The CoV frame count consists of three components: 16 fixed frames for initial view selection, 1 Bird’s Eye View (BEV) frame, and a small number of additional adaptive frames (2.6 on ScanNet++, 3.34 on InteriorGS). Think3D [51] uses 16 uniformly sampled image frames. Besides this it also samples some frames internally from the video.
| ScanNet++ | InteriorGS | ||||||||
|---|---|---|---|---|---|---|---|---|---|
| Method | Prec | Rec | F1 | Acc | Prec | Rec | F1 | Acc | |
| GeoThinker (16 frames) | 0.60 | 0.86 | 0.71 | 0.65 | 0.66 | 0.77 | 0.71 | 0.67 | |
| GeoThinker (32 frames) | 0.61 | 0.85 | 0.71 | 0.66 | 0.61 | 0.79 | 0.69 | 0.63 | |
| GeoThinker (64 frames) | 0.62 | 0.84 | 0.71 | 0.67 | 0.63 | 0.79 | 0.70 | 0.65 | |
| ScanNet++ | InteriorGS | |||||||||
|---|---|---|---|---|---|---|---|---|---|---|
| Method | Cnt | Sz | Abs | Rel-D | Rel-Dir | Cnt | Sz | Abs | Rel-D | Rel-Dir |
| GeoThinker (16 frames) | 0.19 | 0.57 | 0.33 | 0.47 | 0.51 | 0.24 | 0.48 | 0.16 | 0.28 | 0.36 |
| GeoThinker (32 frames) | 0.27 | 0.59 | 0.33 | 0.52 | 0.53 | 0.27 | 0.50 | 0.22 | 0.27 | 0.40 |
| GeoThinker (64 frames) | 0.29 | 0.58 | 0.35 | 0.51 | 0.54 | 0.30 | 0.50 | 0.20 | 0.29 | 0.40 |
| ScanNet++ | InteriorGS | ||||||||||
|---|---|---|---|---|---|---|---|---|---|---|---|
| Method | B1 | B4 | C | M | R-L | B1 | B4 | C | M | R-L | |
| GeoThinker (16 frames) | 25.98 | 4.77 | 18.19 | 11.52 | 20.90 | 27.89 | 5.24 | 18.91 | 12.43 | 22.32 | |
| GeoThinker (32 frames) | 27.06 | 4.81 | 18.68 | 11.91 | 21.33 | 27.85 | 5.27 | 20.16 | 12.54 | 22.61 | |
| GeoThinker (64 frames) | 27.17 | 4.79 | 19.31 | 12.17 | 21.63 | 27.65 | 5.09 | 19.84 | 12.71 | 22.68 | |
| ScanNet++ | InteriorGS | ||
| Method | Frames | Frames | |
| Gemini-Based Models | |||
| Video (Basic) | 165 | 177 | |
| Qwen-Based Models | |||
| Video (Basic) | 330 | 354 | |
| Agentic Methods | |||
| CoV | 16+1+2.6 | 16+1+3.34 | |
| Think3D | 16* | 16* | |
| Geometry Integrated VLMs | |||
| GeoThinker | 16,32,64 | 16,32,64 | |
| GeoThinker (Finetuned) | 16 | 16 |
11 Human Evaluation Interface
We developed a user rating interface using the viser library to facilitate a seamless evaluation of 3D scene-specific QA pairs. The interface streamlines the assessment process by providing a dynamic 3D environment where users can interactively verify model outputs.
User and Scene Management.
Upon initializing the interface, users must either create a unique profile or log in to an existing one to track their progress and save ratings (Fig. 23). A dropdown menu allows users to switch between different scenes, which dynamically loads the corresponding Gaussian Splatting data and labels. Once a scene is active, the interface populates a flattened list of questions sampled for that specific environment. Users navigate through these pairs using “Next Question” and “Previous Question” buttons, which automatically update the 3D visualization, camera focus, and sidebar information.
Visualization and Feedback.
To assist users in rapid identification, the system overlays object labels and 3D bounding boxes directly onto the scene, employing a color-coded highlighting scheme based on the question type. For existence and count queries, the system highlights target objects in green and contextually relevant objects of the same class in yellow, as illustrated in Fig. 24 and Fig. 25. In size and absolute distance tasks, all referred objects appear in green (Fig. 26). Relative distance questions utilize a cyan box for the reference object, while highlighting the correct choice in green and incorrect choices in red. For relative direction, the interface distinguishes between the origin (blue), target (cyan), and selected (green) objects (Fig. 24). Conversely, for reasoning tasks, the interface provides no automated highlighting; instead, users are encouraged to explore the 3D scene freely to verify the complex logic presented in the sidebar (Fig. 27). After evaluating a pair, users assign a rating from 1 to 5, which is then stored in their local user profile.
Question Distribution.
The user study involves a curated selection of 100 questions sampled from 10 different scenes. This sample set includes some perturbed samples as well. The specific details regarding task types and their corresponding sampled and perturbed counts are provided in Tab. 16.
Sample Perturbation.
To evaluate model robustness, we systematically perturb a subset of the questions across all task categories. For existence queries, we flip the ground truth by changing a “Yes” question to “No” or vice versa. In counting tasks, we modify the question by adding or removing instances of the target class, or we alter the question’s descriptive attributes—for example, changing “red chair” to “black chair”—to invalidate the original count.
For absolute distance and size tasks, we perturb the ground truth by multiplying or dividing the numeric value by a random factor between 5.0 and 10.0. For relative direction and relative distance tasks, we reassign the ground truth to a logically incorrect option. Finally, for reasoning triplets, we utilize a Large Language Model (LLM) to rewrite valid questions into plausible but logically flawed alternatives. While the question text remains unchanged, the answers are rendered incorrect by referencing objects that do not exist in the scene or by modifying the reasoning steps to lead to erroneous answers.
User Study Results.
The user study included 7 people. As illustrated in the main paper, the users have given the clean samples a high average rating and a consistently better score than the perturbed samples. The difference is particularly noticeable for relative distance and relative direction, questions that humans find easier to answer. The gap between the perturbed and real samples is much smaller for questions like absolute distance and object sizes, which are generally harder questions to answer as they require users to guess.
| Task Type | Total Sampled | Perturbed Samples |
|---|---|---|
| Existence | 14 | 2 |
| Counting | 14 | 3 |
| Object Size | 13 | 3 |
| Absolute Distance | 13 | 3 |
| Relative Distance | 13 | 3 |
| Relative Direction | 13 | 3 |
| Reasoning | 20 | 3 |
| Total | 100 | 20 |
12 Qualitative Results
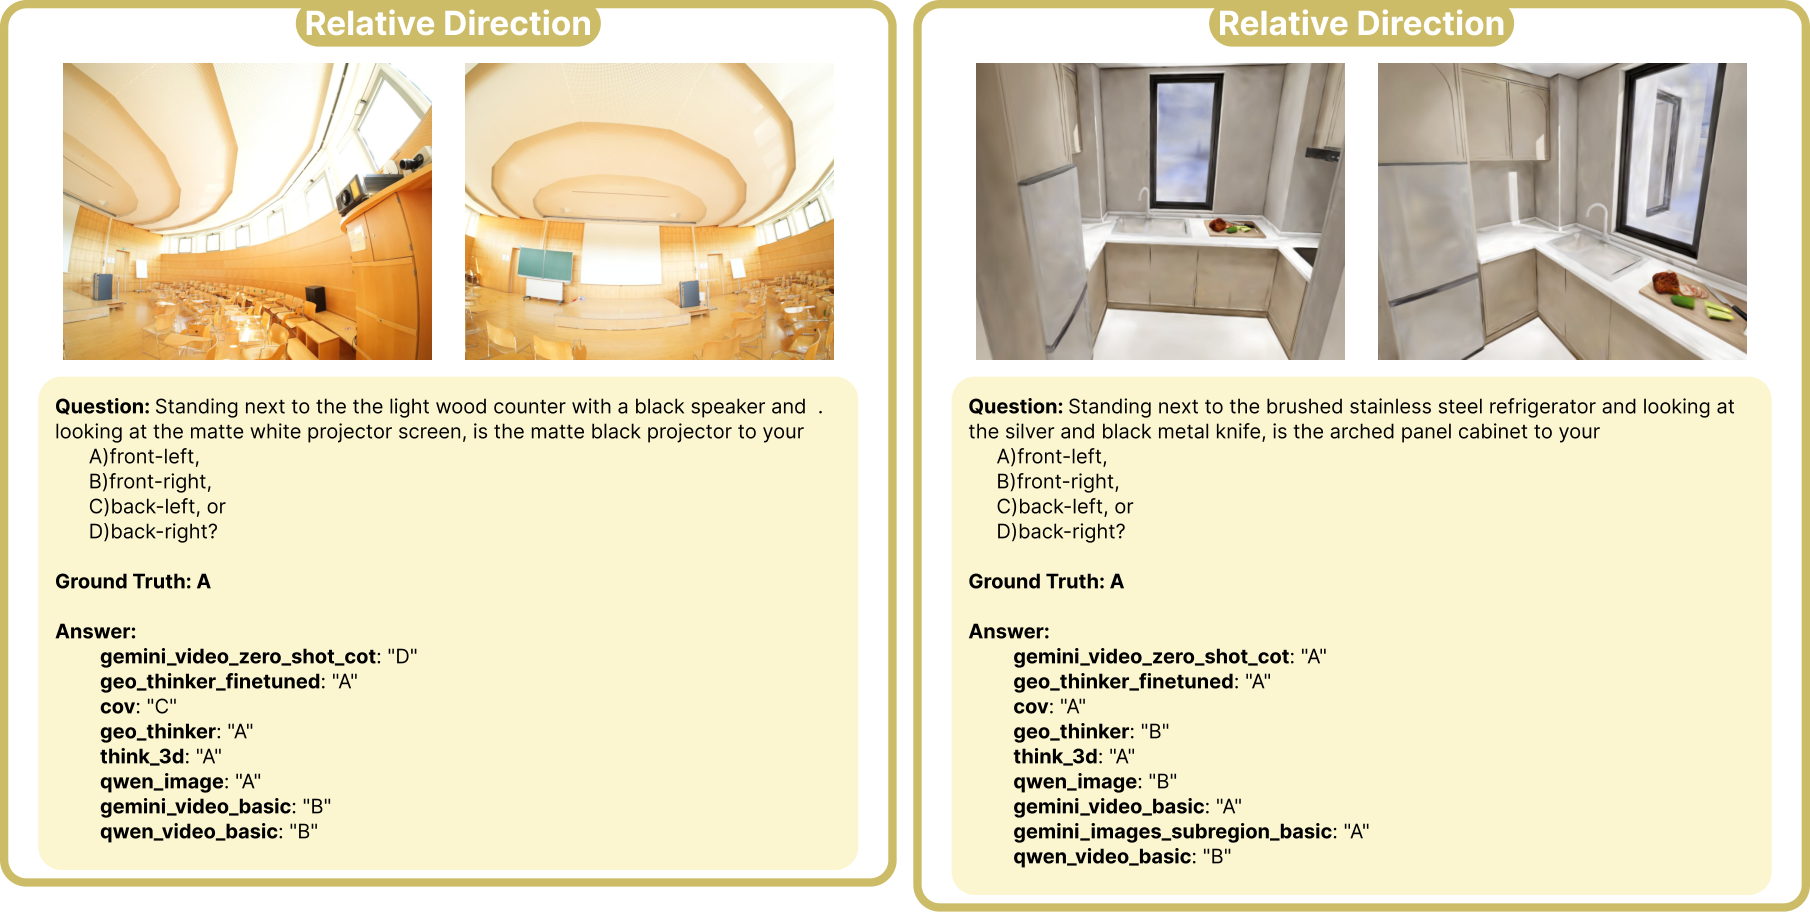
We present qualitative results for several methods across all task categories. Figure 20 shows the results for existence type questions. Figure 15, Fig. 16, Fig. 17, Fig. 18 and Fig. 19 show results for spatial intelligence type questions.
Figure 21 and Fig. 22 present results for the 12 total types of reasoning tasks, displaying one example for each type across the two figures (6 types in each figure). In these reasoning questions, we compare the performance of Gemini Video Basic, CoV, GeoThinker, and GeoThinker-finetuned. For reasoning answers of Gemini involving long text, we use ellipses to maintain conciseness and visual clarity.