FrankenReport: Early Exiting in Long-Form Generation
Using Expected Value of Computation
Abstract
While deep research systems address interactive information-seeking needs impressively, their real-world deployments face latency and resource-consumption challenges. We present FrankenReport, an interface for long-form knowledge-seeking report generation that supports adaptive early exiting per section: it evaluates intermediate outputs during generation and predicts whether further targeted computation will yield significant quality gains. In a simulation study, FrankenReport outperforms random allocation baselines by a large margin (up to ) under low budgets and smoothly recovers full-pipeline quality as the budget grows, showing that future quality gains are predictable from intermediate drafts. Through experiments and user studies, we further show that despite varying preferences across users and topics, FrankenReport adapts to simple, natural user feedback as efficiently as methods requiring much costlier supervision such as generated drafts and explicit rationales.
1 Introduction
Deep research systems generate structured, multi-section long-form responses—often called reports—that resemble Wikipedia-style articles and include explicit citations (Shao et al., 2024; Qian et al., 2023; Walden et al., 2026). Recent systems such as OpenAI Deep Research, Gemini Deep Research, and DeerFlow illustrate the growing deployment of multi-step research agents in knowledge-intensive settings (OpenAI, 2025a; Google, 2025; ByteDance and Contributors, 2025; Fan et al., 2025). These capabilities rely on iterative retrieval and reasoning pipelines that incur substantial computational and monetary cost, and lead to latency for the user.
| Case | Low Effort | High Effort | Action |
| Jimmy Zavala | Insufficient information available regarding early life and career details… | Born July 12, 1955. Influenced by Junior Walker and King Curtis, shaping his style… | Run (Knowledge) |
| Sahara Desert | The Sahara Desert is the world’s largest hot desert, covering approx 9.2M sq km across North Africa… | The Sahara is the largest hot desert… spanning approx 3000 miles East to West across 11 countries… | Stop (Marginal) |
| GlycoBlue | GlycoBlue acts as a PCR additive to improve yield and specificity of reactions… | It enhances the visibility of DNA bands during electrophoresis and stabilizes the mixture… | Stop (Unhelpful) |
High computational cost does not guarantee better user-perceived quality. In interactive systems, response latency itself shapes perceived quality and usage intentions (Gnewuch et al., 2022), while expressed confidence can influence users independently of substantive accuracy (Ma et al., 2024; Xu et al., 2025; Fernandes et al., 2026; Li et al., 2025a; Wang et al., 2025b). Consequently, additional compute frequently yields diminishing returns. Users prioritize speed, tolerating delays only for noticeable, justified improvements (Abbas et al., 2022; Zhang et al., 2024; Wang and Lo, 2025).
This motivates a core control problem: determining when extra compute meaningfully improves perceived quality. While early exiting succeeds in Transformer inference (Xin et al., 2020; Xin et al., 2021), report generation differs from classification. Unlike binary correctness, the marginal value of generative compute is subjective and multi-dimensional, making a priori resource allocation difficult.
Our approach is motivated by a simple observation: deep research pipelines produce informative intermediate artifacts: outlines, gists, and partial drafts that already capture much of the final report’s value. These outputs provide early signals of organization, coverage, and factual grounding. Building on this, we introduce FrankenReport, a progressive report generation interface that surfaces increasingly refined intermediate results, starting from a lightweight sketch and incrementally improving as execution proceeds, while a fine-tuned LLM with a regression head predicts the scale of the potential quality improvements to enable adaptive early exiting for more efficient generation. The name reflects how the final report is assembled by section from components that may have undergone different depths of refinement.
Our experiments show that even the earliest structural sketch provides strong predictive signals: our regression model can predict a quality gap on multiple dimensions much more effectively from seeing this sketch than from the query alone (Table 4), and achieve greater quality improvements under limited computation budget as compared to a random exiting baseline (Figure 3). A 100-participant study confirms that user preferences are diverse but are learnable, demanding personalized computation budget allocation. We show that FrankenReport adapts to diverse preferences with sample efficiency comparable to methods requiring much costlier supervision (e.g., full drafts or rationales).
2 Related Work
We target single-turn, deep research workflows spanning applications such as business analysis, market research, and clinical summarization (Xu and Peng, 2025). Deployed systems explicitly pair comprehensive reports with short turnaround times (Perplexity Team, 2025), motivating compute-aware generation strategies.
2.1 Early Exiting in Transformer Models
Early exiting augments deep networks with intermediate classifiers that halt inference once confidence is sufficient, originating in vision models (Teerapittayanon et al., 2016) and later adopted in Transformers. Analyses of decoder-only LLMs show that shallow layers already encode many correct predictions (nostalgebraist, 2020; Belrose et al., 2023), and methods such as DeeBERT, FastBERT, and PABEE demonstrate large latency reductions with minimal accuracy loss (Xin et al., 2020; Liu et al., 2020; Zhou et al., 2020). Subsequent work extends these ideas to parameter-efficient tuning, adaptive routing, RL-based exit policies, and large-scale generation (Xin et al., 2021; Liu et al., 2023b; Hu et al., 2023; Gao et al., 2023; Zeng et al., 2024).
2.2 Early Exiting from Reasoning Chains
As extended reasoning chains have become common in LLM applications and can be computationally expensive, recent work targets truncating the reasoning chain itself, instead of early exiting from the network. Jurayj et al. (2025) find that increasing test-time compute raises confidence on correct responses. Early-stopping approaches such as ES-CoT (Mao et al., 2025), HALT-CoT (Laaouach, 2025), and LEASH (Quamar and Areeb, 2025) exploit intermediate-answer convergence, answer entropy, or token-level logits to decide when to stop. Other approaches include REFRAIN (Sun et al., 2026), which detects reflective but redundant reasoning and adapts its stopping threshold with a bandit controller, or using injected exit instructions or an extrinsic completion verifier to decide when to stop (Lu et al., 2025).
2.3 Semantic Routing for LLM Cascades
Prior work routes queries among models of varying capability to balance cost and quality. FrugalGPT (Chen et al., 2024) escalates to stronger models only when needed; learned routers predict difficulty or adjust routing online (Ding et al., 2024; Ding et al., 2025); and other methods route by semantic intent (Hari and Thomson, 2023) or apply multi-agent refinement selectively (Chen et al., 2025). Complementary approaches escalate when outputs disagree (Yue et al., 2024; Kolawole et al., 2025; Soiffer et al., 2025), estimate uncertainty via semantic entropy or confidence tokens (Zhang et al., 2025; Li et al., 2025b), or combine routing with speculative computation (Narasimhan et al., 2025). Similar principles now appear in deployed systems such as GPT-5 (OpenAI, 2025b).
2.4 Wikipedia-style Report Generation
We build on the STORM pipeline (Shao et al., 2024). STORM extracts perspectives on a knowledge-seeking query and runs parallel dialogue threads between a Questioner and a Topic Expert (both LLM agents); over turns the Questioner issues search queries and the Expert retrieves and summarizes documents. The passages are then aggregated into an outline and expanded into section-level prose.
We formulate budgeted early exiting for multi-stage, tool-augmented pipelines such as STORM, jointly deciding when and where to spend compute across sections, refinement operators, and tool use. Building on prior work, our work contributes: (1) Problem formulation: constrained resource allocation over sections and refinements instead of per-token or per-layer stopping; (2) Method: a future-utility predictor that estimates per-section quality gains from further refinement and guides selective computation and early termination (Figure 1); and (3) Evaluation: quality-cost trade-off curves that characterize budget-allocation performance, especially in low-budget regimes, across user-relevant quality dimensions.

3 FrankenReport
FrankenReport improves computation utility by devoting different levels of compute to each section of a report. We start by modifying the STORM pipeline to be a sequence of steps gradually refining a coarsely drafted section gist as shown in Figure 1; thus, drafts at different steps can be directly consumed by an end user if the quality is sufficient. An action predictor monitors these intermediate drafts and predicts whether further computation is likely to improve perceived quality, providing the hooks needed for confidence-aware early exits and personalized latency-quality trade-offs.
Given a user query , which is a knowledge-seeking request, the deep research system produces a structured report consisting of multiple sections . A configuration fully specifies how a system should be applied to a given query. Different configurations of —for example, selecting which modules to run or how many reasoning steps to perform—lead to different outputs and computational costs. In this work, the configuration subspace is described in § 3.1. To adapt these choices dynamically, we introduce an orchestration policy
which maps each query (and optionally the current model state ) to a configuration . Running system under this configuration is represented by the operator
We define a quality function , which measures qualitative dimensions like the usefulness or factual quality of a generated report for a given query, and a cost function , which captures the time or compute required to run . In all experiments, is a normalized, latency-calibrated stage cost rather than an API-token count: promoting a section from Sketch to Verify costs one unit and promoting it from Sketch to Expand costs roughly four. These weights follow the empirical mean transition-time ratio in our logs. On the rough wall-clock timeline in Figure 1, the zero-cost base corresponds to the approximately 16-second Sketch checkpoint, the one-unit promotion to the approximately 24-second Verify checkpoint, and the four-unit action to completing the full Expand path. The simulator sums these promotion units to impose a common allocation budget across sections.
This distinction matters in deployment. Sections and later-stage work can overlap, and we launch the next stage speculatively while the lightweight regression-head predictor runs off the critical path, aborting that work if the predictor chooses to stop. Parallel and speculative execution can reduce user-perceived waiting time without actually reducing the aggregate work done by models; only refinements that are never launched or are terminated early reduce both latency and actual compute. Accordingly, our curves measure quality under a latency-calibrated allocation proxy, not exact token, energy, or GPU-hour savings.
The objective of FrankenReport is to learn an orchestration policy achieving the best expected report quality while staying within an average computational budget :
| (1) | ||||
This budgeted form directly matches the simulation in Figure 3. In a deployment where no hard cap is required, the same trade-off can instead be expressed as reward minus a user-specific cost penalty; § 4.4 learns the quality side of that preference from online feedback.
3.1 Step-wise Report Generation
We factor into three ordered stages. The report after each stage is denoted by . Choosing a configuration then amounts to deciding which stages to execute, trading off the quality gain measured by against the .
For each query , we first retrieve a document set using only the user prompt. The retriever produces top-level section gists that summarize the intent of the final report while remaining inexpensive because they avoid the multi-turn dialogue of the original STORM workflow, a modification we call gist-priming. We allocate the evidence-gathering threads evenly across the gists so that the orchestrator can later decide, at section granularity, whether to continue or to stop. The resulting pipeline is illustrated in Figure 2, which exposes three early-exit options:
Sketch
produces directly from the parametric knowledge of , conditioned on the gists . It minimizes latency but omits section-level evidence retrieval and grounding.
Verify
extends to the fact-checking stage and yields . Each section performs a single retrieval round guided by its Sketch draft and gist , mirroring outline-driven RAG without invoking the full dialogue planner.
Expand
further runs the complete STORM workflow and outputs . Multi-turn dialogue retrieval proceeds independently for each section.
Figure 1shows that with gist-priming, Sketch and Verify outcomes can be provided to a user much faster, even before the standard STORM outline can be formed. This allows more aggressive compute savings when the action predictor decides to early-exit.
3.2 Score-based Orchestration
We collect execution logs consisting of tuples and the corresponding costs for each section . For with preceding , we estimate the marginal quality gained by advancing from to ,
and pair it with the cost difference
Here, is section ’s contribution to the total cost when it exits at stage . We define the expected value of computation for advancing from to as the conditional expected marginal gain
which the policy considers together with the transition cost under the overall budget.
An LLM with a regression head, denoted , encodes the input tuple and estimates this conditional expected gain. Because later stages consume earlier drafts, the orchestration policy can encode in addition to the query without additional generation cost.
3.3 User Interface Design
The user interface mirrors the staged decomposition of and surfaces the evolving report as soon as each stage finishes. FrankenReport comes with an intuitive UI to allow users to interact with and give feedback on these stage outputs, as shown in Figure 6 in Appendix A. A progress ribbon highlights the currently available drafts from , while deeper reasoning continues in the background. This streaming view keeps users anchored in the report structure defined by the gists without waiting for the full STORM dialogue to resolve.
If for the initial draft , the estimated marginal gain leads the orchestration policy to decide that further computation is not worthwhile, later stages and are neither run nor shown. A fixed threshold can target a budget estimated from pilot runs; § 4.4 instead adapts exit decisions online to user preferences. When the projected gain justifies additional compute, the interface prefetches stages further down the pipeline, further reducing the latency perceived.
Once a draft from any early-exiting point (or full execution) is ready, the user can view that draft in a side panel as shown in Figure 7. The Verify and Expand generation is usually paired with citations, and the user can choose to replace the first draft from Sketch with any of them.
4 Experiment Results
We evaluate our adaptive exiting framework through three research questions: RQ1. Does increased compute (deeper polishing, richer retrieval) improve long-form quality? RQ2. Can the orchestrator reliably predict these gains early? RQ3. Which quality dimensions do users prioritize, and how can we adapt to them? We address these below using datasets, ablations, predictive modeling, and human preference analysis.
4.1 Datasets
We draw topics and entities from five established long-form generation datasets to study staged generation and budget allocation over Sketch/Verify/Expand drafts. The collection emphasizes newer topics lacking complete Wikipedia coverage while retaining a subset representative of typical user queries: all 100 FreshWiki topics (the in-distribution source introduced with STORM) plus 900 prompts sampled from four larger auxiliary pools (1,000 prompts and 17,106 section-level examples in total; see Table 2):
LongFact (LF) (Wei et al., 2024) provides GPT-4-generated information-seeking queries that elicit multi-paragraph responses; we sample 100 prompts from its “LongFact-Objects” subset. FActScore (FS) (Min et al., 2023) contains Wikipedia biographies at varied popularity levels, from which we sample 100 topics. Core (CORE) (Jiang et al., 2025b) targets factuality over a broader topic set that avoids overlap with FS; we sample 200 topics. WildHallucinations (WH) (Zhao et al., 2024b; Zhao et al., 2024a) draws WildChat topics checked for Wikipedia coverage; we sample 500 entities without Wikipedia pages. FreshWiki (FW) (Shao et al., 2024) is the STORM Wikipedia-article dataset; we use all 100 recently-edited, multi-section topics.
| CORE | FS | FW | LF | WH | ||
| #D | 200 | 100 | 100 | 100 | 500 | |
| #S | 3459 | 1761 | 1686 | 1749 | 8451 | |
| S/D | 17.3 | 17.6 | 16.9 | 17.5 | 16.9 | |
| T/S | Ske | 390.7 | 297.9 | 409.6 | 441.3 | 400.0 |
| Ver | 439.5 | 414.4 | 451.4 | 475.8 | 464.7 | |
| Exp | 999.4 | 882.0 | 1026.7 | 1175.8 | 1110.1 |
For each dataset, we run our modified STORM pipeline with Llama-3.1-70B-Instruct (Grattafiori et al., 2024) to generate the three versions of outputs: Sketch (Ske), Verify (Ver), and Expand (Exp). We use Serper11 1 https://serper.dev/ as our search backend.
4.2 Quality Assessment
To determine the effect of additional compute on improving quality, we run five textual quality evaluation metrics on the generation derived from different early exiting points in Table 3. Later drafts with more compute tend to have higher quality.
Table 3reports aggregate trends across sections. Mean gains vary by metric and are modest for Coherence and Engagingness. Figure 3 evaluates how selectively allocating compute translates predicted gains into quality under fixed budgets. Verify also occasionally underperforms Sketch on style-oriented metrics: a single retrieval round can inject loosely relevant evidence and disrupt a fluent draft even while improving grounding, consistent with the ordering in Coherence ( vs. ) but not Factuality ( vs. ). Results with GPT-4.1 show that refinement margins also depend on the backbone’s base capability and metric ceiling (Appendix C).
| Metric | Range | Ske | Ver | Exp |
| Coherence | (1-5) | |||
| Engagingness | (1-3) | |||
| Organization | (1-5) | |||
| Informativity | ( 0) | |||
| Factuality | (0-1) |
LLM-as-a-Judge
We run multiple LLM-as-a-Judge metrics for textual qualities. These include Coherence, for which we use the prompt from the deepeval framework.22 2 https://github.com/confident-ai/deepeval We also write our own prompts for Engagingness and Organization, following the criterion-based LLM-as-a-judge protocol of Liu et al. (2023a) and the definitions used by Shao et al. (2024), as detailed in Appendix B.
Informativity
Following Jiang et al. (2025b), we use Conditional Pointwise Mutual Information (CPMI) to evaluate the informativity of the text. For a claim decomposed from a section ,
where is a set of trivial claims that can be assumed for the given section content. We use the model by Wang et al. (2025a) to estimate the conditional probability of each claim happening (Chen et al., 2020). 33 3 https://huggingface.co/Zhengping/conditional-probability-regression E.g., when generating claims for David Beckham, may include claims like “David Beckham is a person.” etc. While Jiang et al. (2025b) rely on manually written trivial claims, in our case since is generated from outline gist as described in § 3, we decompose to get . To avoid biases towards longer generation, the informativity of a section is calculated as
Where is the set of claims from .
Factuality
We estimate factuality using SAFE (Wei et al., 2024), a search-based FActScore variant (Min et al., 2023). To reduce the cost of large-scale web searches, we avoid full claim decomposition. While sentence-level search (e.g., VeriFastScore (Rajendhran et al., 2025)) offers limited speedup in our setting, accurate estimation still requires claim-level search. Consistent with prior work (Krishna et al., 2023), we find that sampling a small number of claims suffices (Appendix E). We therefore randomly sample up to 10 claims per section to compute the factuality score.
4.3 Predicting quality differences
Following §3.2, we finetune Llama-3.1-8B-Instruct (Grattafiori et al., 2024) with a regression head to predict the quality difference between drafts, using loss on score differences from execution logs across all datasets (up to 4 epochs, lr 5e-6, batch size 32, 8A100-80G; 8:1:1 train/dev/test split per dataset; best checkpoint by validation loss). For each quality assessment in § 4.2, we predict the gap using the user query (Q), the sketch (S), the verify draft (V), or both S and V as conditioning input, as shown in Table 4.
Quality differences across drafts are reasonably predictable before generation. Organization and Coherence show the strongest correlations overall, while Informativity and Engagingness are also predictable for some transitions; query-only Factuality prediction is especially weak. This is expected: coherence and organization deficits are detectable without external knowledge, while factual gains depend on integrating evidence that is not yet available at the time of prediction. The gap underscores the importance of faithful uncertainty expression (Jiang et al., 2025a), since hallucinations are harder to anticipate than abstention-induced gaps in structure or content.
The ES and ES,V rows predict different targets: the former estimates the total gain over the sketch, whereas the latter estimates the residual gain once is available. Because absorbs much of the predictable improvement over , the residual target is smaller, rarer, and noisier, accounting for its lower correlations.
Simulated Budget Allocation
We evaluate compute efficiency via a simulated allocation experiment. Given a fixed budget of additional normalized units across sections, we compare four operational baselines: (i) random-uniform, which samples an exit stage uniformly subject to feasibility; (ii) random-greedy, which randomly orders promotions and spends the remaining budget on the highest feasible stage; (iii) shortest-first, which promotes the currently shortest draft by one stage; and (iv) GPT-5-mini score, which zero-shot scores current drafts on the target quality dimension and promotes the lowest-scoring draft. The fixed always-Sketch/Expand policies are the two endpoints of the same action space; the upper endpoint corresponds to vanilla STORM (Shao et al., 2024) on every section. Per-layer, per-token, and per-answer early-exit methods in § 2.1 use a different action space from this report-level allocation setting. As shown in Figure 3, conditioning allocation on the sketch output yields the strongest low-budget gains across all three dimensions, including against the shortest-first and zero-shot LLM routers. For dimensions that are cheap to improve (e.g., Coherence), allocating only 10% of the budget recovers over 90% of full-STORM performance; for dimensions that benefit from extended exploration (e.g., Informativity), gains rise smoothly with added compute. Relative to random allocation, gains reach up to in the low-budget regime. The remaining two dimensions and full baseline definitions are in Appendix D.
| Aspect | Target Conditioning | MSE | ||
| Coherence | V Q | .353 | .170 | .670 |
| S Q | .307 | .072 | .724 | |
| V S | .746 | .326 | .371 | |
| E S | .697 | .234 | .415 | |
| E V | .302 | .304 | .339 | |
| E S, V | .071 | .070 | .509 | |
| Engagingness | V Q | .088 | .090 | .227 |
| S Q | .177 | .098 | .267 | |
| V S | .587 | .367 | .098 | |
| E S | .493 | .318 | .374 | |
| E V | .283 | .281 | .131 | |
| E S, V | .237 | .229 | .123 | |
| Informativity | V Q | .272 | .156 | .102 |
| S Q | .366 | .254 | .048 | |
| V S | .535 | .315 | .038 | |
| E S | .554 | .378 | .049 | |
| E V | .111 | .114 | .038 | |
| E S, V | .111 | .115 | .038 | |
| Factuality | V Q | .003 | -.005 | .060 |
| S Q | .000 | .016 | .072 | |
| V S | .149 | .080 | .081 | |
| E S | .281 | .254 | .070 | |
| E V | .315 | .291 | .102 | |
| E S, V | .289 | .252 | .090 | |
| Organization | V Q | .478 | .234 | .568 |
| S Q | .273 | .244 | .635 | |
| V S | .821 | .418 | .231 | |
| E S | .866 | .418 | .155 | |
| E V | .486 | .468 | .348 | |
| E S, V | .073 | .065 | .169 |
4.4 Online Learning from User Feedback
Using the same quality regression model, we can adapt to user preferences rather than fix the orchestration policy. Since users weight quality dimensions differently (e.g., some prefer brevity, others informativeness), we model each user as a preference vector , where is the weight on dimension . Running regression models for the metrics gives each draft a feature vector , and observing multiple drafts of a section , the user’s preference follows the ordering of the inner product
| (2) |
which translates to preference observations
To test how effective the policy is at adapting to a user preference vector, we randomly sample 10 simulated user preferences . We then fit a Bradley-Terry model to estimate with independent Gaussian prior. In each round, we now sample an action based on the current posterior to simulate one round of interaction with the user through our interface as discussed in § 3.3. The user then provides their feedback according to Equation 2. Figure 4 plots policy accuracy in predicting the user-preferred exit point against training steps: accuracy improves steadily and reaches a high level within 10 examples. Since a user can only see drafts before the predicted exit point (e.g., predicting Verify hides Expand), we add an “information weighting” term to encourage early exploration; Appendix F compares different information weights.
4.5 User Study
We conduct a user study collecting human quality assessments on the different early-exit drafts, reusing the 100 test prompts and generations from § 4.1. For each prompt we show a randomly shuffled set of the three generations per section and ask for a 1--5 overall-quality rating; across 100 participants, each annotation task covers 5 topic reports, and we also collect self-reported confidence and topic familiarity along with reasons for their highest/lowest rankings. Citations are removed from all drafts for fair comparison.44 4 As discussed in the introduction, users’ subjective quality judgments could be biased by surface-level cues. See Appendix G for details. Agreement among ratings was mild (Krippendorff’s ), improving slightly with higher average familiarity or confidence (Appendix G). Figure 5 shows how often each draft received the maximum score across familiarity levels. Later drafts are preferred more often overall, with Expand receiving the maximum score most frequently at every familiarity level. Sketch nevertheless remains preferred for a nontrivial subset of sections, motivating section-level early exiting.
Automated metrics vs. human ratings
We measure alignment between the automated dimensions and human judgments by fitting a linear combination of the five scores to predict aggregated human ratings on the same generations, yielding in-sample , Pearson , and Spearman . Automated metrics thus explain a meaningful but incomplete portion of perceived quality, supporting their use as a training signal alongside online personalization (§ 4.4) for residual user-specific variation.
Human-preference replay
We also replay the observed user sequence with a user-specific quality weighting initialized uniformly and updated only from that user’s previously annotated topics. This online, out-of-sample procedure improves the selected human rating by on the 1–5 scale over a fixed uniform weighting. Fitting all of a user’s annotations and back-assigning selections—an in-sample counterpart approximating stable preferences after several interactions—improves it by . Most participants annotated at most five topics, placing the online result in a low-data personalization setting.
| Acc | Acc (binary) | |
| Majority | .406 | .716 |
| GPT-5-mini | .649 | .811 |
| +familiarity | .640 | .815 |
| GPT-5.1 | .676 | .820 |
Inferring User Preferences
We further study whether preferences can be inferred from written reasons. For each user we use up to 10 annotated reports, hold out one for validation, and use an LLM to summarize the user’s preferences from the rankings and explanations of the rest, which have been demonstrated to provide useful feedback for preference learning (Jiang et al., 2026); this profile then predicts the preferred draft for each validation section once all drafts are available. Table 5 shows that real-world preferences are identifiable: an LLM conditioned on a user’s preference summary predicts future preferences far more accurately than a majority baseline. Figure 4 further shows the FrankenReport orchestrator reaches similar accuracy within 5 interaction rounds before any draft is generated, indicating efficient adaptation.
5 Conclusion
We present FrankenReport, an interface to a deep research pipeline that exposes intermediate drafts to reduce compute and latency by reliably estimating final draft quality from early signals. Under fixed costs, FrankenReport consistently outperforms random expansion baselines, and although real-world user preferences vary across topics while generally favoring later drafts, our adaptive orchestrator learns them online with modest budgets. Future work includes topic-conditioned features and extending the Sketch/Verify/Expand instantiation to variable-depth refinement under the same expected-gain accounting.
Limitations
We acknowledge several limitations in our work. First, our experiments focus exclusively on English-language report generation benchmarks, which does not guarantee generalization to other languages. Second, the magnitude and shape of staged quality gains depend on a model’s base capability and metric ceilings. Our full orchestration study uses Llama-3.1-70B-Instruct; the GPT-4.1 study in Appendix C shows that such gains persist outside the Llama family, but covers only non-search-backed metrics. Third, we model individual user preferences as a linear weighting over the five quality dimensions ; real user preferences can be nonlinear and context-dependent, and extending the formulation to richer (e.g., feature-interaction or contextual-bandit) preference models is a natural next step. Finally, we constrain our evaluation to reliably automatable metrics; future work incorporating heterogeneous or human-centric metrics may better capture real-world user preferences.
References
- Abbas et al. (2022) Tahir Abbas, Ujwal Gadiraju, Vassilis-Javed Khan, and Panos Markopoulos. 2022. Understanding user perceptions of response delays in crowd-powered conversational systems. Proceedings of the ACM on Human-Computer Interaction, 6(CSCW2):1–42.
- Belrose et al. (2023) Nora Belrose, Igor Ostrovsky, Lev McKinney, Zach Furman, Logan Smith, Danny Halawi, Stella Biderman, and Jacob Steinhardt. 2023. Eliciting latent predictions from transformers with the tuned lens. arXiv preprint arXiv:2303.08112.
- ByteDance and Contributors (2025) ByteDance and Contributors. 2025. Deerflow: Community-driven deep research framework. https://github.com/bytedance/deer-flow. Accessed: 2025-11-14.
- Chen et al. (2025) Justin Chen, Archiki Prasad, Swarnadeep Saha, Elias Stengel-Eskin, and Mohit Bansal. 2025. MAgICoRe: Multi-agent, iterative, coarse-to-fine refinement for reasoning. In Proceedings of the 2025 Conference on Empirical Methods in Natural Language Processing, pages 32651–32674, Suzhou, China. Association for Computational Linguistics.
- Chen et al. (2024) Lingjiao Chen, Matei Zaharia, and James Zou. 2024. FrugalGPT: How to use large language models while reducing cost and improving performance. Transactions on Machine Learning Research. Featured Certification.
- Chen et al. (2020) Tongfei Chen, Zhengping Jiang, Adam Poliak, Keisuke Sakaguchi, and Benjamin Van Durme. 2020. Uncertain natural language inference. In Proceedings of the 58th Annual Meeting of the Association for Computational Linguistics, pages 8772–8779, Online. Association for Computational Linguistics.
- Ding et al. (2024) Dujian Ding, Ankur Mallick, Chi Wang, Robert Sim, Subhabrata Mukherjee, Victor Rühle, Laks V. S. Lakshmanan, and Ahmed Hassan Awadallah. 2024. Hybrid LLM: Cost-efficient and quality-aware query routing. In The Twelfth International Conference on Learning Representations.
- Ding et al. (2025) Dujian Ding, Ankur Mallick, Shaokun Zhang, Chi Wang, Daniel Madrigal, Mirian Del Carmen Hipolito Garcia, Menglin Xia, Laks V. S. Lakshmanan, Qingyun Wu, and Victor Rühle. 2025. BEST-route: Adaptive LLM routing with test-time optimal compute. In Proceedings of the 42nd International Conference on Machine Learning, volume 267 of Proceedings of Machine Learning Research, pages 13870–13884, Vienna, Austria. PMLR.
- Fan et al. (2025) Tianyu Fan, Xinyao Niu, Yuxiang Zheng, Fengji Zhang, Chengen Huang, Bei Chen, Junyang Lin, and Chao Huang. 2025. Understanding deepresearch via reports. arXiv preprint arXiv:2510.07861.
- Fernandes et al. (2026) Daniela Fernandes, Steeven Villa, Salla Nicholls, Otso Haavisto, Daniel Buschek, Albrecht Schmidt, Thomas Kosch, Chenxinran Shen, and Robin Welsch. 2026. Ai makes you smarter but none the wiser: The disconnect between performance and metacognition. Computers in Human Behavior, 175:108779.
- Gao et al. (2023) Xiangxiang Gao, Yue Liu, Tao Huang, and Zhongyu Hou. 2023. PF-BERxiT: Early exiting for BERT with parameter-efficient fine-tuning and flexible early exiting strategy. Neurocomputing, 558:126690.
- Gnewuch et al. (2022) Ulrich Gnewuch, Stefan Morana, Marc TP Adam, and Alexander Maedche. 2022. Opposing effects of response time in human–chatbot interaction. Business & Information Systems Engineering, 64(6):773–791.
- Google (2025) Google. 2025. Gemini deep research. https://gemini.google/overview/deep-research/. Accessed: 2025-11-14.
- Grattafiori et al. (2024) Aaron Grattafiori, Abhimanyu Dubey, Abhinav Jauhri, Abhinav Pandey, Abhishek Kadian, Ahmad Al-Dahle, Aiesha Letman, Akhil Mathur, Alan Schelten, Alex Vaughan, et al. 2024. The Llama 3 herd of models. arXiv preprint arXiv:2407.21783.
- Hari and Thomson (2023) Surya Narayanan Hari and Matt Thomson. 2023. Tryage: Real-time, intelligent routing of user prompts to large language models. arXiv preprint arXiv:2308.11601.
- Hu et al. (2023) Boren Hu, Yun Zhu, Jiacheng Li, and Siliang Tang. 2023. Smartbert: A promotion of dynamic early exiting mechanism for accelerating BERT inference. In Proceedings of the Thirty-Second International Joint Conference on Artificial Intelligence, pages 5067–5075.
- Jiang et al. (2026) Zhengping Jiang, Mehran Khodabandeh, Akash Bharadwaj, Manik Bhandari, Mayur Srungarapu, Anqi Liu, Benjamin Van Durme, and Li Chen. 2026. Configurable reward model for balanced safety alignment. In Forty-third International Conference on Machine Learning.
- Jiang et al. (2025a) Zhengping Jiang, Anqi Liu, and Benjamin Van Durme. 2025a. Conformal linguistic calibration: Trading-off between factuality and specificity. In Advances in Neural Information Processing Systems 38.
- Jiang et al. (2025b) Zhengping Jiang, Jingyu Zhang, Nathaniel Weir, Seth Ebner, Miriam Wanner, Kate Sanders, Daniel Khashabi, Anqi Liu, and Benjamin Van Durme. 2025b. Core: Robust factual precision with informative sub-claim identification. In Findings of the Association for Computational Linguistics: ACL 2025, pages 19833–19856, Vienna, Austria. Association for Computational Linguistics.
- Jurayj et al. (2025) William Jurayj, Jeffrey Cheng, and Benjamin Van Durme. 2025. Is that your final answer? test-time scaling improves selective question answering. In Proceedings of the 63rd Annual Meeting of the Association for Computational Linguistics (Volume 2: Short Papers), pages 636–644. Association for Computational Linguistics.
- Kolawole et al. (2025) Steven Kolawole, Don Dennis, Ameet Talwalkar, and Virginia Smith. 2025. Agreement-based cascading for efficient inference. Transactions on Machine Learning Research.
- Krishna et al. (2023) Kalpesh Krishna, Erin Bransom, Bailey Kuehl, Mohit Iyyer, Pradeep Dasigi, Arman Cohan, and Kyle Lo. 2023. LongEval: Guidelines for human evaluation of faithfulness in long-form summarization. In Proceedings of the 17th Conference of the European Chapter of the Association for Computational Linguistics, pages 1650–1669, Dubrovnik, Croatia. Association for Computational Linguistics.
- Laaouach (2025) Yassir Laaouach. 2025. HALT-CoT: Model-agnostic early stopping for chain-of-thought reasoning via answer entropy. In 4th Muslims in ML Workshop co-located with ICML 2025.
- Li et al. (2025a) Jingshu Li, Yitian Yang, Q Vera Liao, Junti Zhang, and Yi-Chieh Lee. 2025a. As confidence aligns: Understanding the effect of ai confidence on human self-confidence in human-ai decision making. In Proceedings of the 2025 CHI Conference on Human Factors in Computing Systems, pages 1–16.
- Li et al. (2025b) Yibo Li, Miao Xiong, Jiaying Wu, and Bryan Hooi. 2025b. Conftuner: Training large language models to express their confidence verbally. In The Thirty-ninth Annual Conference on Neural Information Processing Systems.
- Liu et al. (2020) Weijie Liu, Peng Zhou, Zhiruo Wang, Zhe Zhao, Haotang Deng, and Qi Ju. 2020. FastBERT: A self-distilling BERT with adaptive inference time. In Proceedings of the 58th Annual Meeting of the Association for Computational Linguistics, pages 6035–6044, Online. Association for Computational Linguistics.
- Liu et al. (2023a) Yang Liu, Dan Iter, Yichong Xu, Shuohang Wang, Ruochen Xu, and Chenguang Zhu. 2023a. G-Eval: NLG evaluation using GPT-4 with better human alignment. In Proceedings of the 2023 Conference on Empirical Methods in Natural Language Processing, pages 2511–2522. Association for Computational Linguistics.
- Liu et al. (2023b) Yuanxia Liu, Tianyong Hao, Hai Liu, Yuanyuan Mu, Heng Weng, and Fu Lee Wang. 2023b. OdeBERT: One-stage deep-supervised early-exiting BERT for fast inference in user intent classification. ACM Transactions on Asian and Low-Resource Language Information Processing, 22(5).
- Lu et al. (2025) Qingyu Lu, Liang Ding, Siyi Cao, Xuebo Liu, Kanjian Zhang, Jinxia Zhang, and Dacheng Tao. 2025. Runaway is ashamed, but helpful: On the early-exit behavior of large language model-based agents in embodied environments. In Findings of the Association for Computational Linguistics: EMNLP 2025, pages 24014–24027, Suzhou, China. Association for Computational Linguistics.
- Ma et al. (2024) Shuai Ma, Xinru Wang, Ying Lei, Chuhan Shi, Ming Yin, and Xiaojuan Ma. 2024. “are you really sure?” understanding the effects of human self-confidence calibration in ai-assisted decision making. In Proceedings of the 2024 CHI Conference on Human Factors in Computing Systems, pages 1–20.
- Mao et al. (2025) Minjia Mao, Bowen Yin, Yu Zhu, and Xiao Fang. 2025. Early stopping chain-of-thoughts in large language models. arXiv preprint arXiv:2509.14004.
- Min et al. (2023) Sewon Min, Kalpesh Krishna, Xinxi Lyu, Mike Lewis, Wen-tau Yih, Pang Koh, Mohit Iyyer, Luke Zettlemoyer, and Hannaneh Hajishirzi. 2023. FActScore: Fine-grained atomic evaluation of factual precision in long form text generation. In Proceedings of the 2023 Conference on Empirical Methods in Natural Language Processing, pages 12076–12100, Singapore. Association for Computational Linguistics.
- Narasimhan et al. (2025) Harikrishna Narasimhan, Wittawat Jitkrittum, Ankit Singh Rawat, Seungyeon Kim, Neha Gupta, Aditya Krishna Menon, and Sanjiv Kumar. 2025. Faster cascades via speculative decoding. In Proceedings of the Thirteenth International Conference on Learning Representations, Singapore. ICLR 2025 Oral.
- nostalgebraist (2020) nostalgebraist. 2020. Interpreting GPT: The logit lens. LessWrong.
- OpenAI (2025a) OpenAI. 2025a. Introducing deep research. OpenAI. Accessed: 2026-08-29.
- OpenAI (2025b) OpenAI. 2025b. Introducing GPT-5. OpenAI Blog. Accessed 2025-08-18.
- Perplexity Team (2025) Perplexity Team. 2025. Introducing perplexity deep research. Accessed: 2025-12-12.
- Qian et al. (2023) Hongjing Qian, Yutao Zhu, Zhicheng Dou, Haoqi Gu, Xinyu Zhang, Zheng Liu, Ruofei Lai, Zhao Cao, Jian-Yun Nie, and Ji-Rong Wen. 2023. WebBrain: Learning to generate factually correct articles for queries by grounding on large web corpus. arXiv preprint arXiv:2304.04358.
- Quamar and Areeb (2025) Mohammad Atif Quamar and Mohammad Areeb. 2025. Logit–entropy adaptive stopping heuristic for efficient chain-of-thought reasoning. In NeurIPS 2025 Workshop on Efficient Reasoning.
- Rajendhran et al. (2025) Rishanth Rajendhran, Amir Zadeh, Matthew Sarte, Chuan Li, and Mohit Iyyer. 2025. VeriFastScore: Speeding up long-form factuality evaluation. In Findings of the Association for Computational Linguistics: EMNLP 2025, pages 9234–9259. Association for Computational Linguistics.
- Shao et al. (2024) Yijia Shao, Yucheng Jiang, Theodore Kanell, Peter Xu, Omar Khattab, and Monica Lam. 2024. Assisting in writing wikipedia-like articles from scratch with large language models. In Proceedings of the 2024 Conference of the North American Chapter of the Association for Computational Linguistics: Human Language Technologies (Volume 1: Long Papers), pages 6252–6278. Association for Computational Linguistics.
- Soiffer et al. (2025) Duncan Soiffer, Steven Kolawole, and Virginia Smith. 2025. Semantic agreement enables efficient open-ended LLM cascades. In Proceedings of the 2025 Conference on Empirical Methods in Natural Language Processing: Industry Track, pages 2499–2537, Suzhou (China). Association for Computational Linguistics.
- Sun et al. (2026) Renliang Sun, Wei Cheng, Dawei Li, Haifeng Chen, and Wei Wang. 2026. Stop when enough: Adaptive early-stopping for chain-of-thought reasoning. In Proceedings of the 64th Annual Meeting of the Association for Computational Linguistics (Volume 1: Long Papers), pages 27250–27268. Association for Computational Linguistics.
- Teerapittayanon et al. (2016) Surat Teerapittayanon, Bradley McDanel, and Hsiang-Tsung Kung. 2016. Branchynet: Fast inference via early exiting from deep neural networks. In Proceedings of the 23rd International Conference on Pattern Recognition (ICPR), pages 2464–2469, Cancun, Mexico. IEEE.
- Walden et al. (2026) William Gantt Walden, Kathryn Ricci, Miriam Wanner, Zhengping Jiang, Chandler May, Rongkun Zhou, and Benjamin Van Durme. 2026. How grounded is Wikipedia? a study on structured evidential support and retrieval. In Findings of the Association for Computational Linguistics: ACL 2026, pages 400–420. Association for Computational Linguistics.
- Wang et al. (2025a) Liaoyaqi Wang, Zhengping Jiang, Anqi Liu, and Benjamin Van Durme. 2025a. Always tell me the odds: Fine-grained conditional probability estimation. In Second Conference on Language Modeling.
- Wang et al. (2025b) Lifei Wang, Natalie Friedman, Chengchao Zhu, Zeshu Zhu, and S Joy Mountford. 2025b. The impact of confidence ratings on user trust in large language models. In Adjunct Proceedings of the 33rd ACM Conference on User Modeling, Adaptation and Personalization, pages 365–370.
- Wang and Lo (2025) Ya-Ling Wang and Chi-Wen Lo. 2025. The effects of response time on older and young adults’ interaction experience with chatbot. BMC psychology, 13(1):150.
- Wei et al. (2024) Jerry Wei, Chengrun Yang, Xinying Song, Yifeng Lu, Nathan Hu, Jie Huang, Dustin Tran, Daiyi Peng, Ruibo Liu, Da Huang, Cosmo Du, and Quoc V. Le. 2024. Long-form factuality in large language models. In Advances in Neural Information Processing Systems 37, pages 80756–80827.
- Xin et al. (2020) Ji Xin, Raphael Tang, Jaejun Lee, Yaoliang Yu, and Jimmy Lin. 2020. DeeBERT: Dynamic early exiting for accelerating BERT inference. In Proceedings of the 58th Annual Meeting of the Association for Computational Linguistics, pages 2246–2251, Online. Association for Computational Linguistics.
- Xin et al. (2021) Ji Xin, Raphael Tang, Yaoliang Yu, and Jimmy Lin. 2021. BERxiT: Early exiting for BERT with better fine-tuning and extension to regression. In Proceedings of the 16th Conference of the European Chapter of the Association for Computational Linguistics: Main Volume, pages 91–104, Online. Association for Computational Linguistics.
- Xu and Peng (2025) Renjun Xu and Jingwen Peng. 2025. A comprehensive survey of deep research: Systems, methodologies, and applications. arXiv preprint arXiv:2506.12594.
- Xu et al. (2025) Zhengtao Xu, Tianqi Song, and Yi-Chieh Lee. 2025. Confronting verbalized uncertainty: Understanding how llm’s verbalized uncertainty influences users in ai-assisted decision-making. International Journal of Human-Computer Studies, 197:103455.
- Yue et al. (2024) Murong Yue, Jie Zhao, Min Zhang, Liang Du, and Ziyu Yao. 2024. Large language model cascades with mixture of thought representations for cost-efficient reasoning. In The Twelfth International Conference on Learning Representations.
- Zeng et al. (2024) Ziqian Zeng, Yihuai Hong, Hongliang Dai, Huiping Zhuang, and Cen Chen. 2024. ConsistentEE: A consistent and hardness-guided early exiting method for accelerating language models inference. In Proceedings of the AAAI Conference on Artificial Intelligence, volume 38, pages 19506–19514.
- Zhang et al. (2025) Tuo Zhang, Asal Mehradfar, Dimitrios Dimitriadis, and Salman Avestimehr. 2025. Leveraging uncertainty estimation for efficient LLM routing. In ICML 2025 Workshop on Collaborative and Federated Agentic Workflows.
- Zhang et al. (2024) Zhengquan Zhang, Konstantinos Tsiakas, and Christina Schneegass. 2024. Explaining the wait: How justifying chatbot response delays impact user trust. In Proceedings of the 6th ACM Conference on Conversational User Interfaces, pages 1–16.
- Zhao et al. (2024a) Wenting Zhao, Tanya Goyal, Yu Ying Chiu, Liwei Jiang, Benjamin Newman, Abhilasha Ravichander, Khyathi Chandu, Ronan Le Bras, Claire Cardie, Yuntian Deng, and Yejin Choi. 2024a. WildHallucinations: Evaluating long-form factuality in LLMs with real-world entity queries. arXiv preprint arXiv:2407.17468.
- Zhao et al. (2024b) Wenting Zhao, Xiang Ren, Jack Hessel, Claire Cardie, Yejin Choi, and Yuntian Deng. 2024b. Wildchat: 1m chatgpt interaction logs in the wild. In The Twelfth International Conference on Learning Representations.
- Zhou et al. (2020) Wangchunshu Zhou, Canwen Xu, Tao Ge, Julian McAuley, Ke Xu, and Furu Wei. 2020. BERT loses patience: Fast and robust inference with early exit. In Advances in Neural Information Processing Systems, volume 33, pages 18330–18341. Curran Associates, Inc.
Appendix A Interface Design Details
This appendix expands the interface description from Section 3.3, breaking down the user interface into its major panels and controls. Figure 6 labels the gist, initial draft, grounding control, and elaboration control. In the interface terminology, Initial Draft and First Draft correspond to Sketch, Grounding corresponds to Verify, and Elaborating or Elaborated corresponds to Expand. Figure 7 zooms in on the override menu used to inspect alternative drafts and provide corrective feedback before confirming an exit decision. Together, these illustrations provide the finer-grained component mapping referenced in the main text.


Appendix B Evaluation Prompts
Together, these prompts span key evaluation dimensions: coherence scoring checks whether a passage logically builds from sentence to sentence (Figure 8); organization scoring verifies structural clarity in Wikipedia-style sections (Figure 9); engagingness scoring judges how captivating and insightful a section feels to curious readers (Figure 10); preference summarization distills a user’s likes and dislikes across reports to guide orchestration (Figure 11); and preference-conditioned option selection predicts which draft a user will most prefer given their profile and past choices (Figure 12).
Appendix C Generalization to a Second Chat Model
Our full orchestration experiments in § 4.2 use Llama-3.1-70B-Instruct and couple report generation with search-backed evaluation across thousands of topics. We complement them with GPT-4.1 results on all non-search-backed metrics, excluding Factuality, which depends on retrieval and evidence integration. Table 6 summarizes these results.
| Metric | Ske | Ver | Exp |
| Coherence (1–5) | 4.930 | 4.982 | 4.739 |
| Engagingness (1–3) | 2.888 | 2.931 | 2.948 |
| Organization (1–5) | 4.889 | 4.993 | 4.986 |
| Informativity ( 0) | .831 | .871 | 1.020 |
Qualitatively, these results show that measurable quality gains persist for some metrics but not uniformly across later passes, consistent with the Llama-based results in Table 3. A notable difference is that GPT-4.1 produces substantially higher first-pass quality: for instance, Coherence starts near the ceiling of the 1–5 scale ( vs. for Llama). As a consequence, the margins among computationally lightweight dimensions—those that are relatively easy to improve with additional passes, such as Coherence and Organization (Figure 3)—tend to shrink, and in some cases the Verify draft scores above the Expand draft, most notably for Coherence ( vs. ). In contrast, Informativity gains remain substantial (), mirroring the trend observed with Llama and confirming that content enrichment is the dimension that benefits most from deeper exploration.
These differences change the shape of metric-specific quality–cost trade-off curves: with a stronger base model, the orchestrator can skip refinement on dimensions already near saturation and concentrate compute on dimensions with greater room for improvement. Future-utility estimation therefore remains useful for directing refinement toward dimensions with available headroom.
Appendix D Budget Allocation
Figure 13reports the corresponding budget-allocation results for Factuality and Engagingness.
The baseline configurations are defined below.
Random-uniform
This baseline samples an action for each section independently and uniformly at random from the set , without conditioning on any section-level features. Sampling continues until a feasible allocation that satisfies the total budget constraint is obtained, at which point the process terminates.
Random-greedy
This baseline randomly orders the sections and assigns the highest-effort action permitted by the remaining budget to each section in turn, prioritizing Expand over Verify and Verify over Sketch. It selects Expand if the budget allows; otherwise it falls back to Verify, and finally to Sketch. Because Table 3 shows that later stages improve average quality, the strategy concentrates compute on the highest feasible stage.
Shortest-first
At every step this heuristic promotes the currently shortest section draft by one stage (SketchVerifyExpand), subject to the remaining budget. It tests a simple operational proxy for underdeveloped content without using learned quality predictions.
GPT-5-mini score
We zero-shot prompt GPT-5-mini to score each current draft on the target quality dimension and promote the lowest-scoring feasible draft. Scores are recomputed from the stage currently visible to the policy. This is a draft-aware LLM router, but unlike our allocator it is not trained to predict the marginal gain of a particular next stage.
Appendix E Additional Details on Quality Assessment

Factuality
License
The LongFact prompts (Wei et al., 2024) are released under CC BY 4.0, while the accompanying software is under Apache 2.0. FActScore (Min et al., 2023) and WildHallucinations (Zhao et al., 2024a) are released under the MIT License. FreshWiki (Shao et al., 2024), which is derived from Wikipedia, is released under CC BY-SA. The public Core repository (Jiang et al., 2025b) did not specify a license at the time of access. The Llama 3.1 herd of models (Grattafiori et al., 2024) is released under the Llama 3.1 Community License.
Appendix F User Preference Adaptation
To balance exploration and exploitation during preference adaptation, we add an information-weight term to action selection. This improves early sample efficiency at the cost of locally suboptimal predictions under the current orchestration policy. At each step, action is selected according to the score function parameterized by and its expected information gain:
This biases action selection toward running the full pipeline (Expand) at the beginning of the adaptation process, thus collecting more informative feedback from the user. Figure 14 (right) shows the adaptation results with different values.
Larger values lead to faster adaptation but have little effect on final accuracy, indicating that the default policy already explores sufficiently for efficient preference adaptation.
Appendix G User Study Details
G.1 Annotation
We conduct a user study to gather human quality assessments of the generations produced at different early-exit points. This study was reviewed and approved by an internal Institutional Review Board. We use the same 100 test prompts and generations from the full dataset described in § 4.1. In each annotation task, a participant was assigned to evaluate generated content for 5 different test prompts (topics), with 100 participants in total. Participants could complete more than one annotation task. Therefore, we obtained 5 independent evaluations per test prompt.
We recruited 100 participants from Prolific. We used Prolific’s standard sampling distribution. Using Prolific’s screening feature, we screened for primarily English-speaking participants who were located in the United States, had a 100% approval rate, had submitted at least 20 prior AI-evaluation tasks, and held an undergraduate or higher degree.
Each annotation task consisted of one Qualtrics survey. The survey asked participants to pretend that they are tasked to generate an informational report on a topic. Each survey included five topic reports they were asked to review and evaluate. The survey began with a consent form providing detailed information about the study. Once the participant provided consent, the survey guided them through each of the five topics.
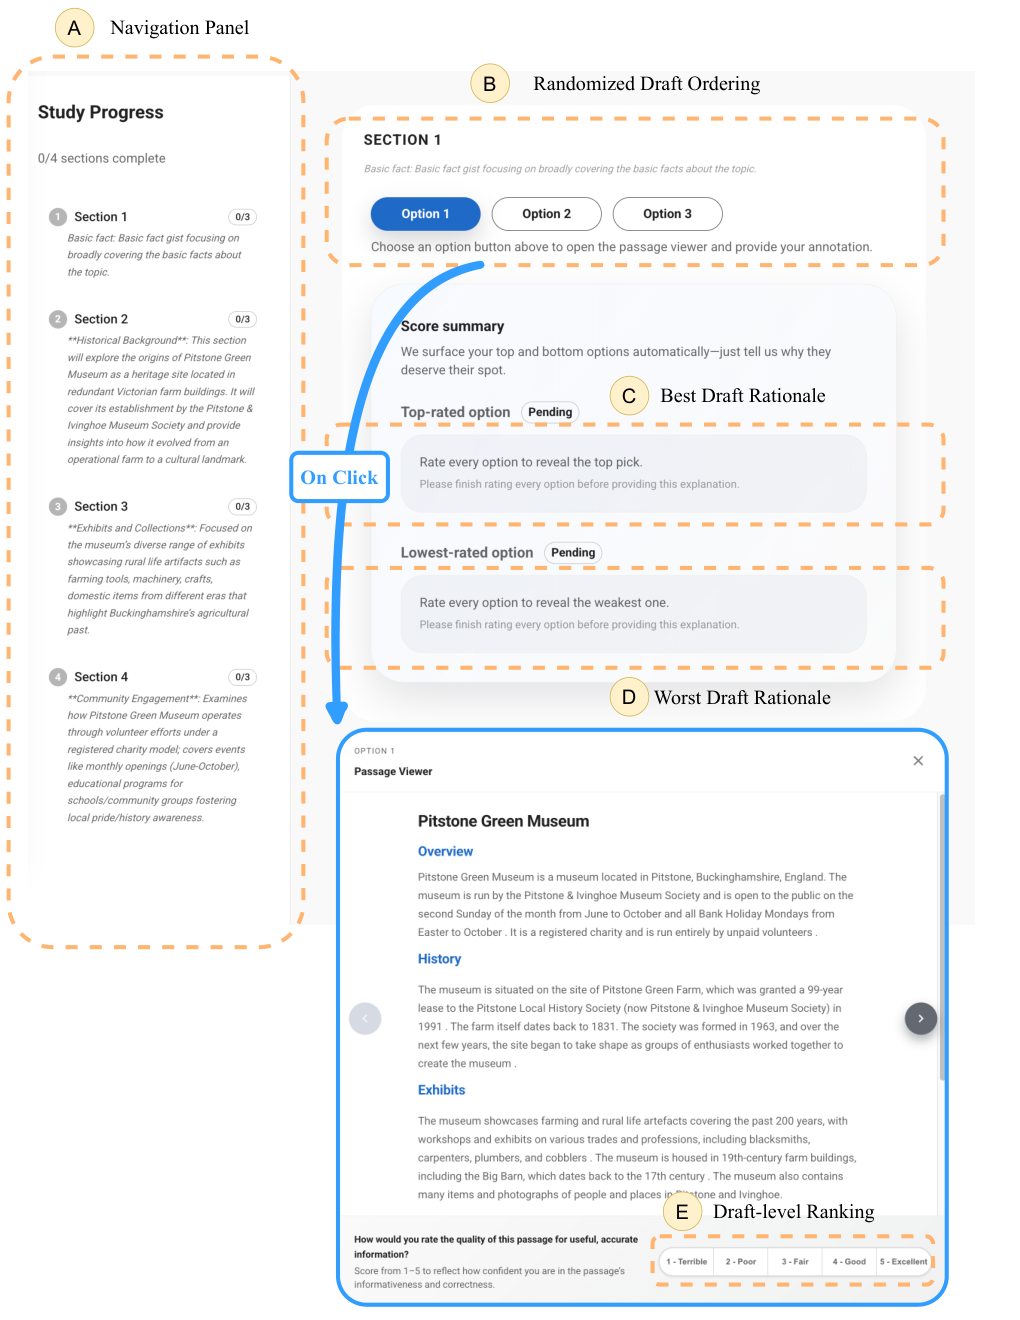
For each topic, they were asked to navigate to a webpage on a separate browser window (Figure 15). The webpage presented an AI-generated report containing sections. Each section was presented with a randomly shuffled set of all three generations (Figure 15B). For each generation option, participants were asked to rate its quality (Figure 15E). Once they had evaluated all sections and options, they copied the resulting JSON text into the corresponding section of the survey. They were then asked two questions: (1) How familiar are you with the topic of this report? (1 = Not familiar at all, 5 = Extremely familiar); and (2) How confident are you in your assessment of the report’s quality? (1 = Not confident at all, 5 = Extremely confident). The survey asked participants to repeat this process for each of the five topics.
After reviewing and evaluating all five topic reports, participants answered demographic questions covering age, gender identity, race/ethnicity, and education level. In total, the survey took approximately 90 minutes, and each participant who completed it was compensated USD $19.
G.2 Inter-Annotator Agreement Analysis
We calculate inter-annotator agreement on section-draft-level ratings using Krippendorff’s . Agreement among ratings is mild, with Krippendorff’s (§ 4.5). We further analyze how average section-draft-level Krippendorff’s varies with user-reported confidence and topic familiarity. Figure 16 shows slightly higher agreement at higher average familiarity or confidence, although the effect is modest.
G.3 Oracle Preference Modeling
The oracle preference-modeling procedure underlying Table 5 has access to more information than the online preference model of § 3, providing an upper bound on attainable preference-prediction performance.
For each user, we adopt a leave-one-report-out protocol: we hold out one annotated report for validation and use the remaining reports to construct the user’s preference profile with the prompt in Figure 11. The prompt conditions on the user’s per-section best/worst draft choices, their free-text justifications, and their self-reported topic familiarity, and emits a concise second-person description paired with a short list of preference signals.
Given this profile, we predict the user’s preferred draft for each section of the held-out report using the preference-conditioned selection prompt in Figure 12. This step sees all three drafts of every section at once, whereas the online orchestrator of § 3 observes only the drafts up to its predicted exit point and receives implicit, single-session feedback rather than explicit rationales. Access to all drafts and explicit rationales makes this procedure an oracle that upper-bounds deployed preference-prediction accuracy.
We report two metrics in Table 5: draft-selection accuracy (which of the three drafts the user rates highest) and a binary “Needs Improvement” accuracy (whether the user prefers any further refinement over the initial Sketch draft). A majority-vote baseline that ignores the profile attains selection and binary accuracy. Conditioning on the LLM-summarized profile improves both substantially: GPT-5-mini reaches and GPT-5.1 reaches ; additionally surfacing the user’s self-reported familiarity (+familiarity) leaves selection essentially unchanged () while slightly improving the binary task (). These results show that, when the actual drafts and a rich preference profile are available, real-world user preferences are identifiable well above chance. Using only sequentially observed drafts and implicit feedback, the online orchestrator approaches this oracle accuracy within roughly five rounds of interaction (Figure 4).