Tracing the Hidden Molecular Gas in the Small Magellanic Cloud with SOFIA and APEX
Abstract
Context. In low-metallicity environments, the reduced dust abundance debilitates the shielding of molecular clouds against far-ultraviolet (FUV) radiation, enhancing CO photodissociation and producing extended envelopes of “CO-faint” or “CO-dark” molecular gas. The [C ii] 158 m fine-structure line is one of the brightest coolants of the interstellar medium (ISM) and a key tracer of these CO-faint molecular phases.
Aims. We aim to characterize the multiphase origin of the [C ii] line emission and quantify the fraction of molecular gas that remains undetected in CO across several regions of the Small Magellanic Cloud (SMC), the nearest low-metallicity (0.2 ) galaxy that provides an ideal laboratory for testing photodissociation region (PDR) models under conditions that resemble those in early galaxies.
Methods. We combine high spectral resolution SOFIA/GREAT and upGREAT [C ii] 158 m observations with APEX CO(2–1) data and the ASKAP+Parkes H I 21 cm map to perform a spectral decomposition of the [C ii] emission into its atomic and molecular contributions. Using the linear decomposition approach, we derive the [C ii] fractions associated with H I and H2, and convert the molecular component into column densities assuming typical PDR conditions constrained by previous SMC studies. We then compare the resulting molecular gas content with CO-based estimates and with the local star formation rate surface density derived from H and tracers.
Results. The [C ii] line width in the analyzed SMC lines of sight consistently falls between the H I and CO line widths, indicating that the [C ii] emission arises from both molecular and atomic gas. On average, of the [C ii] intensity originates from the molecular phase, while is associated with atomic gas. The [C ii]-traced H2 accounts for approximately of the total molecular gas column density, implying that the SMC’s molecular reservoir is dominated by CO-faint gas. This estimation yields a H2-to-CO conversion factor on 4 pc scales X cm-2(K km s-1)-1 in CO-emitting regions, 4.5 times larger than the canonical Galactic conversion factor (X cm-2(K km s-1)-1). We find no significant correlation between the CO-dark fraction and either total column density or , suggesting that the abundance of CO-faint gas is primarily governed by the efficiency of dust and gas shielding rather than by current star formation activity.
Conclusions. Our results demonstrate that [C ii] is the dominant tracer of molecular gas in the SMC and confirm the prevalence of an extended, stable CO-faint molecular phase in low-metallicity environments. This has important implications for interpreting [C ii] observations in unresolved galaxies, both locally and at high redshift, where CO may not fully trace the molecular gas reservoir.
Key Words.
ISM: general – ISM: photon-dominated region (PDR) – ISM: Small Magellanic Cloud – Galaxies: ISM1 Introduction
Star formation is regulated by the availability, distribution, and physical conditions of the cold interstellar medium (ISM). In metal-poor environments, the reduced dust abundance weakens the shielding against ultraviolet (UV) photons, altering the chemical and thermal balance between the atomic and molecular phases, as well as the observability of the molecular gas. As a consequence, CO molecules are more easily photodissociated, while H2 remains self-shielded. This leads to extended envelopes of CO-faint molecular gas, commonly referred to as CO-dark H2, that are invisible in CO rotational transitions but still contribute substantially to the total molecular reservoir (Wolfire et al., 2010; Bolatto et al., 2013, e.g.,).
A powerful tracer of this molecular gas is the [C ii] 158 m fine-structure line, one of the brightest cooling lines of the ISM (Wolfire et al., 2003, e.g.,). The [C ii] transition arises from the fine-structure splitting of singly ionized carbon (C+). Because the ionization potential of carbon (11.26 eV) is slightly below that of hydrogen (13.6 eV), C+ can exist in a variety of environments, ranging from photodissociation regions and the cold and warm neutral medium (CNM/WNM) to partially ionized gas. This makes [C ii] a key multiphase coolant of the ISM (Pineda et al., 2013; Langer et al., 2014; Croxall et al., 2017; Pineda et al., 2017, e.g.,). Moreover, previous studies have demonstrated a strong correlation between [C ii] emission and star formation rate (SFR) surface density (De Looze et al., 2014; Herrera-Camus et al., 2015; Herrera-Camus et al., 2018, e.g.,).

In the PDR framework developed by (Kaufman et al., 1999; Kaufman et al., 2006), [C ii] emission arises mainly from the surface layers of molecular clouds exposed to far-ultraviolet radiation, where hydrogen transitions from the atomic to the molecular phase and carbon changes from C+ to C and then to CO. The relative intensities of [C ii], [C i], and CO therefore describe the structure of the gas across this transition. In dense PDRs, [C ii] traces the warm molecular surface where H2 is already formed but CO is photodissociated, while in diffuse gas it can originate from neutral atomic layers or low-ionization regions. Interpreting [C ii] as a molecular tracer thus requires separating its various phase contributions, ideally by comparing velocity-resolved spectra of [C ii], CO, and H i, and by constraining possible ionized contributions through lines such as [N ii] 205 m (Herrera-Camus et al., 2016; Tarantino et al., 2021).
At low metallicity, where both the dust-to-gas ratio and carbon abundance are reduced, PDR models predict an increase in the [C ii]-emitting envelope relative to the CO core (e.g. Wolfire et al., 2010; Hollenbach et al., 2012). This shift enhances the [C ii]/CO luminosity ratio and implies that a large fraction of the molecular gas is CO-faint. Empirically, this behavior has been observed in nearby dwarf galaxies such as the LMC and SMC (Israel and Maloney, 2011; Jameson et al., 2018; Okada et al., 2019), as well as in other low-metallicity systems (Cormier et al., 2019; Madden et al., 2020).
The Small Magellanic Cloud provides an ideal laboratory for studying this effect. Its proximity (61 kpc), stellar mass (log(; Skibba et al. 2012), and metallicity of 0.2 (Kurt et al., 1999; Pagel, 2003) allow spatially resolved studies of the ISM at sub-parsec scales while sampling a regime comparable to that of early galaxies. Previous works have revealed CO-faint molecular gas on large scales in the SMC (e.g. Bolatto et al., 2011), and velocity-resolved SOFIA/GREAT maps for four SMC regions (N66, N25+N26, and N88) have shown that a large fraction (60%) of the molecular gas resides in extended CO-faint envelopes traced by [C ii] emission, highlighting the role of PDR physics in shaping molecular cloud structure at low metallicity (Requena-Torres et al., 2016). Expanding on this framework, Pineda et al. (2017) mapped the transition from atomic to molecular gas across the Magellanic Clouds, establishing that while dense PDR envelopes globally dominate the [C ii] emission, the local contribution from diffuse CO-dark H2 clouds varies drastically (from 10% to 80%) depending on the radiation field. A systematic kinematic decomposition of [C ii] into its atomic and molecular components across multiple regions, and a quantitative census of the molecular gas reservoir traced by [C ii] at high velocity resolution, remain essential for fully constraining the phase balance of carbon and the true molecular gas budget in the SMC. Jameson et al. (2018) expanded the investigation of the relationship between [C ii] -bright and CO-bright gas in the SMC using Herschel and ALMA spectroscopy of five star-forming, extended regions: SWbarS (Rubio et al., 1993, containing the cloud SMC-B1 and the nebula N13,), SWbarN (containing the nebula N27/LIRS 49), N22, N83 and SWDarkPeak, suggesting that a 70% of the molecular gas is coming from [C ii] -bright regions on average. By comparing integrated intensities and spatial distributions, they showed that [C ii] preferentially traces extended molecular envelopes surrounding compact CO cores, consistent with PDR expectations at low-metallicity environments.
| Region | RA | Dec | [km s-1] | H i | [C ii] | [C i] | 12CO(2-1) | 12CO(3-2) | 13CO(2-1) | 13CO(3-2) |
|---|---|---|---|---|---|---|---|---|---|---|
| N83-R1 | 1:14:24 | -73:14:00 | 165 | |||||||
| N83-R2 | 1:14:18 | -73:15:45 | 165 | |||||||
| N83-R3 | 1:14:04 | -73:16:57 | 165 | |||||||
| N83-R4 | 1:13:50 | -73:18:00 | 165 | |||||||
| SWDarkPeak | 0:52:53 | -73:11:06 | 155 | |||||||
| SWbarN-R4 | 0:48:27 | -73:06:02 | 115 | |||||||
| SWbarN-R5 | 0:48:20 | -73:05:45 | 115 | |||||||
| SWbarN-R6 | 0:48:18 | -73:06:05 | 115 | |||||||
| N22-R1 | 0:47:59 | -73:18:01 | 120 | |||||||
| N22-R2 | 0:47:54 | -73:17:37 | 120 | |||||||
| N22-R3 | 0:47:54 | -73:17:11 | 120 | |||||||
| SWbarS-R1 | 0:45:23 | -73:22:22 | 120 | |||||||
| SWbarS-R2 | 0:45:26 | -73:22:59 | 120 | |||||||
| SWbarS-R3 | 0:45:19 | -73:22:40 | 120 | |||||||
| SWbarS-R4 | 0:45:29 | -73:18:45 | 120 | |||||||
| SWbarS-R5 | 0:45:18 | -73:22:13 | 130 | |||||||
| SWbarS-R6 | 0:45:27 | -73:23:05 | 130 |
In this work, we combine new velocity-resolved SOFIA/GREAT and upGREAT [C ii] 158 m observations towards 10 lines of sight across the SMC with APEX in CO, and ASKAP+Parkes in H i data to (i) determine the kinematic properties (centroid and linewidth) of [C ii] relative to atomic and molecular gas, (ii) decompose the [C ii] emission into its molecular and atomic components, (iii) estimate the H2 column densities traced by [C ii] and compare them with CO-based values, and (iv) relate these results to the SMC’s dust and star-formation properties derived from infrared SED modeling. Together, these analysis provide a self-consistent picture of how [C ii] emission traces the multiphase ISM in a low-metallicity environment and quantify the fraction of the molecular gas reservoir that remains undetected in CO.
The paper is organized as follows. In Section 2, we describe the observations used for the [C ii] analysis and the ancillary data employed to constrain the contributions of the different gas phases to the [C ii] 158 m emission. Section 3 presents the computation of the obscured and unobscured star formation rates. We report the methodology and the results of the [C ii] emission decomposition in Section 4. The estimation and analysis of the total molecular gas column density estimation, and the correlation between the CO-dark gas fractions and the star formation rates across the SMC regions can be found in Section 5. Then, in Section 6, we look into the nature of the SWDarkPeak region to study the structure and transition between CO-bright and CO-dark gas. Finally, in Section 7 we make our final remarks on the results.
2 Observations
We observed 17 line-of-sight (LOS) with SOFIA distributed in five SMC regions, namely N83, SWDarkPeak, SWbarN, N22, and SWbarS. These pointings are overlaid on the 160 emission map of the SMC, as shown in Figure 1, and sample a diverse range of environments in terms of star formation activity, radiation field strength, and gas content. In this study, we make use of existing CO and H i observations.
2.1 SOFIA [C ii] 158 m
Cycle 3 SOFIA [C ii] (2PP1/2) at 1900.5369 GHz (rest frame) observations ( m) were obtained for six regions in the SMC (Proposal ID 03_0120, PI Herrera-Camus; N22-R1, N22-R2, N22-R3, SWbarN-R4, SWbarN-R5, and SWbarN-R6) using the German Receiver for Astronomy at Terahertz Frequencies (GREAT). The [C ii] line was detected with the L2 channel, which covers a radio-frequency range of 1815-1910 GHz. GREAT is a dual-channel heterodyne instrument for far-infrared (FIR) spectroscopy that provides high spectral resolution in several frequency windows in the 0.490–4.747 THz range, with a beam size of 14.1″ (Heyminck et al., 2012), which corresponds to pc for the SMC. The velocity resolution is km s-1.
Cycle 5 SOFIA [C ii] 158 m observations targeting seven additional SMC regions (Proposal ID 05_0210, PI Herrera-Camus; N83-R1, N83-R2, N83-R3, N83-4, SWDarkPeak-R7, SWbarS-R5, and SWbarS-R6) were obtained with the upgraded GREAT (upGREAT) instrument, and a velocity resolution km s-1. The Low Frequency Array receiver (LFA) was used to detect the [C ii] 158 m transition over the frequency range 1459.6–1900.5 GHz. upGREAT is a multi-pixel, dual-polarization heterodyne receiver for FIR spectroscopy, providing high spectral resolution () over multiple frequency bands in the 1.83–2.07 THz range for the LFA. The instrument’s hexagonal array configuration provides seven beams per polarization, each with a FWHM beam size of 14.1″ (Risacher et al., 2018) ( pc).

The targets from Cycle 3 and Cycle 5 are shown in Figure 2, overlaid on the CO(2–1) integrated intensity maps. The selected SOFIA/GREAT pointings are distributed across the brightest CO structures in each region. In N22 and SWbarN (top panels), the observed positions trace the main molecular ridge and its associated star-forming clumps. In SWbarS and N83 (bottom left and right panels), the upGREAT array covers compact CO condensations as well as adjacent lower-intensity regions. The H contours reveal the location of ionized gas relative to the molecular structures, showing that 9 of the [C ii] pointings lie at the interface between bright CO emission and H peaks, consistent with photodissociation region interfaces. In contrast, SWDarkPeak exhibits weaker and more diffuse CO emission, with the SOFIA positions sampling comparatively faint molecular gas.
The spectral data reduction was performed following standard procedures using the CLASS package within the Gildas software.
2.2 APEX [C i], 12CO(2-1), 13CO(2-1), 12CO(3-2), and 13CO(3-2)
The observations of the CO rotational (J2-1) transition at 230.538 GHz (rest frame) are presented in (Saldaño et al., 2023) and include N22, the SWbar regions, and the SWDarkPeak region in the SMC Bar, and N83 in the SMC Wing, with fields of view of 24.8′19.7′, 20.9′24.6′, 5.5′5.8′, and 4.1′13.8′, respectively. The rms noise of the data ranges between 0.1 and 0.7 K, the spatial resolution is 9 pc (), and the smoothed velocity resolution is km s-1. CO(2-1) spectra were extracted at the position of the SOFIA regions.
Observations of the neutral atomic carbon fine structure transition [C i] (3PP0) at 492.1607 GHz towards 13 pointings were done with the APEX telescope using the FLASH+ facility receiver as part of projects C-98.F-9706A-2016 and M-097.F-0025-2016 (PI Rúbio). These included the SMC regions; N22-R1, N22-R2, N22-R3, SWbarN-R4, SWbarN-R5, SWbarN-R6, N83-R1, N83-R2, N83-R3, N83-R4, during two observing runs in 2016. FLASH+ is a dual-frequency heterodyne receiver, operating simultaneously in the 345 and 460 GHz atmospheric windows, providing 4 GHz bandwidth in each sideband (Klein et al., 2014). The [C i](1-0) 492 GHz line was placed in the upper sideband of the high frequency channel, and the low frequency channel was tuned to 492.160 GHz to simultaneously cover the 13CO(3-2) and CO(3-2) lines at 330.588 GHz and 345.796 GHz in the lower and upper sidebands, respectively. We used the XFFTS backends, providing a 38 kHz (0.033 km s-1) spectral resolution for both the lines and 76 kHz (0.050 km s-1) for the [C i](1-0) line. The data were smoothed to a velocity resolution of 1-2 km s-1 and the rms is 0.035 K.
More recent neutral carbon observations were performed in the SWDarkPeak with APEX as part of project C-0116.F-9708C-2025 (PI Rodriguez-Ambler) using the nFLASH460 receiver. The [C i](1-0) spectrum line at 492 GHz was obtained in October 2025 with an rms = 0.1 K and a velocity resolution of km s-1. We include this new observation in the discussion of the DarkPeak in Section 6.
12CO(3-2) and 13CO(3-2) were simultaneously observed in some of the regions as shown in Table 1.

In this work, we only use the CO(2-1) observations, and a detailed analysis of the [C i] data, as well as the CO(3-2) and isotopes, will be presented in a forthcoming paper.
2.3 ASKAP+Parkes H i
We make use of the neutral atomic hydrogen H i 21 cm data cube of the Small Magellanic Cloud obtained as part of the Galactic Australian Square Kilometre Array Pathfinder H i (GASKAP-H i) pilot survey (Pingel et al., 2022).The observations cover approximately 25 deg2 of the SMC, with an angular resolution of (corresponding to pc at the distance of the SMC) and a spectral resolution of in the Local Standard of Rest Kinematic (LSRK) frame. The H i data cube has an rms noise level of K per channel (Pingel et al., 2022). H i spectra were extracted at the positions of the SOFIA [C ii] 158 m pointings by sampling the 21 cm data cube at the corresponding sky coordinates.
2.4 Sample selection
We have 17 SOFIA pointings in total, of which 13 have simultaneous [C ii] CO(2–1) and H i observations. Of these, 10 satisfy our signal-to-noise ratio (S/N) and velocity-shift criteria (Section 4.1) and are used in the decomposition analysis (Section 4.2); the remaining three: SWDarkPeak, N83-R2 and N83-R4, are discussed individually in Section 5.4 and 6.
3 Infrared luminosity and star formation rate of the SMC
Interpreting the [C ii] emission in the SMC requires a careful characterization of both the dust-heated infrared output and the recent star formation activity. We therefore adopt infrared luminosities derived from full dust SED fitting and SFR estimates based on recombination-line emission, providing a consistent description of the physical conditions across the galaxy.
3.1 Infrared luminosity
The total infrared (TIR) luminosity, , was estimated following Draine et al. (2007),
| (1) |
where is the dust mass, is the dust-mass-weighted mean starlight intensity, and is the power absorbed per unit dust mass for a radiation field of intensity . The dust mass and radiation field maps were taken from Chastenet et al. (2019), who derived these quantities by fitting the Draine & Li (2007, hereafter DL07) dust models using the Milky Way () grain mixture, following the methodology of Aniano et al. (2012). Although the SMC exhibits dust properties that differ from those of the Milky Way, the MW grain model has been shown to provide satisfactory fits in low-metallicity environments while allowing the PAH mass fraction () to remain a free parameter (Draine et al., 2007; Sandstrom et al., 2010; Chastenet et al., 2019). Consequently, the normalization must be consistent with the grain model adopted to derive the dust parameters rather than with the intrinsic dust-to-gas ratio of the SMC. We therefore adopt , corresponding to the MW grain model and consistent with the empirical calibration of Magdis et al. (2012).
3.2 Special case of region SWbarN
The Chastenet et al. (2025) dust parameter maps for the SMC contain some empty pixels (NaN) in the SWbarN region. Therefore, for SWbarN-R4, SWbarN-R5, and SWbarN-R6, we adopted an alternative approach to estimate . Instead of correcting the H luminosity with derived from the DL07 mixture, we used the 160 m emission map (12") from the Herschel HERITAGE survey, which covers the SMC over (SPIRE) and (PACS) fields (Meixner et al., 2013), to obtain and calculate the obscured star formation rate.
To estimate the TIR luminosity from the Herschel emission in the 160 m band, we used the expression derived by Galametz et al. (2013):
| (2) |
with and the calibration coefficients, and the flux in the 160 band in .
As a consistency check, we also estimated from the Herschel 160 m emission using the empirical calibration of Galametz et al. (2013) (Equation 2) for all regions where the DL07 dust-model parameters are available. The two methods yield consistent infrared luminosities, with a median ratio and a scatter of 0.22 dex.
3.3 Star formation rate
We measure the local star formation rate (SFR) in the SMC following the calibration by Kennicutt and Evans (2012):
| (3) |
where the SFR calibration coefficient is (Hao et al., 2011) assuming a Kroupa (2001) IMF. The H line emission map for the SMC comes from the UM/CTIO Magellanic Cloud Emission-line Survey that covers the central of the SMC at 3″–4″ resolution with a photometric accuracy of 5% (Winkler et al., 2015).
To account for the obscured star formation traced by the dust continuum emission, we correct the H luminosity by combining it with the total infrared luminosity, following Kennicutt et al. (2009):
| (4) |
The calibration coefficient adopted in Eq. 4 was derived from samples dominated by galaxies with higher metallicities than the SMC (Kennicutt et al., 2009). Consequently, the TIR contribution may underestimate the obscured star formation component in the SMC.

4 Results
4.1 Comparing velocities and line widths across tracers
Spectral line widths were measured by fitting Gaussian profiles to the observed emission lines and deriving the corresponding FWHM or velocity dispersion (Muller et al., 2010; Pineda et al., 2017, e.g.,). This provides a homogeneous framework for comparing the kinematic properties of different gas tracers in the low-metallicity interstellar medium of the SMC (Rubio et al., 2015, e.g.,).


Owing to the high velocity resolution of the available data (CO(2–1): km s-1, [C ii]: km s-1, and H i: km s-1), we are able to resolve narrow and complex features in the line profiles, particularly in the [C ii] 158 m emission. The top left panel of Figure 2 shows a comparison of the line profiles observed toward the N22-R1 region. The top panel presents the [C ii] spectrum, which exhibits a complex velocity structure with asymmetric wings, indicating the presence of multiple kinematic components that cannot be adequately described by a single Gaussian function, as commonly found in low-metallicity star-forming regions (Herrera-Camus et al., 2015; Pineda et al., 2017, e.g.,). In contrast, the CO and 13CO transitions display comparatively narrower and more symmetric profiles, tracing the denser molecular gas (Rubio et al., 2015, e.g.,). The H i emission is significantly broader reflecting the widespread character and large velocity dispersion of the atomic gas, particularly its warm component (Stanimirović et al., 2004; Pingel et al., 2022, e.g.,). These differences highlight the distinct kinematic regimes probed by each tracer and motivate a careful and homogeneous treatment of the linewidth measurements across gas phases.
To identify possible asymmetries, we perform multi-Gaussian fits and apply the Bayesian information criterion (BIC) to assess whether additional components significantly improve the fit. This approach allows us to identify spectra with deviations from a single Gaussian profile, while still adopting a FWHM as a uniform metric across the dataset. Figure 3 shows an example of this procedure for the region N22-R1. The middle panels present the resulting fits for the [C ii] (gold), CO(2–1) (light blue), and H i (brown) native spectra (gray), together with the individual Gaussian components (black dashed lines). The middle panels show the corresponding residuals, meanwhile the bottom panels display the BIC as a function of the number of Gaussian components, where the minimum value indicates the preferred model complexity.
In this example, the BIC favors a multi-component description for the [C ii] profile, while the CO(2–1) spectrum is well reproduced by a single Gaussian component. The H i line, in contrast, exhibits a broader and more structured profile requiring multiple components. N22-R1 therefore illustrates a behavior commonly observed across the SMC regions, where the [C ii] 158 m emission line displays a more complex kinematic structure than the CO(2–1) emission.
To determine which component of the multi-Gaussian [C ii] fit should be compared with the CO and H i components, we define a velocity matching criterion based on the relative peak positions. Specifically, we adopt a tolerance range for the velocity offset between the [C ii] peak and the CO and H i peaks of km s-1, corresponding to approximately 50% of the average single-component linewidth. This threshold allows velocity differences comparable to the channel width of the H i spectrum while remaining sufficiently restrictive to avoid associating clearly distinct kinematic components.
The results of the velocity and line width comparison are presented in Figure 4, where the gray shaded region indicates the adopted velocity-shift tolerance relative to the [C ii] centroid. We find that the [C ii] line widths systematically lie between those of CO(2-1) and H i, with CO typically exhibiting narrower profiles and H i broader ones. This trend supports a scenario in which [C ii] traces a combination of gas phases, arising from both the dense molecular component associated with CO emission and a more diffuse or extended component linked to atomic gas (Okada et al. 2015; Requena-Torres et al. 2016; Okada et al. 2019). The distribution of points in the FWHM comparison further reinforces this interpretation. Most CO measurements lie close to or below , indicating that CO traces the kinematically colder and more confined molecular cores. In contrast, H i exhibits systematically larger line widths, consistent with a more turbulent and spatially extended medium. The intermediate position of [C ii] suggests that a significant fraction of its emission originates in molecular gas not traced by CO, commonly referred to as CO-dark H2 (Wolfire et al. 2010; Pineda et al. 2013; Bolatto et al. 2013).
4.2 Decomposition analysis of the [C ii] transition
To isolate the CO-faint molecular gas traced by the [C ii] line emission, we first need to remove the contributions arising from the ionized and atomic gas phases. In low-metallicity star-forming regions, the [C ii] emission associated with ionized gas is generally small compared to that originating in photodissociation regions (PDRs; Kaufman et al. 1999). Previous estimates of the ionized gas contribution to the total [C ii] emission are typically % in the LMC (Lebouteiller et al., 2012; Okada et al., 2015; Pineda et al., 2017, e.g.,) and % in the SMC (Pineda et al., 2017; Requena-Torres et al., 2016, e.g.,). Jameson et al. (2018) presents Herschel PACS and SPIRE observations of these same regions in [C ii] and [N ii] emission and discusses the ionized gas contribution to [C ii], concluding that it is at most 5%. For these reasons we neglect the contribution of ionized gas to the [C ii] line emission of the SMC in this work.
To remove the atomic gas contribution to the [C ii] emission, we apply the method introduced by Tarantino et al. (2021) for nearby galaxies, in which the [C ii] line profile is modeled as a linear combination of the CO and H i line profiles, representing the molecular and atomic contributions, respectively. For the decomposition, we use Rayleigh–Jeans brightness temperatures as a measure of flux for the [C ii], CO(=2–1), and H i spectra:
| (5) |
where and are the linear coefficients that best reproduce the observed [C ii] emission, and is the modeled [C ii] profile. For the H i data, we consider the total multi-component spectrum at the velocity range where the [C ii] emission is located.
The coefficients are obtained through minimization:
| (6) |
where represents the rms noise of each rebinned spectrum, and the model is evaluated across spectral channels. Once the linear coefficients are obtained, we calculate the fractions of [C ii] emission associated with the molecular () and atomic () phases:
| (7) |
The integration limits are defined from the Gaussian fit to the observed [C ii] line. Specifically, we integrate over the velocity interval encompassing the fitted [C ii] emission profile and apply the same limits to the CO(=2–1) and H i spectra.
Since the spectral lines were observed with different instruments, we rebinned the line profiles to a common velocity resolution km s-1 to perform the analysis described above. For each H i velocity channel, we compute the mean [C ii] and CO emission over the corresponding velocity range. This approach enables a direct, channel-by-channel comparison for estimating the linear coefficients. Regarding the spatial resolution, H i resolution is significantly poorer than that of the [C ii] and CO (about a factor of 3). We decided not to convolve the [C ii] and CO maps to the H i spatial resolution in order to preserve the level of detail of the analysis. We do not expect this to significantly impact the results, as the H i spatial distribution is expected to be smoother than that of [C ii] and CO (See Figure 3).
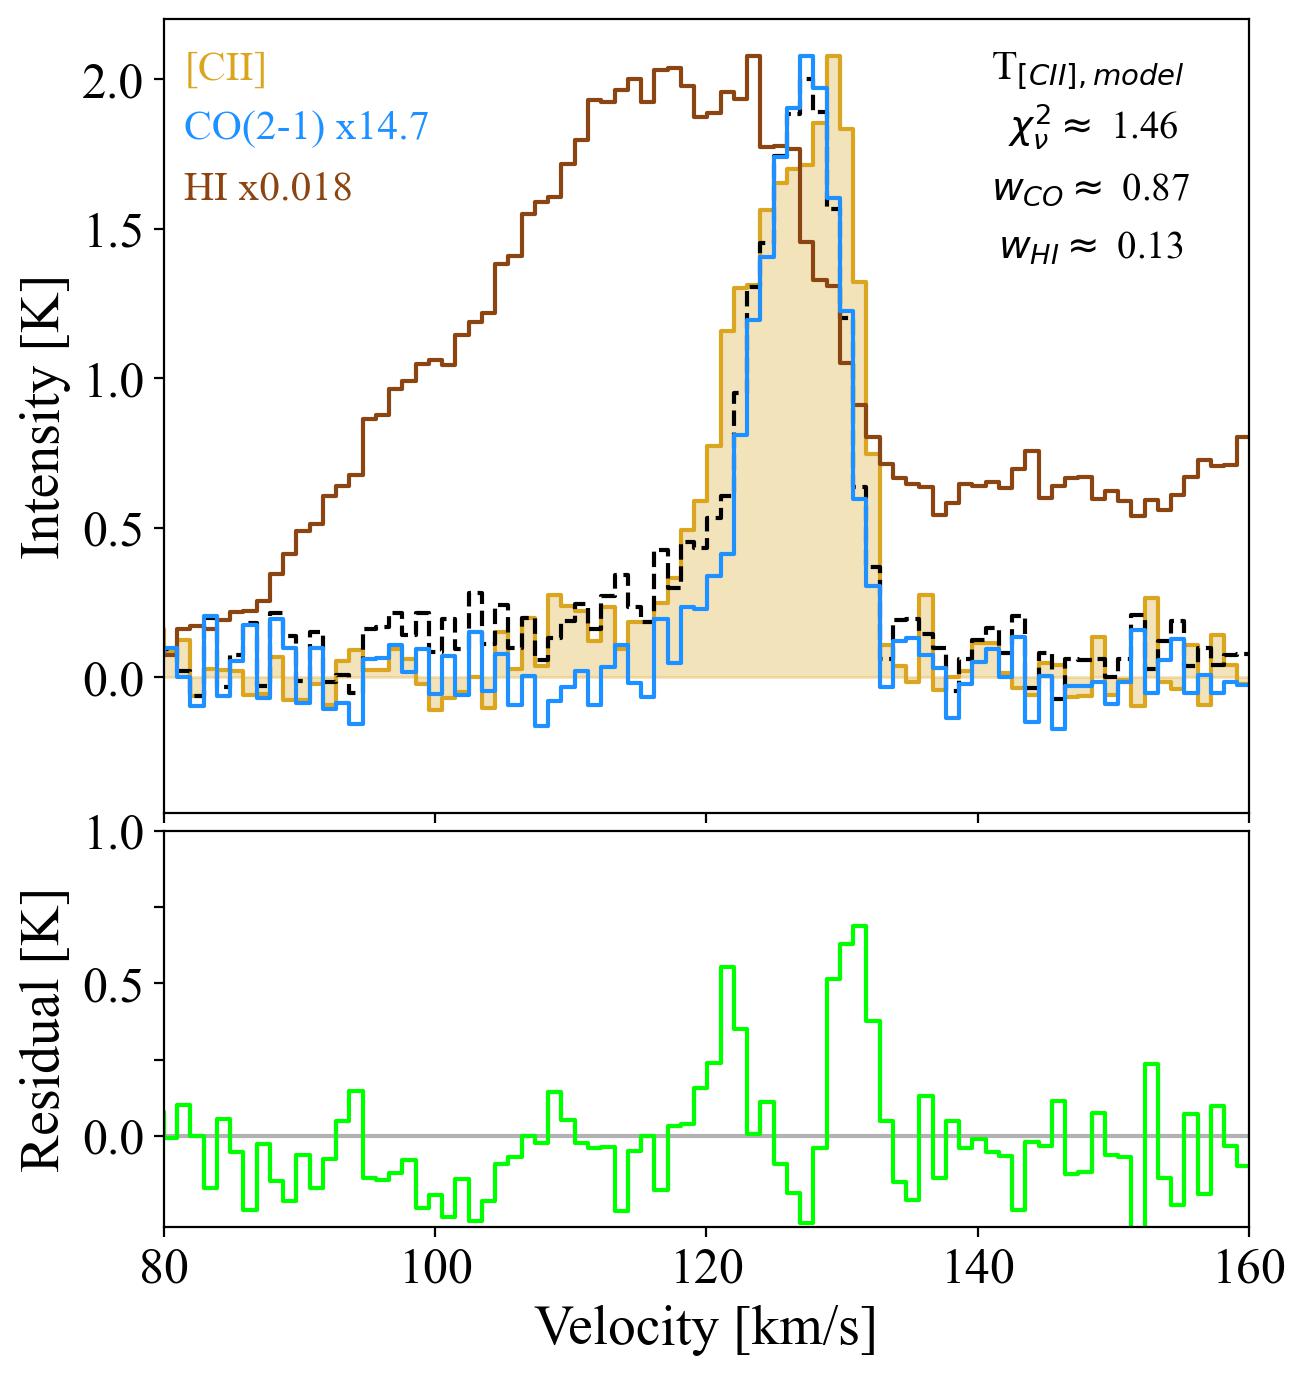
An example is shown in Figure 5, where the solid lines represent the rebinned [C ii] (gold), CO (light blue) and H i (brown), meanwhile the dashed black line corresponds to the modeled [C ii] emission. The [C ii] line profile lies between the H i and CO profiles, a behavior present in 9 out of the 10 analyzed regions. In addition, excess [C ii] 158 m emission at velocities that cannot be associated with CO is present in 8/10 of the regions (See Appendix B).
The [C ii] decomposition indicates that the gas associated with the CO-emitting molecular phase contributes, on average, of the total [C ii] emission, dominating over the atomic contribution. This result is illustrated in Figure 6, which also compares our measurements with those of Jameson et al. (2018) for the SMC and Tarantino et al. (2021) for two nearby galaxies. Our results are in very good agreement with the SMC measurements of Jameson et al. (2018). In contrast, Tarantino et al. (2021) find a more balanced molecular and atomic contribution to the [C ii] emission. We attribute this difference primarily to velocity and spatial resolution, and the metallicity of the studied regions. The analysis by Tarantino et al. (2021) has km s-1 on pc scales in M101 and NGC6946, while our work is on scales of pc and a velocity resolution km s-1. Also, their regions are in environments with higher metallicities (– versus for the SMC). These environmental conditions likely lead to a more evenly distributed molecular and atomic contribution to the [C ii] 158 m emission.
This result provides evidence for CO-faint H2 gas traced by [C ii] 158 m emission in low-metallicity environments (Requena-Torres et al., 2016; Langer et al., 2014; Pineda et al., 2014; Pineda et al., 2017). In most regions, the residual between the modeled [C ii] emission profiles, based on the linear decomposition, and the observed spectra lies above the spectral noise level (see the bottom panel of Fig. 5). Furthermore, the positive residuals are generally concentrated near the velocity range where CO emission peaks, suggesting that this excess [C ii] emission is kinematically associated with the molecular component rather than with unrelated atomic gas. This behavior is consistent with a scenario in which [C ii] traces molecular gas that shares the same dynamical structure as the CO-emitting material but remains weak or undetected in CO due to photodissociation effects in low-metallicity environments, where reduced dust shielding allows UV photons to penetrate deeper into molecular clouds, enlarging the C+/H2 layer surrounding dense CO cores (Wolfire et al., 2010; Langer et al., 2014; Pineda et al., 2017). Therefore, the residual emission provides additional evidence for an extended reservoir of CO-faint molecular gas surrounding the denser CO-bright regions.
Regarding the rebinning to a common spectral resolution between [C ii], CO, and H i, we do not expect this to introduce systematic effects unless the components were extraordinarily narrow, which we do not observe in the lines at native spectral resolution.
| SMC region | |||
|---|---|---|---|
| N22 | |||
| SWbarN | |||
| N83 | |||
| SWbarS |

5 The CO-faint gas in the SMC: Tracing H2 with CO and [C ii]
In the previous section, we have shown that kinematically most of the [C ii] emission is associated with CO-bright molecular gas, while very little () appears related to the H i in emission. Moreover, the residuals have velocities that are strongly clustered around the CO emission, suggesting that they are either due to CO-faint molecular gas or possibly a cold phase of H i that is enveloping the CO-emitting gas.
Thus, due to the photodissociation of CO in the outer layers of an H i/PDR/molecular cloud complex, it is necessary to consider the contributions of both CO and [C ii] emission to the total estimate of the H2 column density:
| (8) |
where and represent the molecular gas at low and high extinction, respectively. In this section, we derive independently from [C ii] and CO and quantify the fraction of molecular gas that is not traced by CO line emission in the low-metallicity environment of the SMC.
5.1 Converting to
Studies of [C ii] 158 m emission in low-metallicity star-forming regions suggest that the [C ii]-emitting envelopes surrounding molecular clouds are generally optically thin for gas temperatures above K, allowing the observed emission to be directly related to the column density of C+ through collisional excitation models (LMC: Israel et al. 1996; SMC: Israel and Maloney 2011). Following the formalism presented by Jameson et al. (2018), the H2 column density associated with the molecular component traced by [C ii] can be expressed as:
| (9) |
where is the integrated [C ii] intensity in unit of K km s-1, associated with the molecular component (), is the density of the collisional partner, is the gas temperature, and is the critical density for collisions with H2 (Crawford et al., 1985). The carbon abundance adopted for the SMC is , obtained by scaling the Galactic abundance according to the metallicity of the SMC (Jameson et al., 2018).
The critical density for collisions with H2 is:
| (10) |
, where the collisional de-excitation rate coefficient for [C ii]-H2 interactions, including hydrogen spin effects in LTE, is cm3 s-1 (Wiesenfeld and Goldsmith, 2014), and s-1 (Carilli and Walter, 2013). As an example, the critical density at TE K is therefore cm-3.
To convert the [C ii] emission into a molecular gas column density, we first use Eq. 9 to calculate N(H2)[C ii] for each SMC region from the corresponding integrated molecular [C ii] intensity, (), obtained from the decomposition analysis. The resulting column densities are then averaged to derive a mean value for the SMC. This conversion requires adopting representative gas conditions (density and temperature), which determine the [C ii] excitation. Jameson et al. (2018) constrained the properties of PDR gas using PDR Toolbox with updated SMC models, and find that the typical volume densities are cm-3. We assume an average density ( cm-3) and a temperature K that resemble the excitation temperature and critical density of the transition (Wiesenfeld and Goldsmith, 2014), following Jameson et al. (2018), and consistent with warm and moderately dense PDRs. These values are based on the PDR models of Kaufman et al. (2006), with updated gas and grain-surface chemistry from Wolfire et al. (2010) and Hollenbach et al. (2012). At this temperature and density, the inferred H2 column densities are approximately a factor of three larger than those obtained under the high-density, high-temperature limit corresponding to maximum [C ii] excitation. To evaluate the sensitivity of the derived column densities to the adopted density, we calculated N(H)[C ii] assuming cm-3, while keeping K fixed. The resulting column densities are higher than those obtained for the assumed density, cm-3, by an average of . This indicates that the adopted density introduces a small systematic uncertainty in the derived molecular gas column densities.
5.2 Converting to
In the inner parts of molecular clouds, where shielding from the incident FUV radiation is sufficient to prevent CO from being photodissociated (Wolfire et al., 2010; Lee et al., 2015), the molecular gas column density can be estimated using the CO integrated intensity method,
| (11) |
where is the H2 column density, is the CO-to-H2 conversion factor in units of cm-2 (K km s-1)-1, and is the rebinned CO integrated intensity in K km s-1.
Although the low metallicity of the SMC is expected to increase the effective CO-to-H conversion factor, , owing to the presence of extended CO-faint molecular envelopes (Leroy et al., 2011, e.g.,), simulations by Shetty et al. (2011) have shown that, in the densest and CO-bright regions of molecular clouds in the SMC, the Galactic conversion factor estimated by Bolatto et al. (2008), cm-2 (K km s-1)-1, which is the canonical value for CO(1-0) assuming a CO line ratio , can still provide a reasonable approximation. Furthermore, Jameson et al. (2018) estimated the conversion factor for CO-bright regions in the SMC and obtained median values of - cm-2 (K km s-1)-1, consistent with a Milky Way value of . Given these simulation results, we adopt a Galactic CO-to-H conversion factor of cm-2 (K km s-1)-1 (Bolatto et al., 2013) to estimate the molecular gas content in regions of high extinction where most of the carbon is in the form of CO. This choice is consistent with a scenario in which the main driver of the enhanced effective conversion factor in low-metallicity systems is the shrinking of the high- CO-emitting cores and the growth of an outer H2 layer coextensive with C+ (Wolfire et al., 2010; Bolatto et al., 2013, e.g.,).
5.3 Comparing the [C ii]- and CO-based
In Figure 7 we show that the molecular hydrogen traced by [C ii], N(H2)[C ii], accounts on average for roughly of the total molecular gas column density, N(H2)total. The column density values derived from CO, [C ii], and their combined contribution (CO+[C ii]) for each region are reported in Table 2. This corroborates that a substantial fraction of the molecular reservoir of the SMC is in the CO-faint phase, confirming results reported for the SMC using the same technique with Herschel PACS measurements (Jameson et al., 2018), as well other results using velocity-resolved [C ii] data for low-metallicity systems (Pineda et al., 2014; Pineda et al., 2017, e.g.,). The dominance of [C ii]–bright, CO-faint gas emphasizes that the H2 content inferred from CO alone would underestimate the true molecular mass by almost a factor of 4 under low-metallicity conditions.
Figure 7 also shows, however, that no significant correlation is found between N(H2)[C ii]/N(H2)total and either the total molecular column density or the star formation rate surface density, . This lack of correlation suggests that the fraction of CO-faint gas is not mainly set by how dense or active in star formation a region is, but instead by how efficiently the gas and dust can shield molecules from the surrounding radiation field. Similar trends have been reported in other nearby dwarf galaxies (e.g. Lebouteiller et al. 2012; Madden et al. 2020), where [C ii] remains the main coolant of both quiet and active regions. These results indicate that in the SMC, the CO-dark molecular phase is widespread and relatively stable, and its presence does not depend strongly on the current level of star formation.
The aforementioned is consistent with the physical picture proposed for low-metallicity dwarf galaxies by Cormier et al. (2019), in which the reduced dust abundance produces a highly porous multiphase ISM, allowing far-ultraviolet radiation to penetrate deeper into molecular clouds. Under these conditions, the C+/H2 envelopes surrounding molecular clouds become spatially extended while the well-shielded CO cores shrink, increasing the fraction of molecular gas that remains invisible in CO emission.
We can use these data to compute an factor applicable on pc scales near CO-bright regions of the SMC. By solving the equation 11 for , using as the total molecular gas column density, and as the weighted average of the integrated CO(2-1) intensity across the SMC regions, we estimate a CO(2-1) conversion factor cm-2(K km s-1)-1. The Galactic conversion factor is typically calibrated for the CO(1-0) transition. Assuming a line ratio for the SMC (Rubio et al. 1996), our result is 4.5 times larger than the canonical Galactic conversion factor ( cm-2(K km s-1)-1) (Bolatto et al., 2008) reflecting the reduced CO abundance and enhanced CO–faint molecular gas expected in metal-poor environments.
Previous studies have shown that the CO-to-H2 conversion factor in the SMC is significantly larger than in the Milky Way, although the inferred value depends strongly on the adopted tracer and spatial scale. Measurements based on virial masses of resolved molecular clouds typically yield – cm-2 (K km s-1)-1 (Bolatto et al., 2003), while dust-based analyses that account for the extended CO-faint molecular reservoir find substantially larger values, reaching – cm-2 (K km s-1)-1 across the SMC (Rubio et al., 1996; Leroy et al., 2007; Leroy et al., 2011). Leroy et al. (2011) used Spitzer observations to model the dust emission of the SMC and concluded that the factor on large scales is times larger than in the Milky Way. Jameson et al. (2016) modeled Herschel dust mapping of the SMC to find that the molecular mass of the galaxy is times larger than that derived from its CO luminosity and a Galactic conversion factor. More recent studies combining [C ii], [C i], and CO observations have further demonstrated that a substantial fraction of the molecular gas in low-metallicity systems is CO-dark, leading to effectively larger conversion factors when the total H2 mass is considered (e.g., Pineda et al. (2017), who found cm-2 (K km s-1)-1 depending on the region). Our estimate of cm-2 (K km s-1)-1 therefore lies within the range of values reported for individual molecular complexes in the SMC, while still reflecting the influence of a substantial CO–faint molecular component.
5.4 N83-R2, N83-R4 and SWDarkPeak-R7
The tracing of the total molecular gas content in the SMC is assessed mainly through the [C ii] 158 m emission of the selected regions, so we cannot carry this examination in N83-R4, since there is no detection of CO(2-1) in the position of the central pixel of the SOFIA/upGREAT array. To perform the linear decomposition of the [C ii] 158 m emission line described in section 4.1 it is necessary to have spectra with at least (Tarantino et al., 2021). Since the kinematic intensity peak of CO emission line in N83-R2 is shifted from that of [C ii] by km s-1, out of our tolerance range, and the CO(2-1) spectrum of the SWDarkPeak has a , we did not include these regions in the CO-dark molecular gas estimation.
| Component | |||
|---|---|---|---|
| SWDarkPeak-A | 0.12 | - | - |
| SWDarkPeak-B | 3.6 | 0.46 | 0.13 |
6 The interesting case of SWDarkPeak
The SWDarkPeak region was found in the dust-based mapping of molecular gas in the SMC by Bolatto et al. (2011) and Jameson et al. (2016) as a likely molecular peak (based on its high dust-to-H i ratio) with no known CO emission. Later CO mapping reported by Jameson et al. (2018) detected faint CO emission within the velocity range -160 km s-1, and measured high [C ii]/CO ratios. The nature of the SWDarkPeak region makes it an ideal laboratory to study the transition between CO-dark and CO-bright molecular gas. In contrast to other SMC regions, SWDarkPeak shows no associated bright H emission, indicating a lack of significant massive star formation and suggesting that the observed [C ii] emission arises primarily from photodissociation regions associated with diffuse or weakly shielded molecular gas.
We analyze this low-metallicity region to investigate the impact of PDR conditions on the ability of CO to trace molecular gas. In Fig. 8, we present the newly acquired [C i] spectrum (), together with the existing H i, CO, and [C ii] data. Thanks to the high spectral resolution of our observations, we identify two distinct kinematic components along the line of sight toward SWDarkPeak: SWDarkPeak-A (dashed black line) and SWDarkPeak-B (dotted black line). The strong [C ii] emission detected at km s-1, which lacks a corresponding [C i] and strong CO counterpart, most likely arises from a CO-dark molecular phase in which hydrogen is predominantly molecular while carbon remains ionized due to reduced dust shielding in the low-metallicity environment (Wolfire et al. 2010; Bolatto et al. 2013; Pineda et al. 2013). In contrast, the CO(2-1) and [C i] emission detected at km s-1 trace a more shielded molecular component in which carbon has largely transitioned to neutral and molecular (CO) form.
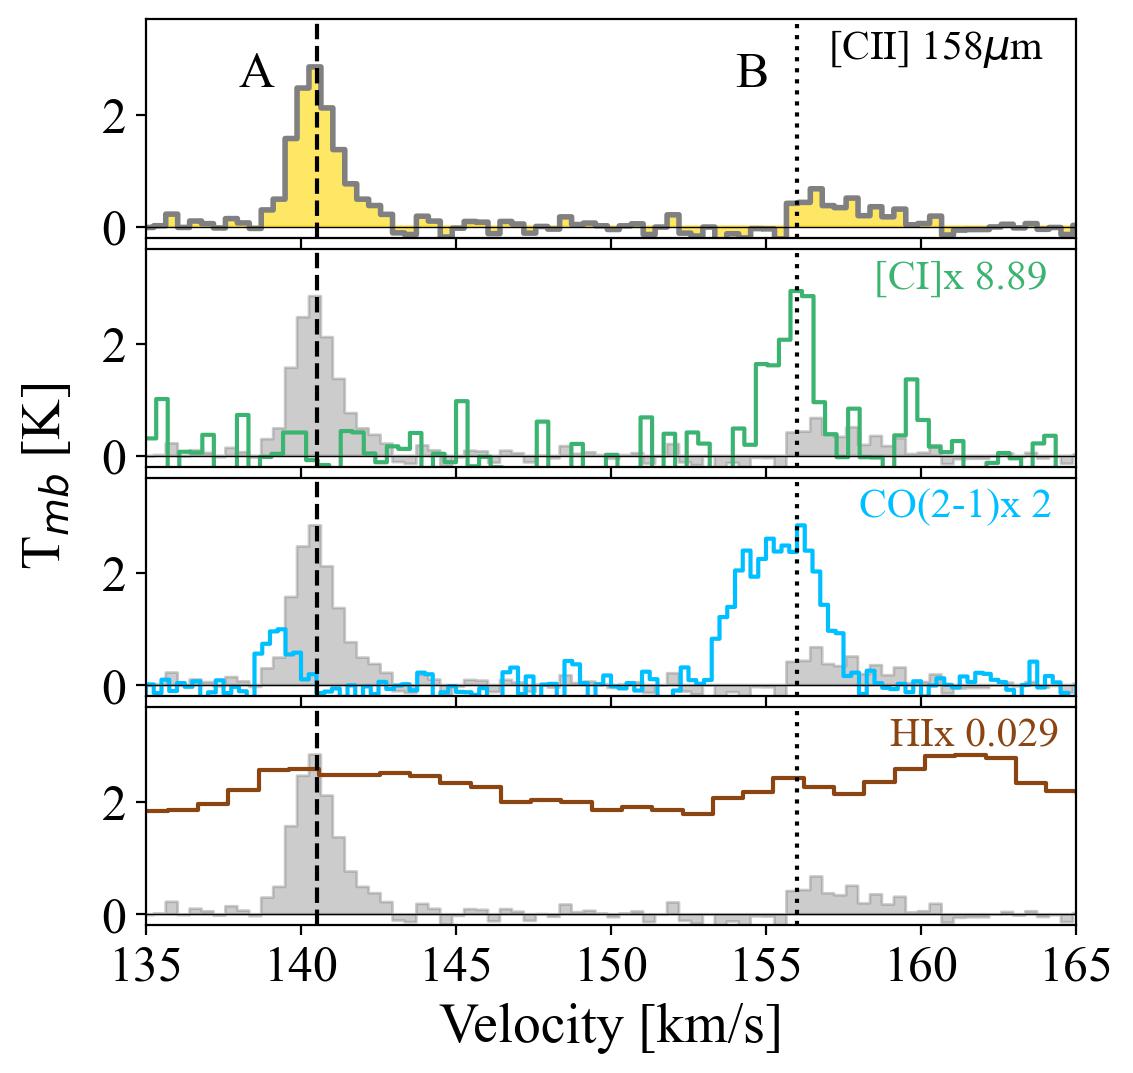
To probe the nature of these two kinematic components, we use our estimates of the molecular gas contribution to the [C ii] 158 m emission (; see Figure 6) to derive the corresponding molecular hydrogen column densities traced by [C ii] and CO. For the SWDarkPeak-A component ( km s-1), we obtain [cm-2] and cm-2, implying a CO-dark molecular gas fraction of . In contrast, for the SWDarkPeak-B component ( km s-1), we measure cm-2 and cm-2, corresponding to . These results suggest that the SWDarkPeak line of sight intercepts two physically distinct molecular environments: a CO-dark molecular component traced primarily by [C ii] emission at km s-1 and a more shielded molecular cloud traced by CO and [C i] at km s-1.
The simultaneous detection of [C ii], [C i], and CO toward the SWDarkPeak-B component further allows us to probe the carbon phase balance within the molecular gas. We compare the integrated line intensities of the three tracers and derive the ratios , and for each velocity component. As shown in Table 3, the SWDarkPeak-A component exhibits a very low ratio together with an undetected [C i] counterpart, indicating that the carbon reservoir is dominated by ionized carbon. In contrast, the SWDarkPeak-B component shows detected [C i] and CO emission, suggesting that carbon has largely transitioned from C+ to neutral and, mostly, molecular forms. This behavior follows the classical stratification expected in photodissociation regions, where the dominant carbon phase evolves from C+ to C0 and finally to CO with increasing shielding (Tielens and Hollenbach, 1985; Hollenbach and Tielens, 1999).
7 Conclusions
- 1.
Using velocity-resolved SOFIA/GREAT and upGREAT [C ii] 158 m, APEX, and ASKAP+Parkes H i 21 cm observations, we decomposed the [C ii] emission in several regions of the Small Magellanic Cloud into atomic and molecular components following the approach of Tarantino et al. (2021). On average, of the [C ii] luminosity arises from the molecular phase, while is associated with atomic gas, confirming that [C ii] predominantly traces molecular gas in low-metallicity environments (Requena-Torres et al., 2016; Langer et al., 2014; Pineda et al., 2014, e.g.,).
- 2.
The residuals of the [C ii] decomposition are mostly positive, indicating that the linear fitting approach tends to underestimate the [C ii] emission fractions, particularly from the molecular component. A small additional contribution () may arise from ionized gas, as suggested by Herrera-Camus et al. (2016) and Croxall et al. (2017). Complementary [N ii] observations would be necessary to quantify this contribution in detail for the SMC.
- 3.
Converting the decomposed [C ii] emission into column densities using the approach described in Section 5.1, we find that the [C ii] traced H2 accounts for roughly of the total molecular gas column density, with the remaining traced by CO. This demonstrates that the bulk of the molecular gas in the SMC is CO-faint, consistent with results obtained for other low-metallicity systems (Pineda et al., 2017; Jameson et al., 2018; Madden et al., 2020, e.g.,).
We find that the CO-to-H2 conversion factor on pc scales and in the proximity of CO emitting molecular complexes is cm-2 (K km s-1)-1 after accounting for the H2 mixed with both the C+ and the CO, about 4.5 times larger than the canonical Galactic conversion factor.
- 4.
We find no significant correlation between the CO-dark fraction, , and either the total molecular column density or the star formation rate surface density. This suggests that the abundance of CO-faint gas is not primarily driven by local density or star formation, but instead by the efficiency of dust and gas shielding against the FUV radiation field, which scales with metallicity (e.g., Bolatto et al. 2013; Leroy et al. 2011; Okada et al. 2019). Future work will explore the spatially resolved spectroscopic data from the Local Volume Mapper (LVM) of SDSS-V Kollmeier et al. (2019) to investigate possible metallicity gradients across the SMC and their effect on the [C ii]/CO relation.
Our study demonstrates that [C ii] is the dominant tracer of molecular gas in the SMC (77%) and likely in other metal-poor systems. The CO-dark molecular phase represents an extended, stable, and significant component of the low-metallicity interstellar medium that is not primarily driven by stellar feedback, but rather by chemical processes. This provides an important clue for interpreting [C ii] emission in unresolved galaxies (e.g., Cormier et al. 2019; Okada et al. 2019).
Acknowledgements.
R.H.-C. thanks the Max Planck Society for support under the Partner Group project "The Baryon Cycle in Galaxies" between the Max Planck for Extraterrestrial Physics and the Universidad de Concepción. R.H-C. and K.R-A. also gratefully acknowledge financial support from ANID - MILENIO - NCN2024_112 and ANID BASAL FB210003 M.R. and K.R-A wishes to acknowledge partial support from ANID (CHILE) through Basal FB210003 and through FONDECYT grant No1190684. We also wish to thank Mariana Muñoz for reducing the CO(2-1) APEX data and Jérémy Chastenet for kindly handed us the DL07 SMC maps. Finally, we thank the referee for the helpful and constructive comments, which have improved the manuscript.References
- Modeling Dust and Starlight in Galaxies Observed by Spitzer and Herschel: NGC 628 and NGC 6946. ApJ 756 (2), pp. 138. External Links: Document, 1207.4186, ADS entry Cited by: §3.1.
- Unusual CO Line Ratios and Kinematics in the N83/N84 Region of the Small Magellanic Cloud. ApJ 595 (1), pp. 167–178. External Links: Document, astro-ph/0306144, ADS entry Cited by: §5.3.
- The State of the Gas and the Relation between Gas and Star Formation at Low Metallicity: The Small Magellanic Cloud. ApJ 741 (1), pp. 12. Cited by: §1, §6.
- The Resolved Properties of Extragalactic Giant Molecular Clouds. ApJ 686 (2), pp. 948–965. External Links: Document, 0807.0009, ADS entry Cited by: §5.2, §5.3.
- The CO-to-H Conversion Factor. ARA&A 51 (1), pp. 207–268. External Links: Document, 1301.3498, ADS entry Cited by: §1, §4.1, §5.2, §6, item 4.
- Cool Gas in High-Redshift Galaxies. ARA&A 51 (1), pp. 105–161. External Links: Document, 1301.0371, ADS entry Cited by: §5.1.
- The Polycyclic Aromatic Hydrocarbon Mass Fraction on a 10 pc Scale in the Magellanic Clouds. ApJ 876 (1), pp. 62. External Links: Document, 1904.02705, ADS entry Cited by: §3.1.
- The Resolved Behavior of Dust Mass, Polycyclic Aromatic Hydrocarbon Fraction, and Radiation Field in 800 Nearby Galaxies. ApJS 276 (1), pp. 2. External Links: Document, 2410.03835, ADS entry Cited by: §3.2.
- The Herschel Dwarf Galaxy Survey. II. Physical conditions, origin of [C II] emission, and porosity of the multiphase low-metallicity ISM. A&A 626, pp. A23. External Links: Document, 1904.08434, ADS entry Cited by: §1, §5.3, §7.
- Far-infrared spectroscopy of galaxies : the 158 micron C+ line and the energy balance of molecular clouds.. ApJ 291, pp. 755–771. External Links: Document, ADS entry Cited by: §5.1.
- The Origins of [C II] Emission in Local Star-forming Galaxies. ApJ 845 (2), pp. 96. External Links: Document, 1707.04435, ADS entry Cited by: §1, item 2.
- The applicability of far-infrared fine-structure lines as star formation rate tracers over wide ranges of metallicities and galaxy types. A&A 568, pp. A62. Cited by: §1.
- Dust Masses, PAH Abundances, and Starlight Intensities in the SINGS Galaxy Sample. ApJ 663 (2), pp. 866–894. External Links: Document, astro-ph/0703213, ADS entry Cited by: §3.1, §3.1.
- Calibration of the total infrared luminosity of nearby galaxies from Spitzer and Herschel bands. MNRAS 431 (2), pp. 1956–1986. External Links: Document, 1302.4363, ADS entry Cited by: §3.2, §3.2.
- Dust-corrected Star Formation Rates of Galaxies. II. Combinations of Ultraviolet and Infrared Tracers. ApJ 741 (2), pp. 124. External Links: Document, 1108.2837, ADS entry Cited by: §3.3.
- [C II] 158 m Emission as a Star Formation Tracer. ApJ 800 (1), pp. 1. External Links: Document, 1409.7123, ADS entry Cited by: §1, §4.1.
- The Ionized Gas in Nearby Galaxies as Traced by the [N II] 122 and 205 m Transitions. ApJ 826 (2), pp. 175. External Links: Document, 1605.03180, ADS entry Cited by: §1, item 2.
- SHINING, A Survey of Far-infrared Lines in Nearby Galaxies. I. Survey Description, Observational Trends, and Line Diagnostics. ApJ 861 (2), pp. 94. External Links: Document, 1803.04419, ADS entry Cited by: §1.
- GREAT: the SOFIA high-frequency heterodyne instrument. A&A 542, pp. L1. External Links: Document, 1203.2845, ADS entry Cited by: §2.1.
- Photodissociation regions in the interstellar medium of galaxies. Reviews of Modern Physics 71 (1), pp. 173. Cited by: §6.
- The Chemistry of Interstellar OH, HO, and HO: Inferring the Cosmic-Ray Ionization Rates from Observations of Molecular Ions. ApJ 754 (2), pp. 105. External Links: Document, 1205.6446, ADS entry Cited by: §1, §5.1.
- C + Emission from the Magellanic Clouds. I. The Bright H II Region Complexes N159 and N160. ApJ 465, pp. 738. External Links: Document, ADS entry Cited by: §5.1.
- C emission from the Magellanic Clouds. II. [C II] maps of star-forming regions LMC-N 11, SMC-N 66, and several others. A&A 531, pp. A19. External Links: Document, 1104.2047, ADS entry Cited by: §1, §5.1.
- The Relationship Between Molecular Gas, H I, and Star Formation in the Low-mass, Low-metallicity Magellanic Clouds. ApJ 825 (1), pp. 12. Cited by: §5.3, §6.
- First Results from the Herschel and ALMA Spectroscopic Surveys of the SMC: The Relationship between [C II]-bright Gas and CO-bright Gas at Low Metallicity. ApJ 853 (2), pp. 111. External Links: Document, 1801.03518, ADS entry Cited by: §1, §1, Figure 6, Figure 6, §4.2, §4.2, §5.1, §5.1, §5.1, §5.2, §5.3, §6, item 3.
- Far-Infrared and Submillimeter Emission from Galactic and Extragalactic Photodissociation Regions. ApJ 527 (2), pp. 795–813. External Links: Document, astro-ph/9907255, ADS entry Cited by: §1, §4.2.
- [Si II], [Fe II], [C II], and H Emission from Massive Star-forming Regions. ApJ 644 (1), pp. 283–299. External Links: Document, ADS entry Cited by: §1, §5.1.
- Star Formation in the Milky Way and Nearby Galaxies. ARA&A 50, pp. 531–608. External Links: Document, 1204.3552, ADS entry Cited by: §3.3.
- Dust-corrected Star Formation Rates of Galaxies. I. Combinations of H and Infrared Tracers. ApJ 703 (2), pp. 1672–1695. Cited by: §3.3, §3.3.
- FLASH(+) —A Dual-Channel Wide-Band Spectrometer for APEX. IEEE Transactions on Terahertz Science and Technology 4 (5), pp. 588–596. Cited by: §2.2.
- SDSS-v: pioneering panoptic spectroscopy. BAAS 51, pp. 274. Cited by: item 4.
- On the variation of the initial mass function. MNRAS 322 (2), pp. 231–246. External Links: Document, astro-ph/0009005, ADS entry Cited by: §3.3.
- Hubble Space Telescope Observations of the Dusty Small Magellanic Cloud H II Region N88A. ApJ 518 (1), pp. 246–261. External Links: Document, ADS entry Cited by: §1.
- A Herschel [C ii] Galactic plane survey. II. CO-dark H in clouds. A&A 561, pp. A122. External Links: Document, 1312.3320, ADS entry Cited by: Figure 9, Figure 9, §1, §4.2, item 1.
- Physical conditions in the gas phases of the giant H II region LMC-N 11 unveiled by Herschel . I. Diffuse [C II] and [O III] emission in LMC-N 11B. A&A 548, pp. A91. External Links: Document, 1209.6057, ADS entry Cited by: §4.2, §5.3.
- The relationship between CO emission and visual extinction traced by dust emission in the Magellanic Clouds. MNRAS 450 (3), pp. 2708–2726. External Links: Document, 1504.02548, ADS entry Cited by: §5.2.
- The Spitzer Survey of the Small Magellanic Cloud: Far-Infrared Emission and Cold Gas in the Small Magellanic Cloud. ApJ 658 (2), pp. 1027–1046. Cited by: §5.3.
- The CO-to-H Conversion Factor from Infrared Dust Emission across the Local Group. ApJ 737 (1), pp. 12. External Links: Document, 1102.4618, ADS entry Cited by: §5.2, §5.3, item 4.
- Tracing the total molecular gas in galaxies: [CII] and the CO-dark gas. A&A 643, pp. A141. External Links: Document, 2009.00649, ADS entry Cited by: §1, §5.3, item 3.
- The Evolving Interstellar Medium of Star-forming Galaxies since z = 2 as Probed by Their Infrared Spectral Energy Distributions. ApJ 760 (1), pp. 6. External Links: Document, 1210.1035, ADS entry Cited by: §3.1.
- The HERSCHEL Inventory of The Agents of Galaxy Evolution in the Magellanic Clouds, a Herschel Open Time Key Program. AJ 146 (3), pp. 62. External Links: Document, ADS entry Cited by: §3.2.
- Characterizing the Low-Mass Molecular Component in the Northern Small Magellanic Cloud. ApJ 712 (2), pp. 1248–1258. External Links: Document, 1001.4757, ADS entry Cited by: §4.1.
- Velocity profiles of [C], [C], CO, and [O] and physical conditions in four star-forming regions in the Large Magellanic Cloud. A&A 621, pp. A62. External Links: Document, 1808.08826, ADS entry Cited by: §1, §4.1, item 4, §7.
- Velocity resolved [C ii], [C i], and CO observations of the N159 star-forming region in the Large Magellanic Cloud: a complex velocity structure and variation of the column densities. A&A 580, pp. A54. External Links: Document, 1506.01860, ADS entry Cited by: §4.1, §4.2.
- CNO Abundances in Dwarf and Spiral Galaxies (invited review). In CNO in the Universe, C. Charbonnel, D. Schaerer, and G. Meynet (Eds.), Astronomical Society of the Pacific Conference Series, Vol. 304, pp. 187. External Links: ADS entry Cited by: §1.
- A Herschel [C II] Galactic plane survey. III. [C II] as a tracer of star formation. A&A 570, pp. A121. External Links: Document, 1409.0537, ADS entry Cited by: §4.2, §5.3, item 1.
- A Herschel [C ii] Galactic plane survey. I. The global distribution of ISM gas components. A&A 554, pp. A103. External Links: Document, 1304.7770, ADS entry Cited by: §1, §4.1, §6.
- Characterizing the Transition from Diffuse Atomic to Dense Molecular Clouds in the Magellanic Clouds with [C II], [C I], and CO. ApJ 839 (2), pp. 107. External Links: Document, 1704.00739, ADS entry Cited by: Figure 9, Figure 9, §1, §1, §4.1, §4.1, §4.2, §4.2, §5.3, §5.3, item 3.
- GASKAP-HI pilot survey science I: ASKAP zoom observations of HI emission in the Small Magellanic Cloud. PASA 39, pp. e005. External Links: Document, 2111.05339, ADS entry Cited by: §2.3, §4.1.
- Carbon gas in SMC low-metallicity star-forming regions. A&A 589, pp. A28. External Links: Document, 1602.07719, ADS entry Cited by: §1, §4.1, §4.2, §4.2, item 1.
- UpGREAT: upgrade of the german receiver for astronomy at terahertz frequencies. JAI 7, pp. 1840014. Cited by: §2.1.
- Results of the ESO-SEST Key Programme: CO in the Magellanic Clouds. V. Further CO observations of the Small Magellanic Cloud.. A&AS 118, pp. 263–275. External Links: ADS entry Cited by: §5.3, §5.3.
- Results of the ESO-SEST key programme: CO in the Magellanic clouds. III. Molecular gas in the small Magellanic Cloud.. A&A 271, pp. 9–17. Cited by: §1.
- Dense cloud cores revealed by CO in the low metallicity dwarf galaxy WLM. Nature 525 (7568), pp. 218–221. External Links: Document, 1603.04736, ADS entry Cited by: §4.1, §4.1.
- CO(2‒1) survey at 9 pc resolution in the Small Magellanic Cloud. A&A 672, pp. A153. External Links: Document, 2211.07792, ADS entry Cited by: §2.2.
- The Spitzer Survey of the Small Magellanic Cloud (SMC): Insights into the Life Cycle of Polycyclic Aromatic Hydrocarbons. ApJ 715 (2), pp. 701–723. External Links: Document, 1003.4516, ADS entry Cited by: §3.1.
- Modelling CO emission - II. The physical characteristics that determine the X factor in Galactic molecular clouds. MNRAS 415 (4), pp. 3253–3274. External Links: Document, 1104.3695, ADS entry Cited by: §5.2.
- The Spatial Distribution of Dust and Stellar Emission of the Magellanic Clouds. ApJ 761 (1), pp. 42. External Links: Document, 1210.7812, ADS entry Cited by: §1.
- A New Look at the Kinematics of Neutral Hydrogen in the Small Magellanic Cloud. ApJ 604 (1), pp. 176–186. External Links: Document, astro-ph/0312223, ADS entry Cited by: §4.1.
- Characterizing the Multiphase Origin of [C II] Emission in M101 and NGC 6946 with Velocity-resolved Spectroscopy. ApJ 915 (2), pp. 92. External Links: Document, 2104.13452, ADS entry Cited by: §1, Figure 6, Figure 6, §4.2, §4.2, §5.4, item 1.
- Photodissociation regions. I. Basic model.. ApJ 291, pp. 722–746. External Links: Document, ADS entry Cited by: §6.
- C in the Interstellar Medium: Collisional Excitation by H Revisited. ApJ 780 (2), pp. 183. External Links: Document, 1312.0282, ADS entry Cited by: §5.1, §5.1.
- The Interstellar Medium in the Small Magellanic Cloud: Results from MCELS. In Fifty Years of Wide Field Studies in the Southern Hemisphere: Resolved Stellar Populations of the Galactic Bulge and Magellanic Clouds, S. Points and A. Kunder (Eds.), Astronomical Society of the Pacific Conference Series, Vol. 491, pp. 343. External Links: ADS entry Cited by: §3.3.
- The Dark Molecular Gas. ApJ 716 (2), pp. 1191–1207. External Links: Document, 1004.5401, ADS entry Cited by: Figure 9, Figure 9, §1, §1, §4.1, §4.2, §5.1, §5.2, §5.2, §6.
- Neutral Atomic Phases of the Interstellar Medium in the Galaxy. ApJ 587 (1), pp. 278–311. Cited by: §1.
Appendix A Measured Spectral Properties
| [C ii] | CO | H I | |||||||
| Region | 1 11 1 11 Estimated velocity peak position of the spectral line’s main Gaussian component in [km s-1] | 2 22 2 22 Measured line width of the spectral line’s main Gaussian component in units of [km s-1] | 3 33 3 33 Integrated intensity [K km s-1] of the whole line profile. | 1 11 1 11 Estimated velocity peak position of the spectral line’s main Gaussian component in [km s-1] | 2 22 2 22 Measured line width of the spectral line’s main Gaussian component in units of [km s-1] | 3 33 3 33 Integrated intensity [K km s-1] of the whole line profile. | 1 11 1 11 Estimated velocity peak position of the spectral line’s main Gaussian component in [km s-1] | 2 22 2 22 Measured line width of the spectral line’s main Gaussian component in units of [km s-1] | 3 33 3 33 Integrated intensity [K km s-1] of the whole line profile. |
| N83-R1 | 164.1 | 2.278 | 9.87 | 163.3 | 1.730 | 4.638 | 182.3 | 10.39 | 3437 |
| N83-R2 | 159.3 | 5.185 | 12.35 | 163.7 | 2.714 | 5.673 | 170.4 | 12.58 | 2426 |
| N83-R3 | 161.7 | 3.707 | 18.69 | 162.0 | 3.079 | 14.45 | 178.0 | 16.96 | 3701 |
| N83-R4 | 166.3 | 3.56 | 22.05 | - | - | - | 165.2 | 16.86 | 3502 |
| SWbarS-R5 | 124.6 | 9.240 | 23.69 | 126.3 | 6.776 | 15.05 | 120.96 | 22.62 | 4544 |
| SWbarS-R6 | 124.8 | 4.158 | 22.31 | 124.7 | 3.211 | 4.60 | 119.4 | 25.44 | 4306 |
| SWbDarkPeak-R7 | 140.1 | 1.249 | 8.70 | 139.4 | 1.028 | 2.872 | 161.6 | 21.40 | 5315 |
| N22-R1 | 119.6 | 6.566 | 14.81 | 121.3 | 4.723 | 3.636 | 118.8 | 16.33 | 4425 |
| N22-R2 | 120.9 | 4.554 | 22.42 | 121.2 | 3.421 | 7.60 | 131.9 | 24.14 | 4503 |
| N22-R3 | 120.3 | 3.645 | 18.04 | 120.3 | 2.618 | 10.46 | 121.4 | 25.05 | 4453 |
| SWbarN-R4 | 114.0 | 3.711 | 48.58 | 114.9 | 3.407 | 15.05 | 126.7 | 24.84 | 6631 |
| SWbarN-R5 | 113.7 | 6.681 | 22.27 | 113.3 | 5.026 | 18.26 | 126.6 | 24.52 | 6500 |
| SWbarN-R6 | 111.1 | 7.138 | 23.18 | 110.3 | 4.562 | 14.88 | 113.5 | 22.31 | 6485 |
Appendix B [C ii] 158 m Spectral Decomposition
