Measurement of the 99Tc spectrum with Silicon Drift Detectors
Abstract
The need for reliable calculations of Nuclear Matrix Elements is compelling for the next generation of neutrinoless double-beta decay experiments. This requires nuclear models to be validated against experimental data, such as non-unique forbidden decays, which have been found sensitive to details in nuclear calculations, most importantly to the renormalization of the axial and vector currents. We report here a measurement of the 2nd forbidden 99Tc spectrum performed for the first time with Silicon Drift Detectors, state-of-the-art semiconductor detectors for low-energy spectroscopy. We designed a novel hybrid spectrometer using a LYSO crystal read by a SiPM to precisely calibrate our main detector and to accurately measure the background. We then compared our measured spectrum with one obtained using cryogenic calorimeters, as well as with predictions from the Realistic Shell Model. Starting from Realistic Shell Model calculations performed with Bare decay operators, we carried out a Bayesian analysis to extract the average quenching factors required to reproduce both the measured spectral shape and the experimental half-life, obtaining and . These values quantify the average renormalization of the axial and vector currents, respectively, and were compared with those predicted by RSM calculations employing Effective decay operators, thereby providing a benchmark for assessing the ability of the model to describe the second-forbidden decay of . More broadly, this comparison tests the reliability of the theoretical framework also used to predict nuclear matrix elements.
I Introduction
Neutrinoless double-beta decay () represents one of the most sensitive probes of neutrino nature and, more in general, of the physics beyond the Standard Model [10, 23, 29, 2]. However, the design of experiments searching for this decay depends on reliable nuclear matrix elements for the candidate isotopes. Since these cannot be measured directly, they must be calculated using nuclear-structure models, whose uncertainties affect sensitivity estimates [2]. Experimental observables capable of benchmarking the underlying nuclear models and their treatment of weak-current operators are therefore essential. In this context, the precise characterization of -decay spectra plays a central role [11, 28, 3], with non-unique forbidden decays providing particularly sensitive probes [27, 32, 33, 31, 21]. Indeed, their half-lives and spectral shapes are highly sensitive to nuclear wave functions and to the effective renormalization of weak-current operators. Moreover, unlike allowed Fermi and Gamow–Teller transitions, these decays probe higher multipoles and interference between vector and axial-vector currents. Taken together, these features make forbidden decays stringent tests of the nuclear models employed in calculations.
For these reasons, over the past decade, increasing attention has been devoted to the so-called spectrum-shape method, which exploits high-precision measurements of spectra to extract information on the renormalization of the axial and vector currents,
and benchmark theoretical predictions [26, 33]. Despite significant progress, achieving a consistent description of both spectral shapes and decay half-lives across different isotopes remains a major challenge.
Several experimental studies have therefore investigated -decay spectra across a range of isotopes and degrees of forbiddenness [20, 15, 33, 34, 40, 41, 13]. Different experimental approaches have been developed for these measurements. Among these, cryogenic calorimeters provide excellent energy resolution and allow the radioactive source to be embedded directly within the detector [35], enabling precise measurements of both spectral shapes and half-lives [39]. However, their operation at millikelvin temperatures introduces significant technical complexity and limits flexibility in source selection. Moreover, the analysis of the measured spectra requires a background model, often obtained through Monte Carlo simulations.

Within this broader experimental effort, the second-forbidden non-unique decay of 99Tc represents a particularly interesting case [41, 45]. This interest is also motivated by the proximity of 99Tc to 100Mo, one of the leading candidate isotopes for searches and the target of several experiments, including NEMO-3, AMoRE, CUPID-Mo, and the future ton-scale CUPID experiment [4, 14, 8, 6, 7, 5]. Indeed, in parallel, substantial theoretical effort has been devoted to calculating the nuclear matrix element within different nuclear-structure frameworks [42, 43, 11, 30, 46, 19]. The spectrum therefore provides a valuable experimental benchmark for assessing nuclear models employed in these calculations.
A scheme of the 99Tc decay is shown in Figure 1. The spectrum of 99Tc was measured by the MetroBeta collaboration using state-of-the-art thermal detectors in terms of energy resolution, known as Magnetic Metallic Calorimeters (MMCs) [41]. Analysis of the MMC spectrum yielded an effective value of () of 0.574(36) (0.376(5)).
A further independent measurement of the 99Tc spectrum using MMCs has recently been reported by the gA-EXPERT collaboration, although the corresponding study has not yet been published [45].
We present here a complementary approach based on Silicon Drift Detectors (SDDs), state-of-the-art semiconductor detectors for low-energy spectroscopy. SDDs offer an alternative route, combining good energy resolution with room-temperature operation and higher experimental versatility, allowing the study of a wide range of isotopes, as well as a direct measurement of the background. Silicon Drift Detectors (SDD) have been demonstrated to be good candidates for -spectroscopy in the context of the TRISTAN [44] and ASPECT-BET projects [38]. Nevertheless, such measurements introduce additional challenges related to electron interactions in the source and detector materials, including autoabsorption, backscattering, and incomplete charge collection, all of which can significantly distort the observed spectral shape.
A precise understanding of these effects is therefore essential to relate the measured spectrum to the underlying -decay spectrum and to compare it meaningfully with theoretical predictions. This requires detailed modeling of both the detector response and the experimental geometry, which can be achieved using Monte Carlo simulations optimized for low-energy electromagnetic interactions.
In this work, we report the first measurement of the 99Tc -decay spectrum performed with SDDs. The analysis combines an accurate calibration of the energy scale, a direct measurement of the background, and a detailed GEANT4-based description of the detector response and source-related effects.
The measured spectrum is analyzed through a Bayesian fit based on Realistic Shell-Model (RSM) calculations performed with bare decay operators, treating and as free parameters. The relativistic vector nuclear matrix element is fixed according to the CVC hypothesis [12], as done in Ref. [41]. The best-fit values of and determine the average quenching factors of the axial and vector currents, respectively, required to reproduce both the measured spectral shape and the half-life. These experimentally inferred values are compared with the average renormalization predicted by RSM calculations employing effective decay operators derived microscopically and consistently with the effective Hamiltonian [41].
II Experimental setup
Source preparation - The radioactive source has been prepared by dropping NH4TcO4, containing the isotope of interest 99Tc, on a 0.5 mm thick silicon substrate. The drops have been subsequently frozen by putting the sample in contact with a cold plate at -10 °C, and dried in a vacuum chamber. This technique is known as freeze-drying [17], and it has been employed to ensure the spatial homogeneity of the source and to prevent the formation of large crystals, which would be problematic due to the large autoabsorption. The produced 99Tc source, mounted in the experimental setup, is indicated with a in Figure 2. The source activity is 10 Bq.
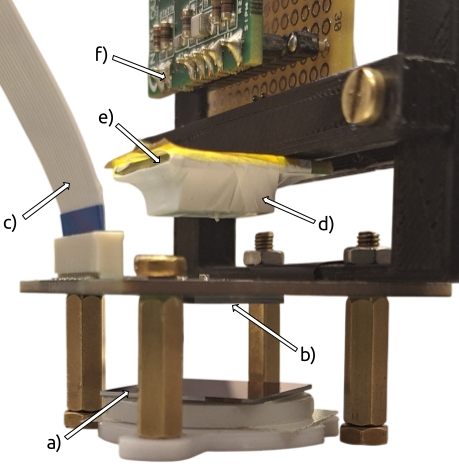
Detectors - This measurement was taken using a detection system specifically developed for beta spectroscopy. The SDD was fabricated by FBK as a square of 8 mm side and thickness of 1 mm. The large thickness is beneficial for a silicon detector for beta spectroscopy as it fully contains electrons up to several hundred keV. The large area is needed to minimise the number of events affected by incorrect energy reconstruction due to beta electrons interacting with the detector border. The shape of the electric field in this region can, indeed, cause charge loss. Furthermore, SDDs have a very thin entrance window of around 10 nm [25], which reduces the energy lost by beta electrons in this layer to an almost negligible level. These characteristics make SDDs suitable for beta spectroscopy at energies of O(100) keV. The SDD used is visible in Figure 2, indicated by b, and facing the 99Tc source. The cable providing the SDD bias and connecting the front-end integrated amplifier CUBE, wire-bonded to the SDD, to the external biasing and conditioning board is also shown, indicated by c.
To make precise measurements of beta spectra, the energy scale of the SDD must be accurately known. Most precise beta spectrum measurements in the literature use radioactive X-ray or gamma-ray sources to calibrate the detector. To avoid biases arising from gain drifts, the calibration sources are typically measured alongside the beta spectrum. This is the case for the MetroBeta and gA-EXPERT measurements. However, to properly analyse the beta spectrum, the contribution of the calibration source must then be subtracted. This procedure is often realised through Monte Carlo simulations, thereby introducing a new systematic effect. To address this issue, we used a LYSO crystal containing the isotope 176Lu as a calibration source. The decay of 176Lu provides several well-defined photon lines that can be used to calibrate the SDD. In particular, the decay can populate excited states of 176Hf, which subsequently de-excite through -ray emission. Additional X-rays can also be produced by atomic relaxation in the daughter atom or in other atoms of the crystal. The photon energies used for the SDD calibration are listed in Table 1.
| Energy (keV) | Origin |
|---|---|
| 55.786 | Hf X-ray |
| 201.83 | 176Hf -ray |
| 306.78 | 176Hf -ray |
The LYSO crystal is well suited for this purpose, as it is a scintillator producing approximately 30000 photons per MeV. In our setup, the crystal was coupled to a silicon photomultiplier (SiPM) using optical grease, and both were wrapped in Teflon to improve light collection. The LYSO crystal, the SiPM and the SiPM in-vacuum electronics can be seen in Figure 2, indicated respectively with d, e, f.
After the beta decay of 176Lu, a scintillation signal produced by the beta electron is always detected by the SiPM. Therefore, it is possible to isolate events from X-rays and gamma rays in the SDD by requiring a coincidence with the SiPM. Conversely, events in the SDD that are not coincident with the SiPM are considered unrelated to the calibration source, and mostly originate from the forbidden beta decay of 99Tc. This technique enables us to obtain a clean spectrum for calibration and a clean 99Tc spectrum for spectral analysis. Since calibration data are acquired together with 99Tc data, any corrections due to gain drifts during the measurement can be computed from the calibration data and applied directly to the spectrum.
Both the SDD and the SiPM were operated in a vacuum chamber at a pressure of mbar, to prevent electrons’ energy loss in air before interacting with the detector, and the SDD was cooled to -10 °C to reduce leakage current, a procedure beneficial for energy resolution and dead time induced by pre-amplifier reset.
III Data taking and processing
The signals from the SDD and the SiPM were digitised at 125 MHz using a CAEN VX2740 digitizer and processed with a trapezoidal filter to extract the pulse amplitude. Additional information, such as the rise time of SDD pulses and a coincidence flag between the two detectors, was also computed.
We performed a six-day measurement, and the resulting spectra are shown in Figure 3.
Panel a shows all the events measured with the SDD. Panel b (c) shows instead the spectrum of events measured with the SDD in anti-coincidence (coincidence) with the SiPM in blue (orange). In b, events from the beta decay of 99Tc are clearly visible up to 300 keV. The Q-value of 99Tc, as measured by the MetroBeta group [41], is indeed 295.82(16) keV. Events above 300 keV are background events. In c, the coincidence spectrum is dominated by photon lines associated with the decay of 176Lu in the LYSO crystal. The peaks at 201 and 306 keV originate from -ray de-excitation of 176Hf, while the structures around 50–60 keV are mainly due to Hf and Lu X-rays. The underlying continuum is mainly due to Compton scattering of high-energy photons. Since the X-ray region contains several overlapping Hf and Lu contributions, only the most isolated Hf line at 55.8 keV was used for calibration, together with the -ray peaks and the zero-energy peak. The peak positions were extracted with Gaussian fits and used to perform a linear energy calibration. The calibration curve and the corresponding residuals are shown in the first two panels of Figure 4. We also tried a quadratic calibration, which produced results compatible with those obtained from the linear fit. We therefore opted for the simpler linear model to describe the SDD energy scale.
The residuals of the linear calibration show a maximum deviation below 250 eV over the calibrated energy range. Therefore, we expect our calibration to be accurate within this range. It should be noted that similar precision can be achieved across the entire energy range of the 99Tc decay thanks to the presence of a peak in the calibration dataset above the 99Tc endpoint.
Instead, the energy resolution as a function of photon energy is shown in the bottom panel of Figure 4. The point corresponding to the zero-energy peak had an uncertainty that was too large, so it was not included in the plot. A square-root fit of the data points confirms the expected behaviour of the energy resolution.
Although the large active area of the SDD reduces edge effects, charge loss still has to be considered for an accurate spectral analysis, since it shifts events toward lower reconstructed energies and modifies the spectral shape. One way to eliminate this systematic effect is to reject events based on their rise time. In a Silicon Drift Detector, the electrons produced after ionising radiation interaction are collected from a central anode thanks to radial drift. The rise time of the signal is proportional to the width of the electron cloud at the anode. This width is larger for events with an interaction point close to the detector border because the width of the cloud increases due to thermal diffusion while drifting towards the anode. Therefore, keeping only events with lower rise times helps to reduce the charge loss systematics. However, this is complicated by the fact that the width of the electron cloud increases with the energy-dependent distance travelled by the ionising electron, which is larger for higher energy particles. Thus, the minimum rise time increases with electron energy. Figure 5 shows the distribution of rise time computed as the distance between the 10% and 90% amplitude points as a function of energy, where this effect can be clearly seen.

We adopted a linear rise-time cut, fixing its slope to correspond to the minimum rise time as a function of energy. We then selected an offset value as the smallest that ensured the cut of edge-like events while maintaining a stable spectral shape. Using a lower offset value would also cut non-edge-like events. The rise time cut line is shown in red dashed lines in Figure 5.
The SDD spectrum in anti-coincidence with the SiPM before and after the rise time cut is shown in Figure 6. An important quantity to estimate after applying the cut is its efficiency. In particular, it is important to determine whether there is any energy dependence, as this would lead to a distortion that must be taken into account in spectral analysis. The cut efficiency was evaluated by computing the ratio of the areas of the X-ray and gamma-ray peaks in the calibration spectrum before and after the rise-time cut. The efficiency of each data point is shown in the bottom panel of Figure 6. We performed a linear fit of these points and found a slope compatible with zero. Therefore, we conclude that no energy-dependent efficiency needs to be considered after the rise time cut. We also found that changing the linear rise-time cut offset slightly produced a spectrum with a compatible shape and flat cut efficiency. In contrast, changing the rise-time cut slope resulted in an energy-dependent cut efficiency. Therefore, we can conclude that our choice of rise-time cut parameters is robust and does not introduce a significant systematic uncertainty into the analysis. A total of approximately 180 thousand events survived the cut and were adopted in the analysis.
As discussed above, background events also play a role in our measured spectrum. To be able to compare the 99Tc spectrum with theoretical predictions, these have to be included in the analysis. Another advantage of our setup is that we can measure the background spectrum directly and include it in the analysis chain. This was achieved by replacing the silicon substrate carrying the Tc deposition with a bare silicon substrate. We then performed another six-day measurement under the same experimental conditions. We used the photon peaks from the LYSO crystal to perform a linear calibration and applied the same rise time cut. This verified that the efficiency was not energy-dependent in this case either. The resulting spectrum, which contains background events only, is shown in Figure 7. It is worth noting that background events can originate from radioactive decay in components close to our setup or from the LYSO crystal in cases where insufficient light is collected on the SiPM to detect a pulse above the threshold. Directly measuring the background in the same configuration as the 99Tc measurement ensures that all of these possibilities are taken into account. The measured background is featureless; therefore, to eliminate statistical fluctuations, we developed an analytical background model consisting of a low-energy error function, a higher-energy exponential and a constant component. The parameters of this model were fitted to the measured background. The best fit is shown in black in Figure 7. In the following, this background model is used when fitting the 99Tc data.
IV Analysis method
In this section, we discuss the method used to analyze the measured beta spectrum. As discussed in Section I, effects such as autoabsorption in the Technetium source, as well as backscattering on the detector, cause a distortion of the spectrum shape, which has to be taken into account by means of Monte Carlo simulations.
We developed a GEANT4 [1] simulation of the whole setup, exploiting the physics package Penelope [9], which is optimized for low-energy electromagnetic interactions. Concerning the SDD, the effect of a dead layer is taken into account as shown in [38], while the energy resolution is added through a convolution with an energy-dependent Gaussian, whose width increases with the square root of the energy. The energy resolution scaling was fixed to the one extracted from calibration data (shown in Figure 4). The Tc source has instead been simulated as a uniform layer on top of a silicon substrate. Electrons were generated in this technetium volume with an isotropic direction. In practice, the deposited Tc could produce small crystals on the silicon surface, with a thickness that may vary from one crystal to another. The Tc thickness that we use in our simulations is therefore an effective thickness parametrizing the source autoabsorption.
Simulations have been run for monochromatic electrons of different energies Ein produced in the source and absorbed by the detector. The distribution of the energy measured by the detector Eout, normalized to one, is hereby indicated with P(EoutEin). This response, including detector effects, simulated for a Tc thickness of 500 nm, is reported in Figure 8 for four different Ein.
It can be seen how the response to monochromatic electrons is non-Gaussian, as expected. An asymmetric peak is present close to Ein, with a Gaussian right side dominated by energy resolution and a left side dominated by energy loss in the source before hitting the detector. A continuous tail can also be seen, due to backscattering at the detector. It goes down to zero, since electrons have the chance to leave the detector without depositing energy in the active volume. It must also be noted that the experimental response is energy-dependent. In particular, by looking at the left side of the peak, the influence of source autoabsorption is more prominent for electrons with lower Ein.
As already stated, the experimental responses have been normalized, but the efficiency , which is the fraction of the generated electrons that actually deposit energy in the SDD, for a given Ein, can also be obtained from simulations. This quantity, computed from the same GEANT4 simulation already mentioned, is shown in Figure 9.
It can be seen that the efficiency for Ein 0 is always non-zero, due to the fact that the Tc source has not been encapsulated between passive materials. However, a low-energy cutoff effect is visible, still due to source autoabsorption. For higher energy, instead, the efficiency asymptotically converges to the geometric efficiency of 9% of our setup. This means that the effect of autoabsorption in the source is mostly important for the low-energy region of a spectrum.
Denoting by T(Ein) a theoretical prediction of the 99Tc spectrum, the spectrum measured by the SDD, M(Eout), can be computed with the following formula:
| (1) |
where is the background model described in the previous section. For binned objects, this formula translates into a matrix multiplication. P(EoutEin) is called the response matrix, and its columns are given by response functions such as those shown in Figure 8. The response matrix depends on one free parameter that is not constrained by any calibration measurement in our setup, namely the Tc thickness. Figure 10 shows the predicted measured spectrum M(Eout) for three different Tc thicknesses.
As expected, the largest effect due to changing the Tc thickness can be seen at low energies. A thicker (thinner) Tc layer produces a cutoff at higher (lower) energies. The right panel shows instead a zoom of the endpoint region, in logarithmic scale, where a small shift of the measured endpoint can be seen as well.
In order to fit the measured spectrum, we performed a scan over the Tc thickness of the following :
| (2) |
where D(Eout) is the array containing the experimental spectrum and (Eout) is the related Poissonian uncertainty. The fit has been performed in the energy range between 5 and 350 keV. The spectrum prediction is normalized to the data in this energy range; therefore, only the information on the shape of the spectrum is used in the fit.
V Results and discussion
Comparison with other data - Before comparing with nuclear-model predictions, we first assess whether our measured spectrum is compatible with previous 99Tc measurements. In particular, we performed a fit using the MetroBeta spectrum [41] as the input T(Ein) to our response model. The minimization yielded a best-fit value of 180 nm for the Tc thickness. The resulting best-fit spectrum is shown in red in Figure 11, together with the SDD data in blue. The input spectrum, measured with MMCs, is shown in black, while the background model is shown with a shaded blue area. The bottom panel reports instead the fit residuals.
It can be seen how our spectrum looks very different with respect to the MetroBeta one, measured with MMCs. The difference is due to the systematic effects related to having the 99Tc source not embedded in the detector active volume, mainly electron backscattering. However, it can be noted how, after folding the MetroBeta spectrum with our simulated experimental response and adding our measured background, the agreement improves significantly. In particular, both the low-energy region of the spectrum and the background-dominated region are very well reproduced. The p-value of the fit, however, indicates a statistically poor reproduction of the spectrum. It must be noted that the MetroBeta spectrum used as an input is not directly measured; detector effects have been unfolded, and background has been subtracted, making some assumptions on its shape. It is therefore possible that some systematic effect, in their model or in our model, is not accurately taken into account, although we performed our simulation to the best of our knowledge of the experimental setup.
Comparison with nuclear models - We compared our measured spectrum with different nuclear-model predictions. We considered the spectrum calculated with BetaShape [37] and those obtained within the Realistic Shell Model (RSM) [22], in which the Hamiltonian and effective decay operators were derived microscopically from the CD-Bonn nucleon–nucleon potential [36] using the procedure [16]. In particular, we considered two RSM spectra, one obtained with unrenormalized decay operators (Bare), and one using decay operators derived consistently with the effective Hamiltonian (Effective), the relativistic nuclear matrix element is fixed according to the CVC hypothesis [12]. It is worth mentioning that the same effective Hamiltonian was previously employed in the RSM study of the double- decay of [19]. At this stage, the fit was based only on the measured spectral shape, without imposing a constraint from the experimental half-life. For each input spectrum, we varied the Tc thickness and folded the theoretical prediction with the corresponding detector-response model. The resulting reduced profiles are shown in Figure 12.
None of the nuclear-model predictions reproduces the measured spectrum as well as the MetroBeta input. Nevertheless, both RSM calculations provide a better description of the spectral shape than BetaShape, supporting the microscopic approach adopted in the RSM. Interestingly, when only the spectral shape is considered, the Bare calculation performs better than the Effective one. Conversely, the Effective calculation provides a more accurate prediction of the experimental half-life [22]. This suggests that the spectral shape and half-life provide complementary constraints and motivates their simultaneous inclusion in the following analysis.
Fit with free nuclear model parameters - On the above basis, following the approach adopted in the MetroBeta analysis [41], we performed a combined fit of the spectral shape and half-life starting from the RSM calculation with Bare decay operators and treating and as free parameters. Their fitted values are reported relative to the reference couplings and through the factors and . A single value is used for all contributions associated with each current, so that and can be interpreted as effective average quenching factors for the axial and vector currents, respectively. For each pair , the RSM predicts both the spectral shape and the half-life, which are simultaneously compared with the measured spectrum and the experimental half-life, y [18].
To ensure the robustness of our analysis, we have left the thickness of the Tc and the background amplitude free in the fit, parametrising the imperfect knowledge of the main systematics in our experimental setup. Finally, the Q-value of the decay has also been included as a free parameter, as it contributes to determining both the spectral shape and the half-life. Therefore, this analysis can also be used to determine the Q-value from our data, which cannot be done directly from the measured spectrum. If effects such as source autoabsorption are not taken into account, they can cause a bias in the recovery of the Q-value (as shown in Figure 10). Due to the complexity of this model, to ensure the convergence of the fit and a robust recovery of the parameters, we performed a Bayesian sampling of the log-likelihood function, defined as
| (3) |
where indicates the parameter array, . The first term of the likelihood is a statistic computed over the spectrum bins, as in the previous section. Therefore, it represents the penalty for not reproducing the spectral shape accurately. The second term instead represents a Gaussian penalty for not reproducing the half-life accurately. Note that, referring back to equation 1, the parameters are used in the calculation of T(Ein). For a given set of these parameters, both the theoretical spectral shape and the half-life are computed. enters into the computation of the response matrix, while is simply a scaling factor of the background model that already appears in that equation. We chose to use flat, uninformative priors on all the parameters so that sampling the Bayesian posterior essentially coincides with sampling the likelihood in equation 3.
The half-life component of the likelihood can be considered a multidimensional prior in the five-dimensional parameter space being sampled, favouring only combinations of parameters that reproduce the experimental half-life. The posterior sampling was performed using the Python package emcee [24]. The resulting posteriors, obtained from the Bare RSM calculations, are shown in the corner plot in Figure 13. The best-fit parameters were then extracted by computing the posterior maximum. Table 2 summarises the best-fit parameters, together with the values obtained by MetroBeta and those computed using the effective RSM.
| Parameter | Best-fit | RSM (Effective) | MetroBeta [41] |
|---|---|---|---|
| 0.40 0.01 | 0.81 | 0.452 0.028 | |
| 0.47 0.01 | 0.58 | 0.376 0.005 | |
| t (nm) | 128 11 | ||
| B | 0.97 0.04 | ||
| Q-value (keV) | 291.6 0.7 | 295.82 0.16 |
The fit yields and , indicating a quenching of both the axial and vector currents. MetroBeta obtained and . The two determinations of agree within approximately two standard deviations, whereas those of are not statistically compatible. However, a direct agreement is not necessarily expected because the two analyses rely on different effective Hamiltonians and, consequently, different nuclear wave functions.
We then compared the experimentally inferred quenching factors with the average renormalization predicted by the RSM calculation employing microscopically-derived effective decay operators. This renormalization was quantified by taking the ratios of the eight NMEs calculated with the Effective and Bare operators: four associated with axial operators and four with vector operators [22]. The corresponding mean ratios give and . These values are reported in Table 2 and indicated by the orange lines in Figure 13, while the green lines represent the no-quenching hypothesis. For both currents, the microscopic renormalization shifts the RSM predictions towards the region favored by the fit. The effective value of lies relatively close to the fitted posterior, whereas the renormalization of the axial current moves in the same direction but remains weaker than the quenching required by the data. Thus, the effective RSM operators reproduce the overall trend inferred from the experiment, although they do not fully account for the magnitude of the extracted quenching.
Examining the other fit parameters reveals that the experimental ones are well constrained. This suggests that an imperfect understanding of the response of the setup does not prevent the precise estimation of nuclear model parameters. In our specific case, this is possible because the thickness of the Tc is constrained by the low-energy region of the spectrum and the background amplitude from the region above the Q-value. The latter is compatible with 1 within one sigma, meaning that the background amplitude used as an input, which came directly from an experimental measurement, was accurate. This is possible thanks to the flexibility of our setup when performing measurements with and without the radioactive source.
Finally, we estimated a Q-value of 291.6(7) keV. This value is lower than, and incompatible with, that measured by the MetroBeta group (295.82(16) keV). The best-fit result reported in Table 2 only considers statistical uncertainty. We expect the main systematic contribution to come from the energy calibration. However, we estimated a systematic contribution of 0.25 keV to the Q-value determination from the fit result in Figure 4. Even when this systematic uncertainty is taken into account, the discrepancy remains. To evaluate the impact of this discrepancy on the estimation of nuclear parameters, we performed a second fit using a Gaussian prior on the Q-value whose position and width were derived from the MetroBeta measurement. The values of and obtained in this way are 0.42(1) and 0.43(1), respectively. These values are similar to those previously reported and do not change any of our conclusions regarding the renormalisation of the axial and vector currents. The best-fit spectrum computed from the parameters in Table 2 is shown in Figure 14, compared to SDD data.
The computed p-value of approximately 70% now indicates statistical agreement with the experimental data. Although a shape is still visible in the residuals, the quality of the reconstruction is noticeably better than that shown in Figure 11, particularly at low energy and in the Q-value region.
VI Conclusion
The second-forbidden non-unique spectrum of 99Tc was measured for the first time with a Silicon Drift Detector down to 5 keV within the ASPECT-BET project. We developed a hybrid spectrometer combining the SDD with a LYSO scintillator read by a SiPM. Coincidence events allowed us to calibrate the SDD during the 99Tc measurement without subtracting the calibration-source contribution from the spectrum. The background was measured separately under the same experimental conditions, while the rise-time selection was verified to have no significant energy dependence. We also developed a detailed GEANT4 simulation of the experimental response, including source self-absorption, electron backscattering, detection efficiency, and energy resolution. After including the simulated response of our setup, the MetroBeta spectrum [41] showed decent agreement with the SDD data, indicating that the differences between the directly measured spectra are mainly due to experimental effects. The measured spectrum was also compared with the spectral shapes predicted by BetaShape and the RSM using Bare and Effective operators. Both RSM calculations reproduced the measured shape better than BetaShape, with the Bare calculation performing better than the Effective one when only the spectral shape was considered. Finally, starting from the Bare RSM operators, we performed a Bayesian fit combining the measured spectrum with the experimental 99Tc half-life. The fit yielded average quenching factors of and . The renormalization predicted by the Effective RSM moves both currents towards the values preferred by the fit, although it does not fully reproduce the extracted quenching. The fit also yielded a Q-value of keV, which is incompatible with the MetroBeta result. However, repeating the analysis using the MetroBeta Q-value as a Gaussian prior gave similar quenching factors, showing that this discrepancy does not affect our conclusions. Overall, this work demonstrates a flexible experimental method for forbidden spectroscopy based on semiconductor detectors, coincidence calibration, direct background measurement, and detailed response simulations. The ASPECT-BET collaboration also plans to measure other forbidden spectra, including those of 36Cl and 94Nb, to provide further experimental data for testing nuclear models and the renormalization of decay operators.
VII Acknowledgements
We acknowledge financial support under the National Recovery and Resilience Plan (NRRP), Mission 4, Component 2, Investment 1.1, Call for tender No. 104 published on 2.2.2022 by the Italian Ministry of University and Research (MUR), funded by the European Union – NextGenerationEU– Project Title ASPECT-BET: An sdd-SPECTrometer for BETa decay studies – CUP H53D23001020006 - Grant Assignment Decree No. 974 adopted on June 30, 2023 by the Italian Ministry of University and Research (MUR).
References
- [1] (2003) GEANT4 - a simulation toolkit. Nuclear Instruments and Methods in Physics Research, Section A: Accelerators, Spectrometers, Detectors and Associated Equipment 506, pp. 250–303. External Links: Document, ISSN 01689002 Cited by: §IV.
- [2] (2023) Toward the discovery of matter creation with neutrinoless decay. Rev. Mod. Phys. 95, pp. 025002. External Links: Document, Link Cited by: §I.
- [3] (2025) Study of the beta spectrum shape of and decays for the prediction of reactor antineutrino spectra. Phys. Rev. Lett. 135, pp. 142502. External Links: Document, Link Cited by: §I.
- [4] (2019) First results from the AMoRE-pilot neutrinoless double beta decay experiment. European Physical Journal C 79, pp. 791. External Links: Document Cited by: §I.
- [5] (2025) CUPID, the Cuore upgrade with particle identification. Eur. Phys. J. C 85 (7), pp. 737. Note: [Erratum: Eur.Phys.J.C 85, 1346 (2025)] External Links: 2503.02894, Document Cited by: §I.
- [6] (2020) Precise measurement of decay of mo with the CUPID-Mo detection technology. European Physical Journal C 80, pp. 674. External Links: Document, 1912.07272 Cited by: §I.
- [7] (2021) New limit for neutrinoless double-beta decay of mo from the CUPID-Mo experiment. Physical Review Letters 126, pp. 181802. External Links: Document, 2011.13243 Cited by: §I.
- [8] (2007) Measurement of double beta decay of mo to excited states in the NEMO 3 experiment. Nuclear Physics A 781 (1–2), pp. 209–226. External Links: Document Cited by: §I.
- [9] (2021) The penelope physics models and transport mechanics. implementation into GEANT4. Frontiers in Physics 9. External Links: Document, ISSN 2296424X Cited by: §IV.
- [10] (2008) Double beta decay, majorana neutrinos, and neutrino mass. Reviews of Modern Physics 80, pp. 481–516. External Links: Document Cited by: §I.
- [11] (2013) Nuclear matrix elements for double- decay. Physical Review C 87, pp. 014315. External Links: Document Cited by: §I, §I.
- [12] (1971) Nuclear Physics A 162, pp. 111–144. External Links: Document Cited by: §I, §V.
- [13] (2026) Electron spectral shape of the third-forbidden -decay of rb measured using a crystal scintillator. European Physical Journal A 62, pp. 16. External Links: Document Cited by: §I.
- [14] (2012) AMoRE experiment: a search for neutrinoless double beta decay of mo isotope with camoo cryogenic scintillation detector. Journal of Physics: Conference Series 375, pp. 042023. External Links: Document Cited by: §I.
- [15] (2020) Quenching of deduced from the beta-spectrum shape of cd measured with the cobra experiment. Physics Letters B 800, pp. 135092. External Links: Document Cited by: §I.
- [16] (2002) Low momentum nucleon-nucleon potential and shell model effective interactions. Physical Review C 65, pp. 051301(R). External Links: Document Cited by: §V.
- [17] (2008) Comparative study of two drying techniques used in radioactive source preparation: freeze-drying and evaporation using hot dry nitrogen jets. Applied Radiation and Isotopes 66 (6), pp. 685–690. Note: Proceedings of the 16th International Conference on Radionuclide Metrology and its Applications External Links: ISSN 0969-8043, Document, Link Cited by: §II.
- [18] (2017) Nuclear data sheets for a=99. Nuclear Data Sheets 145, pp. 25–340. External Links: ISSN 0090-3752, Document, Link Cited by: §V.
- [19] (2022) Shell-model calculation of double- decay. Physical Review C 105, pp. 034312. External Links: Document Cited by: §I, §V.
- [20] (2009) An investigation into the cd beta decay spectrum using a CdZnTe array. Nuclear Physics A 818, pp. 264–278. External Links: Document Cited by: §I.
- [21] (2024) Forbidden beta decays within the realistic shell model. Physical Review C 110, pp. 014324. External Links: Document Cited by: §I.
- [22] (2024) Forbidden decays within the realistic shell model. Phys. Rev. C 110, pp. 014324. External Links: Document, Link Cited by: §V, §V, §V.
- [23] (2016) Neutrinoless double beta decay: 2015 review. Advances in High Energy Physics 2016, pp. 2162659. External Links: Document Cited by: §I.
- [24] (2013) Emcee: the MCMC hammer. Publications of the Astronomical Society of the Pacific 125 (925), pp. 306–312. External Links: ISSN 1538-3873, Link, Document Cited by: §V.
- [25] (2020) Characterisation of a silicon drift detector for high-resolution electron spectroscopy. Nuclear Instruments and Methods in Physics Research Section A: Accelerators, Spectrometers, Detectors and Associated Equipment 979, pp. 164474. External Links: ISSN 0168-9002, Document, Link Cited by: §II.
- [26] (2017) Spectrum-shape method and the next-to-leading-order terms of the -decay shape factor. Phys. Rev. C 95, pp. 024327. External Links: Document, Link Cited by: §I.
- [27] (2016) Forbidden nonunique beta decays and effective values of weak coupling constants. Physical Review C 93, pp. 034308. External Links: Document Cited by: §I.
- [28] (2014) Systematic uncertainties in the analysis of the reactor neutrino anomaly. Phys. Rev. Lett. 112, pp. 202501. External Links: Document, Link Cited by: §I.
- [29] (2016) Current status of neutrinoless double-beta decay searches. Reviews in Physics 1, pp. 29–35. External Links: Document Cited by: §I.
- [30] (2015) Nuclear matrix elements for decays with light or heavy Majorana-neutrino exchange. Physical Review C 91, pp. 024613. External Links: Document Cited by: §I.
- [31] (2023) Physical Review C 107, pp. 055502. External Links: Document Cited by: §I.
- [32] (2017) Electron spectra in forbidden decays and the quenching of the weak axial-vector coupling constant . Phys. Rev. C 95, pp. 044313. External Links: Document, Link Cited by: §I.
- [33] (2021) Confirmation of quenching using the revised spectrum-shape method for the analysis of the cd -decay as measured with the COBRA demonstrator. Physics Letters B 822, pp. 136652. External Links: Document Cited by: §I, §I.
- [34] (2022) Determining with high-resolution spectral measurements using a bolometer. Phys. Rev. Lett. 129, pp. 232502. External Links: Document, Link Cited by: §I.
- [35] (2019) Beta spectrometry with metallic magnetic calorimeters in the framework of the european EMPIR project metrobeta. Applied Radiation and Isotopes 153. External Links: Document, ISSN 18729800 Cited by: §I.
- [36] (2001) High-precision, charge-dependent Bonn nucleon-nucleon potential. Physical Review C 63, pp. 024001. External Links: Document Cited by: §V.
- [37] (2015) Reliability of usual assumptions in the calculation of and spectra. Physical Review C - Nuclear Physics 91. External Links: Document, ISSN 1089490X Cited by: §V.
- [38] (2024) Silicon Drift Detectors for the Measurement and Reconstruction of Beta Spectra. Sensors 24 (24), pp. 8202. External Links: 2405.07797, Document Cited by: §I, §IV.
- [39] (2024) Simultaneous measurement of the half-life and spectral shape of decay with an indium iodide cryogenic calorimeter. Phys. Rev. Lett. 133, pp. 122501. External Links: Document, Link Cited by: §I.
- [40] (2023) Array of cryogenic calorimeters to evaluate the spectral shape of forbidden -decays: the ACCESS project. European Physical Journal Plus 138. External Links: Document, ISSN 21905444 Cited by: §I.
- [41] (2024) High precision measurement of the tc beta spectrum. Physical Review C 110, pp. 055503. External Links: Document, 2309.14014 Cited by: §I, §I, §I, §I, §III, Figure 11, Table 2, §V, §V, §VI.
- [42] (2003) Uncertainty in the decay nuclear matrix elements. Physical Review C 68, pp. 044302. External Links: Document Cited by: §I.
- [43] (2010) Energy density functional study of nuclear matrix elements for neutrinoless decay. Physical Review Letters 105, pp. 252503. External Links: Document Cited by: §I.
- [44] (2024) Development of a silicon drift detector array to search for kev-scale sterile neutrinos with the katrin experiment. Journal of Physics G: Nuclear and Particle Physics 51 (8), pp. 085202. External Links: Document, Link Cited by: §I.
- [45] (2025) The measurement of the Tc -decay spectrum and its implications for the effective value of weak axial coupling. External Links: 2506.17544, Link Cited by: §I, §I.
- [46] (2021) Nuclear matrix elements of neutrinoless double- decay in the triaxial projected shell model. Physical Review C 104, pp. 014320. External Links: Document Cited by: §I.