Phosphorus abundances and multi-element co-enrichment in nearby FGK stars
Abstract
Context. The distribution of bio-essential elements is key to assessing the chemical ‘fertility’ for life in a galactic context. Among these, phosphorus plays a central role in biomolecules, but it is relatively scarce and difficult to measure in stellar spectra.
Aims. We aim to characterise phosphorus abundances in nearby FGK stars and quantify how P co-varies with other bio-related elements in different Galactic disk populations.
Methods. We analysed phosphorus abundances for 233 FGK stars in the solar neighbourhood from the Hypatia Catalog. We studied [P/Fe] as a function of [Fe/H] and other elemental abundances, separating thin- and thick-disk stars. We used non-parametric tests and bootstrap resampling to derive median trends, confidence intervals, correlation coefficients, and residual correlations at fixed [Fe/H]. We also investigated molar ratios involving P relevant to planetary mineralogy.
Results. We find a [P/Fe]–[Fe/H] trend broadly similar to that of elements, supporting a dominant origin in core-collapse supernovae, with some deviations that suggest additional nucleosynthetic channels. Phosphorus shows strong positive correlations with several CHNOPS, , and Fe-peak elements, especially in the thin disk, where stars with higher phosphorus abundances are enriched in multiple bio-essential and rock-forming species. These co-enrichment patterns remain significant in residual analyses at fixed [Fe/H], indicating that they are not a trivial by-product of global metallicity. Thin-disk stars also exhibit higher abundances than thick-disk stars for many elements. The molar P/Mg and P/Si ratios of the Sun are representative of the local stellar population, whereas the relatively elevated solar P/O may have favoured phosphorus bioavailability on Earth.
Conclusions. Our study provides a systematic and statistically robust view of how P co-varies with other CHNOPS and elements in the solar neighbourhood. The results reveal a genuine multi-element co-enrichment pattern beyond metallicity effects and support the use of phosphorus as a tracer of the chemical fertility of galactic environments.
Key Words.
Astrobiology – Solar neighbourhood – Stellar abundances1 Introduction
A subset of elements is essential to terrestrial biochemistry; their nucleosynthetic origin and Galactic distribution constrain the chemical inventory available to planet formation and, ultimately, habitability. Consequently, the search for life elsewhere in the Galaxy is closely related to understanding the diffusion and distribution of these elements.
These elements are C, H, N, O, P, and S (collectively known as CHNOPS), a few alkali and alkaline-earth metals (Na, K, Ca, and Mg), and some transition metals (i.e. V, Mn, Fe, Co, Ni, Cu, and Mo) (Cockell et al., 2016; Giovannelli, 2023; Tonietti et al., 2024; Covone and Giovannelli, 2025, e.g.). They make up the fundamental chemical framework of all known life. Moreover, CHNOPS also play a fundamental role in the abiotic dynamics of modern Earth, influencing processes from the top of the atmosphere to the core of our planet (Krijt et al., 2022). Among them, phosphorus (hereafter P) is undoubtedly the most enigmatic.
Unlike the other major bio-elements, P is virtually absent from Earth’s atmosphere and its main reservoir is rocks (Walton et al., 2023). Its biogeochemical cycle is dominated by acid-base reactions rather than by redox chemistry, although redox reactions are not entirely absent (Pasek et al., 2014). Phosphorus may also be strongly partitioned into planetary cores (Stewart and Schmidt, 2007), so an underabundance of P relative to the solar value may reduce the amount of surface-accessible phosphorus on exoplanets. Because living cells cannot fix it from the atmosphere, P likely constitutes a limiting nutrient for life on Earth (Tyrrell, 1999). In addition to its geochemical scarcity, P is also cosmically rare, being the least abundant among the CHNOPS elements in both the interstellar medium (ISM) and the Solar System (Aschenbrenner et al., 2025).
Complementary constraints on the Galactic phosphorus budget come from the ISM and Solar-System reservoirs. Although P remains observationally elusive in the ISM and is often strongly depleted onto dust, it can become detectable in the gas phase under energetic processing (Fontani, 2024). While ISM phosphorus chemistry is beyond the scope of this work, this broader context helps connect stellar abundances to the forms in which phosphorus becomes available in star- and planet-forming material. Solar-System evidence, including phosphorus detected in comets (Altwegg et al., 2016; Rivilla et al., 2020, e.g.) and reduced P phases in meteorites (Pasek, 2008), further supports the astrobiological relevance of this connection.
Despite its scarcity, P plays essential roles in cell functioning: it contributes to the build-up of nucleic acids (DNA and RNA) (Schlesinger and Bernhardt, 2013), confers stability to cell membranes, plays a role in cell signalling processes, and is involved in cellular energy storage through adenosine triphosphate (ATP) (Butusov et al., 2013). Another enigmatic aspect of phosphorus is its detection. This element is notably challenging to detect in stellar spectra because its spectral lines are inherently weak and accessible only in the near-infrared or ultraviolet, regions covered by a limited number of high-resolution spectrographs (Masseron et al., 2020). For this reason, only a few works have successfully measured and analysed phosphorus in stars, as reviewed below. Here we propose an analysis based on the measured abundance of P in FGK stars in our Galactic neighbourhood.
Currently, it is not possible to directly measure the bulk mineralogy composition of exoplanets’ surfaces, as opposed to what can be achieved in the Solar System via remote sensing (He et al., 2021). The composition of a star itself can be used as proxy to approximate the elemental composition of a planet. Even if stars in their interiors have enough heat and pressure to support atomic fusion and complexify their composition, the outermost layer of the star, the photosphere, is largely reflective of the cloud in which it has formed (Lodders, 2019).
Planets, asteroids, moons, and other star-orbiting objects are made up of the same materials present in this cloud. Consequently, because they originate from the same place and the same material available, the abundance of the host star might be used as a proxy for the composition of the planets (Hinkel and Young, 2024, see e.g.). Bond et al. (2010a) analysed the one-to-one relationship between star’s elements abundances and planetary chemistry from a theoretical perspective. Their simulations suggested that the difference in the composition of small planets was likely the result of the differences in abundance of their host stars and not of disk processing during formation. Of course, the connection between stellar and planetary composition should be interpreted with caution, since the final abundance of several relevant elements can be strongly modified by volatility, planetary differentiation, and the distance from the host star at which the planet forms (e.g. inside or beyond the ice line). In particular, N and O are typically treated as highly volatile, whereas P and S are more commonly regarded as moderately volatile (Lodders, 2003; Palme and Jones, 2003; Suer et al., 2023). Stellar abundance ratios therefore provide a useful starting point for modelling planetary composition and mineralogy (Bond et al., 2010b; Hinkel and Unterborn, 2018), but cannot be translated directly into final surface abundances or bioavailability.
Despite the observational difficulties associated with phosphorus, several recent studies have investigated its stellar abundance. Maas et al. (2019) identified a trend in [P/Fe] consistent with -element behaviour and proposed a time-evolution model. Similarly, Hinkel et al. (2020), using a sample of 100 stars from the Hypatia Catalog, confirmed a weak negative correlation between [P/Fe] and [Fe/H], and noted that Earth and Mars appear P-rich and N-poor relative to nearby stars.
Masseron et al. (2020), analysing data from the APOGEE survey, identified 15 P-rich stars (with [P/Fe] 1.0 dex) likely belonging to the thick disk or inner halo. These stars also showed enhancements in other elements, including O, Si, Mg, Al, and Ce.
A larger sample of 163 stars was studied by Maas et al. (2022), who reaffirmed the co-evolution of phosphorus with elements. Brauner et al. (2023) further investigated P-rich giants and confirmed their association with Si- and Al-rich chemical patterns, suggesting these stars form part of a broader stellar population enriched in multiple elements.
Despite the biological relevance of phosphorus, its stellar abundances remain poorly explored compared to other bio-essential elements. This work aims to help fill this gap by providing a systematic analysis of phosphorus in FGK stars of the solar neighbourhood, making P a useful tracer of chemically rich environments in the solar neighbourhood and providing quantitative constraints on its co-enrichment with other bio-essential elements relevant for planetary composition.
This paper is structured as follows. In Section 2, we describe the sample selection and the construction of the control group. Section 3 presents the elemental abundance analysis and discusses the correlations between phosphorus and other key elements. Finally, in Section 4, we summarise our main results and outline their implications.
Overall, our study provides a systematic and statistically robust analysis of phosphorus abundances in FGK stars from the Hypatia Catalog that simultaneously links P to CHNOPS co-enrichment, galactic disk populations, and molar ratios relevant to P-bearing minerals composition. Previous works have mostly focused either on the global [P/Fe]–[Fe/H] trend or on small samples of P measurements, without quantifying in a unified way how P co-varies with other bio-essential and elements, how these patterns differ between the thin and thick disks, and how they map into molar ratios that control planetary mineralogy and the accessibility of P. Here we fill this gap by combining robust statistical tests with a multi-element abundance analysis, showing that P participates in a genuine CHNOPS and co-enrichment pattern and establishing P as a tracer of the chemical fertility of galactic environments.
2 Sample selection
2.1 P sample
We used the Hypatia Catalog Database11 1 https://hypatiacatalog.com/ (Hinkel et al., 2014) because of its comprehensive coverage of stellar elemental abundances in the solar neighbourhood, including rare but biologically relevant elements such as phosphorus. Data are renormalised and standardised to allow for a consistent comparison between different literature sources. In Hypatia, abundances are renormalised to the solar abundance scale of Lodders et al. (2009), which we adopt throughout this work. The catalogue also provides both chemical and kinematic information, making it especially suitable for this study. It is an amalgamated database including the abundances of 11,000 stars within 500 pc and all exoplanet host stars regardless of distance. A detailed description is given in Hinkel and Burger (2017), and the most recent update in Hinkel and Young (2024).
For our analysis, we selected all stars with phosphorus measurements in Hypatia. By construction, these stars have at least both [P/H] and [Fe/H] measurements (Hinkel et al., 2014). The initial sample contains 283 stars. To maximise accuracy, we then required uncertainties in both [P/H] and [Fe/H] below 0.15 dex, leaving 233 stars. We chose this threshold because it corresponds to the upper quartile of the [Fe/H] and [P/H] uncertainty distributions, excluding only the most uncertain measurements while preserving a sufficiently large sample.
This sample reflects both the characteristics of the Hypatia Catalog and our focus on the solar neighbourhood. Because P measurements require high-quality spectroscopy, the sample is naturally biased towards well-studied, nearby, bright, and metal-rich stars. This is not a limitation for the aims of this work, which specifically target reliable phosphorus measurements in the local Galactic environment. The sample is therefore not complete for the whole Milky Way, but remains appropriate for investigating relative abundance trends among well-characterised nearby stars.
The stars span effective temperatures from 4055 to 6870 K and distances from 11 to 463 pc. Spectrally, the sample includes 54 F-type, 143 G-type, and 33 K-type stars, while 3 stars have no spectral classification. The [Fe/H] range is from -1.76 to 0.37 dex, and [P/H] ranges from -1.87 to 0.47 dex. The stars belong to both the thin and thick disk, according to the kinematic classification of Hinkel et al. (2014): 171 are thin-disk stars, 44 thick-disk stars, and 18 remain unclassified. HD 160617 and HD 211998 are classified as thick-disk objects in Hypatia, but are identified as halo stars in the literature. In the main analysis and figures they are retained under the original Hypatia population labels, while the impact of excluding them from the thick-disk fits is discussed separately in Appendix A. Distinguishing between thin- and thick-disk stars is important because their different chemical enrichment histories can affect the distribution of bioessential elements and the likelihood of planet formation. Additionally, 14 stars are exoplanet hosts, all in the thin disk; some host multiple planets, bringing the total number of exoplanets in our sample to 20.
2.2 Control sample
To assess whether phosphorus-rich stars differ chemically from stars with similar physical properties, we constructed a control sample from the Hypatia Catalog using a k-nearest neighbours (kNN) algorithm (Szekér and Vathy-Fogarassy, 2020). Our goal was to match each P star with stars that do not have phosphorus measurements but share similar stellar properties.
We selected four parameters: [Fe/H], as a tracer of overall chemical enrichment and to avoid confounding phosphorus trends with general metallicity effects; effective temperature, because of its relation to spectral type and its effect on line strength; surface gravity, because of its influence on atmospheric pressure and line formation; and distance from the Sun, to match the local observational footprint. These features were standardised to avoid scale effects in the distance calculation. For each P star, we then identified the k-nearest neighbours among stars without phosphorus measurements. The optimal value of k was chosen with an elbow-like criterion, selecting the point beyond which larger k did not significantly reduce the mean matching distance. This yielded an optimal choice of k = 20. After removing duplicates, the final control sample contains 2,570 stars.
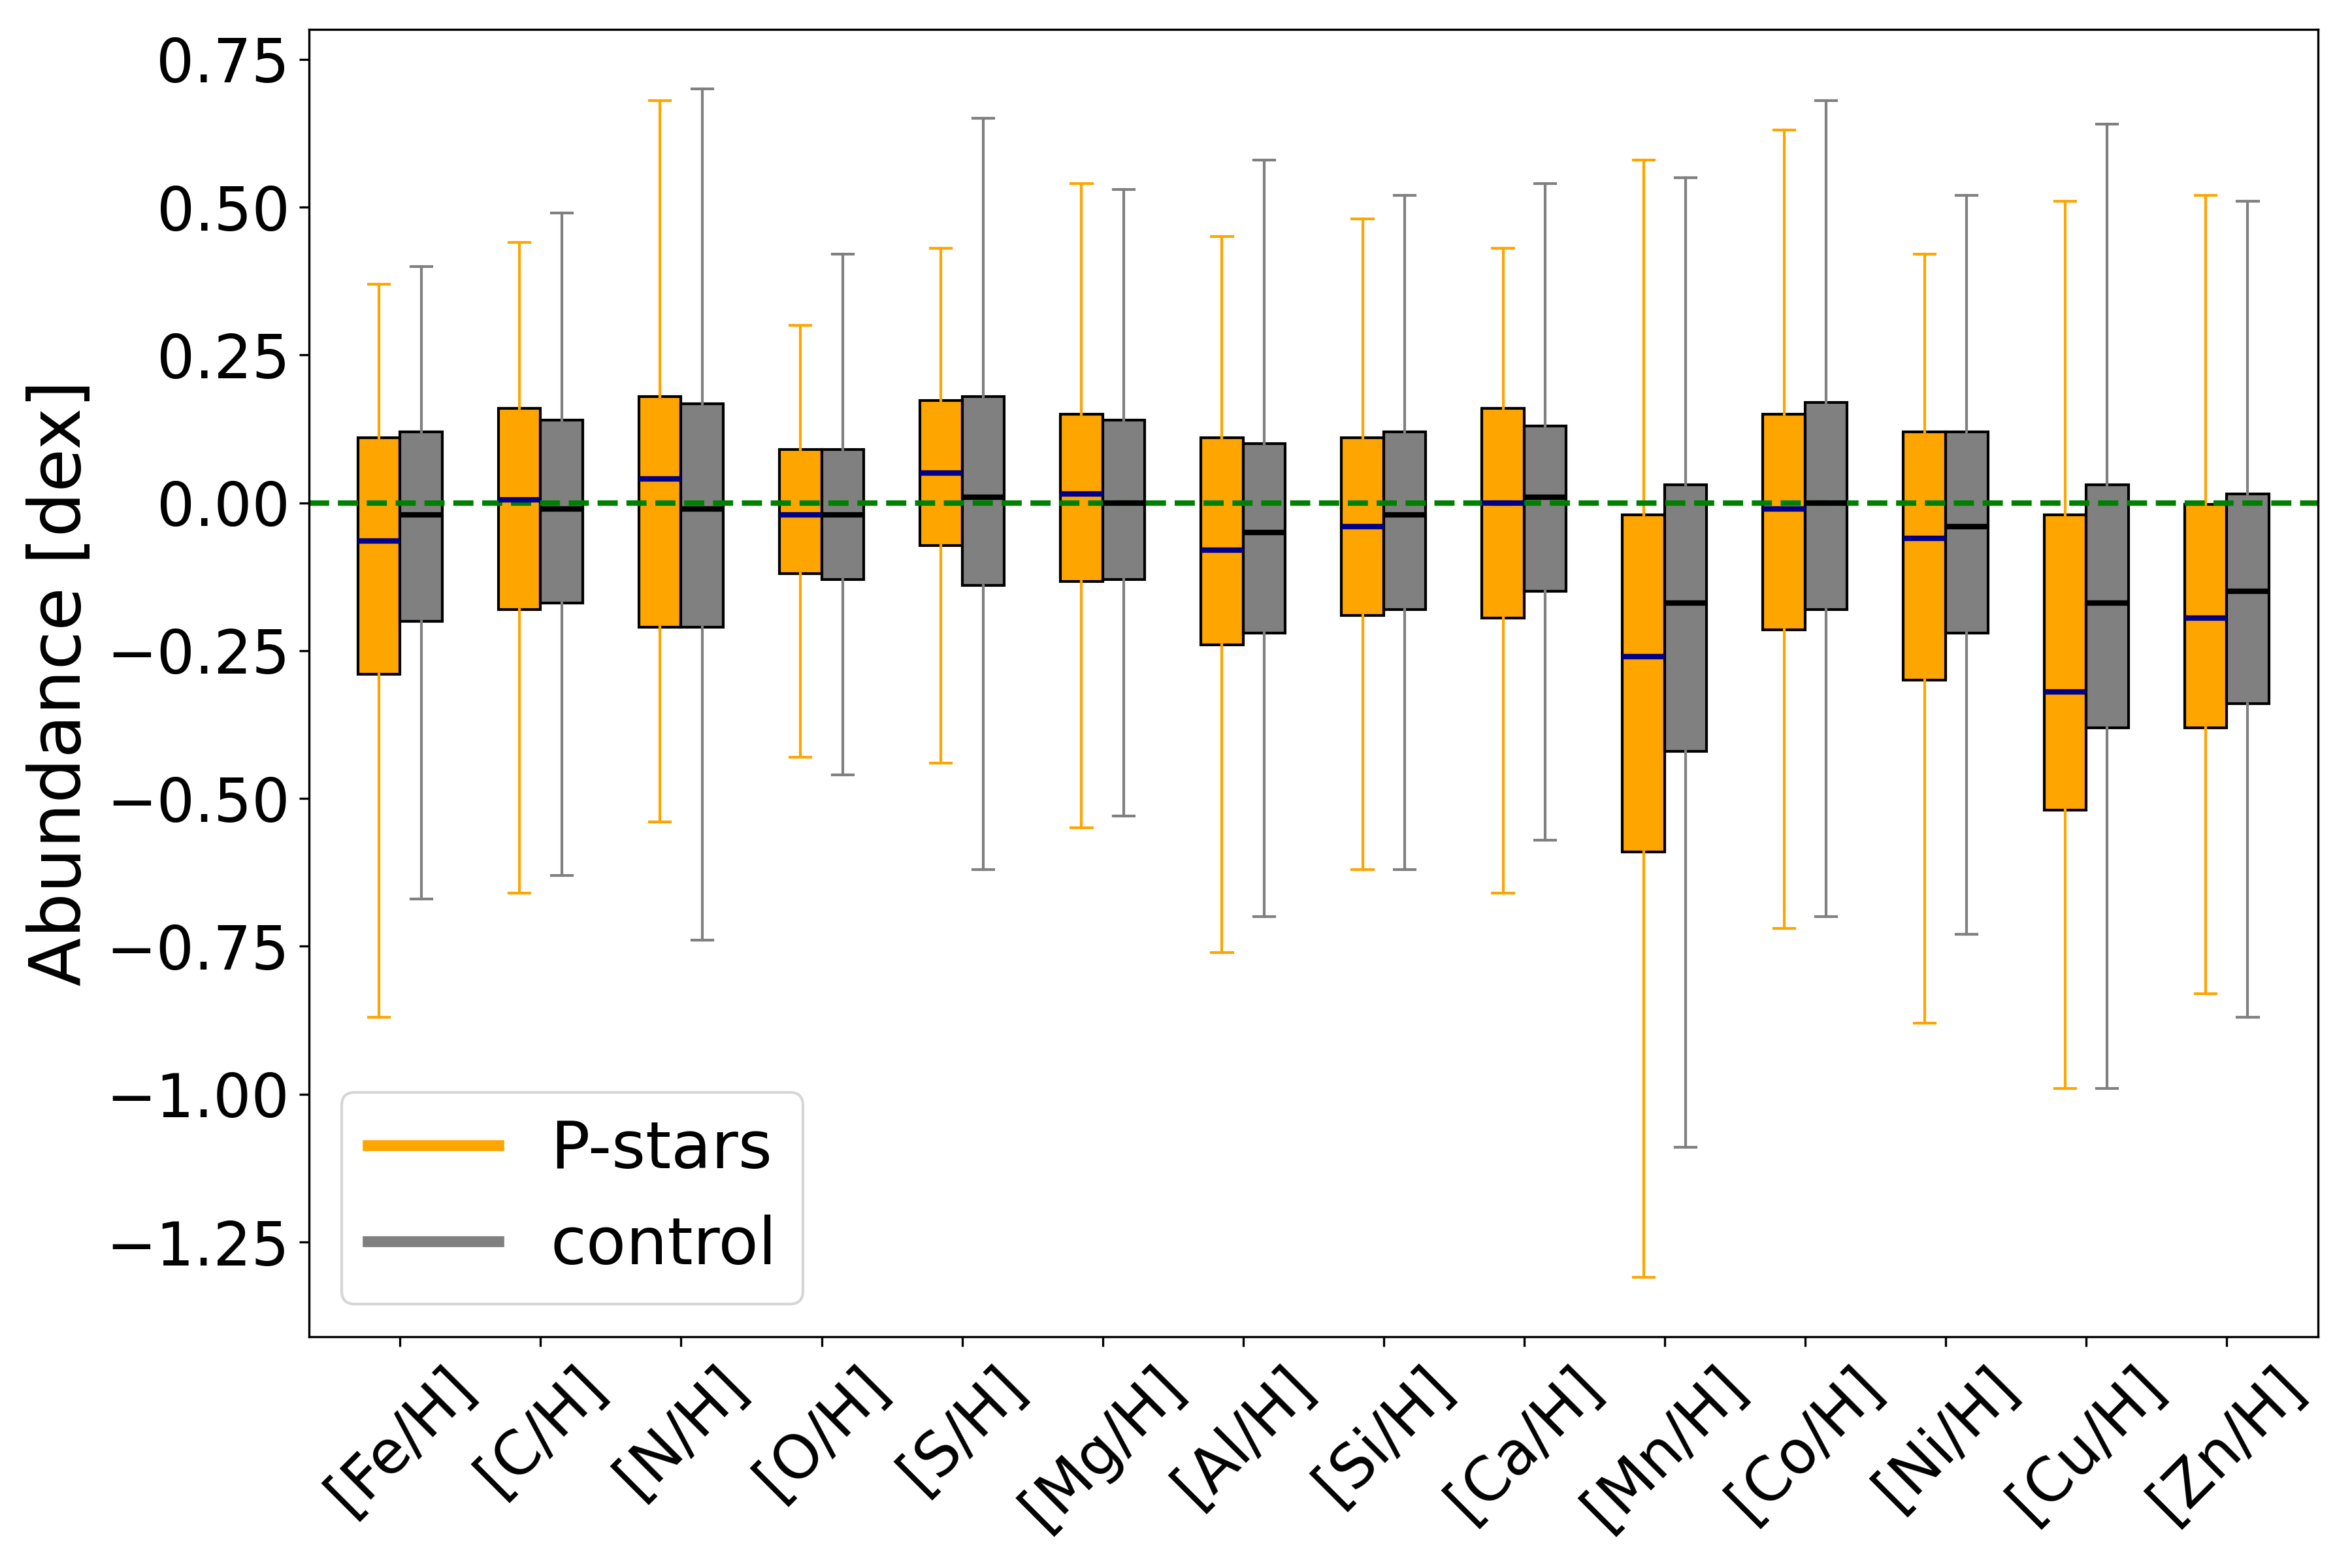
The resulting sample reproduces the distribution of the stellar properties of the P sample and reduces biases related to differences in physical parameters. Finally, we compared the distributions of the selected stellar parameters in the P sample and in the control sample using both the Kolmogorov–Smirnov (KS) and Mann–Whitney U tests. Both confirm that the two samples are statistically consistent in all matched quantities (Table 1), supporting the effectiveness of the kNN-based control selection. Figure 1 shows the corresponding abundance distributions for several life-related elements.
It is important to note that in the Hypatia Catalog the absence of a phosphorus abundance does not distinguish between a non-detection and a measurement not attempted or not reported in the original literature. The control sample should therefore not be interpreted as a population of P-poor or P-free stars, but simply as a parameter-matched reference sample without reported [P/H] measurements, used only to assess selection effects and compare the abundances of other elements.
| Parameter | Test | Statistic | p value | median (P stars) | median (control) | median | |
| Teff | Mann-Whitney U | 0.21 | 5742 | 5779 | -37 | 26.95 | |
| Teff | Kolmogorov-Smirnov | 0.067 | 0.28 | 5742 | 5779 | -37 | 26.95 |
| Distance | Mann-Whitney U | 0.41 | 59.44 | 56.95 | 2.50 | 3.27 | |
| Distance | Kolmogorov-Smirnov | 0.073 | 0.19 | 59.44 | 56.95 | 2.50 | 3.27 |
| [Fe/H] | Mann-Whitney U | 0.15 | -0.07 | -0.03 | -0.04 | 0.024 | |
| [Fe/H] | Kolmogorov-Smirnov | 0.076 | 0.16 | -0.07 | -0.03 | -0.04 | 0.024 |
| log g | Mann-Whitney U | 0.61 | 4.20 | 4.21 | -0.01 | 0.026 | |
| log g | Kolmogorov-Smirnov | 0.085 | 0.13 | 4.20 | 4.21 | -0.01 | 0.026 |
3 Analysis
Statistical approach.
All regression lines, medians, and uncertainty bands reported in this section are supported by non-parametric bootstrap resampling. Unless otherwise stated, we performed resamples and report two-sided percentile confidence intervals (95%, i.e. 2.5–97.5th percentiles). For linear trends, we bootstrapped the slope in each resample; for medians, we bootstrapped the location statistic element by element. This approach avoids distributional assumptions and propagates measurement scatter into the quoted intervals.
Multiple testing.
Because several families of correlation tests are performed in this work, some nominally significant values could arise by chance. For the main sets of correlations – namely [P/H] versus [X/H], [X/Fe] versus [P/Fe], and the residual – relations – we therefore applied a Benjamini–Hochberg false discovery rate (FDR) correction to each family of values and considered as robust those with adjusted values of . As a consistency check, the strongest correlations (P with C, O, S, Mg, Si, and the -element proxy) remain significant even when applying a single Benjamini–Hochberg correction to the full set of tests used in this paper.
3.1 Phosphorus and elements
As a first step of this analysis, we plot the abundance [P/Fe] of the stars in the P sample as a function of [Fe/H], separating them according to the Galactic component to which they belong; see Figure 2. We find evidence of a weak negative correlation between them for both populations, as found by Hinkel et al. (2020) and Maas et al. (2022). To quantify the trend, we fitted separate linear relations for thin and thick disks and bootstrapped the slope times. The resulting 95% confidence intervals exclude zero or any positive correlation in both cases, confirming a robust anti-correlation between [P/Fe] and [Fe/H] in each component (see Figure 2). HD 160617 and HD 211998 are highlighted separately in Fig. 2, since they are classified as thick-disk stars in Hypatia but identified as halo stars in the literature; the dashed red line shows the thick-disk fit obtained after excluding these two stars. We further verified that the weighted linear fits provide a reasonable first-order description of the global – trends, and that the thick-disk relation at low metallicity is sensitive to a small number of objects whose population assignment is uncertain in the literature; the corresponding robustness tests are reported in Appendix A. Since Hypatia is a heterogeneous compilation of the abundances of the literature, we additionally assessed the robustness of the global – slope via a bootstrap sensitivity analysis of leave-one-reference-out; the slope remains negative when excluding each individual reference in turn, indicating that our main result is not driven by a single source (see Appendix 5).

This behaviour is similar to the [/Fe] trends with respect to [Fe/H], well known in the literature (e.g. Maas et al. 2022, Caffau et al. 2011), and shown in Figure 3 for our sample. We determined the [/Fe] abundance ratio for each star with the following method. We selected the available -element measurements for oxygen, magnesium, silicon, sulphur, and calcium. For each element, the abundance relative to iron was calculated. The associated uncertainties in the abundance ratios were propagated using standard error propagation techniques, incorporating the measurement uncertainties of both the element and iron. Then, we calculated the weighted mean of the individual alpha-to-iron abundance ratio to obtain the representative [/Fe] ratio for each star. This approach is similar to the one described in Sánchez et al. (2014), but instead of an arithmetic mean alone we adopted a weighted mean in order to assign greater importance to elements with smaller uncertainties, ensuring a final value that is more robust and less affected by measurements with higher uncertainty. Additionally, the uncertainty in the weighted mean was derived to reflect the overall reliability of the calculated [/Fe] ratio. For a homogeneous comparison with [P/Fe], the [/Fe] trends versus [Fe/H] were also fitted and evaluated through bootstrap resamples, and 95% confidence bands are shown in Figure 3. The same calculation was applied to the control sample (shown in grey in Figure 3). There are 104 stars in the P sample that have measurements for all the elements.
The cumulative distribution of [/Fe] for our sample and the control is shown in Figure 4 (left panel). We performed a KS test that yielded a KS statistic of 0.1148 and a p value of 0.131. The p value higher than the standard significance threshold (0.05) suggests that there are no significant differences between the two distributions.

Although there is a similar correlation with respect to [Fe/H] for both [P/Fe] and [/Fe], consistent with the co-production of P and elements (O, Mg, Si, and S), their distributions (see Figure 4, right panel) exhibit some differences. This is further confirmed by the KS test (KS value = 0.28 and p value = ), suggesting that phosphorus does not follow exactly the same chemical evolution as classical elements. This difference should, however, be interpreted with caution: the broadly similar and trends with metallicity remain consistent with phosphorus being produced predominantly on short timescales, as expected if core-collapse supernovae provide the dominant contribution. At the same time, the statistically different cumulative distributions indicate that phosphorus does not trace classical -element enrichment in a one-to-one manner, pointing instead to a more complex chemical evolution.
Indeed, elements are supposed to be principally produced in nucleosynthetic processes of massive stars ( 8 ) that culminate their evolution in Type II supernovae. Phosphorus instead, not being a classical element, forms primarily in Type II supernovae, but also in low-mass (1-3 ) asymptotic giant branch (AGB) stars by neutron-capture on (Karakas, 2010) and proton-capture on and capture on (Caffau et al., 2011). These secondary channels contribute to the Galactic phosphorus budget and may explain the differences observed in its stellar abundance distribution.
To mitigate the confounding impact of the delayed iron enrichment from Type Ia supernovae, we also examine the abundance ratio as a function of metallicity (Fig. 5). Silicon is a canonical element, predominantly produced in core-collapse supernovae, while phosphorus is also expected to be dominated by short-timescale enrichment channels, although its yields remain comparatively uncertain. We adopt Si here as a complementary reference element because it is both a major rock-forming species and a convenient Fe-independent comparison for phosphorus. We note, however, that Mg is often regarded as a cleaner tracer of core-collapse enrichment than Si, which can also receive a partial Type Ia contribution; for this reason, the Si- and Mg-based comparisons should be regarded as complementary rather than interchangeable diagnostics. In the thin disk, the relation is consistent with being flat: the best-fit slope is with a 95% confidence interval of . In the thick disk, instead, we find a mild negative trend, (95% CI ), corresponding to slightly higher values at lower within this population. A comparison with binned-median trends shows that the weighted linear fits provide an adequate first-order description of the observed behaviour in both disk populations. Overall, across the dex metallicity range probed, varies only modestly compared to the stronger metallicity dependence typically observed in ratios involving iron (e.g. ), consistent with P broadly tracking a rock-forming element over the disk metallicity range sampled. Two metal-poor points with unusually large uncertainties are shown in the figure but excluded from the fit to avoid visual domination; their removal does not change the inferred slopes within uncertainties.
Interpreting stellar abundances as a proxy for the bulk composition of protoplanetary material, the limited variation in suggests that the initial phosphorus inventory relative to silicate-forming elements may not differ dramatically across disk metallicities. Under this assumption, rocky planets forming across the sampled metallicity range would start from broadly similar bulk P budgets relative to the silicate matrix, but we acknowledge that subsequent fractionation and differentiation can modify the final mantle and surface reservoirs.


Figure 6 shows the median abundance of some elements related to life for the thin and the thick disks of our Galaxy. There is a strong difference in the abundance of the majority of the elements taken into account between the thin and thick disk.
To further visualise and quantify these trends, we constructed a set of multi-panel diagrams of [X/Fe] as a function of [P/Fe] and [Fe/H] for all elements analysed (C, N, O, S, Mg, Al, Si, Ca, Mn, Co, Ni, Cu, and Zn), separately for thin- and thick disk stars (see Figs. 9 and 10 in Appendix B). In the thin disk, stars with enhanced [P/Fe] clearly tend to show enhanced [X/Fe] for most elements, especially C, O, S, and several and Fe-peak species, while the thick disk exhibits weaker and more scattered patterns. The fact that the [X/Fe]–[P/Fe] relations remain visible even after splitting by disk population, and are consistent with the residual correlations at fixed [Fe/H], reinforces the picture of a genuine multi-element co-enrichment with phosphorus.
We also summarised these trends in correlation tables that report, for each element and disk component, the Spearman coefficients and their bootstrap uncertainties for [X/Fe] versus [P/Fe] and versus [Fe/H] (Tables 7 and 8 in Appendix B). In the thin disk, the [X/Fe]–[P/Fe] correlations are generally moderate to strong and positive for most elements, with significance levels comparable to those found for the CHNOPS subset, whereas in the thick disk several elements show weaker or poorly constrained trends.
This dichotomy between the thin and thick disk reflects distinct chemical enrichment histories. The thick disk hosts, on average, older stars that formed earlier, when the ISM had a lower overall metallicity; at fixed [Fe/H], thick-disk stars are typically -enhanced, consistent with shorter enrichment timescales than in the thin disk. Consequently, thick-disk stars generally have lower metallicities than thin-disk stars.
Our results are consistent with previous abundance studies of Galactic disk populations, which have long shown that thick-disk stars are typically more -enhanced and chemically distinct from thin-disk stars at a given metallicity (Adibekyan et al., 2012; Bensby et al., 2014, e.g.). In this context, our analysis extends the comparison to phosphorus and to a broader set of bio-essential and rock-forming elements. In particular, we find that the thin-disk population is systematically more enriched in several species, with median offsets of order – dex depending on the element (Fig. 6), while the strongest P-linked abundance correlations are observed in the thin disk rather than in the thick disk.
Beyond the global [P/Fe] trend, we also find marked abundance differences between thin- and thick-disk stars. Thin-disk stars are, on average, more enriched than thick-disk stars in several bio-essential (C, N, O, S, P) and rock-forming elements, as well as in many Fe-peak species. Quantitatively, the median abundance offsets between the two populations are typically of the order of –0.5 dex, with the largest differences found among Fe-peak species and smaller, though still systematic, deficits for and light elements in the thick disk. This suggests that planets forming around thin-disk stars may inherit a chemically richer inventory of volatile and refractory elements, potentially relevant for planetary mineralogy and for geochemical pathways often discussed in prebiotic scenarios (Walton et al., 2021; Li, 2022; Krijt et al., 2022). Conversely, the lower overall enrichment of thick-disk stars points to planetary systems with a more limited chemical budget, even if this does not preclude planet formation itself. Any implications for planetary surface chemistry remain qualitative at this stage and should be tested with dedicated planet-formation and geochemical models. We therefore restrict these conclusions to chemical availability and do not draw quantitative inferences about planetary habitability.
For completeness, we also inspected the small subset of stars in our sample with confirmed exoplanets, comparing their abundances to those of non-host stars. Given the very small number of planet-hosting stars in our sample (), and the fact that they are largely dominated by close-in giant planets, we do not attempt any detailed statistical comparison between hosts and non-hosts. This host subsample is strongly affected by well-known detection biases and is not representative of the underlying planet population, especially for potentially habitable, lower-mass planets. We note that planet-hosting stars tend to show somewhat higher abundances for several elements than non-hosts, but given the small and biased nature of this subsample we regard this trend as purely qualitative and do not draw any quantitative conclusions from these data. This cautious interpretation is consistent with previous work by Caffau et al. (2011), who also discussed phosphorus abundances in stars with and without detected planets. In our case, however, the host subsample is substantially smaller and more strongly affected by selection biases, so we limit ourselves to a qualitative comparison and do not attempt a statistically meaningful comparison of host and non-host stars.
3.2 Phosphorus and CNOS
Concerning the most abundant elements in living beings (the CHNOPS) (Grigaitis and Széliová, 2023), we performed an analysis of them as a function of P. Each analysis includes only stars with both P and the relevant CNOS abundance measured: 144 for C, 83 for N, 176 for O, and 124 for S. Beyond rank and linear tests, we estimated the slope of [X/H] versus [P/H] via bootstrap to assess uncertainty and sign support. For each element and disk component, resamples yield the distribution of slopes; the 95% intervals and are reported in Table 2 and visualised as shaded bands in Figure 7. HD 160617 and HD 211998 are marked separately in Fig. 7, since they are classified as thick-disk stars in Hypatia but identified as halo stars in the literature; where shown, dashed lines indicate thick-disk fits obtained after excluding these two stars. In the thin disk, the bootstrap support for a positive slope is for all CNOS elements, while the thick disk shows broader intervals for N and S.
We further tested whether these correlations are simply driven by the common dependence of [P/H] and [X/H] on [Fe/H]. For each element X (C, N, O, S, Mg, Si, and the -element proxy), we fitted [X/H] and [P/H] as functions of [Fe/H] and computed residuals and (see Table 3). Mg and Si are explicitly included here because they are key rock-forming elements for terrestrial planets and regulate the formation of the main silicate minerals, including those that incorporate phosphorus; their behaviour is further discussed in Sect. 3.3. Spearman rank correlations between these residuals show that P remains moderately correlated with C, O, Mg, Si, and the -element proxy at fixed [Fe/H] (for C: , , ; for O: , , ; for Mg: , , ; for Si: , , ; for the proxy: , , ). Sulphur also shows a weaker but still significant residual correlation (, , ), whereas nitrogen does not show any detectable residual trend (, , ). After applying an FDR correction to this set of residual correlations, C, O, S, Mg, Si, and the -element proxy all remain significant at , while N remains consistent with no correlation. This confirms that, for these elements, the co-enrichment with P is not merely a reflection of the global metallicity trend, but traces a genuine pattern of chemical co-variation at fixed [Fe/H]. Taken together with the trends discussed in Section 3.1, the residual analysis of Table 3 shows that the P–CHNOPS and P– correlations are not merely a by-product of global metallicity, but trace a genuine multi-element co-enrichment pattern that is most clearly seen in the thin disk.
This result is consistent with previous work, but also refines it in several respects. Caffau et al. (2011) already showed that phosphorus behaves similarly to the main elements, while Maas et al. (2019) and Maas et al. (2022) found that the global evolution of P is broadly consistent with that of O, Mg, Si, and S. Likewise, Nandakumar et al. (2023) reported that P follows the main -element patterns in disk stars. In our sample, the association with P remains significant at fixed metallicity for O, Mg, and Si, with residual Spearman coefficients of , , and , respectively, whereas S shows only a weaker residual trend and N no residual correlation. In addition, the [X/H]–[P/H] bootstrap slopes are uniformly positive and well constrained in the thin disk, while the corresponding thick-disk relations are generally weaker and, in some panels, more sensitive to the inclusion of the two literature-identified halo stars.
The positive correlations observed highlight a fundamental aspect of stellar and planetary chemistry: the environments enriched in P are likely to be a richer inventory of the other elements required for life. This co-enrichment suggests that the abundance of P in a stellar system could serve as an indirect tracer of the overall chemical fertility of its protoplanetary disk. In particular, high abundance of P might indicate places where the building blocks of biomolecules (carbon-based molecules such as lipids, proteins, or nucleic acids) are simultaneously present in sufficient quantity. Our results provide a preliminary indication that planets forming around stars with higher abundances of P may inherit a chemical composition more conducive to prebiotic chemistry. Therefore, identifying regions of the Galaxy where P and other CHNOPS are co-enriched could be a strategic approach to prioritise targets in the search for life elsewhere.
| Elem. | Sample | Mean | Std | CI low | CI high | |
| C | Thin | 0.59 | 0.11 | 0.41 | 0.80 | 100% |
| C | Thick | 0.92 | 0.13 | 0.71 | 1.20 | 100% |
| N | Thin | 0.86 | 0.11 | 0.65 | 1.10 | 100% |
| N | Thick | 0.41 | 0.46 | -0.27 | 1.10 | 74% |
| O | Thin | 0.55 | 0.08 | 0.39 | 0.69 | 100% |
| O | Thick | 0.58 | 0.11 | 0.38 | 0.81 | 100% |
| S | Thin | 0.56 | 0.08 | 0.38 | 0.69 | 100% |
| S | Thick | 0.34 | 0.67 | -0.96 | 1.70 | 72% |
| Element | value | |||
| C | 144 | 0.42 | ||
| N | 83 | -0.01 | ||
| O | 176 | 0.44 | ||
| S | 124 | 0.25 | ||
| Mg | 203 | 0.52 | ||
| Si | 203 | 0.52 | ||
| /Fe | 104 | 0.40 |


3.3 Molar ratio
In this section, we complement the standard dex notation with molar ratios, since the latter provide a more direct description of stoichiometric and mineralogical relations between elements. This choice follows the approach advocated by Hinkel et al. (2020) and facilitates the interpretation of stellar abundance patterns in the context of planetary studies.
We calculated the molar ratios using the following equation:
| (1) |
where [X/H] and [Y/H] refers to the dex abundance of the elements considered and with are the solar reference abundance taken from Lodders (2019). This formulation follows Equation (2) from Hinkel et al. (2020). This equation converts stellar abundances from the logarithmic dex scale to molar ratios, suitable for applications in planetary composition and geochemistry. Molar ratios are reported without square brackets, unlike abundance ratios in dex notation, following standard conventions in the literature (Hinkel et al. (2020), Maas et al. 2022).
The classical planet–mineralogy ratios C/O and Mg/Si, which are key diagnostics of the silicate–carbide balance and bulk mantle mineralogy (Larimer (1975), Thiabaud et al. 2015), in our P-star sample are broadly consistent with those of solar neighbourhood FGK stars represented by the control sample, so that our P detections are not restricted to an extreme mineralogical sub-population (see Appendix C and Figure 11).
Phosphorus is relevant to planetary mineralogy because it can occur in both lithophilic and siderophilic phases; in the latter case, it is expected to partition into the iron-rich core during differentiation, reducing the amount of lithophilic P available in the silicate reservoir (Todd, 2022). In this context, we explored the molar ratios P/Si and P/Mg as first-order proxies of the initial bulk chemical inventory available to rocky planets. These two ratios are very tightly correlated in both disk populations, although part of this behaviour is expected algebraically because ratios sharing the same numerator satisfy . We confirm that the observed scatter is consistent with the Mg/Si distribution (), and therefore interpret this diagnostic primarily as a constraint on the initial chemical inventory, rather than on the subsequent differentiation of planetary interiors. A more detailed discussion is given in Appendix C.2.
In an oxidising condition, P tends to form orthophosphate species ( ) found in minerals such as apatite, the bioavailable form in Earth crust. Under reducing conditions, instead, phosphorus combines with iron, forming metal-phosphides () that segregate into the planetary core during differentiation, reducing the amount of phosphorus accessible to the surface environment and, consequently, to biological processes. To explore these processes from a stellar perspective, we analysed the molar ratios P/Fe and P/O for our sample stars (shown in Figure 8).

This figure presents the distribution of molar P/O as a function of P/Fe for our sample. Our analysis reveals that thick disk stars exhibit slightly higher P/Fe values compared to thin disk stars, consistent with distinct chemical enrichment for the two populations.
Moreover, the two populations show different correlations between the two ratios: a weak but statistically significant positive correlation (Spearman rank coefficient , ) is found for the thin disk population, indicating a statistically significant relationship between the two variables. On the contrary, no significant correlation is observed for the thick disk (Spearman , ), suggesting that this trend is not present in the older stellar population.
The statistically significant correlation in the thin disk, and the absence of correlation in the thick disk, may be interpreted in the context of Galactic chemical evolution. Stars belonging to the thin disk formed in a chemically rich environment in which successive generations of massive stars enriched the ISM with different elements. This progressive enrichment and a more uniform star formation processes may lead to observable correlation between specific elemental abundances. Instead, thick disk stars are formed in an epoch of less efficient chemical mixing and more stochastic enrichment that may obscure any kind of correlation. Thus, this absence of correlation reflects its distinct chemical enrichment history.
The position of the solar P/O ratio, found in the upper range of the densest region of the sample distribution, suggests that the Solar System formed in an environment with a relatively high phosphorus-to-oxygen ratio. This local enrichment could have favoured the formation of abundant phosphate minerals on early Earth, enhancing the bioavailability of P and potentially playing a key role in the emergence of life (Hao et al., 2025). Any such interpretation should, however, be regarded with caution, because the final planetary abundance of several relevant elements can be strongly modified by volatility and differentiation processes, particularly for O and P, which are generally regarded as volatile and moderately volatile, respectively (see Sec. 1).
We report the values of P/Fe and P/O for the Earth’s crust in the same figure. These ratios are significantly different from stellar values, highlighting the profound impact of planetary differentiation process, such as core formation, mantle-crust segregation and surface oxidation, on the final distribution of P. While stellar abundances set the initial bulk composition of a planet, the accessibility of P is ultimately controlled by planetary differentiation and near-surface processes.
Taken together, these results indicate that P partially co-evolves with elements, sharing similar nucleosynthetic origins while also being shaped by distinct enrichment processes. Its positive correlations with key biogenic species such as C, O, and S reinforce its role as a tracer of chemically rich environments conducive to biological processes. Overall, our results indicate that the thin and thick disks differ not only in metallicity but also in the relative abundance patterns involving P and other key elements, providing empirical constraints for Galactic chemical evolution and for the initial chemical inventory of planet-forming material.
Finally, the study of molar ratios such as P/Fe and P/O highlights the importance of P in planetary differentiation and surface mineralogy, with potential implications for P bioavailability and the chemical conditions at planetary surfaces. Although stellar abundances provide a valuable starting point for estimating the initial chemical inventory available for biochemical reactions, it is essential to recognise that internal planetary processes, such as core formation and surface oxidation, play a critical role in determining the actual availability of P at the surface. Notably, the Sun exhibits P/Si and P/Mg ratios that are consistent with the bulk of our stellar sample, whereas its P/O ratio appears slightly elevated. This local enrichment in P relative to oxygen could have favoured the formation of phosphate-bearing minerals in the early Solar System, potentially contributing to the favourable chemical conditions that enabled the emergence of life on Earth.
4 Conclusions
This study explores the Galactic distribution of P and its relationship to other chemical elements relevant to life and planet formation. Using high-quality stellar abundances from the Hypatia Catalog, we analysed a sample of 233 FGK stars with P measurements.
We confirm the similarity between the [P/Fe] and [/Fe] trends with respect to [Fe/H], reinforcing the idea that P is primarily synthesised in massive stars and follows the chemical evolution of elements, even if the additional discrepancy in the cumulative distribution between P and elements suggest that P is produced in Type II supernovae, but also in AGB stars via neutron-capture on and capture on .
We further tested a Fe-independent diagnostic by examining as a function of . We find that is consistent with a flat trend in the thin disk, while the thick disk shows only a mild negative slope, implying that varies modestly across the dex metallicity range probed compared to iron-based ratios.
We find significant differences in the chemical abundances of many elements between the thin and thick disk, not only for P itself, but also for other life-related elements. Quantitatively, the median abundance differences between thin- and thick-disk stars are typically of the order of – dex, with the largest offsets found among Fe-peak species and smaller, though still systematic, deficits for and light elements in the thick disk.
This suggests that thin–disk host stars reside in a chemically richer environment, with enhanced availability of several bio-essential elements. In this sense they appear more chemically fertile than thick–disk hosts, but translating these chemical trends into quantitative predictions for the emergence and evolution of life would require additional assumptions and is left to future work.
Among the life-related elements analysed during our study, we paid more attention to CHNOPS, finding a moderate-to-strong positive correlation between the abundance of phosphorus and the abundance of each of the remaining CHNOPS. Quantitatively, the bootstrap support for a positive [X/H]–[P/H] slope in the thin disk is 100% for all CNOS elements, whereas in the thick disk C and O remain fully supported but N and S are less secure, with positive-slope support decreasing to 74% and 72%, respectively. This co-enrichment supports the idea that P-bearing stars may represent favourable sites for the prebiotic reactions and for biochemistry similar to Earth’s. These conclusions are robust to sampling noise, as verified by extensive bootstrap resampling of slopes, medians, and correlation coefficients throughout the analysis.
In addition, analysing residual abundances at fixed [Fe/H], we find that P remains significantly correlated with C, O, Mg, Si, and the -element proxy, with residual Spearman coefficients generally , while sulphur shows a weaker but still significant residual trend () and nitrogen remains fully consistent with no residual correlation. This confirms that the main P–CHNOPS and P– correlations we report are not simply a by-product of the underlying [Fe/H] distribution, but carry independent information on the chemical fertility of the star-forming environment.
The analysis of molar ratios shows that the stellar P/Mg and P/Si ratios are very tightly correlated, consistent with the co-enrichment of P with elements such as Mg and Si and with the observed Mg/Si distribution in disk stars. These trends constrain the initial chemical inventory available to rocky planets, but on their own do not allow us to infer the details of planet-scale differentiation or P partitioning.
The correlation for P/Fe versus P/O is low to moderate for the thin disk, while no significant correlation is present for the thick disk. A key point is that the solar P/O value lies in the upper range of the densest region of the distribution. This may indicate a locally enhanced phosphorus abundance compared to average thin-disk stars, which could have influenced the P availability in the early Solar System.
Moreover, the significant difference between the molar ratios observed in the Earth’s crust and those derived from stellar abundances highlights how stellar compositions can provide, at best, a modest starting point for estimating the chemical conditions relevant to planetary biogeochemistry. It is therefore essential not to underestimate the critical role of internal planetary processes, such as differentiation and surface geochemistry, in shaping the actual availability of bio-essential elements.
Our work delivers a systematic assessment of phosphorus in FGK stars within Hypatia, linking P to CHNOPS co-enrichment, Galactic disk populations, and molar ratios relevant to planetary mineralogy and phosphorus bioavailability. Altogether, these findings position P as a chemically distinct tracer that partially overlaps with -element evolution, correlates with bio-essential chemistry, and plays a potentially limiting role in planetary habitability. As future stellar surveys (e.g. WEAVE, 4MOST) expand the abundance dataset for under-observed elements such as P, a more comprehensive picture of Galactic habitability will become possible.
Acknowledgements.
DE acknowledges support from the Dottorati PNRR programme, Mission I.4.1 Public Administration, Programme DOT22EBYNH – Molecular Sciences for Earth and Space, CUP F66E23000080006. GC acknowledges support from the University of Napoli Federico II (project: FRA-CosmoHab, CUP E65F22000050001). The authors acknowledge the use of the Hypatia Catalog Database, an online compilation of stellar abundance data as described in Hinkel et al. (2014), which was supported by NASA’s Nexus for Exoplanet System Science (NExSS) research coordination network and the Vanderbilt Initiative in Data-Intensive Astrophysics (VIDA). V.M.R. acknowledges support from the grant PID2022-136814NB-I00 by the Spanish Ministry of Science, Innovation and Universities/State Agency of Research MICIU/AEI/10.13039/501100011033 and by ERDF, UE; the grant RYC2020-029387-I funded by MICIU/AEI/10.13039/501100011033 and by "ESF, Investing in your future", and from the Consejo Superior de Investigaciones Científicas (CSIC) and the Centro de Astrobiología (CAB) through the project 20225AT015 (Proyectos intramurales especiales del CSIC); and from the grant CNS2023-144464 funded by MICIU/AEI/10.13039/501100011033 and by “European Union NextGenerationEU/PRTR”. DG was supported by funding from the European Research Council (ERC) under the European Union’s Horizon 2020 research and innovation program Grant Agreement No. 948972—COEVOLVE—ERC-2020-STG. This work was partly supported by the Italian Ministero dell’Istruzione, Università e Ricerca through the grant Progetti Premiali 2012 – iALMA (CUP C52I13000140001). This project has received funding from the European Union’s Horizon 2020 research and innovation programme under the European Research Council (ERC) via the ERC Synergy Grant ECOGAL (grant 855130).References
- Chemical abundances of 1111 fgk stars from the harps gto planet search program-galactic stellar populations and planets. A&A 545, pp. A32. Cited by: §3.1.
- Prebiotic chemicals—amino acid and phosphorus—in the coma of comet 67p/churyumov-gerasimenko. Sci. Adv. 2 (5), pp. e1600285. Cited by: §1.
- The present-day cosmic phosphorus abundance. A&A 698, pp. A164. External Links: Document, 2505.08428 Cited by: §1.
- Exploring the milky way stellar disk-a detailed elemental abundance study of 714 f and g dwarf stars in the solar neighbourhood. A&A 562, pp. A71. Cited by: §3.1.
- The compositional diversity of extrasolar terrestrial planets. i. in situ simulations. ApJ 715 (2), pp. 1050. Cited by: §1.
- The compositional diversity of extrasolar terrestrial planets. i. in situ simulations. ApJ 715 (2), pp. 1050–1070. External Links: Document, ADS entry Cited by: §1.
- Unveiling the chemical fingerprint of phosphorus-rich stars-i. in the infrared region of apogee-2. A&A 673, pp. A123. Cited by: §1.
- The role of phosphorus in the origin of life and in evolution. Phosphorus: An Element that could have been called Lucifer, pp. 1–12. Cited by: §1.
- The galactic evolution of phosphorus. A&A 532, pp. A98. Cited by: §3.1, §3.1, §3.1, §3.2.
- Habitability: a review. Astrobiology 16 (1), pp. 89–117. Cited by: §1.
- Transition metal abundance as a key parameter for the search of Life in the Universe. Open J. Astrophys. 8, pp. 117. External Links: Document, 2207.03748, ADS entry Cited by: §1.
- Observations of phosphorus-bearing molecules in the interstellar medium. Front. Astron. Space Sci. 11, pp. 1451127. Cited by: §1.
- Trace metal availability and the evolution of biogeochemistry. Nat. Rev. Earth Environ. 4 (9), pp. 597–598. Cited by: §1.
- What makes up a cell. Econ Princ Cell Biol. Cited by: §3.2.
- Active redox cycling of phosphorus on the early earth. Nat. Commun. 16 (1), pp. 1–4. Cited by: §3.3.
- Optical remote sensing of planetary space environment. In Recent Remote Sensing Sensor Applications-Satellites and Unmanned Aerial Vehicles (UAVs), Cited by: §1.
- The influence of stellar phosphorus on our understanding of exoplanets and astrobiology. ApJ 900 (2), pp. L38. Cited by: §1, §3.1, §3.3, §3.3.
- Stellar abundances in the solar neighborhood: the hypatia catalog. AJ 148 (3), pp. 54. Cited by: §2.1, §2.1, §2.1, §4.
- The hypatia catalog database: a web-based interface for exploring stellar abundances. arXiv e-prints arXiv:1712.04944. Cited by: §2.1.
- The star-planet connection i: using stellar composition to observationally constrain planetary mineralogy for the ten closest stars. ApJ 853 (1), pp. 83. External Links: Document, 1709.08630, Link Cited by: §1.
- Abundances of elements in solar systems. Treatise Geochem.. Note: accepted for publication as Ch. 154 in the 3rd edition External Links: 2405.05324 Cited by: §1, §2.1.
- Updated stellar yields from asymptotic giant branch models. MNRAS 403 (3), pp. 1413–1425. Cited by: §3.1.
- Chemical habitability: supply and retention of life’s essential elements during planet formation. Protostars Planets VII. Note: under review External Links: 2203.10056 Cited by: §1, §3.1.
- The effect of co ratio on the condensation of planetary material. Geochim. Cosmochim. Acta 39 (3), pp. 389–392. Cited by: §3.3.
- Minerals as prebiotic catalysts for chemical evolution towards the origin of life. In Mineralogy, Cited by: §3.1.
- 4.4 abundances of the elements in the solar system. Solar system, pp. 712–770. Cited by: §2.1.
- Solar system abundances and condensation temperatures of the elements. ApJ 591 (2), pp. 1220–1247. External Links: Document, ADS entry Cited by: §1.
- Solar elemental abundances. arXiv e-prints arXiv:1912.00844. Note: review paper Cited by: §1, §3.3.
- The galactic distribution of phosphorus: a survey of 163 disk and halo stars. AJ 164 (2), pp. 61. Cited by: §1, §3.1, §3.1, §3.2, §3.3.
- Phosphorus abundances in the hyades and galactic disk. AJ 158 (6), pp. 219. Cited by: §1, §3.2.
- Phosphorus-rich stars with unusual abundances are challenging theoretical predictions. Nat. Commun. 11 (1), pp. 3759. Cited by: §1, §1.
- New beryllium observations in low-metallicity stars. A&A 319, pp. 593–606. Cited by: Appendix A.
- M giants with igrins-i. stellar parameters and -abundance trends of the solar neighborhood population. A&A 675, pp. A23. Cited by: §3.2.
- Solar system abundances of the elements. In Treatise on Geochemistry, H. D. Holland and K. K. Turekian (Eds.), Vol. 1, pp. 41–61. External Links: Document, ADS entry Cited by: §1.
- Redox chemistry in the phosphorus biogeochemical cycle. Proc. Natl. Acad. Sci. USA 111 (43), pp. 15468–15473. Cited by: §1.
- Rethinking early earth phosphorus geochemistry. Proc. Natl. Acad. Sci. USA 105 (3), pp. 853–858. Cited by: §1.
- Trans-iron ge, as, se, and heavier elements in the dwarf metal-poor stars hd 19445, hd 84937, hd 94028, hd 140283, and hd 160617. A&A 638, pp. A64. Cited by: Appendix A.
- ALMA and rosina detections of phosphorus-bearing molecules: the interstellar thread between star-forming regions and comets. MNRAS 492 (1), pp. 1180–1198. Cited by: §1.
- Chemical abundances of stars with brown-dwarf companions. A&A 566, pp. A83. Cited by: §3.1.
- Chapter 11—the global carbon cycle. biogeochemistry. Academic Press, Boston, MA, USA. Cited by: §1.
- Beryllium abundances and star formation in the halo and in the thick disk. A&A 499 (1), pp. 103–119. Cited by: Appendix A.
- Sulfur and phosphorus in the earth’s core: the fe-p-s system at 23 gpa. Geophys. Res. Lett. 34 (13). Cited by: §1.
- The distribution of volatile elements during rocky planet formation. Front. Earth Sci. 11, pp. 1159412. External Links: Document, Link Cited by: §1.
- Weighted nearest neighbours-based control group selection method for observational studies. PLoS ONE 15 (7), pp. e0236531. Cited by: §2.2.
- Elemental ratios in stars vs planets. A&A 580, pp. A30. Cited by: Appendix C, §3.3.
- Sources of nitrogen-, sulfur-, and phosphorus-containing feedstocks for prebiotic chemistry in the planetary environment. Life 12 (8), pp. 1268. Cited by: §3.3.
- Unveiling the bioleaching versatility of acidithiobacillus ferrooxidans. Microorganisms 12 (12), pp. 2407. Cited by: §1.
- The relative influences of nitrogen and phosphorus on oceanic primary production. Nature 400 (6744), pp. 525–531. Cited by: §1.
- Phosphorus availability on the early earth and the impacts of life. Nat. Geosci. 16 (5), pp. 399–409. Cited by: Appendix C, §1.
- Phosphorus mineral evolution and prebiotic chemistry: from minerals to microbes. Earth-Sci. Rev. 221, pp. 103806. Cited by: §3.1.
- Abundances of chemical elements in the earth’s crust. Geochem. Int. 44, pp. 48–55. Cited by: Appendix C.
Appendix A Sensitivity to abundance sources
For transparency, we first list in Table 4 the original literature sources of the phosphorus abundances compiled in the Hypatia Catalog and used in this work, together with the number of stars contributed by each study. This table is intended to document the bibliographic origin of the measurements adopted here, including sources contributing only a small number of stars. We then used the subset of references with sufficient sample size to perform the leave-one-reference-out sensitivity analysis described below.
To assess whether the global – trend could be driven by a single literature source or by reference-dependent systematics in the Hypatia compilation, we performed a leave-one-reference-out (LOO) sensitivity analysis. For each reference contributing measurements to our sample, we removed all stars associated with that reference and re-estimated the global linear slope using the remaining stars. For each LOO realisation, we derived the slope distribution using non-parametric bootstrap resampling of the pairs and reported the median slope and the 95% bootstrap confidence interval. The results (Table 5) show that the slope remains negative for all LOO realisations, indicating that the anti-correlation between and does not depend on any single reference.
As an additional robustness check, we verified that the global – anti-correlation is not driven by the low-metallicity tail of the sample and that a single weighted linear fit provides a reasonable first-order description of the trend. We therefore compared three thick-disk samples: the full sample, the conservative sample excluding stars with , and a halo-cleaned sample in which only the stars classified as halo in the literature were excluded. Table 6 summarises the corresponding slopes, 95% bootstrap confidence intervals, and the agreement between the weighted linear fits and the corresponding binned median trends. The thick-disk slope changes from in the full sample to in the conservative sample, and to in the halo-cleaned sample. We also cross-checked the most metal-poor stars classified as thick disk in Hypatia against the literature. Among the five objects with , HD 211998 and HD 160617 are explicitly classified as halo stars in the literature (Molaro et al. 1997; Peterson et al. 2020), whereas HD 59374 is more likely associated with the thick disk than with the halo (Smiljanic et al. 2009). No equally clear halo classification was found for HD 113092 or HD 81762. The close agreement between the conservative and halo-cleaned slopes indicates that the difference between the full and conservative thick-disk fits is largely driven by a small number of metal-poor halo contaminants.
| Reference | Year | |
| Maas et al. | 2022 | 142 |
| Maas et al. | 2019 | 30 |
| Caffau et al. | 2019 | 20 |
| Nandakumar et al. | 2022 | 15 |
| Sneden et al. | 2021 | 13 |
| Jacobson et al. | 2014 | 5 |
| Maas et al. | 2017 | 3 |
| Roederer et al. | 2014b | 2 |
| Caffau et al. | 2015b | 1 |
| Caffau et al. | 2011 | 1 |
| Excluded reference | Slope median | Slope 95% CI | Slope | Slope 95% CI | |
| None (full sample) | 233 | [, ] | [, ] | ||
| Maas et al. (2022) | 91 | [, ] | [, ] | ||
| Caffau et al. (2019) | 213 | [, ] | [, ] | ||
| Sneden et al. (2021) | 220 | [, ] | [, ] | ||
| Nandakumar et al. (2022) | 218 | [, ] | [, ] | ||
| Maas et al. (2019) | 203 | [, ] | [, ] |
| Sample | Slope | 95% CI | |||
| Full thick | 44 | [,] | 0.043 | 0.443 | |
| Cons. thick | 39 | [,] | 0.046 | 0.664 | |
| Cleaned thick | 42 | [,] | 0.018 | 0.936 |
Appendix B Multi-element abundance panels and correlation tables
In this appendix, we present the full set of multi-panel diagrams and correlation tables that complement the abundance trends discussed in Sect. 3.2. Figure 9 displays [X/Fe] as a function of [P/Fe] for all elements considered in this work, while Figure 10 shows the corresponding [X/Fe]–[Fe/H] relations. For each panel, we show a typical 1 error bar obtained by propagating the measurement uncertainties in [X/H] and [Fe/H].
Tables 7 and 8 list the Spearman rank coefficients for these relations in the thin and thick disks, together with bootstrap uncertainties in the correlation strength. In the tables, denotes half the width of the 95% bootstrap confidence interval for the Spearman coefficient. These diagnostic plots and tables provide the quantitative basis for the co-enrichment trends highlighted in the main text. As an additional consistency check, we repeated the main [X/H]–[P/H] correlation analysis after applying, where available, the same abundance-uncertainty cut ( dex) to the other elements as that used for P and Fe. Table 9 compares the resulting correlation coefficients and bootstrap slopes for the full and error-restricted samples. For C, O, Mg, and Si, the results remain stable in both disk populations, whereas the thick-disk results for N and S remain less well constrained owing to the smaller sample sizes.


| Element | ||||||||
| P | 171 | 1.00 | 0.00 | 44 | 1.00 | 0.00 | ||
| C | 111 | 0.49 | 0.16 | 27 | 0.51 | 0.32 | ||
| N | 73 | 0.11 | 0.23 | 10 | 0.42 | 0.71 | ||
| O | 133 | 0.42 | 0.15 | 39 | 0.71 | 0.27 | ||
| S | 102 | 0.35 | 0.19 | 16 | 0.63 | 0.38 | ||
| Mg | 155 | 0.42 | 0.15 | 40 | 0.55 | 0.32 | ||
| Al | 148 | 0.28 | 0.17 | 39 | 0.69 | 0.16 | ||
| Si | 155 | 0.45 | 0.15 | 40 | 0.59 | 0.32 | ||
| Ca | 155 | 0.17 | 0.18 | 40 | 0.53 | 0.33 | ||
| Mn | 133 | -0.09 | 0.18 | 39 | -0.46 | 0.29 | ||
| Co | 122 | 0.34 | 0.18 | 36 | 0.62 | 0.19 | ||
| Ni | 155 | 0.30 | 0.15 | 40 | 0.20 | 0.34 | ||
| Cu | 76 | 0.40 | 0.21 | 27 | -0.05 | 0.43 | ||
| Zn | 123 | 0.44 | 0.15 | 40 | 0.35 | 0.30 |
| Element | ||||||||
| P | 171 | -0.37 | 0.14 | 44 | -0.60 | 0.31 | ||
| C | 111 | -0.47 | 0.15 | 27 | -0.40 | 0.37 | ||
| N | 73 | -0.14 | 0.21 | 10 | -0.38 | 0.72 | ||
| O | 133 | -0.66 | 0.10 | 39 | -0.81 | 0.12 | ||
| S | 102 | -0.58 | 0.13 | 16 | -0.71 | 0.31 | ||
| Mg | 155 | -0.56 | 0.12 | 40 | -0.74 | 0.19 | ||
| Al | 148 | -0.02 | 0.17 | 39 | -0.40 | 0.31 | ||
| Si | 155 | -0.47 | 0.13 | 40 | -0.78 | 0.15 | ||
| Ca | 155 | -0.49 | 0.13 | 40 | -0.81 | 0.14 | ||
| Mn | 133 | 0.58 | 0.13 | 39 | 0.63 | 0.22 | ||
| Co | 122 | -0.04 | 0.20 | 36 | -0.40 | 0.28 | ||
| Ni | 155 | 0.21 | 0.16 | 40 | 0.00 | 0.34 | ||
| Cu | 76 | 0.38 | 0.21 | 27 | 0.33 | 0.35 | ||
| Zn | 123 | 0.01 | 0.19 | 40 | -0.25 | 0.33 |
| Element | Sample | Population | Slope | 95% CI | ||
| C | thick | 18 | 0.856 | 1.116 | [0.623, 2.133] | |
| C | thin | 106 | 0.786 | 0.578 | [0.405, 0.804] | |
| C | full | thick | 27 | 0.732 | 0.930 | [0.724, 1.163] |
| C | full | thin | 111 | 0.766 | 0.577 | [0.402, 0.801] |
| N | thick | 8 | 0.443 | 0.511 | [-2.108, 1.575] | |
| N | thin | 68 | 0.677 | 0.847 | [0.642, 1.089] | |
| N | full | thick | 10 | 0.262 | 0.388 | [-0.259, 1.066] |
| N | full | thin | 73 | 0.683 | 0.852 | [0.641, 1.094] |
| O | thick | 23 | 0.883 | 0.459 | [0.284, 0.971] | |
| O | thin | 113 | 0.665 | 0.556 | [0.385, 0.702] | |
| O | full | thick | 39 | 0.840 | 0.568 | [0.381, 0.805] |
| O | full | thin | 133 | 0.643 | 0.551 | [0.384, 0.691] |
| S | thick | 14 | 0.490 | 0.832 | [-0.807, 2.000] | |
| S | thin | 90 | 0.618 | 0.577 | [0.378, 0.694] | |
| S | full | thick | 16 | 0.428 | 0.340 | [-1.011, 1.691] |
| S | full | thin | 102 | 0.622 | 0.576 | [0.377, 0.693] |
| Mg | thick | 35 | 0.883 | 0.857 | [0.640, 1.026] | |
| Mg | thin | 139 | 0.817 | 0.734 | [0.607, 0.886] | |
| Mg | full | thick | 40 | 0.895 | 0.849 | [0.633, 1.011] |
| Mg | full | thin | 155 | 0.832 | 0.732 | [0.608, 0.883] |
| Si | thick | 37 | 0.916 | 1.018 | [0.752, 1.219] | |
| Si | thin | 146 | 0.839 | 0.730 | [0.641, 0.822] | |
| Si | full | thick | 40 | 0.919 | 1.003 | [0.748, 1.191] |
| Si | full | thin | 155 | 0.835 | 0.731 | [0.639, 0.823] |
Appendix C Additional analysis on molar ratios
As discussed in Sect. 3.3, the C/O and Mg/Si molar ratios are classical diagnostics of bulk planetary composition. As discussed by Thiabaud et al. (2015), C/O determines whether refractory condensates in the protoplanetary disk are dominated by silicates or whether carbon-rich phases, such as carbides and graphite, can become important, whereas Mg/Si controls the relative proportions of olivine- and pyroxene-type silicates in mantle mineralogy. For completeness, we therefore examined the distributions of C/O and Mg/Si in our P-star sample and compared them with those of the control sample, which traces the local FGK field population.
Figure 11 shows the resulting histograms for both ratios. The C/O distributions of the P-star and control samples are broadly similar, indicating that our P detections are not confined to an extreme tail of the C/O distribution. The Mg/Si distributions differ only modestly, with the P-star sample showing, at most, a mild shift towards higher Mg/Si compared with the control sample. This check confirms that the stars in which P has been measured are not a chemically peculiar subset in terms of the classical C/O–Mg/Si parameter space and that the multi-element co-enrichment patterns discussed in the main text are not driven by a strong selection in these two mineralogy-sensitive ratios.
Figure 12 shows the relation between the molar ratios P/Mg and P/Si for thin- and thick-disk stars, together with the positions of the Sun and Earth’s upper crust. Both disk populations show a very tight correlation between P/Si and P/Mg. Part of this tightness is expected on algebraic grounds because both ratios share P in the numerator and, in logarithmic space, . A simple check confirms that the scatter around the P/Si–P/Mg relation is entirely accounted for by the observed Mg/Si distribution: in both disks, and have virtually identical dispersions and a Spearman rank coefficient of . We therefore interpret Figure 12 as showing that the initial bulk P/Mg and P/Si ratios co-vary coherently with the Mg/Si distribution and with the overall -element enrichment of disk stars. This relation constrains the initial chemical inventory available to rocky planets rather than directly probing planet-scale differentiation or P partitioning between the core, mantle, and crust.
The solar values shown in the figure, marked by a yellow star, lie near the centre of the distribution, indicating that the solar composition is representative in terms of these ratios. Planet-host stars do not show a distinct relation between the two ratios compared with stars without detected planets. Because Earth’s crust is a key near-surface reservoir of bioavailable P (Walton et al. 2023), we compared its ratios with those inferred from stellar abundances. The molar ratios for Earth’s upper crust are P/Mg = 0.049 and P/Si = 0.003, calculated from the abundances reported by Yaroshevsky (2006); these values differ substantially from the stellar distribution. This difference highlights how strongly differentiation processes during planet formation and evolution may affect elemental ratios and planetary composition.


