ComponentBench: Diagnosing Component-Level Failures in Computer-Use Agents
Abstract
Current evaluation of computer-use agents is split between long-horizon workflow benchmarks and atomic GUI-grounding tests. This leaves an under-instrumented middle layer: realistic component-centered interactions (e.g., toggle a button set) that are short enough to diagnose and rich enough to capture the burdens of modern interfaces. We present ComponentBench, a benchmark and diagnostic pipeline for component-level evaluation of computer-use agents on modern web UIs. ComponentBench is organized around a library-agnostic ontology of 97 canonical UI components instantiated as 2,910 programmatically verified tasks across widely used component libraries, paired with cleaned human reference trajectories that enable evaluation of both task success and interaction efficiency. Beyond task collection, we introduce a scalable pipeline for auditing realized structural difficulty after implementation and synthesizing structured failure analyses across tasks and component families. Evaluating seven models—GPT-5.4, Gemini 3 Flash, GPT-5.4 mini, GPT-5 mini, Gemini 3.1 Flash-Lite, Qwen3-VL-235B, and UI-TARS-1.5-7B—across four observation and action spaces, we show that these design choices critically impact performance. Within a single shared harness, changing only the observation and action space shifts task success by more than 30% for the same model: GPT-5 mini falls from 83.1% with accessibility-tree observations to 48.9% with coordinate-only Pixel control. Moreover, even the fastest configuration takes 3.7 as long as the matched human reference, and spatial manipulations that are trivial for humans continue to challenge current agents.
1 Introduction
Computer-use agents are moving from research prototypes toward user-facing systems that act on websites and software through the same interfaces people use. OpenAI’s Operator (OpenAI 2025b) and Computer Use API (OpenAI 2026a), along with Anthropic’s computer-use tool (Anthropic 2026a), make the rendered interface itself—typically screenshots plus mouse and keyboard actions—a first-class control surface. This makes full-visual evaluation increasingly central. As screenshot-native agents become stronger, the key question is no longer simply whether an agent can occasionally complete a browser task, but which rendered UI components still prevent reliable and efficient use in deployment.
Current evaluation paradigms still emphasize two extremes. Long-horizon benchmarks such as WebArena (Zhou et al. 2023), VisualWebArena (Koh et al. 2024), OSWorld (Xie et al. 2024), WebVoyager (He et al. 2024), and Online-Mind2Web (Xue et al. 2025) measure end-to-end competence on realistic tasks, but make failure attribution difficult: when an agent misses a workflow, the root cause may be planning, state tracking, grounding, or one brittle interaction buried inside a larger task. At the other extreme, grounding benchmarks such as ScreenSpot (Cheng et al. 2024) and ScreenSpot-Pro (Li et al. 2025) isolate localization ability, but stop before the short multi-step interactions that modern widgets often require. Efforts between the two—MiniWoB++’s synthetic micro-environments (Liu et al. 2018), Mind2Web’s offline real-site traces (Deng et al. 2023), and the web-action taxonomies, archived GUI subtasks, and appearance variations of WebSuite, WARC-Bench, and OpenApps (Li & Waldo 2024; Srivastava et al. 2025; Ullrich et al. 2025)—remain partial for our purpose: to our knowledge, none are organized around a broad cross-library ontology of modern UI components with programmatic end-state verification, human reference traces, and post-render difficulty auditing.

This missing layer matters because modern web software is composed from recurring component primitives exposed at scale by production UI libraries. A long workflow can therefore fail not because the agent misunderstood the user’s goal, but because it mishandled one date picker, multiselect, splitter, or drag target. Long tasks are only as reliable as the component interactions they contain: under a simple independence approximation, five critical interactions at 80% reliability imply only about a 33% end-to-end ceiling. And pass rate alone is insufficient. Recent work shows that even strong computer-use agents often take far more steps than humans, with major latency and cost implications for real deployment (Abhyankar et al. 2025).
We introduce ComponentBench,11 1 Website: https://componentbench.com; code: https://github.com/TianchenGuan/ComponentBench; data and runs: https://huggingface.co/datasets/TianchenGuan/ComponentBench. a benchmark and diagnostic pipeline for evaluating computer-use agents through component-centered tasks on modern web UIs. ComponentBench organizes evaluation around 97 canonical component types, 14 interaction families, and 24 task templates, instantiated as 2,910 programmatically verified tasks primarily across Ant Design, MUI, and Mantine (thirty markdown-editor tasks use an external implementation; Appendix A.5). Each task is anchored to a single primary component, even when realistic carrier context is required. The benchmark evaluates agents under four observation and action spaces—AX-tree, Set-of-Marks, Pixel, and Browser-Use—and distinguishes intended difficulty from the difficulty the rendered UI actually presents through replay-based audits using human reference traces.
ComponentBench is also designed to evaluate efficiency, not only eventual completion. Because we collect cleaned human reference traces for all tasks, we can ask not just whether a component is solvable, but whether it is solved directly enough to be usable—critical for full-visual agents, where every extra step implies more latency, more token cost, and another opportunity to drift. To support faster stress-testing, we further derive ComponentBench-Core, a distilled 912-task hard-only suite of newly generated tasks that concentrates on the unresolved regions of the full suite.
Our experiments on ComponentBench-Full across seven models and four observation/action spaces reveal four main findings. First, observation/action space can shift pass rates by more than 30% within a single model, and the benefit of Set-of-Marks is model-dependent rather than universal. Second, efficiency remains a major deployment bottleneck: even the fastest configuration takes 3.7 as long as the matched human reference, and the strongest model solves many more tasks eventually than within the human step budget. Third, several spatial manipulation components that humans finish in 1–2 steps—including sliders, drag-and-drop lists, and splitters—remain below 60% mean pass rate across all agents tested. Finally, difficulty is strongly conditioned on visual context, with substantially wider AX-tree–Pixel gaps under clutter and compact spacing. A trace-grounded failure taxonomy (Section 4.4) ties these findings to concrete mechanisms. Together, these results show that component-level evaluation exposes failure modes largely invisible in both long-horizon task scores and single-step grounding benchmarks.
2 Benchmark construction
A worked example.
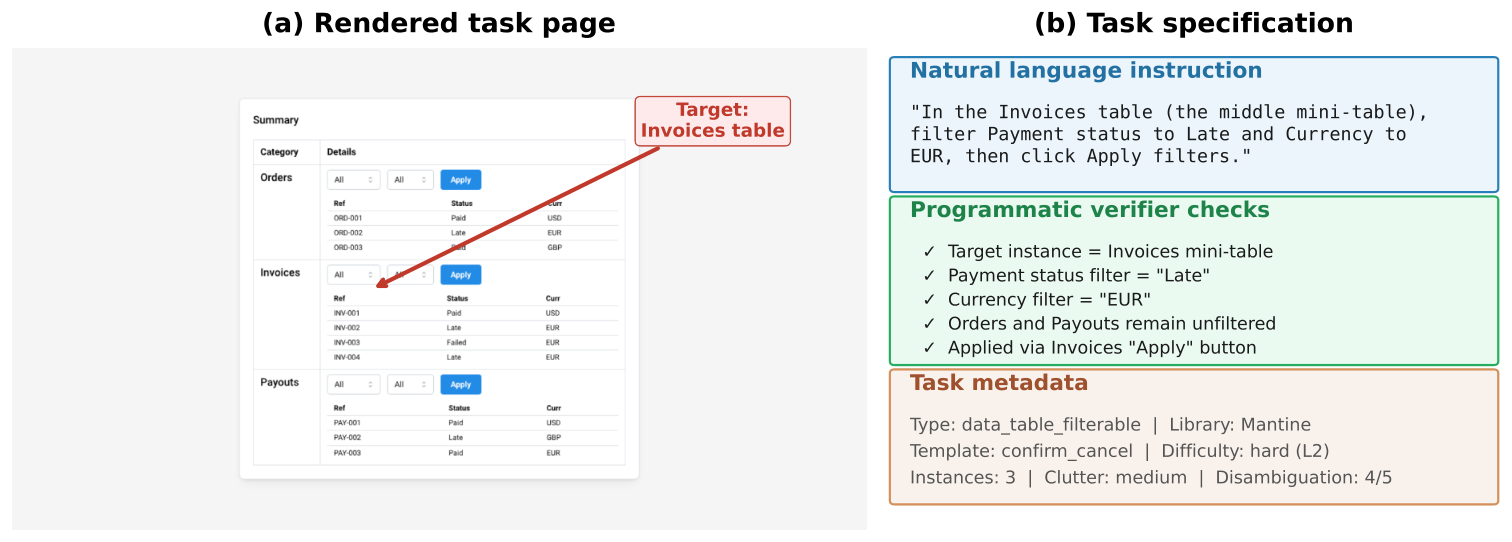
Before introducing the benchmark schema, we start with a concrete task. Figure 2 shows data_table_filterable-mantine-T10. The page contains three visually similar mini-tables labeled Orders, Invoices, and Payouts. The agent must operate only the Invoices instance: set Payment status to Late, set Currency to EUR, and then click the local Apply button. This single example already illustrates several recurring design choices in ComponentBench: each task targets one primary component type; the page may include surrounding carrier context that adds realism without changing what is being tested; nearby instances can create disambiguation burden; and success is defined by a committed end state, not by a draft selection.
2.1 Component inventory and task specification
To cover modern web interaction systematically, we build a structured inventory by combining the WAI-ARIA Authoring Practices Guide (APG), which documents common widget patterns and behaviors, with the production component inventories of major React UI libraries—Ant Design, MUI, Mantine, Fluent UI, Chakra UI, and Headless UI (World Wide Web Consortium 2026; Ant Group 2026; MUI 2026; Mantine 2026; Microsoft 2026a; Chakra UI 2026; Tailwind Labs 2026). The resulting component ontology is a library-agnostic set of 97 canonical component types (e.g., date picker) grouped into 14 families (e.g., Drag/Drop & Workspace). For implementation we select Ant Design, MUI, and Mantine for their comprehensive coverage and stylistic diversity, which also lets cross-library variation serve as a controlled factor in the analysis.
Each task evaluates one primary component type, even when the rendered page contains many other controls: in Figure 2, a filterable data table, with the enclosing summary table and neighboring mini-tables serving as carrier context.
Tasks are specified in YAML. Each specification includes a canonical type, an implementation source, a task template (a reusable action pattern such as open-and-select or drag operation), a scene context (eight controlled factors: theme, spacing, layout, placement, scale, instances, guidance, clutter), an intended difficulty block (seven conceptual axes: precision requirement, target acquisition, density/choice interference, depth/layering, feedback dynamics, semantic observability, disambiguation load), a success trigger, and negative cases. The full suite contains 24 canonical task templates (plus one ad-hoc variant used by a single task) and 2,910 tasks; Appendix A.5 summarizes the realized diversity across all of these dimensions.
2.2 Task generation, implementation, and human verification
ComponentBench was built through a structured, LLM-assisted pipeline. First, GPT-5.2 Pro generated 30 task specifications per canonical type under the shared YAML schema, including task templates, scene factors, intended difficulty labels, success triggers, and negative cases. Second, Claude Code implemented these specifications as real interactive Next.js pages rather than static mockups. Third, each implemented task was executed twice by a human operator, recorded as low-level actions (clicks, drags, keyboard input, scrolls) with timestamps, cleaned—merging consecutive keystrokes and removing accidental resets—and the shorter pass was kept as the reference trajectory.
The human recordings play two roles. During construction, they are the decisive validity check that the task is solvable and faithful to the intended specification; tasks that were broken, miswired, or no longer matched their specification were corrected before inclusion. Later, the same cleaned traces serve as reference trajectories for efficiency analysis and replay-based difficulty auditing (a validation study with two additional annotators appears in Appendix K). Across all 2,910 tasks, the cleaned traces have a mean of 2.7 normalized steps (median 2), with 97.8% of tasks solvable in 10 or fewer steps and a mean completion time of 4.8 seconds.
2.3 Programmatic verification
Every task is paired with a programmatic verifier that checks the committed end state. The benchmark therefore does not ask whether the agent briefly opened the right menu or drafted the right intermediate selection; it asks whether the underlying task predicate is satisfied after the relevant interaction has actually been committed. For some tasks, the live state is sufficient. For others, success requires an explicit local control such as Apply, Save, OK, or Confirm.
For the running example in Figure 2, success requires that the Invoices mini-table—and not the neighboring Orders or Payouts tables—has Payment status = Late and Currency = EUR, and that these selections have been committed via the instance-local Apply button. Each YAML task also enumerates negative cases so that nearby but incorrect states do not count as success.
Concretely, the YAML specifies a canonical success predicate, and the page implementation provides a JavaScript checker that evaluates this predicate against the live component state. At the environment level, termination is intentionally simple and deterministic: success is signaled by revealing a benchmark banner (#cb-success-banner). This gives all observation/action spaces the same termination condition while leaving the checker logic task-specific underneath. Importantly, verifier state is isolated from agent observation. Target values and success predicates reside in React component closures and are never exposed as DOM attributes, accessible-tree labels, or page text; the success banner appears only after the correct state is already reached and therefore cannot be used to shortcut the task. In benchmark mode, a MutationObserver additionally strips all test-only DOM attributes (data-testid, data-cy, etc.) from every element in real time, and a CI-ready scanner verifies that no such attributes survive across all 2,910 pages.
2.4 Observation and action spaces
A core goal of ComponentBench is to evaluate the same underlying task under different observation and action spaces. The benchmark therefore supports four regimes.
AX-tree. The agent receives a screenshot plus accessibility-tree text and acts through element IDs.
Set-of-Marks (SoM). The agent receives a screenshot with numbered overlays on interactable elements and also acts through element IDs.
Pixel. The agent receives only the screenshot and must act through coordinates.
Browser-Use. The same tasks are executed through the separate browser-use framework, which provides screenshot interaction together with a richer tool surface including serialized DOM information and grounded elements (Müller & Zuß 2024). A Browser-Use “step” is a model turn that can execute up to 4 primitive actions, effectively giving it up to 80 actions within the 20-step budget, compared to exactly 1 action per step in the other three modes.
The first three regimes share the same BrowserGym-based harness and differ only in what the agent sees and how it refers to targets (de Chezelles et al. 2024). Browser-Use is therefore not a strictly like-for-like fourth mode but a tool-rich reference regime—a distinction that lets us separate gains from stronger underlying models from gains that come from exposing additional structure and control affordances.
2.5 Intended difficulty and realized difficulty
ComponentBench distinguishes between the difficulty a task is designed to have and the difficulty the rendered page actually presents. Intended difficulty is assigned during task generation: the seven conceptual axes and coarse tier labels record why we expect the task to be easy or hard (for the running example, mainly the disambiguation among similar instances). Because implementation can change difficulty through spacing, overlay structure, or clutter, we also measure realized difficulty by replaying the cleaned human trace in Playwright (Microsoft 2026b) and extracting a 24-feature structural vector—including target size, spacing, overlay depth, option density, and metadata-derived properties such as control continuity and reset cost. The human trace serves as a traversal oracle, reaching hidden states (popovers, nested panels, internal scroll regions) that a static snapshot would miss. Features are aggregated into the same seven axes via weighted averaging with frozen cutpoints. In short, intended difficulty says what we meant to build; realized difficulty says what the implemented task actually is.
2.6 Diagnostic pipeline and Core distillation
Beyond the executable benchmark itself, ComponentBench includes a three-stage diagnostic pipeline that turns tasks, traces, and model runs into reusable evidence: Layer 1 deterministically assembles per-task packets joining the YAML specification, task metadata, realized-difficulty outputs, human reference traces, and selected agent evidence; Layer 2 produces a structured task-level observation for each task; Layer 3 aggregates those records into one component-level report per canonical type. This pipeline is what makes the benchmark diagnostic rather than purely leaderboard-oriented.
The full suite is intentionally coverage-oriented. Once broad evidence exists, we use realized-difficulty audits, Layer 2/3 reports, and scene-factor analyses to distill a sharper pressure test, ComponentBench-Core: 19 generation units, 45 canonical components, and 912 hard-only tasks, preserving the same pipeline while concentrating benchmark mass on unresolved interaction families.
3 Experiments
This section focuses on ComponentBench-Full (v1), the broad coverage suite, because it provides the cleanest setting for comparing models across observation and action regimes. All tasks are run with a maximum budget of 20 agent steps. Our goal is not only to rank models, but to isolate how much of component-level performance comes from the underlying model versus the interface exposed to it.
3.1 Models and regimes
We evaluate seven models on v1 in up to four observation/action spaces. Gemini 3 Flash (Google DeepMind 2025) and Gemini 3.1 Flash-Lite (Google 2026) are Google’s multimodal models at different capability tiers. GPT-5.4 (OpenAI 2026b), GPT-5.4 mini (OpenAI 2026c), and GPT-5 mini (OpenAI 2025a) are OpenAI models spanning full-scale and compact tiers. Qwen3-VL-235B (Bai et al. 2025) is an open-weight vision-language model. UI-TARS-1.5-7B (Qin et al. 2025) is a 7B open-weight model trained for GUI interaction, evaluated through its own native pixel-only harness rather than the shared BrowserGym harness.
The four observation/action spaces are defined in Section 2.4: AX-tree, SoM, and Pixel share the same benchmark harness and differ only in what the agent sees and how it refers to targets, while Browser-Use is the separate tool-rich reference regime (Müller & Zuß 2024). The five Gemini and GPT models and Qwen3-VL-235B are evaluated in all four spaces; UI-TARS-1.5-7B in its native pixel-only mode.
3.2 Main results
| Model | Browser-Use | AX-tree | SoM | Pixel |
|---|---|---|---|---|
| Gemini 3 Flash | 95.2 | 89.6 | 87.1 | 85.4 |
| GPT-5.4 | 90.4 | 81.5 | 77.0 | 83.8 |
| Gemini 3.1 Flash-Lite | 87.4 | 77.7 | 73.5 | 63.3 |
| GPT-5 mini | 87.0 | 83.1 | 78.5 | 48.9 |
| GPT-5.4 mini | 85.8 | 79.1 | 74.7 | 77.1 |
| Qwen3-VL-235B‡ | 78.8 | 77.0 | 54.4 | 50.5 |
| UI-TARS-1.5-7B† | — | — | — | 12.6 |
Table 1 presents the main v1 results. We highlight three observations.
Observation/action space can shift pass rates by over 30% within a single model.
The most dramatic example is GPT-5 mini, which drops from 83.1% in AX-tree to 48.9% in Pixel—a 34.2% swing within the same harness, where only the observation and action space changes (87.0% to 48.9% including the tool-rich Browser-Use regime). Every model evaluated in multiple spaces shows a substantial gap between its best and worst space, confirming that the interface through which an agent encounters a component is not merely a convenience choice but a major determinant of success.
The benefit of structured aids is model-dependent.
For models that are weaker at direct screenshot-based interaction, SoM provides a clear advantage over Pixel: GPT-5 mini gains 29.6% and Gemini 3.1 Flash-Lite gains 10.2%. But for two of the six models evaluated in both SoM and Pixel—GPT-5.4 mini and GPT-5.4—the ordering reverses: Pixel outperforms SoM by 2.4% and 6.8% (paired bootstrap 95% CIs [1.0, 3.9] and [5.3, 8.3]). For GPT-5.4, Pixel (83.8%) also outperforms AX-tree (81.5%). Gemini 3 Flash sits near the crossover, with only a 1.7% SoM advantage. This pattern suggests that structured overlays are not uniformly beneficial: they help weaker models substantially, but for models already strong at direct visual interaction, the added clutter and indirection of SoM can become neutral or slightly harmful.
Both model capability and interface regime have large effects, and the benchmark is far from saturated.
Gemini 3 Flash achieves 85.4% even in Pixel—the most restrictive observation space—exceeding several weaker models’ Browser-Use performance. At the other end, UI-TARS-1.5-7B, a 7B model trained specifically for GUI interaction, achieves 12.6% in its native pixel-only mode, with 87% of tasks hitting the 20-step ceiling.
4 Analysis
4.1 Agents solve most tasks but rarely match human efficiency
| Browser-Use | AX-tree | SoM | Pixel | |||||||||
|---|---|---|---|---|---|---|---|---|---|---|---|---|
| Model | Pass | 2 | Pass | 2 | Pass | 2 | Pass | 2 | ||||
| Gemini 3 Flash | 95.2 | 56.1 | 85.3 | 89.6 | 74.7 | 82.5 | 87.1 | 73.2 | 81.4 | 85.4 | 65.0 | 77.8 |
| GPT-5.4 | 90.4 | 40.6 | 75.3 | 81.5 | 56.5 | 72.4 | 77.0 | 49.6 | 68.2 | 83.8 | 48.1 | 69.5 |
| Gemini 3.1 FL | 87.4 | 50.2 | 77.3 | 77.7 | 68.6 | 73.9 | 73.5 | 64.8 | 70.9 | 63.3 | 47.3 | 56.2 |
| GPT-5 mini | 87.0 | 51.7 | 78.5 | 83.1 | 66.6 | 76.5 | 78.5 | 63.2 | 73.4 | 48.9 | 19.0 | 28.2 |
| GPT-5.4 mini | 85.8 | 51.0 | 77.9 | 79.1 | 69.0 | 73.8 | 74.7 | 64.0 | 70.6 | 77.1 | 60.2 | 68.9 |
| Qwen3-VL-235B | 78.8 | 39.7 | 70.1 | 77.0 | 66.1 | 73.2 | 54.4 | 41.1 | 48.4 | 50.5 | 29.3 | 38.1 |
| UI-TARS† | — | — | — | — | — | — | — | — | — | 12.6 | 9.0 | 10.5 |
Table 2 reports not only whether tasks are solved, but whether they are solved efficiently. The gap between Pass and is the efficiency gap: tasks solvable but requiring more effort than a human. Because a Browser-Use step can bundle up to four primitive actions, its columns are an optimistic turn-level reference rather than a like-for-like action comparison. AX-tree and SoM are the most step-efficient modes (median ratio 1.0). Browser-Use has the largest gap—Gemini 3 Flash reaches 95.2% pass but only 56.1% within human steps—and the gap is most severe for weak model–hard mode combinations: GPT-5 mini Pixel passes 48.9% but only 19.0% within human steps (mean ratio 3.6, p90 = 9.0). Wall-clock time reinforces this: even the fastest configuration (GPT-5.4 mini SoM) takes 3.7 as long as the matched human reference, and the slowest (GPT-5 mini Pixel) takes 21.5 as long, averaging 71.8 seconds per successful task (full time data in the appendix).
4.2 Browser-Use is a tool-rich reference regime with family-dependent trade-offs
Browser-Use provides an aggregate pass-rate advantage (7.8% to 18.2% over the mean of other modes), largest for weaker models, but at the cost of lower step efficiency. Part of this advantage comes from its ability to execute up to 4 actions per model turn (up to 80 actions versus 20 for the other modes). The advantage is not uniform, however: across the six models it is strongly family-dependent, 29.0% on Advanced Editors but 24.0% on Drag/Drop. The Layer 3 diagnostic reports explain why: Browser-Use’s DOM-level action surface cannot replicate genuine spatial drag operations on tasks like Kanban boards; on this family, GPT-5.4 falls from 70% in AX-tree and 63% in Pixel to 55% in Browser-Use. The CUA gap also scales with intended difficulty (7.2% on easy tasks, 18.2% on hard).
4.3 Spatial manipulation components are trivial for humans but hard for agents
| Family | BU | AX | SoM | Pix | Avg |
|---|---|---|---|---|---|
| Drag/Drop & Workspace | 29.7 | 72.1 | 31.8 | 57.4 | 47.7 |
| Continuous Precision | 74.0 | 53.8 | 53.9 | 56.2 | 59.4 |
| Advanced Editors | 83.6 | 67.8 | 49.7 | 46.4 | 61.9 |
| Date & Time | 83.4 | 76.2 | 65.8 | 59.4 | 71.2 |
| Disclosure & Progressive | 80.1 | 76.0 | 64.1 | 68.3 | 72.1 |
| Discrete Choice | 97.2 | 85.7 | 83.3 | 79.0 | 86.3 |
| Overlays & Transient UI | 96.4 | 91.0 | 88.6 | 80.7 | 89.2 |
| Command & Navigation | 97.3 | 96.1 | 89.9 | 83.1 | 91.6 |
Table 3 summarizes family-level pass rates. Families span from Command & Navigation (91.6% average) to Drag/Drop (47.7%), and no single observation/action space is universally best: Drag/Drop favors Pixel over Browser-Use, while Advanced Editors strongly favor Browser-Use. The full per-model heatmap is in the appendix (Figure 3).
The Layer 3 diagnostic reports reveal distinct mechanistic patterns behind these family-level differences: on editable data grids agents identify the correct row yet fail to enter the widget’s editor mode or commit through its expected control (an interaction knowledge failure rather than a grounding failure); on rich text editors they find the toolbar but cannot establish and hold transient contenteditable selections; on context menus the difficulty is not locating the target but controlling the transient overlay after the right-click. Section 4.4 quantifies these mechanisms across all failed traces.
A striking difficulty inversion emerges when comparing human and agent difficulty: nine canonical types require 2 human steps yet achieve 60% agent pass rate—resizable_columns (24.4%), window_splitter (38.3%), slider_range (39.9%), and six other spatial manipulation tasks (see Figure 4 in the appendix and Table 13). These are trivial mouse gestures for humans but among the hardest interactions for agents. The Layer 3 report for window splitters explains that the difficulty is “compressing perception, motor control, and verification into one thin affordance”: every task has maximal precision requirement, but outcomes depend on whether the separator is even exposed as a real control in the agent’s observation space. No component type shows the reverse pattern (hard for humans, easy for agents).
4.4 A trace-grounded failure taxonomy
To move from family-level pass rates to failure mechanisms, we assign every failed trace a primary diagnostic category supported by trace evidence, using two complementary labelings (Table 4): a deterministic trace-feature taxonomy over all 8,864 failed Pixel/SoM/AX-tree traces across the five models with complete BrowserGym trace logs (each trace is parsed into its action sequence and mapped from a component-driven prior refined by trace evidence), and the Layer-2 diagnostic labels (an LLM reading of all 2,752 failed runs of one model) mapped onto the same categories. Methodological details and adversarially reviewed case studies appear in Appendix J.
| Failure category | Deterministic | Layer-2 |
|---|---|---|
| (5 models, =8,864) | (1 model, =2,752) | |
| Continuous calibration error | 20.2% | — |
| Transient state loss | 19.9% | 15.0% |
| Missing commit or confirmation | 11.6% | 20.0% |
| Target acquisition / wrong instance | 11.2% | 31.6% |
| Repetition / no-progress loop | 11.2% | 5.6% |
| Widget-specific procedure missing | 9.6% | 24.1% |
| Drag execution failure | 4.3% | — |
| Semantic value error | 3.6% | 3.3% |
| Other / unclear | 8.4% | 0.3% |
The two labelings surface overlapping high-frequency mechanism families, though their percentages are not directly comparable: continuous calibration errors (the agent engages the right slider or meter but cannot map pointer movement to the required value, overshooting and undershooting until timeout), transient state loss (an opened popover, editor mode, or selection is lost before commit), target acquisition / wrong-instance errors, missing commit actions, and missing widget-specific procedures. Two cross-cutting observations sharpen the earlier findings. First, slider and meter failures are usually not instruction-understanding failures: agents locate the correct control but cannot calibrate the continuous value, which explains why these tasks are trivial for humans (one drag) yet resistant to added reasoning. Second, a no-progress loop is a symptom rather than a root cause: 55.8% of failed traces end in a repeated-action loop, but it is distributed across every mechanism (48–67% within each category)—agents loop because they are stuck on the underlying mechanism.
4.5 Clutter and spacing disproportionately burden visual agents
Scene factors create differential burdens across observation/action spaces (Figure 5, Appendix). Averaged across models, medium clutter drops Pixel by 14.3% but AX-tree by only 0.2%; compact spacing drops Pixel by 13.6% but AX-tree by 4.5%. The failure taxonomy shows this is mechanistic: clutter manifests as target-acquisition and wrong-instance failures, stressing visual grounding rather than task semantics—which is why Browser-Use, acting on DOM elements, is essentially clutter-immune (medium clutter costs it 0.8%). The interaction between model capability and scene factors is especially clear for GPT-5.4: at clutter=none, GPT-5.4 Pixel (86.1%) outperforms AX-tree (81.6%) by 4.5%, but at clutter=medium the gap reverses and AX-tree (82.3%) leads Pixel (72.6%) by 9.7%—the preferred observation space flips on a single scene factor.
The intended difficulty axes also validate empirically: precision requirement is the most predictive axis ( with failure rate), and the prediction is mode-dependent ( for Pixel vs. for Browser-Use on depth/layering). Difficulty tiers decline monotonically: L0 = 87.3%, L3 = 65.2%, with the AX-tree–Pixel gap widening from 4.6% (L0) to 21.9% (L3). Across all models, a task-level asymmetry also emerges: 123 tasks pass reliably in AX-tree (mean pass rate 0.7) while failing in Pixel (mean 0.3), whereas only 52 show the reverse—the asymmetry between structured and visual observation is large and directional.
4.6 ComponentBench-Core as a pressure test
ComponentBench-Core is derived from the full suite using the evidence described in Section 2.6: realized-difficulty audits, Layer 2/3 diagnostic reports, and scene-factor interactions merge overlapping canonical types into 19 interaction-centered generation units, each contributing 48 regenerated hard-only tasks (912 total). Core is not a subset of Full: its tasks are newly generated, dropping saturated easy families and concentrating benchmark mass on the interaction patterns that still separate current agents.
| Model | Mode | Pass | |||
|---|---|---|---|---|---|
| Gemini 3 Flash | Browser-Use | 84.5 | 51.5 | 71.5 | 78.5 |
| Gemini 3 Flash | Pixel | 60.9 | 30.5 | 51.0 | 56.0 |
| GPT-5.4 mini | Browser-Use | 57.8 | 36.8 | 51.2 | 55.3 |
| GPT-5.4 mini | Pixel | 37.7 | 22.0 | 32.1 | 34.1 |
| Opus 4.6 | Pixel | 65.4 | 34.1 | 53.8 | 59.4 |
Table 5 presents the results on Core. Pass rates drop substantially relative to Full: Gemini 3 Flash Browser-Use falls from 95.2% to 84.5% (10.7%), Gemini 3 Flash Pixel from 85.4% to 60.9% (24.5%), GPT-5.4 mini Browser-Use from 85.8% to 57.8% (28.0%), and GPT-5.4 mini Pixel from 77.1% to 37.7% (39.4%). The drop is largest for the weakest combination: Core disproportionately stresses the modes and models already borderline on Full.
To test whether Core remains diagnostic for frontier models not evaluated on Full, we additionally run Opus 4.6 (Anthropic 2026b) on Core Pixel. It achieves 65.4%—the highest pixel-only result on the hard suite, surpassing Gemini 3 Flash Pixel (60.9%)—but still leaves over a third of tasks unsolved, with only 34.1% solved within the human step budget and a 9.5 time-to-human ratio (67.4 vs. 7.1 mean seconds per successful task). Core is therefore not an artifact of weaker models: it stays challenging even for a frontier computer-use model. Human traces for Core average 5.2 normalized steps versus 2.7 for Full, reflecting the Core tasks’ structural complexity. Where Full suits broad exploration, Core is a compact stress test for the hardest families.
5 Limitations and scope
ComponentBench targets recurring component families from WAI-ARIA patterns and three major production libraries, not every bespoke widget in the wild; CAPTCHA-like tasks are excluded. The benchmark is web-first (Next.js on Chromium), though the ontology is designed to port to desktop and mobile. It measures component-level competence, not long-horizon planning; validating how component-level scores predict end-to-end workflow success is future work.
The realized-difficulty audit is a hybrid system: some quantities are measured from the rendered DOM, others approximated from type-level metadata. The primary human reference traces come from two passes by a single annotator—a practical reference, not a proof of near-optimality; a validation study with two additional annotators (Appendix K) shows inter-annotator variation (1.05 per-task) is small relative to the agent–human gap (1.27–3.02), though agents with tree- or DOM-level tools may admit shorter non-visual paths. Both should be treated as structured operationalizations, not oracles.
Our experiments cover seven models on the full suite and one additional frontier model (Opus 4.6) on Core—a broad but not exhaustive snapshot. The main tables report a single run per model–mode combination; in a repeated-run study on a 278-task subset (Appendix L) the observed run-to-run deviation was at most 1.4% with no ordering changes, though task-level outcomes churn on borderline tasks.
Because task specifications were generated with GPT-5.2 Pro and pages implemented with Claude Code, the benchmark may contain generator-specific regularities. Three design choices mitigate this risk: every task is scored by a deterministic programmatic verifier rather than LLM judgment, the generation prompt enforces combinatorial diversity over a fixed ontology (Appendix A.5), and the human recording passes (including the annotators of Appendix K) served as quality checks that surfaced no broken, ambiguous, or miswired tasks. We do not, however, audit exhaustively for contamination.
Additionally, GPT models were accessed via the chat completions API rather than OpenAI’s Operator or Computer Use API, Opus 4.6 through a custom harness rather than Anthropic’s full computer-use environment, and BrowserGym renders no visible cursor—so our results may underestimate native-interface performance.
6 Conclusion
We presented ComponentBench, a component-level benchmark for diagnosing where computer-use agents fail on modern web UIs. Across 97 canonical component types, 2,910 tasks, and four observation regimes, representation, efficiency, and visual context all critically shape agent performance, and a trace-grounded failure taxonomy ties these effects to concrete mechanisms—helping localize the component-level causes of workflow failures.
Acknowledgments
Model API access for the experiments in this paper was provided by the Amazon AGI SF Lab. Experiments were run on the Duke Computer Science cluster. We thank Jiacheng Sang and Xunjian Yin for contributing human reference annotations and for helpful advice.
References
- Abhyankar et al. (2025) Reyna Abhyankar, Qi Qi, and Yiying Zhang. OSWorld-Human: Benchmarking the efficiency of computer-use agents, 2025. URL https://arxiv.org/abs/2506.16042.
- Ant Group (2026) Ant Group. Ant design components overview. https://ant.design/components/overview/, 2026. Accessed 2026-03-25.
- Anthropic (2026a) Anthropic. Computer use tool — Claude API documentation. https://docs.anthropic.com/en/docs/agents-and-tools/computer-use, 2026a. Accessed 2026-03-25.
- Anthropic (2026b) Anthropic. Introducing Claude Opus 4.6. https://www.anthropic.com/news/claude-opus-4-6, 2026b. Accessed 2026-07-24.
- Anthropic (2026c) Anthropic. Introducing Claude Opus 4.8. https://www.anthropic.com/news/claude-opus-4-8, 2026c. Accessed 2026-07-24.
- Bai et al. (2025) Shuai Bai et al. Qwen3-VL technical report, 2025. URL https://arxiv.org/abs/2511.21631.
- Chakra UI (2026) Chakra UI. Chakra UI components. https://www.chakra-ui.com/docs/components/concepts/overview, 2026. Accessed 2026-07-11.
- Cheng et al. (2024) Kanzhi Cheng, Qiushi Sun, Yougang Chu, Fangzhi Xu, Yantao Li, Jianbing Zhang, and Zhiyong Wu. Seeclick: Harnessing gui grounding for advanced visual gui agents. In Proceedings of the 62nd Annual Meeting of the Association for Computational Linguistics, 2024. URL https://arxiv.org/abs/2401.10935.
- de Chezelles et al. (2024) Thibault Le Sellier de Chezelles, Maxime Gasse, Alexandre Drouin, Massimo Caccia, Léo Boisvert, Megh Thakkar, Tom Marty, Rim Assouel, Sahar Omidi Shayegan, Lawrence Keunho Jang, Xing Han Lù, Ori Yoran, Dehan Kong, Frank F. Xu, Siva Reddy, Quentin Cappart, Graham Neubig, Ruslan Salakhutdinov, Nicolas Chapados, and Alexandre Lacoste. The browsergym ecosystem for web agent research, 2024. URL https://arxiv.org/abs/2412.05467.
- Deng et al. (2023) Xiang Deng, Yu Gu, Boyuan Zheng, Shijie Chen, Samuel Stevens, Boshi Wang, Huan Sun, and Yu Su. Mind2web: Towards a generalist agent for the web, 2023. URL https://arxiv.org/abs/2306.06070.
- Fitts (1954) Paul M. Fitts. The information capacity of the human motor system in controlling the amplitude of movement. Journal of Experimental Psychology, 47(6):381–391, 1954. doi: 10.1037/h0055392.
- Google (2026) Google. Gemini 3.1 Flash-Lite: Built for intelligence at scale. https://blog.google/innovation-and-ai/models-and-research/gemini-models/gemini-3-1-flash-lite/, 2026. Accessed 2026-07-24.
- Google DeepMind (2025) Google DeepMind. Gemini 3 flash model card. https://storage.googleapis.com/deepmind-media/Model-Cards/Gemini-3-Flash-Model-Card.pdf, 2025. Accessed 2026-03-30.
- He et al. (2024) Hongliang He, Wenlin Yao, Kaixin Ma, Wenhao Yu, Yong Dai, Hongming Zhang, Zhenzhong Lan, and Dong Yu. Webvoyager: Building an end-to-end web agent with large multimodal models, 2024. URL https://arxiv.org/abs/2401.13919.
- Koh et al. (2024) Jing Yu Koh, Robert Lo, Lawrence Jang, Vikram Duvvur, Ming Chong Lim, Po-Yu Huang, Graham Neubig, Shuyan Zhou, Ruslan Salakhutdinov, and Daniel Fried. Visualwebarena: Evaluating multimodal agents on realistic visual web tasks, 2024. URL https://arxiv.org/abs/2401.13649.
- Li & Waldo (2024) Eric Li and Jim Waldo. Websuite: Systematically evaluating why web agents fail, 2024. URL https://arxiv.org/abs/2406.01623.
- Li et al. (2025) Kaixin Li, Ziyang Meng, Hongzhan Lin, Ziyang Luo, Yuchen Tian, Jing Ma, Zhiyong Huang, and Tat-Seng Chua. ScreenSpot-Pro: Gui grounding for professional high-resolution computer use, 2025. URL https://arxiv.org/abs/2504.07981.
- Liu et al. (2018) Evan Zheran Liu, Kelvin Guu, Panupong Pasupat, Tianlin Shi, and Percy Liang. Reinforcement learning on web interfaces using workflow-guided exploration. In International Conference on Learning Representations, 2018. URL https://arxiv.org/abs/1802.08802.
- Mantine (2026) Mantine. Mantine core components. https://mantine.dev/core/package/, 2026. Accessed 2026-03-25.
- Microsoft (2026a) Microsoft. Fluent UI React components. https://react.fluentui.dev/, 2026a. Accessed 2026-03-25.
- Microsoft (2026b) Microsoft. Evaluating javascript — playwright documentation. https://playwright.dev/docs/evaluating, 2026b. Accessed 2026-03-25.
- MUI (2026) MUI. Mui components documentation. https://mui.com/components/, 2026. Accessed 2026-03-25.
- Müller & Zuß (2024) Magnus Müller and Gregor Zuß. Browser-use: Make websites accessible for AI agents. https://github.com/browser-use/browser-use, 2024. MIT License, v0.12.
- OpenAI (2025a) OpenAI. OpenAI GPT-5 system card, 2025a. URL https://arxiv.org/abs/2601.03267.
- OpenAI (2025b) OpenAI. Introducing operator. https://openai.com/index/introducing-operator/, 2025b. Accessed 2026-03-25.
- OpenAI (2026a) OpenAI. Computer use — OpenAI API documentation. https://platform.openai.com/docs/guides/tools-computer-use, 2026a. Accessed 2026-07-11.
- OpenAI (2026b) OpenAI. Introducing GPT-5.4. https://openai.com/index/introducing-gpt-5-4/, 2026b. Accessed 2026-03-30.
- OpenAI (2026c) OpenAI. Introducing GPT-5.4 mini and nano. https://openai.com/index/introducing-gpt-5-4-mini-and-nano/, 2026c. Accessed 2026-07-24.
- Qin et al. (2025) Yujia Qin, Yining Ye, Junjie Fang, Haoming Wang, Shihao Liang, Shizuo Tian, Junda Zhang, Jiahao Li, Yunxin Li, Shijue Huang, Wanjun Zhong, Kuanye Li, et al. UI-TARS: Pioneering automated GUI interaction with native agents, 2025. URL https://arxiv.org/abs/2501.12326.
- Srivastava et al. (2025) Sanjari Srivastava, Gang Li, Cheng Chang, Rishu Garg, Manpreet Kaur, Charlene Y. Lee, Yuezhang Li, Yining Mao, Ignacio Cases, Yanan Xie, and Peng Qi. Warc-bench: Web archive based benchmark for gui subtask executions, 2025. URL https://arxiv.org/abs/2510.09872.
- Tailwind Labs (2026) Tailwind Labs. Headless UI components. https://headlessui.com/, 2026. Accessed 2026-03-25.
- Ullrich et al. (2025) Karen Ullrich, Jingtong Su, Claudia Shi, Arjun Subramonian, Amir Bar, Ivan Evtimov, Nikolaos Tsilivis, Randall Balestriero, Julia Kempe, and Mark Ibrahim. OpenApps: Simulating environment variations to measure UI-agent reliability, 2025. URL https://arxiv.org/abs/2511.20766.
- World Wide Web Consortium (2026) World Wide Web Consortium. Aria authoring practices guide (apg). https://www.w3.org/WAI/ARIA/apg/, 2026. Accessed 2026-03-25.
- Xie et al. (2024) Tianbao Xie, Danyang Zhang, Jixuan Chen, Xiaochuan Li, Siheng Zhao, Ruisheng Cao, Toh Jing Hua, Zhoujun Cheng, Dongchan Shin, Fangyu Lei, Yitao Liu, Yiheng Xu, Shuyan Zhou, Silvio Savarese, Caiming Xiong, Victor Zhong, and Tao Yu. Osworld: Benchmarking multimodal agents for open-ended tasks in real computer environments, 2024. URL https://arxiv.org/abs/2404.07972.
- Xue et al. (2025) Tianci Xue, Weijian Qi, Tianneng Shi, Chan Hee Song, Boyu Gou, Dawn Song, Huan Sun, and Yu Su. An illusion of progress? assessing the current state of web agents, 2025. URL https://arxiv.org/abs/2504.01382.
- Zhou et al. (2023) Shuyan Zhou, Frank F. Xu, Hao Zhu, Xuhui Zhou, Robert Lo, Abishek Sridhar, Xianyi Cheng, Tianyue Ou, Yonatan Bisk, Daniel Fried, Uri Alon, and Graham Neubig. Webarena: A realistic web environment for building autonomous agents, 2023. URL https://arxiv.org/abs/2307.13854.
Appendix A Benchmark construction details
A.1 Task specification schema
Each task is specified in YAML with the following fields: id, canonical_type, implementation_source (antd/mui/mantine/external), task_template, browsergym_goal (natural-language instruction), scene_context (8 controlled factors), difficulty (bucket, tier, and 7 axis ratings with justification), success_trigger (human-readable criteria and canonical predicate), negative_cases, and expected_interaction_path. Scene factors and their realized levels are: theme (light/dark), spacing (comfortable/compact), layout (8 levels; isolated_card, form_section, dashboard, settings_panel, …), placement (center plus four off-center corners), scale (default/small/large), instances (1–10), guidance (text/visual/mixed), and clutter (none/low/medium/high). Table 6 reports the realized distribution over these levels.
A.2 LLM-assisted construction pipeline
GPT-5.2 Pro generated 30 task specifications per canonical type, including templates, intended difficulty labels, scene factors, success triggers, and negative cases. Claude Code then implemented those specifications as real interactive Next.js pages. Each task was subsequently executed by a human and recorded as a reference trajectory. This recording stage also served as the final quality-control pass: tasks that were broken, miswired, or did not match their intended specification after implementation were corrected before inclusion.
A.3 Task generation prompt
For each canonical component type, GPT-5.2 Pro received a structured prompt together with a research CSV file mapping the component to its available library implementations, supported interaction patterns, and difficulty considerations. The prompt specified the following constraints:
Single-component focus and realistic intents.
Each task must target exactly one primary component whose state determines success. Instructions must read as plausible micro-user intents (e.g., “Set the Price range slider to $20–$80”), not benchmark jargon. Internal tolerances, checker rules, and implementation details are excluded from the agent-facing instruction.
Structured output schema.
Each task specification includes: a stable ID, the canonical type, implementation source and variant, a primary task template (from the 24 defined templates), the complete scene context (all 8 factors), difficulty ratings (bucket, tier, and all 7 axis ratings with justification), a detailed setup description of the rendered page, an explicit success trigger with both human-readable conditions and a machine-friendly canonical predicate (including predicate type, target state, tolerance, confirmation requirements, and correct-instance requirements), a list of negative cases, and an expected interaction path for debugging.
Coverage and balance constraints.
The prompt requires exactly 30 tasks per component type, with a fixed difficulty distribution of 10 easy, 10 medium, and 10 hard tasks. When a component is supported by all three primary libraries, tasks are split 10/10/10 across Ant Design, MUI, and Mantine with balanced per-library difficulty. The prompt also enforces minimum coverage of scene-factor variations: at least 3 tasks with dark theme, at least 3 with compact spacing, at least 4 with clutter, at least 4 with multiple instances (if meaningful for the component), and at least 7 distinct task templates per component type.
Difficulty calibration.
The prompt defines a “default-first” principle: easy tasks use library defaults and simple contexts, while hardness comes from realistic variations—scene factors (compact spacing, clutter, multiple instances), component feature variants (toggling sub-controls, enabling search, restricting input), and within-component depth (nested overlays, multi-step navigation). Adversarial tricks such as invisible elements or overlapping click traps are explicitly prohibited.
A.4 Programmatic verification details
At the environment level, task termination is deterministic: the page’s programmatic verifier checks whether the committed end state satisfies the task-specific predicate, and success is signaled by presenting a DOM element (#cb-success-banner). For tasks requiring explicit commit actions (Apply, Save, Confirm), the verifier checks only the post-commit state. The YAML enumerates negative cases so that nearby but incorrect states do not count as success.
A.5 Task diversity summary
Because the tasks are authored with LLM assistance, a natural concern is that they could collapse onto a few repeated patterns. The generation pipeline explicitly enforces combinatorial coverage (Appendix A.3); Table 6 summarizes the realized distribution of the 2,910 Full tasks over libraries, templates, difficulty, and scene factors. All 97 canonical types contribute exactly 30 tasks; all 24 templates and all levels of every scene factor are exercised, with deliberately skewed marginals (e.g., most tasks use the default clean context, while 40% carry at least one added burden such as clutter, compact spacing, dark theme, or multiple instances).
| Dimension | Levels (count) | Coverage |
| Canonical type | 97 types 30 tasks | 100% |
| Family | 14 families (120–300 tasks each) | 100% |
| Library | antd 1,000 / mui 910 / mantine 970 / external 30 | 4 |
| Task template | 24 templates; most-used match_reference (351), | 24/24 |
| least-used file_manage (10) | ||
| Difficulty bucket | easy 972 / mid 985 / hard 953 | 3/3 |
| Difficulty tier | L0 789 / L1 1,050 / L2 818 / L3 253 | 4/4 |
| Theme | light 2,600 / dark 310 | 2/2 |
| Spacing | comfortable 2,595 / compact 315 | 2/2 |
| Scale | default 2,634 / small 272 / large 4 | 3/3 |
| Clutter | none 1,751 / low 666 / medium 339 / high 154 | 4/4 |
| Instances | 1: 2,266 / 2: 398 / 3: 206 / 4: 40 | full |
| Layout | 8 layouts; isolated_card 1,866, form_section 244, | 8/8 |
| dashboard 210, settings_panel 207, others 383 | ||
| Placement | center 2,456 / off-center (4 corners) 454 | 5/5 |
| Guidance | text 2,476 / visual 250 / mixed 184 | 3/3 |
Appendix B Realized difficulty details
B.1 Replay-based measurement
The realized audit replays a cleaned human trajectory in Playwright (Microsoft 2026b), using page.evaluate() to run measurement logic inside the browser page. Features are extracted before and after each action, capturing both the initial state and states revealed through interaction (popovers, nested panels, internal scroll regions). The audit covers all 2,910 Full tasks and all 912 Core tasks.
B.2 Feature list
The 24 canonical features are:
- 1.
Minimum target size (px)
- 2.
Target spacing (px)
- 3.
Fitts-style acquisition difficulty (Fitts 1954)
- 4.
Interactable element density
- 5.
Option/choice count
- 6.
Overlay depth
- 7.
Reference step burden
- 8.
Scroll requirement (boolean + depth)
- 9.
Feedback persistence
- 10.
Reset cost
- 11.
Visible state fraction
- 12.
ARIA richness score
- 13.
Contrast ratio
- 14.
Clutter level
- 15.
Placement offset
- 16.
Instance count
- 17.
Control continuity (metadata-derived)
- 18.
State dimensionality (metadata-derived)
- 19.
Approximate granularity (metadata-derived)
- 20.
Tolerance (metadata-derived)
- 21.
Feedback modality (metadata-derived)
- 22.
Confirmation requirement (metadata-derived)
- 23.
Scroll region depth (metadata-derived)
- 24.
Precision surface type (metadata-derived)
Features 1–16 are measured from the rendered DOM and layout; features 17–24 are derived from type-level metadata.
B.3 Axis aggregation
The seven realized axes are computed by weighted averaging of normalized features:
| (1) |
where is the min-max normalized feature value and the current implementation uses unit weights (). Continuous scores are discretized with frozen, versioned cutpoints into 1–5 ratings.
Appendix C Full step efficiency table
| Model | Mode | Pass | ||||
|---|---|---|---|---|---|---|
| Gemini 3 Flash | Browser-Use | 95.2 | 56.1 | 85.3 | 89.1 | 91.9 |
| AX-tree | 89.6 | 74.7 | 82.5 | 84.7 | 87.4 | |
| SoM | 87.1 | 73.2 | 81.4 | 83.6 | 85.2 | |
| Pixel | 85.4 | 65.0 | 77.8 | 80.9 | 83.6 | |
| GPT-5.4 | Browser-Use | 90.4 | 40.6 | 75.3 | 82.9 | 86.8 |
| AX-tree | 81.5 | 56.5 | 72.4 | 76.3 | 79.4 | |
| SoM | 77.0 | 49.6 | 68.2 | 72.9 | 75.5 | |
| Pixel | 83.8 | 48.1 | 69.5 | 75.7 | 80.0 | |
| Gemini 3.1 Flash-Lite | Browser-Use | 87.4 | 50.2 | 77.3 | 81.1 | 83.8 |
| AX-tree | 77.7 | 68.6 | 73.9 | 75.3 | 76.5 | |
| SoM | 73.5 | 64.8 | 70.9 | 72.2 | 72.8 | |
| Pixel | 63.3 | 47.3 | 56.2 | 59.0 | 61.0 | |
| GPT-5 mini | Browser-Use | 87.0 | 51.7 | 78.5 | 82.1 | 84.8 |
| AX-tree | 83.1 | 66.6 | 76.5 | 78.8 | 80.6 | |
| SoM | 78.5 | 63.2 | 73.4 | 75.9 | 77.3 | |
| Pixel | 48.9 | 19.0 | 28.2 | 32.7 | 38.7 | |
| GPT-5.4 mini | Browser-Use | 85.8 | 51.0 | 77.9 | 81.6 | 83.7 |
| AX-tree | 79.1 | 69.0 | 73.8 | 75.4 | 76.9 | |
| SoM | 74.7 | 64.0 | 70.6 | 72.2 | 73.5 | |
| Pixel | 77.1 | 60.2 | 68.9 | 72.1 | 74.9 | |
| Qwen3-VL-235B | Browser-Use | 78.8 | 39.7 | 70.1 | 74.2 | 77.0 |
| AX-tree | 77.0 | 66.1 | 73.2 | 74.8 | 75.7 | |
| SoM | 54.4 | 41.1 | 48.4 | 51.3 | 53.0 | |
| Pixel | 50.5 | 29.3 | 38.1 | 42.3 | 46.3 | |
| UI-TARS-1.5-7B† | Pixel | 12.6 | 9.0 | 10.5 | 11.2 | 11.9 |
Appendix D Full time efficiency table
| Model | Mode | Human | Agent | Ratio | Med. Agent |
|---|---|---|---|---|---|
| Gemini 3 Flash | AX-tree | 4.5s | 21.5s | 4.7 | 13.5s |
| SoM | 4.6s | 22.0s | 4.8 | 14.4s | |
| Pixel | 4.3s | 27.6s | 6.4 | 17.1s | |
| Browser-Use | 4.6s | 32.6s | 7.1 | 21.2s | |
| Gemini 3.1 Flash-Lite | AX-tree | 4.1s | 14.5s | 3.6 | 11.2s |
| SoM | 3.8s | 14.4s | 3.8 | 11.6s | |
| Pixel | 3.1s | 15.8s | 5.1 | 11.8s | |
| Browser-Use | 4.5s | 23.1s | 5.1 | 17.7s | |
| GPT-5.4 | AX-tree | 4.0s | 31.9s | 7.9 | 19.2s |
| SoM | 3.7s | 35.0s | 9.4 | 22.3s | |
| Pixel | 4.2s | 23.0s | 5.5 | 14.2s | |
| Browser-Use | 4.6s | 36.2s | 7.8 | 24.3s | |
| GPT-5 mini | AX-tree | 4.5s | 32.1s | 7.2 | 18.9s |
| SoM | 4.3s | 32.7s | 7.7 | 19.9s | |
| Pixel | 3.3s | 71.8s | 21.5 | 41.4s | |
| Browser-Use | 4.6s | 36.3s | 8.0 | 24.2s | |
| GPT-5.4 mini | AX-tree | 3.9s | 14.7s | 3.8 | 11.4s |
| SoM | 3.9s | 14.2s | 3.7 | 11.4s | |
| Pixel | 3.6s | 14.2s | 3.9 | 10.7s | |
| Browser-Use | 4.2s | 17.6s | 4.2 | 13.7s | |
| Qwen3-VL-235B | AX-tree | 3.9s | 21.6s | 5.6 | 13.8s |
| SoM | 3.4s | 24.4s | 7.1 | 14.4s | |
| Pixel | 2.9s | 26.8s | 9.3 | 16.0s | |
| Browser-Use | 4.1s | 45.0s | 10.9 | 28.1s | |
| UI-TARS-1.5-7B | Native Pixel | 2.4s | 15.5s | 6.5 | 10.1s |
Appendix E Representation trade-off tables
| Model | SoM | Pixel | (SoMPixel) |
|---|---|---|---|
| GPT-5 mini | 78.5 | 48.9 | 29.6 |
| Gemini 3.1 Flash-Lite | 73.5 | 63.3 | 10.2 |
| Qwen3-VL-235B | 54.4 | 50.5 | 3.9 |
| Gemini 3 Flash | 87.1 | 85.4 | 1.7 |
| GPT-5.4 mini | 74.7 | 77.1 | 2.4 |
| GPT-5.4 | 77.0 | 83.8 | 6.8 |
| Model | Browser-Use | Mean(AX,SoM,Pix) | |
|---|---|---|---|
| Qwen3-VL-235B | 78.8 | 60.6 | 18.2 |
| GPT-5 mini | 87.0 | 70.2 | 16.8 |
| Gemini 3.1 Flash-Lite | 87.4 | 71.5 | 15.9 |
| GPT-5.4 | 90.4 | 80.8 | 9.6 |
| GPT-5.4 mini | 85.8 | 77.0 | 8.8 |
| Gemini 3 Flash | 95.2 | 87.4 | 7.8 |
Appendix F Additional analysis figures
Figures 3–10 provide the full per-model family heatmap, difficulty-inversion scatter, scene-factor effects, and per-template, efficiency, and step-curve breakdowns referenced in the main text.

Appendix G Difficulty axis validation
| Difficulty axis | Overall | AX-tree | Pixel | Browser-Use |
|---|---|---|---|---|
| Precision requirement | 0.44 | 0.30 | 0.41 | 0.33 |
| Target acquisition | 0.31 | 0.17 | 0.36 | 0.19 |
| Density / choice interf. | 0.23 | 0.10 | 0.31 | 0.12 |
| Feedback dynamics | 0.23 | 0.12 | 0.29 | 0.13 |
| Depth / layering | 0.20 | 0.11 | 0.29 | 0.05 |
| Semantic observability | 0.13 | 0.08 | 0.17 | 0.05 |
| Disambiguation load | 0.09 | 0.04 | 0.15 | 0.02 |
| Tier | AX-tree | SoM | Pixel | Browser-Use |
|---|---|---|---|---|
| L0 (easy) | 87.7% | 85.9% | 83.0% | 92.8% |
| L1 (medium) | 82.0% | 75.1% | 69.8% | 87.6% |
| L2 (hard) | 77.4% | 66.4% | 57.6% | 84.3% |
| L3 (hard+) | 71.4% | 59.4% | 49.5% | 80.4% |
Appendix H Ontology: 97 canonical component types
The 14 families and their canonical types (with component count per family):
- Command & Navigation (10):
-
button, icon_button, link, menu_button, split_button, toolbar, breadcrumb, pagination, stepper, tabs
- Disclosure & Progressive (5):
-
accordion, collapsible_disclosure, carousel, feed_infinite_scroll, window_splitter
- Text Entry & Structured Field Input (10):
-
text_input, textarea, password_input, number_input_spinbutton, masked_input, pin_input_otp, tags_input, mentions_input, search_input, inline_editable_text
- Discrete Choice (9):
-
checkbox, checkbox_group, checkbox_tristate, radio_group, switch, toggle_button, toggle_button_group_multi, segmented_control, rating
- List-based Selection (Flat) (7):
-
select_native, select_custom_single, select_custom_multi, select_with_search, listbox_single, listbox_multi, transfer_list
- Combobox & Autocomplete (4):
-
combobox_editable_single, combobox_editable_multi, autocomplete_freeform, autocomplete_restricted
- Hierarchical Selection & Navigation (7):
-
menu, menubar, context_menu, tree_view, tree_select, tree_grid, cascader
- Continuous & High-Precision Input (8):
-
slider_single, slider_range, alpha_slider, meter, progress_bar, color_picker_2d, color_swatch_picker, color_text_input
- Date & Time (8):
-
date_picker_single, date_picker_range, datetime_picker_single, datetime_picker_range, time_picker, calendar_embedded, date_input_text, time_input_text
- Overlays & Transient UI (9):
-
dialog_modal, drawer, popover, tooltip, hover_card, toast_snackbar, alert_dialog_confirm, notification_center, tour_teaching_tip
- Structured Data Display (7):
-
table_static, data_table_sortable, data_table_paginated, data_table_filterable, data_grid_editable, data_grid_row_selection, virtual_list
- Files, Clipboard, Downloads (5):
-
file_upload_button, file_dropzone, file_list_manager, clipboard_copy, download_trigger
- Drag/Drop & Workspace Interactions (4):
-
drag_drop_sortable_list, drag_drop_between_lists, kanban_board_drag_drop, resizable_columns
- Advanced Editors (4):
-
rich_text_editor, markdown_editor, code_editor, json_editor
Appendix I Hardest canonical component types
| Component type | Agent % | Human steps | Family |
|---|---|---|---|
| resizable_columns | 24.4 | 1.7 | Drag/Drop |
| window_splitter | 38.3 | 1.3 | Disclosure |
| slider_range | 39.9 | 1.9 | Continuous |
| rich_text_editor | 40.7 | 4.9 | Adv. Editors |
| meter | 46.5 | 1.6 | Continuous |
| datetime_picker_range | 48.9 | 10.5 | Date/Time |
| alpha_slider | 50.0 | 1.5 | Continuous |
| kanban_board_drag_drop | 52.1 | 1.4 | Drag/Drop |
| select_native | 53.1 | 1.4 | List Selection |
| feed_infinite_scroll | 53.3 | 4.3 | Disclosure |
| color_picker_2d | 55.7 | 2.9 | Continuous |
| virtual_list | 56.7 | 3.3 | Structured Data |
| drag_drop_between_lists | 56.9 | 1.7 | Drag/Drop |
| drag_drop_sortable_list | 57.5 | 1.8 | Drag/Drop |
| code_editor | 59.0 | 3.9 | Adv. Editors |
Appendix J Failure taxonomy details and case studies
J.1 Method
The deterministic labeling in Table 4 parses every failed Pixel/SoM/AX-tree trace (8,864 traces across Gemini 3 Flash, Gemini 3.1 Flash-Lite, GPT-5 mini, GPT-5.4, and GPT-5.4 mini) into its action sequence and extracts feature flags: whether a drag was emitted, whether the target control was ever interacted with, whether coordinates repeat across steps, and whether a value was typed. Each trace starts from a component-driven category prior (e.g., slider tasks default toward continuous calibration) and is refined or overridden by the trace evidence; repetition_or_no_progress_loop is retained as a residual category only when the trace does not support a more specific mechanism, with other_or_unclear as the final fallback. The Layer-2 column maps each failed run’s LLM-assigned primary_failure_family and secondary tags onto the same nine categories; these labels are produced by GPT-5.4 (high reasoning effort) reading each failed run’s full action log and screenshots under a fixed JSON output schema. Categories that require low-level pointer evidence (continuous calibration, drag execution) are not separable in the Layer-2 labels and are folded into their nearest semantic categories there.
J.2 Adversarially reviewed case studies
We selected 20 representative failed traces spanning the major categories, wrote a mechanism narrative for each by reading the full action log and screenshots alongside the Layer-2 diagnosis, and then had an independent adversarial reviewer—a separately prompted Claude Opus 4.8 (Anthropic 2026c, claude-opus-4-8;) pass instructed to re-open the same evidence with skepticism and refute each narrative—re-check every case. Each case received a single review pass, issued through the Claude Code agent harness at its default sampling and reasoning settings (i.e., not a deterministic decode); the review script ships with the benchmark. Fifteen cases were confirmed as labelled; five were relabelled by the reviewer, and we report the reviewer-adjusted category. Three abbreviated examples:
Continuous calibration (meter-mui-T09, GPT-5.4 mini, Pixel).
Instruction: drag the Server B load meter to 42% in a three-row table. The agent targets the correct row from the first step and successfully drags the bar (15%28% across the run), but the bar spans only 100px for 0–100%, so each coarse drag overshoots or undershoots; the agent issues progressively smaller nudges and times out at 28%. The failure is value calibration, not grounding or instance selection.
Target acquisition in drag (drag_drop_between_lists-antd-T01, GPT-5 mini, Pixel).
Instruction: drag Editor from Available to Assigned roles. The drag primitive works—items visibly move—but the very first drag grabs the row above the intended one (aimed at for Editor; that is the Admin row), placing Admin into Assigned. The agent later also moves Editor but never removes the mis-dragged Admin, so the committed set fails exact-set verification. An off-by-one-row grab, not a drag-execution failure.
Perception error masquerading as a loop (kanban_board_drag_drop-antd-T04, GPT-5.4 mini, Pixel).
Instruction: reorder the Review column to match a reference panel. The agent misreads the reference (quoting the column’s own current order back as the target), concludes the board already matches, and spends all 20 steps re-asserting completion without ever issuing a drag. The root cause is a wrong belief about the target state; the loop is only the symptom.
The five reviewer adjustments are themselves instructive: in each, a plausible category (e.g., “calibration error”) was overturned by finer trace reading (e.g., the agent was monotonically ratcheting a spinner in the wrong direction—a no-progress loop, not calibration). All 20 case studies with trace pointers are released alongside the benchmark.
Appendix K Human reference validation with additional annotators
The human reference traces in the main experiments come from two passes by a single annotator (Section 2.2). To test whether the efficiency comparisons depend on that annotator’s idiosyncrasies, we collected recordings from two additional annotators on a fixed, pre-specified 278-task stratified validation subset: one task per realized (canonical type, library) pair, chosen by a fixed-seed randomized search (seed 2026) that minimizes deviation from the global difficulty distribution before inspecting any new results. The subset covers all 97 canonical types and all 14 families (bucket distribution easy 93 / mid 94 / hard 91), and contains 278 rather than tasks because not every canonical type is implemented in every library.
Each additional annotator followed the same protocol as the original reference: two recorded passes per task with the shorter successful pass kept, cleaned with the same normalization pipeline. All three annotators completed all 278 tasks successfully. Table 14 summarizes agreement on action tasks (258–265 per annotator; the remainder are hover-only tasks with zero normalized actions). Pairwise statistics are computed over the tasks where both annotators in the pair recorded at least one normalized action; hover-only tasks are excluded.
| Metric | Value | |
|---|---|---|
| Mean normalized steps (Original / A1 / A2) | 2.92 / 2.90 / 3.14 | |
| Median normalized steps (all annotators) | 2 | |
| Pairwise step-count Pearson correlation | 0.79–0.94 | |
| Exact step-count agreement | 71%–84% | |
| Mean absolute step-count difference | 0.32–0.64 |
On a like-for-like per-task basis, the human-to-human action-count ratio is 1.05 (each annotator versus the median of the others), whereas agents on the same subset take 1.27–3.02 the human action count on tasks they solve (Appendix L). The agent–human efficiency gap is therefore several times larger than inter-annotator variation. We accordingly present the reference traces as practical successful references rather than claims of human optimality; the efficiency conclusions in Section 4.1 are robust to the choice of annotator.
The recording sessions also served as an independent task-quality spot check: annotators could flag broken, ambiguous, or miswired tasks during recording, and no task in the subset was flagged—evidence against pervasive implementation or specification defects in this stratified subset.
Appendix L Repeated-run stability
Each model–mode combination in the main tables was evaluated in a single deterministic run. To quantify run-to-run variation, we ran each selected model–mode cell twice in total on the same 278-task validation subset (Appendix K) at an identical harness commit and model endpoint, for four models from two providers (Gemini 3 Flash, Gemini 3.1 Flash-Lite, GPT-5 mini, GPT-5.4 mini) under the two regimes that stress different variance sources: pure-visual Pixel and tool-rich Browser-Use. We report nonparametric bootstrap 95% confidence intervals (resampling tasks, , seed 2026).
| Model | Mode | Mean pass (%) | Max dev | Agree% | Jaccard | 95% CI |
|---|---|---|---|---|---|---|
| Gemini 3 Flash | Browser-Use | 95.1 | 1.1 | 97.5 | 0.974 | [92.6, 97.3] |
| Gemini 3 Flash | Pixel | 87.4 | 0.7 | 90.6 | 0.898 | [84.0, 90.8] |
| Gemini 3.1 Flash-Lite | Browser-Use | 87.1 | 0.7 | 94.2 | 0.936 | [83.3, 90.6] |
| Gemini 3.1 Flash-Lite | Pixel | 77.0 | 0.0 | 86.3 | 0.837 | [72.5, 81.3] |
| GPT-5 mini | Browser-Use | 86.7 | 1.4 | 92.1 | 0.913 | [82.9, 90.3] |
| GPT-5 mini | Pixel | 52.5 | 0.0 | 82.7 | 0.718 | [47.1, 57.9] |
| GPT-5.4 mini | Browser-Use | 85.4 | 1.1 | 91.0 | 0.900 | [81.5, 89.0] |
| GPT-5.4 mini | Pixel | 80.6 | 1.4 | 87.8 | 0.859 | [76.3, 84.7] |
Three observations. (1) Aggregate pass rates are stable: run-to-run deviation is at most 1.4% (median 0.9%), far smaller than the mode and model effects in the main results, and the headline orderings (Gemini 3 Flash strongest; Browser-Use Pixel for every model; GPT-5 mini Pixel weakest) are identical in both runs. (2) Aggregate stability can hide task-level churn: GPT-5 mini Pixel has an identical pass rate in both runs (52.5%) yet 17.3% of tasks flip outcome, with passfail and failpass flips canceling in the aggregate. We therefore report task-level agreement and Jaccard alongside pass rates; conclusions about individual borderline tasks should be read with this churn in mind. Flips concentrate on mid/hard tasks and on the drag/slider components already identified as brittle. (3) Interaction counts are far more stable than wall-clock time: mean successful-task action counts change by at most 0.40 steps between runs, while mean durations shift by up to 11 seconds—so we base efficiency claims on action counts rather than latency-confounded durations. On the same subset, the per-task action-count ratio of each successful agent run to the human median ranges from 1.27 (GPT-5.4 mini and Gemini 3.1 Flash-Lite, Pixel) to 3.02 (GPT-5 mini, Pixel), the like-for-like comparison quoted against the 1.05 human–human baseline in Appendix K.
Appendix M Experimental setup details
This section documents the model access, coordinate handling, and framework configuration used in our experiments.
M.1 BrowserGym-based evaluation (AX-tree, SoM, Pixel)
All models except UI-TARS-1.5-7B and Opus 4.6 are evaluated through a shared BrowserGym-based harness (de Chezelles et al. 2024) with a 1280720 viewport, a maximum of 20 steps per task, and a 600-second per-task wall-clock budget; the BrowserGym modes additionally enforce a 300-second per-step timeout. The three observation/action spaces (AX-tree, SoM, Pixel) differ only in what the agent sees and how it refers to targets; the underlying page, verifier, and termination logic are identical.
In Pixel mode, different model families use different coordinate conventions:
- •
Gemini 3 Flash and Gemini 3.1 Flash-Lite are accessed via the Google AI Studio API. These models output coordinates in a normalized 0–1000 space; the harness linearly maps them to screen pixels.
- •
Qwen3-VL-235B-FP8 is served locally via vLLM (FP8 quantization, tensor-parallel). It also outputs 0–1000 normalized coordinates, mapped to pixels by the harness.
- •
GPT-5.4 and GPT-5.4 mini are accessed via the OpenAI API directly. These models output raw pixel coordinates; no coordinate transformation is applied.
- •
GPT-5 mini is accessed via a Duke LiteLLM proxy (OpenAI-compatible endpoint). It also outputs raw pixel coordinates with no transformation.
All models receive a screenshot as a base64-encoded image. In AX-tree mode, the accessibility-tree text is appended to the prompt. In SoM mode, numbered bounding-box overlays are rendered onto the screenshot.
M.2 UI-TARS-1.5-7B (native pixel mode)
UI-TARS-1.5-7B (Qin et al. 2025) is evaluated through its own native harness rather than the shared BrowserGym pipeline, to match its training-time interface. The model is served via vLLM (bfloat16, single GPU, 32K context window, gpu_memory_utilization=0.90). Screenshots are rescaled using smart_resize (from the Qwen-VL codebase) before being sent to the model. The model predicts coordinates in the resized-image space; the agent maps them back to the original 1280720 screen pixels. The conversation uses a multi-turn format with a 4-turn sliding window for history, matching the model’s training setup. Temperature is set to 0.0, with up to 3 retry attempts per step for invalid actions.
M.3 Opus 4.6 (Core Pixel only)
Opus 4.6 is evaluated only on ComponentBench-Core (912 tasks) in Pixel mode. Screenshots are captured at the native 1280720 viewport and anisotropically resized to 1024768 (16:9 to 4:3, no padding or cropping) before being sent to Claude via Anthropic’s computer-use tool interface (Anthropic 2026a). Claude outputs coordinates in 1024768 space; the agent maps them back to 1280720 using separate horizontal and vertical scale factors. The target resolution follows Anthropic’s XGA recommendation for optimal model accuracy.
M.4 Browser-Use mode
The Browser-Use observation/action space uses the browser-use framework, which provides the agent with screenshot-based interaction together with serialized DOM information and grounded element references. Key parameters:
- •
Viewport: 1280720, headless Chromium
- •
use_vision=True, use_thinking=True, flash_mode=False
- •
max_actions_per_step=4, max_failures=3, step_timeout=120s
- •
highlight_elements=False (no visual element highlighting)
- •
Maximum 20 steps per task; the initial page-load step is excluded from step-count analysis
Gemini models are accessed via the Google AI Studio API; GPT models are accessed via the OpenAI API or Duke LiteLLM proxy. Qwen3-VL-235B’s Browser-Use runs are served through Amazon Bedrock’s OpenAI-compatible endpoint (qwen.qwen3-vl-235b-a22b); Bedrock does not document its serving precision, so these runs may differ slightly from the locally served FP8 configuration used for its AX-tree, SoM, and Pixel runs.