ALMA observations of pre-JWST galaxy candidates: A CO() line from a ULIRG at and revisit of the photometric redshifts with JWST photometry2026ALMA observations of pre-JWST galaxy candidates: A CO() line from a ULIRG at and revisit of the photometric redshifts with JWST photometry–B
Abstract
We present Atacama Large Millimetre/submillimetre Array (ALMA) observations targeting the [O iii] m line for six galaxy candidates selected with the Hubble Space Telescope and the Spitzer Space Telescope. We detect a line () and dust continuum emission () in UDS_18697, while detecting neither robust line nor continuum emission in the remaining five objects. The detected line in UDS_18697 is identified as CO(), because follow-up James Webb Space Telescope (JWST) NIRSpec observations have confirmed the redshift as . UDS_18697 is classified as an ultra luminous infrared galaxy (ULIRG) with far-infrared (FIR) luminosity of , assuming a dust temperature of K, estimated using a physically-motivated method. We find that UDS_18697 follows the relation for local and galaxies, albeit being slightly brighter in CO(). Also, based on the follow-up NIRSpec observations and spectral energy distribution fitting using JWST/NIRCam photometry, we found that most of our targets are suggested to be low- interlopers. Motivated by these redshift misclassifications, we investigate colour–colour selection criteria for high- galaxies using JWST spectroscopic survey catalogues. We find that elevating a colour threshold tracing the Lyman break is crucial for constructing a robust high- sample, particularly for wide field surveys such as Euclid Deep Fields and Roman High-Latitude Wide-Area Survey.
Keywords:
galaxies: high-redshift1 Introduction
Investigating galaxies in the Epoch of Reionisation (EoR) is key to understanding galaxy formation and cosmic reionisation. The first step of the EoR investigation is to select high- galaxies from numerous objects appearing in imaging data, requiring photometric techniques that effectively capture galaxy spectral features. One of the most common methods to select high- galaxy candidates is the so-called "Lyman break method" (105), which makes use of a sharp spectral drop at the Lyman limit (Å) due to the high opacity of neutral interstellar medium (ISM) to hydrogen ionising photons within a galaxy. This method can also capture another strong break at Å, which corresponds to the edge of the Gunn-Peterson Trough. This feature originates from the Ly absorption by neutral hydrogen in the intergalactic medium (IGM), emerging at .
Over the past few decades, the Lyman break method has been used for extending the most distant redshift with a combination of deep imaging of space telescopes and ground-based telescopes. The Subaru telescope has found numerous Lyman break galaxies (LBGs) with its exceptionally wide field of view. The Great Optically Luminous Dropout Research Using Subaru HSC (81, GOLDRUSH;), for instance, identified approximately 4 million LBGs at over sky (52). The Hubble Space Telescope (HST) has dramatically improved our understanding of the early Universe by identifying LBGs up to with its unprecedented depth at near-infrared (NIR) wavelengths (e.g., 118; 78; 97; 9; 44; 63; 64, see also 103 for a review). With the HST filter combination, the accessible photometric redshift (photo-) was limited up to , where the Ly break is redshifted to m. The advent of the James Webb Space Telescope (JWST) broke this redshift barrier. With its superb sensitivity and wavelength coverage spanning from optical to infrared, JWST has revealed a large number of galaxies at within the first year of its operation (e.g., 29; 75; 41; 2; 8; 35; 42; 54; 72). Many subsequent efforts have been made to identify more distant galaxies and to advance the observational frontier towards the first galaxies (e.g., 111; 27; 47; 49; 83).
Although the Lyman break method has successfully identified numerous high- galaxies, it occasionally allows low- contaminants to be selected as high- candidates because various types of galaxies can make similar dropout features (92). Major contaminants are quiescent galaxies with a prominent Balmer break that can be erroneously regarded as a Lyman break (96; 49, e.g.,) and dusty star-forming galaxies (DSFGs) that have strongly attenuated continua from ultraviolet (UV) to optical, resulting in non-detections in shorter-wavelength filters (117, e.g.,). Another source of contamination is galaxies with extremely strong emission lines (extreme emission line galaxies; EELGs), which can mimic LBG-like spectral energy distributions (SEDs) based on photometry by boosting broadband flux densities (5; 47, e.g.,). A recent study making use of medium bands indicated that including medium band photometry can efficiently remove low- EELGs (1; 6). Certainly, the contamination fraction strongly depends on the adopted selection criteria and field-to-field variations, but a high contamination rate resulting from broad band-only selection can lead to an overestimation of dex in the UV luminosity function at (6). Given this situation, spectroscopic follow-up observations are necessary to discuss properties of high- galaxies.
Before the completion of cosmic reionisation, the Ly emission line, which has been used to determine spectroscopic redshift of galaxies, is absorbed by neutral hydrogen in the IGM, making the line detection difficult. Therefore, the spectroscopic confirmation of the Ly line with ground-based 8–10 m telescopes was expensive in the pre-JWST era (109; 119, e.g.,). Alternatively, far infrared (FIR) fine structure lines such as [C ii]m and [O iii]m have been used to spectroscopically confirm redshifts of galaxies. The Atacama Large Millimeter/submillimeter Array (ALMA) offers us high sensitivity and a unique spectral window to detect FIR fine structure lines in galaxies in the EoR. Consistent with a theoretical prediction that the [O iii]m line is presumably the brightest emission line tracing H ii regions at (60), the line was successfully detected from a galaxy at (62). Since then, [O iii]m observations have spectroscopically confirmed galaxies in the EoR (23; 57; 69; 108; 55; 56; 53; 115; 114; 85; 4; 3; 65, e.g.,). Furthermore, the [O iii] m line has also been detected even in JWST-discovered galaxies such as GHZ2 (116), GS-z11-0 (113), and GS-z14-0 (98; 24).
In this paper, we present ALMA follow-up observations of the [O iii] m line for candidate galaxies selected with the Spitzer Space Telescope (Spitzer), HST, and ground-based telescopes. This paper is organised as follows: Section 2 describes our sample, ALMA observations, and photometry. ALMA data analysis, its results, and investigation of physical properties based on the detected lines are presented in Section 3. In Section 4, we perform SED fitting to investigate properties of our targets. We discuss the effect of photometry on an LBG selection and the accuracy of colour–colour selection in Section 5, and we summarise the paper in Section 6. Throughout this paper, we adopt the flat CDM cosmology with parameters , and (84). All magnitudes are provided in the AB system (80).
2 Data
2.1 Target Selection
We constructed a sample of six galaxy candidates for ALMA follow-up observations of the [O iii] m line, aiming at spectroscopic confirmation of their redshifts. We selected the six targets from candidates presented in the literature: the Cosmic Assembly Near-Infrared Deep Extragalactic Legacy Survey (43, CANDELS;), the Brightest of Reionizing Galaxies Survey (BoRG[z9]; 73; 15), HST Frontier Fields (66; 79, HFFs:), COSMOS Ultra VISTA Field (104), Reionization Lensing Cluster Survey (94, RELICS;), and Cosmic Evolution Survey photometric catalogue (110, COSMOS2020;).
For our sample selection, we used the following criteria for the literature other than the COSMOS2020 catalogue: (1) a photometric redshift of with a uncertainty smaller than , (2) the existences of observations in at least one of Spitzer/IRAC ch1 ([3.6]) and ch2 ([4.5]) filters, (3) no strong IRAC detection, to reduce the possibility of low-redshift contamination, and (4) HST F160W magnitude of . These criteria were employed to exclude low- interlopers and to detect the [O iii] m line in a reasonable integration time. With these criteria, four galaxies, UDS_1869711 1 11 flagged UDS_18697 (which they referred to as UDS910-13) as a source based on a detection in the ground-based FourStar band., COSMOS_20646, UDS_781522 2 UDS_7815 was not included in our initial sample. After the proposal was accepted, however, one of the original targets was found to be likely at low- and was therefore replaced with this galaxy., and J2140+0241, were found from 43 and 73. Note that 43 excluded UDS_7815 from their final candidates due to a detection in the HST/WFC3 F098M filter, implying that this object is at . However, the galaxy remained in our ALMA observation targets because the follow-up F098M observation of 43 was actually conducted during HST Cycle 27, which overlapped with our ALMA observation of the object. From the COSMOS2020 catalogue33 3 Note that the COSMOS2020 catalogue does not include HST filters other than HST/ACS F814W filter. (110), targets were selected by the following criteria: (1) , (2) no significant detection blueward of m, and (3) no significant detection at m. These criteria ensure that galaxies drop blueward of the Lyman break at and are not likely to be a low- dusty galaxy. These criteria were satisfied by two galaxies, COSMOS-z10-1 and COSMOS-z10-2. In summary, the six galaxies at have been selected for our sample. The target information is listed in Table 1. With this procedure, we constructed the most promising sample of galaxy candidates from the highest quality imaging data obtained before the emergence of JWST.
2.2 ALMA Observation
The ALMA Band 7 observations targeting the [O iii] m line at were carried out during Cycles 7 and 8 (#2019.1.00397.S, #2021.1.00389.S, PI: T. Hashimoto), investing in total of hours of on source time. Observation dates, central frequencies, on-source times, and array configurations are shown in Table 1.
In Cycle 7, UDS_18697, COSMOS_20646, UDS_7815, and J2140+0241 were observed using four tuning sets to search for the line across a wide frequency range. Each tuning set had four Spectral Windows (SPWs) with a bandwidth of the frequency division mode (FDM), giving a bandwidth in total. This corresponds to a redshift range of at , covering uncertainties of their photometric redshift. An exception is UDS_7815, where a large photo- uncertainty () reduces a covering fraction to 60.9%. Compact array configurations (C43-2, C43-3, and C43-4), yielding an average beam size of , were used to cover the entire emission from the targets rather than to resolve them, because the main objective of the observations was to detect the [O iii] m line.
In Cycle 8, observations of COSMOS-z10-1 and COSMOS-z10-2 were conducted using six tuning sets for each object. All SPWs were set to have of the FDM, resulting in a total bandwidth of . This frequency range corresponds to a redshift range of , covering and of the entire photo- probability distribution of COSMOS-z10-1 and COSMOS-z10-2, respectively. The C43-2 and C43-3 array configurations were used, yielding a beam size of . Note that the large atmospheric absorption at is not taken into account to calculate the photo- covering fractions for both Cycles 7 and 8 observations. The photo- range and frequency coverage for all targets are presented in Appendix A.
| ⧫Object | R.A. | Dec. | ‡Ref. | Date | Cent. Freq. | Time | Array Config. | ||
| [mag] | [YYYY/MM/DD] | [GHz] | [min.] | ||||||
| Cycle 7 (2019.1.00397.S) | |||||||||
| UDS_18697 | M24, F22 | 2019/10/04-10/11 | C43-2, C43-3, C43-4 | ||||||
| COSMOS_20646 | M24, F22 | 2019/10/06-10/17 | C43-2, C43-3, C43-4 | ||||||
| UDS_7815 | M24, F22 | 2019/10/30-11/07 | C43-2 | ||||||
| J2140+0241 | M18 | 2019/10/07-10/10 | C43-2, C43-3, C43-4 | ||||||
| Cycle 8 (2021.1.00389.S) | |||||||||
| COSMOS-z10-1 | W22 | 2022/04/02-05/14 | C43-2, C43-3 | ||||||
| COSMOS-z10-2 | W22 | 2022/04/02-09/22 | C43-2, C43-3 | ||||||
: UDS_18697 and J2140+0241 are magnified by a factor of and , respectively. : Calculated based on . : Follow-up spectroscopic observations and/or SED fitting with a new NIRCam photometry suggest redshifts of . : As reported by 73, the SED fitting estimated a probability of being at . The uncertainties and the value listed here correspond to the 16th, 50th, and 84th percentiles of the probability distribution of solution. : References, M18: 73, F22: 43, W22: 110, M24: 71.
2.3 Optical and Near Infrared Photometric Data
For the SED fitting analysis, we used available JWST/NIRCam and HST photometric data from the ASTRODEEP-JWST catalogue, which contains objects detected in stack images of NIRCam F356W and F444W in the well-known extragalactic fields (71). The catalogue provides photometric data of four HST/ACS filters (F435W, F606W, F775W, F814W), four HST/WFC3 filters (F105W, F125W, F140W, F160W), and eight JWST/NIRCam filters (F090W, F115W, F150W, F200W, F277W, F356W, F410M, F444W). We searched for catalogue counterparts within 1 arcsec from the target galaxies44 4 ASTRODEEP-JWST catalogue coordinates are aligned to Gaia stars.. Out of our six target galaxies, UDS_18697, COSMOS_20646, and UDS_7815 were found in the catalogue with offsets of 0.20, 0.13, and 0.09 arcsec, respectively, from positions reported in 43. The others were not found just because they have not been observed with NIRCam. Regarding COSMOS-z10-1 and COSMOS-z10-2, we also checked the COSMOS2025 catalogue (100). However, neither is included as both objects lie outside the NIRCam footprint. Table 2 shows the flux densities of the three objects.
| Filter | UDS_18697 | COSMOS_20646 | UDS_7815 |
|---|---|---|---|
| F435W | — | ||
| F606W | |||
| F814W | |||
| F125W | |||
| F140W | |||
| F160W | |||
| F090W | |||
| F115W | |||
| F150W | |||
| F200W | |||
| F277W | |||
| F356W | |||
| F410M | |||
| F444W |
Note: Flux densities are given in .
3 Analyses & Results
3.1 ALMA Data Analysis
The ALMA data were reduced and calibrated using the Common Astronomy Software Applications (CASA) package (70) pipeline versions 5.6.1-8 (UDS_18697, COSMOS_20646, UDS_7815, and J2140+0241), 6.2.1.7 (COSMOS-z10-1 and COSMOS-z10-2), and 6.4.1.12 (one observation of COSMOS-z10-2).
To search for emission lines, we first created dirty cubes using the CASA task tclean. Spectral binning was performed to resample six native channels into one, resulting in a velocity width of – per channel. We used natural weighting to maximise sensitivity for a point source. For a continuum-detected source, we subtracted it to make a pure line cube using the CASA task uvcontsub, assuming that the continuum is constant over the observed frequency range. We then created clean cubes for objects with line emissions down to triple the mean of the root mean square (rms) level of each cube. During the clean procedure, targets were masked in cases with nearby objects to avoid misidentification of sidelobes as real objects. For objects exhibiting an emission line, moment-0 maps of the line were created with the CASA task immoments, and line fluxes were then measured by applying the CASA task imfit to the moment-0 maps.
For dust continuum emission, we created continuum images using the CASA task tclean with natural weighting. For objects with line detections, we excluded only channels within FWHM of the line rather than excluding whole SPWs that contain the line. The continuum flux density was measured on the continuum image with the CASA task imfit. Table 3 shows the beam sizes and sensitivities of the created cubes and continuum images.
3.2 ALMA Data Results
In our ALMA data, we found two possible emission lines in UDS_18697 () and COSMOS-z10-2 (). UDS_18697 also exhibits strong dust continuum emission (). Neither emission line nor dust continuum emission was found in the other four objects. Measurements of the line and the continuum, including upper limits, are summarised in Table 4. In the following, we describe the ALMA observational results in detail.
3.2.1 UDS_18697
UDS_18697 exhibits an emission line around . The moment-0 map is shown in the top right panel of Figure 1, and a 1D spectrum taken at the peak of the moment-0 map is shown in the top panel of Figure 2. The integration frequency range for the moment-0 map is 292.90–293.70 GHz, corresponding to twice the full-width-at-half-maximum (FWHM) of the line. We obtained the line flux of and a peak of on the moment-0 map, which means a marginal detection of the line. The reliability of the line based on clump search analysis is discussed in Appendix B. The line centre frequency and the line FWHM measured from the 1D spectrum are and , respectively.
The obtained line centre frequency would correspond to a redshift of if the line were [O iii] m. After our ALMA observations, however, follow-up JWST/NIRSpec PRISM spectroscopy (GO1758, PI: S. Finkelstein) have detected multiple optical emission lines to reveal that this object is at (R. Larson et al. in prep.). Hence, we identify the marginally detected line as CO(), rather than [O iii] m. In this case, the redshift indicated by the emission line is which is consistent with the JWST/NIRSpec observations (R. Larson et al. in prep.). Although the detection remains marginal, given that the line is co-spatial with the position of UDS_18697 and consistent with the redshift from PRISM spectroscopy, we consider that the line is not likely to be a spurious.
UDS_18697 is also significantly detected in the dust continuum emission. The top left panel of Figure 1 shows the dust continuum image. The flux density is with the peak significance level of . Since the size of the continuum emitting region is larger than the image beam size (), we deconvolved the beam from the continuum emission with imfit, and derived the beam-deconvolved size of , corresponding to at . Note that the cosmic microwave background (CMB) has a negligible effect on both the line and continuum emission at this redshift and frequency (34).
We found slight spatial offsets between the dust and CO line emission peaks and source position in the ASTRODEEP-JWST catalogue, which is measured in a NIRCam F356W+F444W stacked image. The offsets are 0.16 arcsec for the CO line and 0.19 arcsec for the dust continuum, both of which are larger than an expected ALMA positioning accuracy of 0.10 arcsec. Such spatial offsets between centroid of UV/optical emission and that of dust and CO emission have been reported for submillimetre galaxies (SMGs) at (32; 31; 18, e.g.,). These offsets are likely to be a consequence of strong dust attenuation that affects UV/optical morphologies rather than physical separation (59). Given that the significant dust continuum emission is detected in UDS_18697, the observed offsets may reflect the dust obscuration.
3.2.2 COSMOS-z10-2
COSMOS-z10-2 shows a marginal line signal around . The moment-0 map and a 1D spectrum at the peak position are shown in the bottom right panel of Figure 1 and the bottom panel of Figure 2, respectively. A frequency range used for the moment-0 map is , corresponding to twice the FWHM of the line. COSMOS-z10-2 exhibits an spatial offset of arcsec between the peak position of the line emission and the object position in the COSMOS2020 catalogue55 5 The COSMOS2020 catalogue coordinates are aligned to Gaia DR2 stars., which is somewhat larger than an expected positional accuracy of arcsec. A peak significance level on the moment-0 map is and a spatially integrated line flux is . At this significance level, the line detection remains marginal. The central frequency measured from the 1D spectrum is with the line FWHM of . If the line were [O iii] m, the redshift of COSMOS-z10-2 would be , which is considerably lower than the expected redshift of .
Dust continuum emission was not found in COSMOS-z10-2 (the bottom left panel of Figure 1), and consequently a upper limit of was adopted for the flux density, assuming that the size of the object is sufficiently smaller than the beam size.
After the ALMA observations, a JWST/NIRSpec follow-up spectroscopy was obtained (GO2659, PI: J. R. Weaver), indicating that this object is at based on the Balmer break (J. Weaver et al. in prep.; N. Nezhad et al. in prep.). For this redshift, the 334.6 GHz emission line can be a CO() line at . The clump search analysis gives a 10% probability of obtaining a spurious signal (Appendix B). Given this non-negligible probability, together with the spatial offset and uncertain spectroscopic redshift, we do not claim a detection of the CO() line. The signal may therefore be a false positive, and confirming its nature requires a secure spectroscopic redshift based on emission lines.
 |
 |
3.2.3 Other targets
For the remaining four objects, neither line nor continuum emission was detected. We put upper limits on the line fluxes and continuum flux densities (Table 4). These upper limits on the line fluxes were calculated from an averaged rms66 6 The rms was computed for each channel and averaged over the full bandwidth, excluding the frequency range 322.5–327.5 GHz, which is affected by strong atmospheric absorption. and integrated over . We assumed that the emission lines are within the observed frequency range and that their size are sufficiently smaller than beam sizes. The velocity width of was assumed as twice a typical FWHM of in previous [O iii]m detections of galaxies (116; 24; 98; 113). The dust continuum upper limits were provided by assuming an unresolved source size. We note that JWST/NIRSpec follow-up observation (GO2659, PI: J. R. Weaver) revealed that COSMOS-z10-1 is at (J. Weaver et al. in prep.; N. Nezhad et al. in prep.).
| Object | Cube Beam Size & PA | Velocity Width | Cube Mean rms | Continuum Beam Size & PA | Continuum rms |
|---|---|---|---|---|---|
| (FWHM) [deg] | [] | [] | (FWHM) [deg] | [] | |
| UDS_18697 | |||||
| COSMOS_20646 | |||||
| UDS_7815 | |||||
| J2140+0241 | |||||
| COSMOS-z10-1 | |||||
| COSMOS-z10-2 |
| Object | Line Flux† | Line Central Frequency | Line Width (FWHM) | Continuum Flux Density |
| [] | [GHz] | [] | [] | |
| UDS_18697 | ||||
| COSMOS_20646 | – | – | ||
| UDS_7815 | – | – | ||
| J2140+0241 | – | – | ||
| COSMOS-z10-1 | – | – | ||
| COSMOS-z10-2 |
Note. Upper limits are .
3.3 CO() line in UDS_18697
The detected line in UDS_18697 is likely to be the CO() line at (Section 3.2.1). Although it was not [O iii] m that we aimed at, this serendipitous detection provides a distinctive data point within previous CO() observations.
In the local Universe, there is a tight correlation between far-infrared luminosity and CO line luminosity for multiple transitions (, 68). The same correlation has been reported for CO() in QSOs (17) and DSFGs (87; 88), although DSFGs tend to show slightly stronger CO line luminosity. Motivated by these findings, we investigated the property of UDS_18697 based on the detected continuum and CO() line.
Line luminosity in units of are calculated as,
| (1) |
where is the line flux, is the luminosity distance, and is the observed frequency (101). With this equation, we obtained the line luminosity of .
The galaxy SED of the FIR range is well approximated by a single temperature modified blackbody (MBB, e.g., 61). First, we estimated the dust temperature based on a radiative-equilibrium method, which utilises a single-band FIR continuum and UV luminosity (61; 45)77 7 https://github.com/yfudamoto/FIS22sed.git. By assuming a uniform distribution of dust and radiation sources, the dust temperature was estimated as K. Since UDS_18697 is not detected in the rest-UV wavelength, we can only estimate an upper limit for the dust temperature.
Next, we estimated based on a method by 102, which reproduced consistent dust temperature with those derived from multi-band FIR SED fitting across a redshift range of . They formulated the dust temperature as a function of redshift and metallicity :
| (2) |
where and . Although the metallicity was not constrained for UDS_18697, is insensitive to the metallicity as . Therefore, metallicity was randomly picked from under the uniform prior in the linear space88 8 Although the NIRSpec data have been taken for the object, the metallicity is not yet available. A detailed analysis will be presented in R. Larson et al. in prep.. The IR (m) and FIR (m) luminosity were then calculated from the observed continuum flux density and an MBB with the given and an emissivity index of . We repeated these steps 10,000 times and obtained the dust temperature, IR luminosity, and FIR luminosity of , , and , respectively. The derived is consistent with a redshift–temperature relation calibrated on DSFGs at (86) and a general trend of increasing dust temperature with redshift (99, e.g.,). With this FIR luminosity, UDS_18697 is classified as an ultra luminous infrared galaxy (ULIRG). Although the metallicity of UDS_18697 is highly uncertain, dust temperature only ranges from to , resulting in relatively small uncertainty in .
Figure 3 shows the relation between and . Since 20 and 17 calculated by integrating m and m, respectively, the values are scaled to that of m using the MBB luminosity ratio between different integrated wavelength. We calculated the luminosity ratio using () for 20 (17) based on the reported dust temperature. Although UDS_18697 is possibly gravitationally magnified () by a nearby bright galaxy, the magnification factor has a substantial uncertainty (43). Thus, we did not correct the luminosities.
The luminosity of UDS_18697 is one order of magnitude fainter than that of DSFGs previously detected in CO() (see 107, for a recent compilation). Also, UDS_18697 has a CO() luminosity comparable to the bright end of local galaxies (93). The luminosities and of UDS_18697 are almost consistent with the local relation (68), additionally supporting that the CO() line is surely detected. However, UDS_18697 seems to be located slightly below the local relation; it shows brighter for the given , which is consistent with previous studies for DSFGs (87; 88). A larger sample is necessary to statistically confirm the relation for galaxies.
4 SED fitting with NIRCam photometry
Given that the detected line in UDS_18697 was not the [O iii] m line and the others were marginal or non-detections, we revisited the photometric redshift and physical properties of the selected candidates. While our ALMA target galaxies were selected with HST and Spitzer photometry, deeper JWST/NIRCam photometry is available today. We compared two photometric datasets: JWST/NIRCam, HST/ACS, and HST/WFC3 photometry available in the ASTRODEEP-JWST catalogue (hereafter, the NIRCam+HST photometry)99 9 ALMA continuum data were not used in the fitting as we intended to see how SED fitting results change with an increase in the rest-frame optical to near-infrared data points and high-resolution data. and HST/ACS, HST/WFC3, and Spitzer photometry presented in 43 (the Spitzer+HST photometry). Note that although the NIRCam+HST and the Spitzer+HST photometry include photometry of the same HST filters, the flux density measurements provided in the two samples are sometimes different, probably due to different image reduction and flux density measurement methods. An advantage of adding NIRCam photometry is accurate photometry measurement with its superb spatial resolution, as well as filling a large wavelength gap between m (F160W) and m ([3.6]). These are essentially important for constructing a robust high- sample by capturing the rest-frame UV spectral slope of galaxies. As described in Section 2.3, the NIRCam photometry measurements are only available for UDS_18697, COSMOS_20646, and UDS_7815. Therefore, we performed SED fitting to only these three objects. For all photometry, the minimum errors were set to of their flux densities to take into account the absolute flux density uncertainties (90)
We used the Bayesian Analysis of Galaxies for Physical Inference and Parameter EStimation (22, bagpipes,) for the SED fitting. By using a code different from the photometric redshift code eazy (14) used in 43, we will check whether fitting results highly depend on codes with the Spitzer+HST photometry. We adopted the dust attenuation law proposed by 19 and assumed a delayed- star formation history. Fitting parameters were redshift , time since star formation began , time scale of star formation decrease , stellar mass , dust attenuation at -band , metallicity , and ionisation parameter . The best-fit solutions were sought over the following parameter ranges with uniform priors: , , , log, , , and log.
Figure 4 shows the observed photometry and best-fit SEDs of the three galaxies. The NIRCam+HST and the Spitzer+HST photometry are depicted by the blue and grey squares, respectively. The best-fit SEDs for the two types of photometry are drawn by the blue and grey lines with uncertainties. The best-fit parameters of the SED fitting for the NIRCam+HST photometry are summarised in Table 5. This section describes fitting results, while the detailed discussions will be given in the next section.
The SEDs of UDS_18697 are shown in the top panel of Figure 4. The largest difference between the NIRCam+HST and the Spitzer+HST photometry is found between the NIRCam and Spitzer/IRAC photometry at m, resulting in different best-fit models. The best-fit redshift for the Spitzer+HST photometry was , which is consistent with the best-fit redshift estimated by 43, . This consistency ensures that the best-fit redshifts are not strongly dependent on fitting codes. However, the best-fit results for the NIRCam+HST photometry represent that UDS_18697 is a dusty star-forming galaxy at with the dust attenuation of . This best-fit redshift is consistent with the spectroscopic redshift of (R. Larson et al. in prep.). The expected dusty star-forming nature is also consistent with the detection of the dust continuum emission. Thus, the NIRCam+HST photometry properly confirms that UDS_18697 is a low- interloper.
The SEDs of COSMOS_20646 are shown in the middle panel of Figure 4. The best-fit redshift for the Spitzer+HST photometry is , which is again consistent with the best-fit redshift estimated by 43. On the other hand, the SED fitting for the NIRCam+HST photometry shows that this object is a passive and dust reddened galaxy with the age of at . This photometric redshift is roughly consistent with that estimated based on the newest COSMOS2025 catalogue (100, ;), indicating that this object is again a low- interloper.
Finally, the best-fit SEDs for UDS_7815 are shown in the bottom panel of Figure 4. The SED fitting using Spitzer+HST indicates a best-fit redshift of , which is marginally consistent with previous estimates (43). However, the posterior distribution also exhibits a secondary peak at . The best-fit redshift derived from the NIRCam+HST photometry is , consistent with the secondary peak in the Spitzer+HST fit. These results suggest that this galaxy is likely to be a star-forming galaxy with a relatively strong () Balmer break. These results are in good agreement with the fact that UDS_7815 was excluded from the final sample in 43 (Section 2.1).
Among the three galaxies, none of their best-fit SEDs show any high- solutions, although they were previously selected as candidates. Given that their estimated redshifts are , we regard these galaxies as low- interlopers that were misclassified as sources. Note that the majority of high- galaxy candidates selected in 41 are confirmed or suggested to be at high- by JWST observations (R. Larson et al. in prep.). In the next section, we discuss the cause of these misclassifications.
| Parameter | UDS_18697 | COSMOS_20646 | UDS_7815 |
|---|---|---|---|
| U | |||
| [] | |||
: Since metallicity of UDS_18697 is highly uncertain, value calculated as a single-sided percentile is adopted as a lower limit.
5 Discussion
5.1 Effect of Photometry Measurement on Redshift Estimation
The SED fitting results and follow-up JWST/NIRSpec observations strongly suggest that five out of the six in our sample are low- interlopers. Motivated by the results, we discuss reasons why these probable low- interlopers were previously selected as candidates.
The main reason for the misclassification of UDS_18697 is likely an underestimation of the Spitzer/IRAC [3.6] flux density. This object has a bright nearby galaxy located about away. Because of the modest angular resolution of Spitzer/IRAC (40, arcsec;), light from nearby sources can be blended with that of targets. To mitigate this effect, 43 separated the flux of each target (deblending) to accurately measure the flux of galaxies with nearby objects. Even after careful deblending on images, the [3.6] flux density was one-fifth of the NIRCam F356W flux density. In addition, the previous F160W flux density was larger than that in the ASTRODEEP-JWST catalogue by a factor of 1.5. These two factors made the apparent flat UV to optical continuum. Furthermore, the continuum at m is heavily attenuated by dust, making this object undetected in F115W band.
The change in the photo- estimates of COSMOS_20646 can be explained by a combination of multiple reasons. The new NIRCam photometry continuously traces a red stellar continuum from m to 4.4 m, ruling out the possibility of being an LBG. Another possible factor changing the best-fit SED is difficulty of deblending. Since COSMOS_20646 also has a nearby galaxy about apart, there could be a possible oversubtraction.
The misclassification of UDS_7815 as a galaxy was likely caused by its faintness and the Balmer break. In the Spitzer+HST photometry, all bands blueward of the Balmer break are fainter than those in the ASTRODEEP-JWST catalogue by a factor of . This suppressed flux at shorter wavelength caused the Balmer break to resemble a Lyman break, resulting in the solution. The Lyman break method requires stringent upper limits at wavelengths shorter than the Lyman break to select LBGs securely, but UDS_7815, which is fainter than UDS_18697 and COSMOS_20646 in Spitzer+HST photometry, can be easily affected by noise fluctuation in photometric measurements (71). Indeed, UDS_7815 was detected in HST/WFC3 F814W with the significance level of in the ASTRODEEP-JWST catalogue, while it was reported to be below previously. Such a fluctuation directly leads to the misclassification of the photometric redshifts, especially in faint objects like UDS_7815.
In summary, the difficulty of photometry deblending in low-resolution images, the faintness of targets, and the sparse photometry are the main causes of the inaccurate photo- estimation for the three galaxies. For UDS_18697, for example, the [3.6] flux density is significantly offset from the best-fit SED estimated from the NIRCam+HST photometry. If there were sufficiently deep observations at m, the object would likely not have been selected as a candidate. Also, it is worth noting that 11 already excluded UDS_18697 from candidates based on ground-based 2-band data from ZFOURGE, showing the importance of deep ground-based data for rejecting lower- galaxies. Taken together, these results suggest that robust high- galaxy selection requires not only careful deblending and deep observations at shorter wavelengths, but also broad wavelength coverage.
5.2 Revisiting Colour Selection Criteria
5.2.1 Comparison with JWST Observed Galaxies
Follow-up spectroscopic observations and SED fitting suggested that most of our targets are likely to be low- interlopers rather than galaxies. Given this situation, we revisit colour–colour selection criteria and discuss an appropriate criterion using NIRCam photometry of an archival spectroscopic high- sample.
We compiled spectroscopically confirmed galaxies from the JWST Advanced Deep Extragalactic Survey (37, JADES;) and the Canadian NIRISS Unbiased Cluster Survey (112, CANUCS;) catalogues. The depths in diameter aperture are about and in F090W for JADES (89) and CANUCS (95), respectively. For JADES, we used NIRCam GOODS-N and GOODS-S v1.1 catalogue (89) and NIRSpec PRISM v1.0 (GOODS-N) and v2.0 (GOODS-S-Deep) catalogue (16; 36)1010 10 https://archive.stsci.edu/hlsp/jades. The NIRCam and NIRSpec catalogues were matched based on NIRCam_ID in the NIRSpec catalogues. For CANUCS, we used catalogues of five cluster fields (not flanking fields) from CANUCS DR1 (95)1111 11 https://niriss.github.io/data_release1.html. To assess colour selection criteria using the spectroscopic redshift, we employed only galaxies with secure spectroscopic redshifts selected based on flags in catalogues, i.e., z_Spec_flag [A, B, C] (Z_Q [1, 2]) for JADES (CANUCS) sample. Colours were calculated using photometry measured in Kron radii after homogenising the point-spread functions (PSFs) to that of the F444W.
On the basis of the correct redshifts of the JADES and CANUCS spectroscopic sample, we examined locations of our ALMA sample observed with NIRCam (UDS_18697, COSMOS_20646, and UDS_7815) and the spectroscopic sample on the colour–colour diagram for the galaxy selection. All the three galaxies were selected from 43, who constructed a high- sample based on photo- probability distribution from the SED fitting with eazy. Since 43 showed that all their candidates met or were within of the selection criteria employed in 10, we use colour criteria similar to 10 ones and compare how colours change with deep, high-angular resolution NIRCam photometry. In 10, galaxies were required to show (1) and (2) , where is the HST/WFC3 F125W magnitude. Instead of F125W, F160W, and filters, we calculated the colour with NIRCam F115W, F150W, and F356W filters, respectively; (1) and (2) . Since the Lyman break is traced by F115W instead of F125W with the criteria, we limit our analysis to . We also set a detection threshold of to ensure that galaxies are robustly detected at longer wavelengths. For a dropout criterion, then, we set .
The left panel of Figure 5 is a colour–colour diagram of the spectroscopic sample, together with our targets observed with NIRCam. For our targets, colours measured with HST and Spitzer/IRAC ( and ; Spitzer-based colours) are also shown by open blue stars for comparison. The selection colour criteria for galaxies are indicated by the dotted lines. With Spitzer-based colours, all three galaxies indeed satisfy the criteria. However, with colours based on NIRCam photometry (NIRCam-based colours), UDS_18697 and COSMOS_20646 do not satisfy the threshold, supporting the scenario that these galaxies are not at . These changes in colours were caused by the difficulty of deblending of nearby bright sources in Spitzer/IRAC [3.6] (Section 5.1). UDS_7815 satisfies the colour criteria with NIRCam-based colours in the left panel of Figure 5, but does not satisfy the dropout threshold (). Thus, our three target galaxies are no longer selected as candidates not only from the SED fitting but also from the colour selection.
The colour criteria have successfully selected all galaxies with and , while rejecting most galaxies at 1212 12 Although some galaxies satisfy , more than half of them are at , where Lyman break is redshifted to shorter half of the F115W band.,1313 13 JWST spectroscopic observations samples are not complete and may be biased to galaxies with blue spectra or strong breaks. Addressing this selection bias is beyond the scope of this paper.. However, there are two main populations of low- interlopers, represented by our target galaxies.
The first population is dusty galaxies at exhibiting red and colours, like UDS_18697 and COSMOS_20646. While the dusty galaxies are expected to be located on the right side of the selection area (the left panel of Figure 5), they may nevertheless be misclassified by the following two reasons. The first reason is strong emission lines that boost flux density in F150W, resulting in creating a flat continuum and a false break (5; 117; 1; 6). Including medium bands in the photometry is an efficient solution to reject dusty contaminants, as medium bands can trace emission lines (51; 1; 6). The second reason is photometric discrepancies, which accidentally happen or arise from deblending issues, that make an LBG-like spectrum (12; 49, e.g., XMM3-3085;). Using as many bands as possible can be a solution, as they continuously trace a continuum and enable detecting a possible discrepancy in photometry (Section 5.1).
The other population is Balmer break galaxies (BBGs) exhibiting red colours, like UDS_7815. In the spectroscopic sample from the catalogues, about of the candidates selected with the criterion of are actually interlopers at (i.e., the purity is ). If the non-detection bands like F090W are deep enough, we may reject BBGs even with the modest Lyman break colour criterion because BBGs would be detected in the bands. Using a more stringent Lyman break colour criterion is also a solution to reject BBGs. Elevating the criterion to , for instance, can increase the purity of the sample to . Thus, adopting a stricter criterion for the Lyman break colour is an effective approach to select robust high- candidates. The effectiveness of a stringent threshold has been shown with JWST imaging survey. For example, 7 employed a colour criterion of () to select () candidates, and follow-up spectroscopic observation for four of the candidates successfully confirmed that all of them were indeed at (46). We note, however, that a stricter Lyman break colour threshold reduces completeness by missing true high- galaxies. This is particularly severe for intrinsically faint galaxies because they cannot produce a large colour difference between dropout and detection bands.
5.2.2 Colour Threshold in the Context of Observation Depth
The Lyman break colour as a function of the UV magnitude enables exploration of another aspect of the selection colour criteria. Although increasing the criterion for the Lyman break colour can improve the purity of high- galaxy samples, the maximum Lyman break colour that can be measured (hereafter, referred to as the constraining power) is determined by the survey depth.
The right panel of Figure 5 illustrates the relation between the Lyman break colour, absolute UV magnitude , and observation depth . In addition to galaxies from JADES and CANUCS, several spectroscopically confirmed galaxies presented in the literature and galaxies from the catalogues are also shown in the figure. The Lyman break colour here refers to F115WF150W for galaxies and F150WF200W for galaxies.1414 14 Since NIRCam data are unavailable for some low- interlopers, we used photometry measured by ground-based telescopes. For HD1 and HD2 (XMM3-3085), which were initially found as -dropouts (-dropout) by 50 (12) and confirmed as () by 96 (49), we alternatively used VISTA or UKIRT () as their Lyman break colours. For galaxies from the catalogues, we calculated using photometry in F150W (F200W) band for galaxies at (), corresponding to (). of galaxies (red squares) was calculated in the F150W with a fixed redshift of to illustrate the brightness of low- interlopers if they were at . For galaxies from the literature, we adopted the published values except for HD3 (50; 96). For HD3, we calculated the value using the photometric redshift presented in 50.
The right panel of Figure 5 indicates a difference between true high- galaxies and low- interlopers. The diagonal solid lines in the figure indicate the constraining power of the Lyman break colour for each limiting magnitude . The constraining power of the Lyman break colour was calculated using the flux density that corresponds to of each limiting magnitude, as we set the dropout threshold of and consequently give lower limits on the Lyman break colour. This means that data points, including measurements and lower limits, must be located below a diagonal line corresponding to each observation depth. In other words, the faintest high- candidates that can be selected with a given limiting magnitude are located close to an intersection of a diagonal line (survey depth) and a horizontal line (colour criterion). Therefore, the right panel of Figure 5 illustrates that many of the low- interlopers are barely selected with both the detection and selection criteria. Such data points are easily affected by noise fluctuations, and thus, it is not surprising that they are low- interlopers.
These contaminations are more critical in shallower surveys. For example, surveys with will search for galaxies with with the Lyman break colour of . Such galaxies are brighter than the characteristic magnitude of the luminosity function at , (82), where the luminosity function follows an exponential or a steeper power-law function. This rapid decrease in the number density further reduces the probability that the selected candidates are certainly at . Indeed, 49 showed that the number density of bright () galaxies will be smaller than that of interlopers if only of passive galaxies at are misclassified as high- galaxies, indicating that the purity in apparently brighter galaxies can be lower than in fainter galaxies.
5.2.3 Implications to future imaging surveys
These discussions will give some insights into current and future IR imaging surveys. First, contaminations discussed above would not be a serious problem for JWST observations. As shown in the right panel of Figure 5, faint galaxies are selected as and indeed spectroscopically confirmed as high redshift, even though they show relatively small () Lyman break colour. These galaxies benefit from high-resolution, high-sensitivity, multi-band imaging with NIRCam. Low- interlopers () observed with JWST are not as bright as low- interlopers found by ground-based facilities, reflecting the deeper survey depths. Since the JWST low- interlopers are fainter than the characteristic magnitude of luminosity functions at 1515 15 Although galaxies with are expected to be detected in F090W with a limiting magnitude of the JADES and CANUCS, several galaxies with that brightness were selected by the colour criteria. This is due to their larger photometry error in F090W by a factor of , which is equivalent to degrading the observation depth by . This reasonably explains why they were not detected in F090W., their influence on purity is smaller than that on bright LBGs.
Upcoming wide-field surveys, on the other hand, can be affected by the contamination discussed above. Large imaging surveys with Euclid, Roman, and GREX-PLUS are expected to find a large number of high- galaxy candidates. As part of the Euclid Deep Fields, Euclid will observe over with depths of about in , and -band (67; 38) with angular resolutions of arcsec. This survey depth enables detections of galaxies with with the Lyman break colour criterion of (the right panel of Figure 5). As discussed above, the candidates selected with this absolute UV magnitude will be as bright as or brighter than the characteristic magnitude , which can be highly affected by low- interlopers (Section 5.2.2). In addition, as the Euclid reddest filter is the -band, the Lyman break method has to rely on Spitzer/IRAC photometry (39), which would suffer similar limitations to our target selection in terms of the number of filters and the difficulty of deblending. Therefore, despite the tradeoff with completeness, increasing a purity with a stringent colour criterion and deep observation blueward of the Lyman break will be crucial to avoid heavy contamination in high- candidate samples.
The Roman High-Latitude Wide-Area Survey (HLWAS, Deep Tier) will survey over sky with depths of in , , -band and in -band (77). The depths in , -bands enable a search for galaxies mag fainter than the characteristic UV magnitude at – (the right panel of Figure 5). The high angular resolution () and redder -band observations of the Roman HLWAS can reduce contaminations in the high- candidates.
Finally, GREX-PLUS, a mission concept of a space telescope, plans to offer DEEP imaging surveys at m () and m () over sky with angular resolution higher than Spitzer by a factor of (48). The combinations of these IR wide-field surveys will continuously trace rest-frame UV to optical spectra of galaxies and relax the difficulty of deblending. These deep, multi-band, high-resolution surveys, with the aid of careful target selections, will help to construct robust high- candidate samples at and beyond, which are essential for efficient follow-up spectroscopy. In addition to JWST, optical-to-IR ground-based telescopes and ALMA with Wideband Sensitivity Upgrade (26, WSU;) will play significant roles for confirming galaxies in the first of the Universe.
6 Conclusion
In this paper, we have reported ALMA [O iii] m observation for six candidates selected by HST, Spitzer, and ground-based facilities. Our main findings are:
- 1.
We have detected possible line features in UDS_18697 (). However, JWST/NIRSpec follow-up observations confirmed the redshifts as (R. Larson et al. in prep.), confirming the detected line as CO() at . The remaining five galaxies show no line emission.
- 2.
UDS_18697 also shows a strong dust continuum emission with the significance level of . The derived FIR luminosity is , classifying the galaxy as a ULIRG. The FIR luminosity of UDS_18697 is one order of magnitude fainter than previous CO() detected DSFGs, making UDS_18697 one of the faintest examples at . Together with the CO line luminosity, we have found that UDS_18697 lies slightly below the local relation, though it is still consistent with the local relation within the uncertainties.
- 3.
Although our targets were suggested to be at in previous photometry based on HST and Spitzer, SED fitting with newly available JWST/NIRCam photometry suggests that all three galaxies observed with JWST/NIRCam among the six target galaxies are at . Based on SED fitting, they are likely to be dusty star-forming or Balmer break galaxies at low redshift. One of the three galaxies is UDS_18697, whose best-fit redshift from the SED fitting is fully consistent with that confirmed with JWST/NIRSpec (). COSMOS-z10-1 and COSMOS-z10-2 are also suggested to be at and , respectively, based on follow-up JWST/NIRSpec observations (J. Weaver et al. in prep.; N. Nezhad et al. in prep.). J2140+0241 is still not conclusively identified due to a lack of new data.
- 4.
The reasons that caused the previous misclassification are summarised into the following three points: difficulty of deblending due to coarse spatial resolution of Spitzer/IRAC, lack of multiple filters that continuously trace continuum emission, and insufficient deep observation at blueward of the Lyman break.
- 5.
Based on JADES and CANUCS data, we have found that increasing the threshold value, which traces the Lyman break colour, can reduce low- interlopers while keeping many of the true galaxies. We have also confirmed that low- interlopers reported so far are brighter than the characteristic magnitude of UV luminosity functions, where the number density rapidly decreases. Thus, low- interlopers can be much more abundant than the true high- galaxies. Since upcoming wide-field surveys will search for bright Lyman break galaxies, constructing reliable high- candidate samples for efficient spectroscopic follow-up observations requires stringent Lyman break criteria, high-resolution imaging, wide wavelength coverage, and sufficiently deep observations at short wavelengths.
Acknowledgements
We appreciate the anonymous referee’s constructive feedback, which significantly improved the manuscript. We thank Yoshihisa Asada and Georgios Magdis for insightful discussions. We also acknowledge ALMA Helpdesk staff members for calibrating the ALMA datasets. This work was supported by JSPS KAKENHI Grant Numbers JP22H04939, JP23H00131, JP24H00002, JP26H02069, and JP26K17200. T.H. was supported by Leading Initiative for Excellent Young Researchers, MEXT, Japan (HJH02007) and by JSPS KAKENHI grant Nos. JP23K22529 and JP25K00020. Y.S. and K.M. acknowledge the Waseda University Grant for Special Research Projects (Project number: 2025E-019 and 2025C-484). J.R.W. acknowledges that support for this work was provided by The Brinson Foundation through a Brinson Prize Fellowship grant. This paper makes use of the following ALMA data: ADS/JAO.ALMA#2019.1.00397.S and ADS/JAO.ALMA#2021.1.01396.S. ALMA is a partnership of ESO (representing its member states), NSF (USA) and NINS (Japan), together with NRC (Canada), MOST and ASIAA (Taiwan), and KASI (Republic of Korea), in cooperation with the Republic of Chile. The Joint ALMA Observatory is operated by ESO, AUI/NRAO and NAOJ.
Data Availability
All data utilised in this work is available upon reasonable request to the corresponding author.
References
- The impact of medium-width bands on the selection and subsequent luminosity function measurements of high-z galaxies. MNRAS 542 (3), pp. 1705–1729. External Links: Document, 2502.10282 Cited by: §1, §5.2.1.
- Discovery and properties of ultra-high redshift galaxies (9 < z < 12) in the JWST ERO SMACS 0723 Field. MNRAS 518 (3), pp. 4755–4766. External Links: Document, 2207.11217 Cited by: §1.
- REBELS-IFU: on the origin of the elevated [OIII]/[CII] ratios in the early Universe. arXiv e-prints, pp. arXiv:2509.16071. External Links: Document, 2509.16071 Cited by: §1.
- Cold dust and low [O III]/[C II] ratios: an evolved star-forming population at redshift 7. MNRAS 527 (3), pp. 6867–6887. External Links: Document, 2301.09659 Cited by: §1.
- Confirmation and refutation of very luminous galaxies in the early Universe. Nature 622 (7984), pp. 707–711. External Links: Document, 2303.15431 Cited by: §1, Figure 5, §5.2.1.
- Earliest Galaxy Evolution in the CANUCS+Technicolor Fields: Galaxy Properties at z 10─16 Seen with the Full NIRCam Medium- and Broadband Filters. ApJ 996 (2), pp. 115. External Links: Document, 2507.03124 Cited by: §1, §5.2.1.
- JWST UNCOVER: discovery of z > 9 galaxy candidates behind the lensing cluster Abell 2744. MNRAS 524 (4), pp. 5486–5496. External Links: Document, 2305.01793 Cited by: §5.2.1.
- Revealing galaxy candidates out to z 16 with JWST observations of the lensing cluster SMACS0723. MNRAS 519 (1), pp. 1201–1220. External Links: Document, 2207.12338 Cited by: §1.
- UV Luminosity Functions at Redshifts z 4 to z 10: 10,000 Galaxies from HST Legacy Fields. ApJ 803 (1), pp. 34. External Links: Document, 1403.4295 Cited by: §1.
- The Bright End of the z 9 and z 10 UV Luminosity Functions Using All Five CANDELS Fields*. ApJ 830 (2), pp. 67. External Links: Document, 1506.01035 Cited by: Figure 5, §5.2.1.
- Newly Discovered Bright z 9-10 Galaxies and Improved Constraints on Their Prevalence Using the Full CANDELS Area. ApJ 880 (1), pp. 25. External Links: Document, 1905.05202 Cited by: §5.1, footnote 1.
- A lack of evolution in the very bright end of the galaxy luminosity function from z ≃ 8 to 10. MNRAS 493 (2), pp. 2059–2084. External Links: Document, 1911.12832 Cited by: Figure 5, §5.2.1, footnote 14.
- Photutils External Links: Document, Link Cited by: Appendix B.
- EAZY: A Fast, Public Photometric Redshift Code. ApJ 686 (2), pp. 1503–1513. External Links: Document, 0807.1533 Cited by: §4.
- The Super Eight Galaxies: Properties of a Sample of Very Bright Galaxies at 7 < z < 8. ApJ 882 (1), pp. 42. External Links: Document, 1907.05512 Cited by: §2.1.
- JADES NIRSpec initial data release for the Hubble Ultra Deep Field: Redshifts and line fluxes of distant galaxies from the deepest JWST Cycle 1 NIRSpec multi-object spectroscopy. A&A 690, pp. A288. External Links: Document, 2306.02467 Cited by: §5.2.1.
- Neutral outflows in high-z QSOs. A&A 674, pp. L5. External Links: Document, 2305.04098 Cited by: Figure 3, §3.3, §3.3.
- Resolving the ISM at the Peak of Cosmic Star Formation with ALMA: The Distribution of CO and Dust Continuum in z 2.5 Submillimeter Galaxies. ApJ 863 (1), pp. 56. External Links: Document, 1804.06852 Cited by: §3.2.1.
- The Dust Content and Opacity of Actively Star-forming Galaxies. ApJ 533 (2), pp. 682–695. External Links: Document, astro-ph/9911459 Cited by: §4.
- Planck’s dusty GEMS: The brightest gravitationally lensed galaxies discovered with the Planck all-sky survey. A&A 581, pp. A105. External Links: Document, 1506.01962 Cited by: §3.3.
- Planck’s dusty GEMS. VI. Multi-J CO excitation and interstellar medium conditions in dusty starburst galaxies at z = 2-4. A&A 620, pp. A61. External Links: Document, 1811.11215 Cited by: Figure 3.
- Inferring the star formation histories of massive quiescent galaxies with BAGPIPES: evidence for multiple quenching mechanisms. MNRAS 480 (4), pp. 4379–4401. External Links: Document, 1712.04452 Cited by: §4.
- Extended ionised and clumpy gas in a normal galaxy at z = 7.1 revealed by ALMA. A&A 605, pp. A42. External Links: Document, 1701.03468 Cited by: §1.
- The eventful life of a luminous galaxy at z = 14: metal enrichment, feedback, and low gas fraction?. A&A 696, pp. A87. External Links: Document, 2409.20533 Cited by: §1, §3.2.3.
- Spectroscopic confirmation of two luminous galaxies at a redshift of 14. Nature 633 (8029), pp. 318–322. External Links: Document, 2405.18485 Cited by: Figure 5.
- The ALMA Wideband Sensitivity Upgrade. In Physics and Chemistry of Star Formation: The Dynamical ISM Across Time and Spatial Scales, V. Ossenkopf-Okada, R. Schaaf, I. Breloy, and J. Stutzki (Eds.), pp. 304. External Links: Document, 2211.00195 Cited by: §5.2.3.
- Pushing JWST to the extremes: search and scrutiny of bright galaxy candidates at z15-30. arXiv e-prints, pp. arXiv:2504.05893. External Links: Document, 2504.05893 Cited by: §1.
- Early Results from GLASS-JWST. XIX. A High Density of Bright Galaxies at z 10 in the A2744 Region. ApJ 948 (2), pp. L14. External Links: Document, 2212.06666 Cited by: Figure 5.
- Early Results from GLASS-JWST. III. Galaxy Candidates at z 9-15. ApJ 938 (2), pp. L15. External Links: Document, 2207.09436 Cited by: §1.
- JWST NIRSpec Spectroscopy of the Remarkable Bright Galaxy GHZ2/GLASS-z12 at Redshift 12.34. ApJ 972 (2), pp. 143. External Links: Document, 2403.10238 Cited by: Figure 5.
- A Spatially Resolved Study of Cold Dust, Molecular Gas, H II Regions, and Stars in the z = 2.12 Submillimeter Galaxy ALESS67.1. ApJ 846 (2), pp. 108. External Links: Document, 1708.08937 Cited by: §3.2.1.
- An ALMA Survey of Submillimeter Galaxies in the Extended Chandra Deep Field South: Near-infrared Morphologies and Stellar Sizes. ApJ 799 (2), pp. 194. External Links: Document, 1412.0668 Cited by: §3.2.1.
- Spectroscopic confirmation of four metal-poor galaxies at z = 10.3-13.2. Nature Astronomy 7, pp. 622–632. External Links: Document, 2212.04568 Cited by: Figure 5.
- On the Effect of the Cosmic Microwave Background in High-redshift (Sub-)millimeter Observations. ApJ 766 (1), pp. 13. External Links: Document, 1302.0844 Cited by: §3.2.1.
- The evolution of the galaxy UV luminosity function at redshifts z ≃ 8 - 15 from deep JWST and ground-based near-infrared imaging. MNRAS 518 (4), pp. 6011–6040. External Links: Document, 2207.12356 Cited by: §1, Figure 5.
- JADES Data Release 3: NIRSpec/Microshutter Assembly Spectroscopy for 4000 Galaxies in the GOODS Fields. ApJS 277 (1), pp. 4. External Links: Document, 2404.06531 Cited by: §5.2.1.
- Overview of the JWST Advanced Deep Extragalactic Survey (JADES). arXiv e-prints, pp. arXiv:2306.02465. External Links: Document, 2306.02465 Cited by: §5.2.1.
- Euclid: I. Overview of the Euclid mission. A&A 697, pp. A1. External Links: Document, 2405.13491 Cited by: §5.2.3.
- Euclid preparation. XVII. Cosmic Dawn Survey: Spitzer Space Telescope observations of the Euclid deep fields and calibration fields. A&A 658, pp. A126. External Links: Document, 2110.13928 Cited by: §5.2.3.
- The Infrared Array Camera (IRAC) for the Spitzer Space Telescope. ApJS 154 (1), pp. 10–17. External Links: Document, astro-ph/0405616 Cited by: §5.1.
- A Long Time Ago in a Galaxy Far, Far Away: A Candidate z 12 Galaxy in Early JWST CEERS Imaging. ApJ 940 (2), pp. L55. External Links: Document, 2207.12474 Cited by: §1, §4.
- CEERS Key Paper. I. An Early Look into the First 500 Myr of Galaxy Formation with JWST. ApJ 946 (1), pp. L13. External Links: Document, 2211.05792 Cited by: §1, Figure 5.
- A Census of the Bright z = 8.5-11 Universe with the Hubble and Spitzer Space Telescopes in the CANDELS Fields. ApJ 928 (1), pp. 52. External Links: Document, 2106.13813 Cited by: Figure 7, §2.1, §2.1, §2.3, Table 1, §3.3, §4, §4, §4, §4, §4, §5.1, §5.2.1.
- The Evolution of the Galaxy Rest-frame Ultraviolet Luminosity Function over the First Two Billion Years. ApJ 810 (1), pp. 71. External Links: Document, 1410.5439 Cited by: §1.
- Estimating dust temperature and Far-IR luminosity of high-redshift galaxies using ALMA single-band continuum observations. MNRAS 521 (2), pp. 2962–2968. External Links: Document, 2206.01879 Cited by: §3.3.
- UNCOVER: A NIRSpec Census of Lensed Galaxies at z = 8.50–13.08 Probing a High-AGN Fraction and Ionized Bubbles in the Shadow. ApJ 977 (2), pp. 250. External Links: Document, 2308.11609 Cited by: §5.2.1.
- Ultra High-Redshift or Closer-by, Dust-Obscured Galaxies? Deciphering the Nature of Faint, Previously Missed F200W-Dropouts in CEERS. arXiv e-prints, pp. arXiv:2502.02637. External Links: Document, 2502.02637 Cited by: §1, §1.
- GREX-PLUS Science Book. arXiv e-prints, pp. arXiv:2304.08104. External Links: Document, 2304.08104 Cited by: §5.2.3.
- JWST, ALMA, and Keck Spectroscopic Constraints on the UV Luminosity Functions at z 7–14: Clumpiness and Compactness of the Brightest Galaxies in the Early Universe. ApJ 980 (1), pp. 138. External Links: Document, 2406.18352 Cited by: §1, §1, §5.2.1, §5.2.2, footnote 14.
- A Search for H-Dropout Lyman Break Galaxies at z 12-16. ApJ 929 (1), pp. 1. External Links: Document, 2112.09141 Cited by: Figure 5, §5.2.2, footnote 14.
- Pure Spectroscopic Constraints on UV Luminosity Functions and Cosmic Star Formation History from 25 Galaxies at z = 8.61-13.20 Confirmed with JWST/NIRSpec. ApJ 960 (1), pp. 56. External Links: Document, 2304.06658 Cited by: §5.2.1.
- GOLDRUSH. IV. Luminosity Functions and Clustering Revealed with 4,000,000 Galaxies at z 2-7: Galaxy-AGN Transition, Star Formation Efficiency, and Implication for Evolution at z > 10. ApJS 259 (1), pp. 20. External Links: Document, 2108.01090 Cited by: §1.
- Large Population of ALMA Galaxies at z > 6 with Very High [O III] 88 m to [C II] 158 m Flux Ratios: Evidence of Extremely High Ionization Parameter or PDR Deficit?. ApJ 896 (2), pp. 93. External Links: Document, 1910.10927 Cited by: §1.
- A Comprehensive Study of Galaxies at z 9-16 Found in the Early JWST Data: Ultraviolet Luminosity Functions and Cosmic Star Formation History at the Pre-reionization Epoch. ApJS 265 (1), pp. 5. External Links: Document, 2208.01612 Cited by: §1.
- Big Three Dragons: A z = 7.15 Lyman-break galaxy detected in [O III] 88 m, [C II] 158 m, and dust continuum with ALMA. PASJ 71 (4), pp. 71. External Links: Document, 1806.00486 Cited by: §1.
- Detections of [O III] 88 m in two quasars in the reionization epoch. PASJ 71 (6), pp. 109. External Links: Document, 1811.00030 Cited by: §1.
- The onset of star formation 250 million years after the Big Bang. Nature 557 (7705), pp. 392–395. External Links: Document, 1805.05966 Cited by: §1.
- Photometric detection at 7.7 m of a galaxy beyond redshift 14 with JWST/MIRI. Nature Astronomy 9, pp. 729–740. External Links: Document, 2405.18462 Cited by: Figure 5.
- ALESS-JWST: Joint (Sub)kiloparsec JWST and ALMA Imaging of z ~3 Submillimeter Galaxies Reveals Heavily Obscured Bulge Formation Events. ApJ 978 (2), pp. 165. External Links: Document, 2407.15846 Cited by: §3.2.1.
- ALMA Will Determine the Spectroscopic Redshift z > 8 with FIR [O III] Emission Lines. ApJ 780 (2), pp. L18. External Links: Document, 1312.0684 Cited by: §1.
- Radiative equilibrium estimates of dust temperature and mass in high-redshift galaxies. MNRAS 495 (2), pp. 1577–1592. External Links: Document, 2004.12612 Cited by: §3.3.
- Detection of an oxygen emission line from a high-redshift galaxy in the reionization epoch. Science 352 (6293), pp. 1559–1562. External Links: Document, 1606.04989 Cited by: §1.
- Hubble Frontier Fields First Complete Cluster Data: Faint Galaxies at z ~5-10 for UV Luminosity Functions and Cosmic Reionization. ApJ 799 (1), pp. 12. External Links: Document, 1408.6903 Cited by: §1.
- Precise Strong Lensing Mass Modeling of Four Hubble Frontier Field Clusters and a Sample of Magnified High-redshift Galaxies. ApJ 819 (2), pp. 114. External Links: Document, 1510.06400 Cited by: §1.
- Highly-ionized gas in lensed z = 6.027 Little Red Dot seen through [OIII] 88m with ALMA. arXiv e-prints, pp. arXiv:2512.05097. External Links: Document, 2512.05097 Cited by: §1.
- Frontier Fields: Combining HST, VLT, and Spitzer data to explore the z ~8 Universe behind the lensing cluster MACSJ0416.1-2403. A&A 575, pp. A92. External Links: Document, 1412.1089 Cited by: §2.1.
- Euclid Definition Study Report. arXiv e-prints, pp. arXiv:1110.3193. External Links: Document, 1110.3193 Cited by: §5.2.3.
- High-J CO versus Far-infrared Relations in Normal and Starburst Galaxies. ApJ 810 (2), pp. L14. External Links: Document, 1504.05897 Cited by: Figure 3, §3.3, §3.3.
- Galaxy growth in a massive halo in the first billion years of cosmic history. Nature 553 (7686), pp. 51–54. External Links: Document, 1712.03020 Cited by: §1.
- CASA Architecture and Applications. In Astronomical Data Analysis Software and Systems XVI, R. A. Shaw, F. Hill, and D. J. Bell (Eds.), Astronomical Society of the Pacific Conference Series, Vol. 376, pp. 127. Cited by: §3.1.
- ASTRODEEP-JWST: NIRCam-HST multi-band photometry and redshifts for half a million sources in six extragalactic deep fields. A&A 691, pp. A240. External Links: Document, 2409.00169 Cited by: §2.3, Table 1, §5.1.
- Physical Characterization of Early Galaxies in the Webb’s First Deep Field SMACS J0723.3-7323. ApJ 946 (2), pp. L35. External Links: Document, 2207.11671 Cited by: §1.
- The Bright-end Galaxy Candidates at z 9 from 79 Independent HST Fields. ApJ 867 (2), pp. 150. External Links: Document, 1809.07604 Cited by: Figure 10, §2.1, §2.1, Table 1.
- Two Remarkably Luminous Galaxy Candidates at z 10-12 Revealed by JWST. ApJ 940 (1), pp. L14. External Links: Document, 2207.09434 Cited by: Figure 5.
- Two Remarkably Luminous Galaxy Candidates at z 10-12 Revealed by JWST. ApJ 940 (1), pp. L14. External Links: Document, 2207.09434 Cited by: §1.
- Seven wonders of Cosmic Dawn: JWST confirms a high abundance of galaxies and AGN at z ≃ 9–11 in the GLASS field. A&A 693, pp. A50. External Links: Document, 2410.10967 Cited by: Figure 5.
- Roman Observations Time Allocation Committee: Final Report and Recommendations. arXiv e-prints, pp. arXiv:2505.10574. External Links: Document, 2505.10574 Cited by: §5.2.3.
- The Most Luminous z ~9-10 Galaxy Candidates Yet Found: The Luminosity Function, Cosmic Star-formation Rate, and the First Mass Density Estimate at 500 Myr. ApJ 786 (2), pp. 108. External Links: Document, 1309.2280 Cited by: §1.
- The Dearth of z 10 Galaxies in All HST Legacy Fields—The Rapid Evolution of the Galaxy Population in the First 500 Myr. ApJ 855 (2), pp. 105. External Links: Document, 1710.11131 Cited by: §2.1.
- Secondary standard stars for absolute spectrophotometry.. ApJ 266, pp. 713–717. External Links: Document Cited by: §1.
- Great Optically Luminous Dropout Research Using Subaru HSC (GOLDRUSH). I. UV luminosity functions at z 4-7 derived with the half-million dropouts on the 100 deg sky. PASJ 70, pp. S10. External Links: Document, 1704.06004 Cited by: §1.
- Life beyond 30: Probing the -20 < M < -17 Luminosity Function at 8 < z < 13 with the NIRCam Parallel Field of the MIRI Deep Survey. ApJ 951 (1), pp. L1. External Links: Document, 2302.02429 Cited by: §5.2.2.
- The Rise of the Galactic Empire: Ultraviolet Luminosity Functions at z 17 and z 25 Estimated with the MIDIS+NGDEEP Ultra-deep JWST/NIRCam Data Set. ApJ 991 (2), pp. 179. External Links: Document, 2503.15594 Cited by: §1.
- Planck 2018 results. VI. Cosmological parameters. A&A 641, pp. A6. External Links: Document, 1807.06209 Cited by: §1.
- Updated Measurements of [O III] 88 m, [C II] 158 m, and Dust Continuum Emission from a z = 7.2 Galaxy. ApJ 945 (1), pp. 69. External Links: Document, 2302.02365 Cited by: §1.
- The Complete Redshift Distribution of Dusty Star-forming Galaxies from the SPT-SZ Survey. ApJ 902 (1), pp. 78. External Links: Document, 2006.14060 Cited by: §3.3.
- The GADOT Galaxy Survey: Dense Gas and Feedback in Herschel-selected Starburst Galaxies at Redshifts 2 to 6. ApJ 913 (2), pp. 141. External Links: Document, 2101.11006 Cited by: Figure 3, §3.3, §3.3.
- Do Unusually Cold Starburst Galaxies Exist? A Case Study. ApJ 980 (1), pp. 59. External Links: Document, 2401.05487 Cited by: Figure 3, §3.3, §3.3.
- JADES Initial Data Release for the Hubble Ultra Deep Field: Revealing the Faint Infrared Sky with Deep JWST NIRCam Imaging. ApJS 269 (1), pp. 16. External Links: Document, 2306.02466 Cited by: §5.2.1.
- The Science Performance of JWST as Characterized in Commissioning. PASP 135 (1046), pp. 048001. External Links: Document, 2207.05632 Cited by: §4.
- Identification and properties of intense star-forming galaxies at redshifts z > 10. Nature Astronomy 7, pp. 611–621. External Links: Document, 2212.04480 Cited by: Figure 5.
- JWST unveils heavily obscured (active and passive) sources up to z 13. MNRAS 518 (1), pp. L19–L24. External Links: Document, 2208.02825 Cited by: §1.
- The Herschel Comprehensive (U)LIRG Emission Survey (HERCULES): CO Ladders, Fine Structure Lines, and Neutral Gas Cooling. ApJ 801 (2), pp. 72. External Links: Document, 1501.02985 Cited by: Figure 3, §3.3.
- RELICS: A Candidate z 10 Galaxy Strongly Lensed into a Spatially Resolved Arc. ApJ 864 (1), pp. L22. External Links: Document, 1801.03103 Cited by: §2.1.
- CANUCS/Technicolor Data Release 1: Imaging, Photometry, Slit Spectroscopy, and Stellar Population Parameters. arXiv e-prints, pp. arXiv:2506.21685. External Links: Document, 2506.21685 Cited by: §5.2.1.
- JWST/NIRSpec spectroscopy of intermediate-mass quiescent galaxies at z 3-4. MNRAS 534 (4), pp. 3552–3564. External Links: Document, 2410.08745 Cited by: §1, Figure 5, §5.2.2, footnote 14.
- The Luminosity Function at z ~8 from 97 Y-band Dropouts: Inferences about Reionization. ApJ 786 (1), pp. 57. External Links: Document, 1402.4129 Cited by: §1.
- Detection of [O III] in JADES-GS-z14-0 at z = 14.1793. ApJ 988 (1), pp. 19. External Links: Document, 2409.20549 Cited by: §1, §3.2.3.
- Dust temperature and mid-to-total infrared color distributions for star-forming galaxies at 0 < z < 4. A&A 609, pp. A30. External Links: Document, 1710.10276 Cited by: §3.3.
- COSMOS2025: The COSMOS-Web galaxy catalog of photometry, morphology, redshifts, and physical parameters from JWST, HST, and ground-based imaging. arXiv e-prints, pp. arXiv:2506.03243. External Links: Document, 2506.03243 Cited by: §2.3, §4.
- Warm Molecular Gas in the Primeval Galaxy IRAS 10214+4724. ApJ 398, pp. L29. External Links: Document Cited by: §3.3.
- The ALMA REBELS Survey: cosmic dust temperature evolution out to z 7. MNRAS 513 (3), pp. 3122–3135. External Links: Document, 2202.01227 Cited by: §3.3.
- Galaxies in the First Billion Years After the Big Bang. ARA&A 54, pp. 761–803. External Links: Document Cited by: §1.
- The Brightest z 8 Galaxies over the COSMOS UltraVISTA Field. ApJ 883 (1), pp. 99. External Links: Document, 1902.10713 Cited by: §2.1.
- Deep Imaging of redshift QSO Fields Below the Lyman Limit. I. The Field of Q0000-263 and galaxies at Z= 3.4. AJ 104, pp. 941. External Links: Document Cited by: §1.
- JADES Imaging of GN-z11: Revealing the Morphology and Environment of a Luminous Galaxy 430 Myr after the Big Bang. ApJ 952 (1), pp. 74. External Links: Document, 2302.07234 Cited by: Figure 5.
- ALMA High-J CO Spectroscopy of High-Redshift Galaxies. I. An Archive-based Catalog of CO Spectral Line Energy Distributions. arXiv e-prints, pp. arXiv:2602.23521. External Links: Document, 2602.23521 Cited by: §3.3.
- Detection of the Far-infrared [O III] and Dust Emission in a Galaxy at Redshift 8.312: Early Metal Enrichment in the Heart of the Reionization Era. ApJ 874 (1), pp. 27. External Links: Document, 1806.04132 Cited by: §1.
- Spectroscopic Confirmation of Two Lyman Break Galaxies at Redshift Beyond 7. ApJ 730 (2), pp. L35. External Links: Document, 1011.5500 Cited by: §1.
- COSMOS2020: A Panchromatic View of the Universe to z10 from Two Complementary Catalogs. ApJS 258 (1), pp. 11. External Links: Document, 2110.13923 Cited by: §2.1, §2.1, Table 1.
- A Steep Decline in the Galaxy Space Density beyond Redshift 9 in the CANUCS UV Luminosity Function. ApJ 966 (1), pp. 74. External Links: Document, 2311.12234 Cited by: §1.
- The Near-infrared Imager and Slitless Spectrograph for the James Webb Space Telescope. II. Wide Field Slitless Spectroscopy. PASP 134 (1032), pp. 025002. External Links: Document, 2202.01714 Cited by: §5.2.1.
- On the origins of oxygen: ALMA and JWST characterise the multi-phase, metal-enriched, star-bursting medium within a ’normal’ galaxy. arXiv e-prints, pp. arXiv:2507.22888. External Links: Document, 2507.22888 Cited by: §1, §3.2.3.
- Dual constraints with ALMA: new [O III] 88-m and dust-continuum observations reveal the ISM conditions of luminous LBGs at z 7. MNRAS 515 (2), pp. 1751–1773. External Links: Document, 2207.00022 Cited by: §1.
- ALMA Detections of [O III] and [C II] Emission Lines From A1689-zD1 at z = 7.13. ApJ 929 (2), pp. 161. External Links: Document Cited by: §1.
- ALMA Detection of [O III] 88 m at z = 12.33: Exploring the Nature and Evolution of GHZ2 as a Massive Compact Stellar System. ApJ 977 (1), pp. L9. External Links: Document, 2411.03593 Cited by: §1, §3.2.3.
- Dusty Starbursts Masquerading as Ultra-high Redshift Galaxies in JWST CEERS Observations. ApJ 943 (2), pp. L9. External Links: Document, 2208.01816 Cited by: §1, §5.2.1.
- A magnified young galaxy from about 500 million years after the Big Bang. Nature 489 (7416), pp. 406–408. External Links: Document, 1204.2305 Cited by: §1.
- Lyman Emission from a Luminous z = 8.68 Galaxy: Implications for Galaxies as Tracers of Cosmic Reionization. ApJ 810 (1), pp. L12. External Links: Document, 1507.02679 Cited by: §1.
Appendix A The full spectra and continuum image of all six galaxies
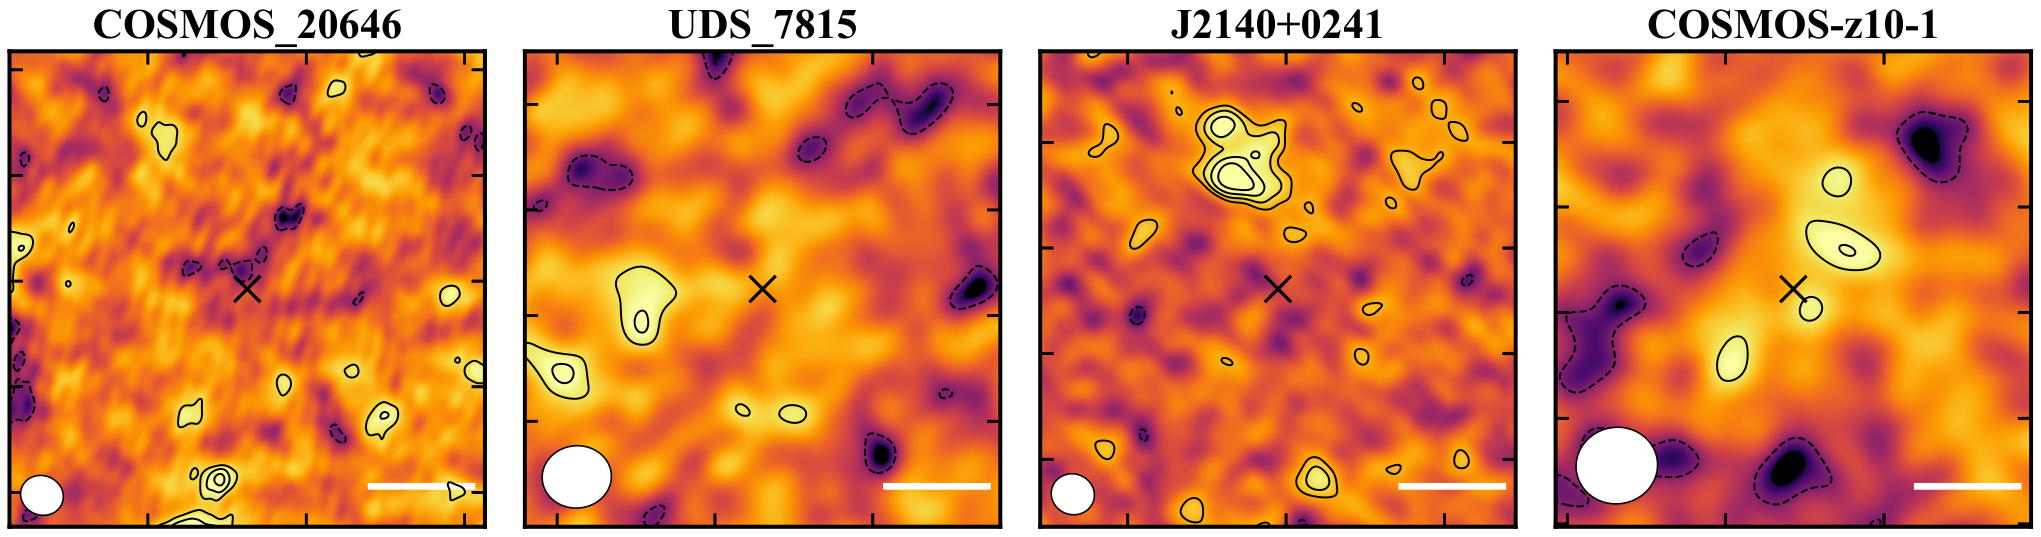
This appendix presents the continuum maps for COSMOS_20646, UDS_7815, J2140+0241, and COSMOS-z10-1 (Figure 6), as well as full-band spectra for all six targets (Figures 7–12). No continuum or line emission is detected in any source other than UDS_18697 and COSMOS-z10-2. Although a signal is found near the position of COSMOS-z10-1, we do not regard it as a continuum emission from the source, because it is spatially offset from the reported object position and other signals with comparable significance level are also found within the same field of view.
Appendix B Reliability of the line in UDS_18697
To evaluate the reliability of the line features in UDS_18697 and COSMOS-z10-2, we searched for clumps with the same or higher as the line features, as follows. First, we created moment-0 maps over the entire continuum-subtracted cube using a velocity width corresponding to approximately twice the FWHM of the lines. We then performed a line search over the full field of view (FoV) of each moment-0 map using the find_peaks in photutils (13), and recorded the number of positive clumps . We also searched for peaks on the inverted moment-0 maps to count the number of spurious sources. Since we expect no real sources with negative signals, the number of clumps in inverted maps () provides an estimate of the number of false positives. The expected number of clumps within a circle from the target was then derived by scaling the number of clumps by the ratio of the area of the circle to the FoV area. Radii of the circles were set to 1 arcsec for UDS_18697 and 1.5 arcsec for COSMOS-z10-2, respectively, taking the larger beam size in COSMOS-z10-2 data into account.
We obtained and for UDS_18697, and and for COSMOS-z10-2. Although the origin of the factor of difference between and remains unclear, it may be due to statistical fluctuations. To evaluate the probability of obtaining spurious detection, we assume that the number of such signals follows a Poisson distribution. This gives probabilities of for UDS_18697 and for COSMOS-z10-2. For UDS_18697, given that the redshift inferred from the line is consistent with the NIRSpec redshift, we identify the line as the CO() at . For COSMOS-z10-2, on the other hand, we do not claim the detection because the probability of a spurious signal is non-negligible, as well as the signal is spatially offset from the target position and the redshift remains uncertain.