7862
\vgtccategoryResearch
\vgtcinsertpkg\authorfooter• Ziyao Kang, Yiping Sun, Linxuan Tian, Henghuan Qu, and Jiazhi Xia are with the Central South University. E-mail: {kangzy, yipingsun, tianlinxuan, 8203240620, xiajiazhi}@csu.edu.cn.
• Wei Zeng is with the Hong Kong University of Science and Technology (Guangzhou) and the Hong Kong University of Science and Technology. E-mail: weizeng@hkust-gz.edu.cn.
• Jiazhi Xia is the corresponding author.
\teaser![[Uncaptioned image]](2608.11581v1/Case1.png) Case I: RAGE-Vis supports relation-aware editing of a chart image. Starting from an uploaded mirrored bar chart, the system parses the visual content, reconstructs it into editable code, and generates a visual editing panel. Users can then iteratively issue natural-language requests, such as resizing the chart and changing its color style, adding new data and highlighting the maximum value, and reversing the data order. For each request, the system exposes both target fields and affected fields, enabling coordinated controls across related components.
Case I: RAGE-Vis supports relation-aware editing of a chart image. Starting from an uploaded mirrored bar chart, the system parses the visual content, reconstructs it into editable code, and generates a visual editing panel. Users can then iteratively issue natural-language requests, such as resizing the chart and changing its color style, adding new data and highlighting the maximum value, and reversing the data order. For each request, the system exposes both target fields and affected fields, enabling coordinated controls across related components.
Introduction
RAGE-Vis: A Relation-Aware Generative Editing Interface for Natural Language-Based Chart Editing
Abstract
Natural language offers an easy way for users to express chart editing intents, which are often composite and cross‑component (e.g., adjusting style, extending categories, highlighting values). However, existing methods typically map instructions to a single operation or widget, limiting their ability to handle high‑level requests and often producing locally plausible but globally inconsistent results due to a lack of awareness of relationships between chart components. To address these challenges, we introduce RAGE-Vis, a Relation-Aware Generative Editing interface for natural language-based chart editing. The system supports bitmap chart images as input and converts them into an editable parameterized intermediate representation. Instead of mapping instructions to a single edit or widget, RAGE-Vis parses composite intents, identifies targets and scopes, and generates hierarchical editing panels for underspecified requests, enabling users to adjust both global settings and local parameters. Furthermore, RAGE-Vis identifies potentially affected fields based on visual encoding relations, structural relations, and expressive consistency relations, and organizes them into actionable widgets to support cross-component coordinated controls. Through two case studies, we demonstrate the applicability of RAGE-Vis in complex editing tasks, including style adjustment, data extension, order rearrangement, legend layout, and color mapping. A user study further shows that participants can effectively handle underspecified requests, explore candidate alternatives, and maintain cross-component consistency with RAGE-Vis.
keywords
Chart Editing, Visual Editing, Generative User Interfaces, Natural Language Interfaces, Large Language Models.Charts are among the most pervasive visualization forms for data analysis and information dissemination. Advances in visualization authoring tools enable users to construct and refine charts via declarative grammars, direct manipulation interfaces, or automated generation pipelines [36, 25, 35, 34, 20, 5, 47, 54]. However, practical editing needs often appear as composite requests with high-level objectives, underspecified descriptions, and multiple subtasks. For example, “make the chart more coordinated”, “highlight the peak value”, or “add a new category while maintaining stylistic consistency”. While intuitive for users, such natural language instructions pose technical challenges in decoding user intent, accurately identifying target objects, and maintaining consistency across interconnected chart components.
A growing body of research has explored natural language interfaces (NLIs) for visualization [38, 52], demonstrating that natural language can significantly lower the barrier for expressing chart authoring and editing intents. However, purely language-based interaction often sacrifices the fine-grained control, immediate visual feedback, and repeatability afforded by GUIs. To bridge this gap, prior systems have introduced dynamically generated UI widgets or mixed-input interaction mechanisms [10, 5, 51, 50]. DynaVis [47] further demonstrates the value of this hybrid paradigm: by dynamically synthesizing persistent UI widgets, it allows users to iteratively adjust parameters and receive immediate feedback, reducing the cognitive burden of recalling precise commands or navigating complex menus. More broadly, PUMICE [18] and research on sketch-based visual queries [15] suggest that combining multiple interaction mechanisms helps narrow the gulf of execution between high-level goals and executable operations. Together, these works indicate that combining the expressiveness of natural language with the controllability of directly manipulable widgets is a promising direction for natural language-driven chart editing.
However, simply translating natural language requests into actionable widgets is insufficient for complex chart editing. A chart is not a disparate collection of isolated visual elements. Its components, including marks, legends, axes, labels, and annotations, are connected through visual encodings, structural dependencies, and expressive goals. As a result, editing one component may require coordinated controls to related components. Without preserving such relationships during the editing process, a system may yield results that are locally valid but globally inconsistent, even if it successfully generates interactive widgets.
To address these challenges, we introduce RAGE-Vis, a Relation-Aware Generative Editing interface for natural language-based chart editing. RAGE-Vis first parses composite editing intents from user input, decomposes them into multiple sub-intents, and identifies underspecified target objects, parameters, and operational scopes. Based on the parsed intents, the system \colorblackgenerates global-to-local editing panels for underspecified requests, enabling users to compare diverse design alternatives and refine local parameters after selecting global strategies. Furthermore, RAGE-Vis identifies relationships among chart components regarding visual encoding consistency, structural integrity, and expressive consistency. By leveraging these dependencies, the system enables coordinated controls across related components to ensure globally coherent editing outcomes. We evaluate RAGE-Vis through two case studies and a within-subjects user study. The case studies demonstrate its applicability to relation-aware editing across mirrored bar and radar charts. The user study compares RAGE-Vis with a baseline without Design Presets and Affected Fields, showing that RAGE-Vis reduces additional natural language requests and model response time, while better supporting alternative comparison, related-component discovery, and consistency maintenance.
The main contributions of this work are:
- •
We design and implement RAGE-Vis that integrates composite intent parsing, candidate panel generation, and cross-component coordinated editing into a unified workflow.
- •
We propose a chart-component relation approach that captures visual encoding, structural, and expressive consistency relations to support cross-component controls.
- •
We evaluate the effectiveness of RAGE-Vis through two case studies and a user study, demonstrating its ability to handle underspecified editing requests, generate actionable alternatives, and maintain cross-component consistency.
1 Related Work
1.1 Chart Editing
Chart editing aims to support users in modifying the data, visual encodings, layouts, textual annotations, and styles of existing visualizations. Early work improved chart editability through declarative grammars and template reuse [36, 25], direct-manipulation chart construction [35, 34, 20], D3 deconstruction and restyling [12], and example-driven synthesis [49]. Although these approaches provide substantial structural plasticity, they typically require users to explicitly specify editing targets, visual channels, or example mappings, falling short in accommodating high-level and underspecified intentions from non-expert users. With the development of interaction techniques and AI, existing work has evolved from low-level constrained operations toward high-level intent-driven paradigms. Existing work covers dynamic interface generation [5], high-level intent-driven data transformation [51, 50], and specific editing tasks such as financial narrative annotation, bitmap chart redesign, and static-to-live chart transformation [41, 11, 37, 58].
However, representative intent-driven systems still face limitations in flexibility. For example, DynaVis [47] synthesizes persistent interactive UI widgets from natural language instructions and allows users to further refine parameters. However, it does not explicitly decompose vague or composite intents into sub-intents. DataWink [54] supports example-based style reuse, but its effectiveness depends on the quality of reference charts and remains limited in supporting text-driven underspecified intentions when explicit visual references are absent. These systems tend to map composite instructions as a whole, lacking an explicit mechanism to hierarchically present candidate solutions for underspecified intents.
Recently, MLLMs have been used to explore chart editing tasks [60]. Benchmarks such as ChartM3 [56], FigEdit [17], ChartEdit [61], and ChartEditBench [13] show that charts are structured expressions constrained by graphical grammars. Models remain prone to errors in semantic consistency, structural preservation, visual localization, and multi-turn state maintenance. In summary, existing work has made progress in executing explicit editing intentions, but challenges remain in the hierarchical parsing of ambiguous intentions and the maintenance of cross-component consistency. Our work focuses on decomposing composite instructions and enabling relation-aware coordinated editing to support precise and efficient chart editing while preserving global consistency.
1.2 Natural Language Interfaces for Visualization
Natural language interfaces (NLIs) have become an important interaction paradigm in data visualization [40]. Early work mainly focused on mapping natural language to data attributes, analytical tasks, and visualization specifications [43, 10, 28]. Later works improved natural language-driven visualization generation with neural machine translation models or LLMs [22, 24, 9, 46]. These works laid the foundation for natural language interaction in visualization, but they still primarily target single-turn query understanding and visualization generation. Recent efforts have gradually expanded from single-turn interaction to sustained interaction based on existing views and analytical contexts, enabling users to continuously explore data by referring to the current visualization state, query history, or interaction context [38, 8, 42, 39, 59, 27, 19]. While these works transition NLIs from single-turn queries toward sustained interaction, their primary focus remains on the contextual understanding of user queries and organization of analytical workflows.
Recent studies have further applied natural language to visualization authoring and editing [21]. Wang et al. [52] formalize visualization editing intents as executable editing actions, shifting the focus from natural language querying to natural language editing. The Data Formulator series explores mixed-input visualization authoring with natural language support, while DataWink leverages large multimodal models to support SVG example reuse [51, 50, 54]. The emergence of benchmarks such as VisEval indicates that natural language-driven visualization generation has entered a stage of systematic evaluation [4]. However, most existing work primarily addresses relatively explicit and well-bounded user intents, largely overlooking the necessary coordination across interdependent chart components. Our work targets more complex natural language-driven chart editing scenarios. It transforms composite or underspecified language inputs into actionable hierarchical editing processes and supports cross-component coordinated controls based on chart component relations.
1.3 Generative User Interfaces
Early interface generation research mainly generated executable interfaces from task and domain models [31, 53, 44, 45, 33]. Although these methods ensure consistency in interface development, their reliance on static, pre-defined models imposes a high barrier to entry. Specification-based UI generation further derives visual controls from functional, parametric, or analytical specifications [48, 29, 30]. NL4DV [28] transforms natural language queries into attributes, tasks, and Vega-Lite specifications, while SpecifyUI [6] extracts structured representations from reference interfaces and supports hierarchical targeted editing. While these works enhance the automation and controllability of interface generation, they still rely heavily on a priori specifications. With the development of LLMs, researchers have begun to generate interactive interfaces and front-end code from natural language [3, 16, 7, 32, 2, 23, 57]. These works demonstrate the potential of LLM-generated interfaces, but their output stability and interpretability remain limited, and they struggle to handle complex internal structures and constraints in specific domains.
Another line of work focuses on how end users shape interfaces during use. Min et al. [26] and SimStep [14] support overview-detail interface customization and human-AI co-creation of instructional simulations, respectively. Jelly [1] drives UI generation with an evolvable task data model, and DuetUI [55] supports users and agents in co-creating task-oriented interfaces through task decomposition, interface descriptions, and bidirectional context loops. Existing generative UI research has significantly enhanced interface malleability for general-purpose construction and open-ended exploration. However, these approaches remain insufficiently tailored to the unique complexities of data visualization, particularly the systemic coordination of visual encodings, data transformations, and chart components. Our work focuses on natural language-driven chart editing and extends generative interfaces toward interactive chart-editing spaces grounded in chart semantics and component relations.
2 Overview
2.1 Design Requirements
black We conducted a literature-driven and task-oriented analysis of prior work on chart editing, visualization NLIs, and generative user interfaces. By examining how representative systems handle compound requests, underspecified intents, hierarchical refinement, and cross-component coordination, we summarized recurring limitations and translated them into the following design requirements.
DR1. Structure compound natural language editing requests into executable sub-intents. Users’ natural language requests often contain multiple editing goals rather than a single operation. For example, “change to a more harmonious blue theme and highlight the maximum value” involves global style adjustment, target data identification, visual emphasis, and potentially annotation generation. The system should decompose such compound requests into multiple sub-intents and describe the editing target, scope, and related objects of each sub-intent, providing the basis for subsequent widget generation and chart updates.
DR2. Transform underspecified editing requests into controllable editing spaces. Users may express editing goals in high-level or ambiguous ways without explicitly specifying target objects, attributes, or parameters. For example, “change the color theme” does not indicate which objects should be modified or which color scheme should be used. The system should determine relevant editable objects, editing dimensions, and parameter ranges based on the user’s high-level intent, thereby transforming an underspecified request into an explorable and adjustable editing space.
DR3. Support hierarchical adjustment from global editing to local refinement. Some editing requests imply global intents, such as adjusting the overall layout or modifying the color theme, but users usually do not specify how each chart component should change. The system should facilitate hierarchical operations, spanning from high-level editing intents to fine-grained parameter refinement. Users should be able to first compare and select an overall scheme, and then inspect and adjust specific parameters. In this way, users can balance editing efficiency with fine-grained adjustment.
DR4. Identify potentially affected fields related to editing targets. Chart components are not isolated from one another. A single editing target may involve other fields connected through visual encoding relations, structural relations, or expressive consistency relations. For example, marks and legends need to maintain color-encoding consistency; adding a new category may affect marks, legends, color mappings, and category labels; highlighting the maximum value may involve marks, labels, and annotations simultaneously. The system should identify these potentially affected fields and explain their relevance, providing the basis for subsequent cross-component coordinated controls.
DR5. Support relation-aware cross-component coordinated controls. Chart editing requests often imply synchronous changes across multiple related components. The system should leverage relationships among chart components to support controllable cross-component coordination in an inspectable and adjustable manner, thereby maintaining visual encoding consistency, structural integrity, and expressive consistency.

2.2 System Overview
For natural language-driven chart editing, we present RAGE-Vis, which employs a three-stage workflow comprising chart preprocessing, intent-driven editing, and panel generation, as shown in \creffig:workflow. RAGE-Vis accepts a chart image or HTML source alongside a natural language request, dynamically constructing interactive editing panels.
First, the Chart Preprocessing Module (\hyperref[fig:workflow]\cref*fig:workflow(A)) refactors the input chart and organizes its data, visual attributes, and rendering logic into a parameterized intermediate representation for subsequent intent parsing, relation analysis, and panel generation.
Second, the Intent-driven Editing Module (\hyperref[fig:workflow]\cref*fig:workflow(B)) transforms the natural language request into structured editing information. It first extends chart fields and rendering logic when the representation cannot support the requested edit. It then decomposes the request into sub-intents, identifies editing targets and related fields, and either sets parameter values or generates recommendations.
Finally, the Panel Generation Module (\hyperref[fig:workflow]\cref*fig:workflow(C)) converts the structured editing information into a unified panel specification and generates corresponding interactive controls. Through these controls, users can inspect recommendations, adjust target and related fields, and apply modifications to the chart in real time. Overall, this workflow turns natural language requests into an inspectable and adjustable editing process, reducing the burden of code manipulation while supporting cross-component consistency maintenance.
3 RAGE-Vis
RAGE-Vis is a web application designed for editing charts authored in D3.js. The frontend is implemented with Vue and JavaScript, while the backend is implemented in Python.
3.1 Cross-component Relations
To support relation-aware controls during chart editing, RAGE-Vis represents internal chart interconnections as typed field-level relations over the intermediate representation. Specifically, the system treats editable fields as the basic analysis unit and organizes them into a typed relation structure. Each field is associated with its source-data path, corresponding chart component, visual channel, semantic role, and dependency metadata. This representation enables the system to identify not only the fields directly targeted by a user request, but also additional related fields that need to be exposed. Based on this field-level representation, we categorize internal chart interconnections into three types: visual encoding relations, structural relations, and expressive consistency relations.
3.1.1 Visual Encoding Relations
Visual encoding relations connect fields that jointly realize the same data-to-visual mapping. In practice, this relation is established when multiple fields share the same encoding source, data key, or semantic mapping role. Typical examples include category colors shared by chart marks and legend swatches. When a field involved in such a relation is edited, the system traces other fields that depend on the same encoding source and includes them in related-field analysis. In this way, the system helps maintain consistent mappings across chart components and avoids mismatched legends, inconsistent colors, or misleading positional cues after local edits.
3.1.2 Structural Relations
Structural relations connect fields through chart construction logic. In our implementation, they mainly include data generation dependencies and layout dependencies. Data generation dependencies describe which visual elements are generated from which data structures or parameter groups, while layout dependencies describe how the spatial configuration of one component constrains others, such as title size affecting legend position or legend height affecting the available plotting region. Based on these dependencies, the system can retrieve additional related fields when edits involve data insertion, deletion, reordering, legend arrangement, or layout adjustment, thereby preserving structural completeness and spatial coherence.
3.1.3 Expressive Consistency Relations
Expressive consistency relations are more strongly conditioned on the current editing intent. They capture cases where multiple fields need to work together to fulfill the same communicative goal, such as emphasis, comparison, explanation, or narrative clarification. To operationalize this relation, the system first infers the expressive goal implied by the user request and then instantiates an intent-specific relation template to retrieve the fields that should jointly support that goal. Therefore, expressive consistency is not modeled as a fully fixed dependency, but is represented as a dynamic relation pattern activated by the current editing task. This allows the system to preserve coherence at the level of analytical emphasis and visual narrative, rather than only at the level of appearance or structure.
3.2 System Implementation
RAGE-Vis adopts an implementation strategy that combines multimodal models with rule-based processing. The multimodal model is primarily responsible for semantic tasks, including chart understanding, code generation, intent parsing, and parameter recommendation. The rule-based component handles deterministic processing, such as field mapping, relation analysis, structural constraints, and interface generation. The core capabilities of the system are built on the GPT-5.3-Codex model. To ensure data consistency and composability across modules, all inputs and outputs throughout the pipeline are organized as structured JSON objects. \colorblackWe provide additional implementation details in supplementary material, including the internal representation, bitmap-to-editable-chart preprocessing, editable field extraction, intent decomposition and relation inference, field expansion, recommendation and panel generation, and validation rules.
3.2.1 Chart Preprocessing
The system first converts user-provided chart images or HTML code into a unified HTML representation for parameter editing. For chart image inputs, the system reconstructs a complete HTML chart from the image. For HTML chart inputs, as well as reconstructed HTML charts, the system further analyzes the original D3 rendering logic and extracts the data and visual attributes that were previously scattered throughout the rendering process, reorganizing them into an editable parameter structure.
Based on this representation, the complete chart is further decomposed into two parts: source data and render script. The source data stores all chart content and parameters that can be edited, including raw data, derived fields, visual encodings, style attributes, text annotations, and mappings between fields and chart components. The render script reads fields from the source data and generates the corresponding SVG/HTML elements, while re-rendering the chart whenever parameters are changed. This decomposition decouples editable chart content from rendering logic and provides a unified basis for subsequent intent-driven field localization, relation analysis, and interface generation.
3.2.2 Intent-Driven Editing
After obtaining an editable chart representation, the system transforms the user’s natural-language request into structured editing results through four steps: Fields Expansion, Intent Decomposition, Coordinated Relationship Analysis, Recommendation and Setting.
Fields Expansion. By jointly considering the user intent and the current source data, RAGE-Vis determines whether the existing chart representation already contains the parameter structure required to support the requested edit. If the current representation is insufficient, the system expands the source data and incrementally modifies the render script, so that the newly introduced parameters can participate in subsequent rendering.
Intent Decomposition. RAGE-Vis decomposes the user request into multiple structured sub-intents and identifies the corresponding target fields in the source data for each sub-intent. In our implementation, Target Fields contain only the attributes that directly correspond to the current editing intent, so that the generated controls remain focused on the explicit editing target. \colorblack During intent decomposition, RAGE-Vis records uncertain aspects of each sub-intent, including possible editing targets, operation scopes, and parameter values. If the target, scope, and value are explicitly specified, the system directly updates the corresponding parameters. If the request is underspecified but the editing dimension can be inferred, the system generates candidate presets or parameter options. If multiple plausible interpretations exist, RAGE-Vis keeps these alternatives inspectable in the generated panel rather than committing to a single interpretation. In this way, ambiguity is handled through a mixed-initiative process in which the system proposes structured alternatives and users resolve uncertainty through selection and refinement.
Coordinated Relationship Analysis. \colorblackStarting from the target fields identified for each sub-intent, RAGE-Vis searches the field-level relation structure to find additional fields that may need to be inspected or edited together with the target. The search follows three relation types: visual encoding relations, structural relations, and expressive consistency relations. The retrieved fields are uniformly organized into Affected Fields. In our implementation, \colorblackthe system retrieves relevant fields and determines dependencies based on a relation template file. However, both stronger and weaker dependencies are included in Affected Fields, since both can help users inspect broader cross-component implications and decide whether further coordinated adjustment is needed. Their difference is reflected not in whether they are shown, but in how they are explained and prioritized. Each affected field is therefore accompanied by a brief reason explaining why it is related to the current editing target.
Recommendation and Setting. RAGE-Vis determines parameter values according to the specificity of the user request. If the user explicitly specifies both the editing target and the desired value, the system directly sets the corresponding parameters. For underspecified or exploratory requests, the system instead generates multiple recommended parameter values based on the current chart state and user intent, providing candidate options for subsequent interaction. Through this process, natural-language requests are transformed into executable and interpretable structured editing representations.
3.2.3 Panel Generation
The system converts the structured editing results produced in the previous stage into a unified panel specification, so that they can be directly parsed and rendered by the front-end interface. Different types of editable fields are mapped to corresponding interaction widgets: numeric fields are mapped to input boxes, color fields to color pickers, text fields to text inputs, and data collection fields to table-based controls. For fields associated with recommendations, the system generates preset options and presents them as preview thumbnails for user selection, enabling users to compare alternative designs at a glance before proceeding with subsequent edits.
At the interface level, the system first groups target fields according to the sub-intents obtained from decomposing the compound request, so that each group of controls corresponds to a relatively self-contained local editing task. Unlike target fields, affected fields are accompanied by corresponding dependency reasons, explaining why they change together with the target edit. User modifications made through the interface are fed back to the source data in real time, after which the render script re-renders the chart. Through this process, the system transforms natural-language editing intent into an operable parameter panel, enabling users to perform subsequent edits in a parameterized and visual manner.

3.3 User Interface
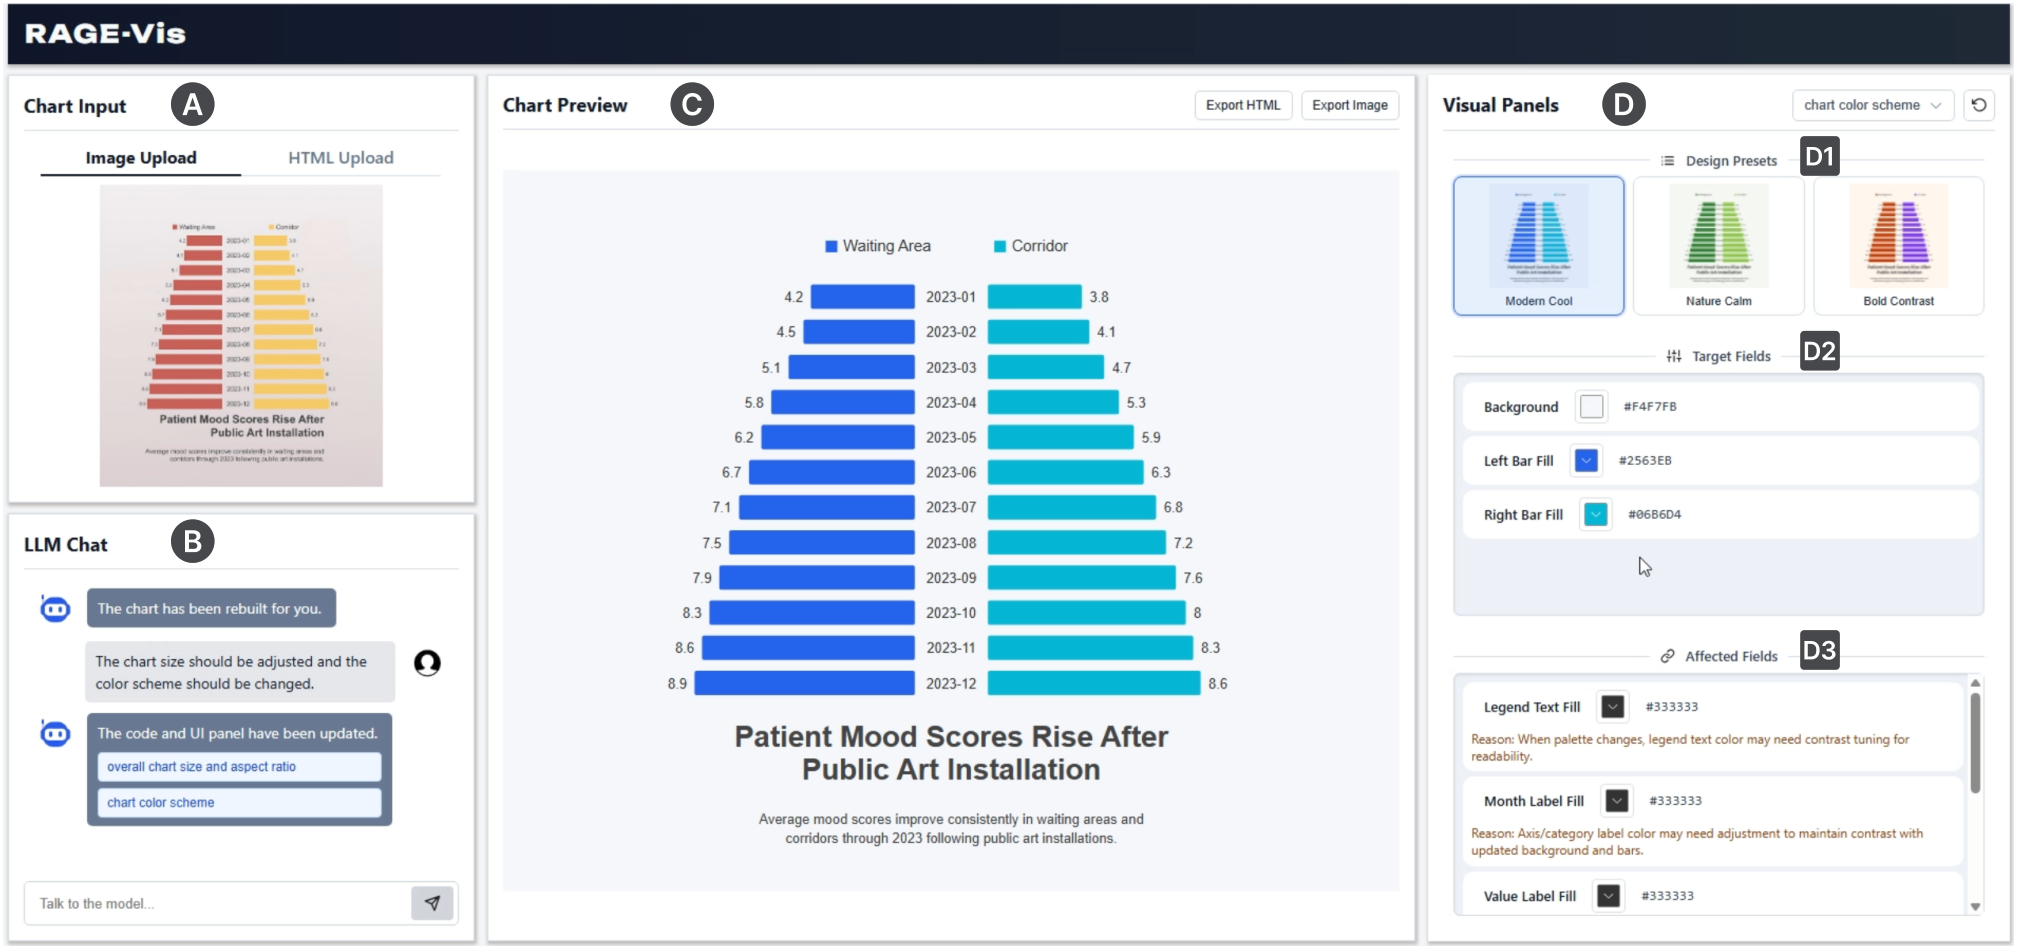
fig:system shows the interface of RAGE-Vis. The interface consists of four main views: Chart Input, LLM Chat, Chart Preview, and Visual Panels, supporting the complete editing workflow from chart import and natural language request submission to result preview and parameter adjustment.
Chart Input (\hyperref[fig:system]\cref*fig:system(A)) supports uploading chart images or importing existing HTML charts. LLM Chat (\hyperref[fig:system]\cref*fig:system(B)) receives users’ natural language editing requests, including clearly specified editing instructions as well as high-level and underspecified goals, without requiring users to predefine all related objects, attributes, and parameters (DR2). When a request involves multiple editing targets, the system generates one or more corresponding Visual Panels, enabling users to inspect and adjust different editing tasks separately (DR1). Chart Preview (\hyperref[fig:system]\cref*fig:system(C)) synchronously presents the current chart state, helping users inspect editing results and determine whether further local refinement is needed through the Visual Panels (DR3). Export buttons allow users to save the edited chart as an image or HTML.
Visual Panels (\hyperref[fig:system]\cref*fig:system(D)) are the main area for inspecting and adjusting editing results. Each natural language request generates a corresponding editing panel, which can be revisited through the top drop-down list for further adjustment. Each panel contains three parts: Design Presets, Target Fields, and Affected Fields. For underspecified or exploratory requests, Design Presets (\hyperref[fig:system]\cref*fig:system(D1)) provide multiple candidate schemes, allowing users to compare and select an overall editing direction. Target Fields (\hyperref[fig:system]\cref*fig:system(D2)) present fields and controls directly related to the current editing target, supporting further adjustment of specific parameters. Through this hierarchical organization, RAGE-Vis transforms natural language editing requests into an inspectable and operable editing space, supporting users in moving from overall adjustment to local refinement (DR2, DR3). \colorblackIn this sense, the Visual Panels also serve as a disambiguation interface. Design Presets expose alternative high-level interpretations, Target Fields reveal the parameters that the system assumes to be directly relevant, and Affected Fields show possible cross-component implications. Users can therefore verify and refine the system interpretation before committing to further edits.
For requests involving cross-component relationships, Affected Fields (\hyperref[fig:system]\cref*fig:system(D3)) additionally present related fields that may be affected beyond the direct editing targets, together with brief reasons for each field (DR4). These explanations make potential indirect effects explicit and help users decide whether further adjustments are needed. By organizing related fields as inspectable and adjustable widgets, RAGE-Vis enables users to coordinate cross-component changes while maintaining visual encoding consistency, structural integrity, and expressive consistency (DR5).
4 Evaluation
To evaluate the effectiveness of RAGE-Vis, we combine case studies and a user study to examine its support for underspecified request handling, alternative exploration, related-field discovery, and cross-component consistency maintenance.
4.1 Case Study
black We selected two case-study charts to cover common inputs and different structural complexity levels. Case Study I uses a bitmap chart image to examine reconstruction and parameterized editing, while Case Study II uses an HTML chart to examine relation-aware editing with richer structural and encoding dependencies. These cases illustrate representative scenarios involving underspecified requests and cross-component dependencies.
4.1.1 Case Study I
To demonstrate how RAGE-Vis supports relation-aware chart editing, we use a mirrored bar chart showing changes in patient mood scores as a case study. The user first uploads the original chart image. The system reconstructs it into corresponding HTML code and renders it as an editable chart instance. Based on this reconstructed chart, the user issues three types of editing requests: adjusting the chart size and color style, extending the data while highlighting the maximum value, and reversing the data order (\creffig:teaser).
First, the user requests that “The chart size should be adjusted, and the color style should be changed.” The system decomposes this request into two sub-intents, overall size adjustment and color style replacement, and generates two corresponding control groups, each with multiple candidate options. When the user adjusts the chart size, the legend position, the central month-label positions, and the layout of the title and subtitle are updated accordingly, preventing crowding or imbalance after resizing; this reflects the handling of structural relations. Switching the color scheme directly changes the background color and the bar colors on both sides, while the system, based on visual encoding consistency, additionally provides color controls for the legend and text elements.
Next, the user requests, “I want to add the data for 2024-01 and highlight the maximum value.” The system decomposes this request into two sub-intents, data addition and new emphasis. While adding the new data, the system also recognizes that the original subtitle specifies the temporal range of the chart, and therefore provides a subtitle text editing control so that the textual description remains consistent with the updated data range; this corresponds to the handling of expressive consistency relations. After highlighting the maximum value, the emphasis effect also needs to remain coordinated with the corresponding bar and its label, so the system further provides controls for the bar color and value-text color, making the highlight more salient.
Finally, the user requests that “I want all data be arranged in reverse order.” Because this request is explicit, the system directly provides the reordered data table. Once the operation is applied, the order of the bars on both sides, the order of the central month labels, and the corresponding position mappings are updated together, allowing the reversed chart to preserve a stable mirrored comparison structure.
Overall, this case shows that RAGE-Vis can coordinate edits across data, bars, labels, legends, and textual descriptions, supporting both recommendation options for underspecified requests and direct parameter editing for explicit requests.
4.1.2 Case Study II
To further demonstrate the generality of RAGE-Vis on charts with more complex structures, we use a multi-category radar chart as a second case study (\creffig:case2). Starting from the uploaded HTML chart, the system converts it into an editable chart and supports three requests: repositioning the decorative bar while adjusting the title and subtitle, arranging the legend into a single row while changing category colors, and generating a stylized data series.
First, when the user asks to reposition the top-left decorative bar and modify the title and subtitle content and font size, the system generates editable controls for decorative and title-related elements, including position, text, and size parameters. Because the request does not specify exact values, the system also provides recommendations for subsequent selection and refinement.
Next, when the user asks to arrange the legend in a single row and change the colors of all categories, the system exposes the legend-row setting as a direct target field and additionally provides related controls for legend layout adjustment. For category recoloring, it generates multiple candidate color schemes and applies the selected scheme consistently to legend swatches, radar polylines, nodes, and filled areas, preserving the shared category encoding between the legend and the chart body.
Finally, when the user requests a stylized data series in which all values within the same category are identical, the system treats this as a data-generation task and produces editable radar-series values based on the existing category structure. To keep the generated values within a reasonable display range, it also exposes the radar maximum value as a related control; because the batch data update may change the chart meaning, the system additionally provides a subtitle text control. Overall, this case shows that RAGE-Vis remains effective for charts with tighter structural coupling.
4.2 User Study
To evaluate the effectiveness and usability of RAGE-Vis in natural language-based chart editing, we conducted a within-subjects user study. The study focuses on three questions: (1) whether RAGE-Vis can transform vague or underspecified goals into comparable candidate alternatives; (2) whether Affected Fields can help users discover chart components or properties related to the current editing target and maintain cross-component consistency; and (3) whether RAGE-Vis can reduce additional natural language requests issued to supplement, correct, or rephrase editing intents.
4.2.1 Study Design
We recruited \colorblack32 participants with varying levels of experience in data visualization and chart editing, and adopted a within-subjects design. \colorblackThe participants, comprising students and researchers, were aged 19 to 30 years (M = 24.75, SD = 2.89). They reported moderate familiarity with data visualization (M = 3.19, SD = 1.38) and chart editing (M = 3.12, SD = 0.81), whereas their familiarity with D3.js was relatively lower and exhibited greater variance (M = 2.38, SD = 1.41). The study included \colorblackfour chart editing scenarios based on \colorblacka line chart, a stacked area chart, a scatter plot chart and a pie chart, covering style adjustment, data modification, color mapping, text editing, and other editing requirements. \textcolorblackParticipants were asked to edit the provided original chart to match the target chart as closely as possible. Detailed experimental procedures and task designs are provided in the supplementary material.
blackTo reduce task-specific learning effects, each participant completed two different chart editing tasks, using RAGE-Vis in one task and the control condition in the other. The chart-task assignments were balanced across participants, while all participants used RAGE-Vis before the control condition. The full system included Design Presets and Affected Fields, whereas the control condition removed these two parts and only generated parameter panels related to the current editing target, \colorblackinspired by the dynamic-widget paradigm of DynaVis [47], serving as an ablated version of RAGE-Vis to examine their roles. \textcolorblackThe four tasks and two system conditions formed eight task-condition combinations, with eight data points for each combination and 64 data points in total.
For measurement and analysis, we recorded task completion time, accumulated model response time, user active operation time, and the number of natural language requests issued to the model. Participants completed two post-task questionnaires to evaluate their immediate experiences, followed by a final post-study questionnaire to subjectively compare the two system conditions. \textcolorblackThe post-task questionnaire independently measured each system condition, including workload-related items adapted from NASA-TLX. We analyzed its Likert-scale responses using two-sided Wilcoxon signed-rank tests with Holm-adjusted -values and reported median, IQR, and signed rank-biserial effect sizes (). \textcolorblackAdapting ChartEdit’s target-matching evaluation protocol [61], we further evaluated the objective quality of the final edited charts by comparing each participant’s final chart with the original chart, the target chart, and the task-specific edit checklist. Each result was scored on target edit completion and preservation of non-target elements, both on a 0–5 scale.
4.2.2 Results
The logs show that the full system reduced the number of natural language requests issued during task completion. Compared with the control condition, participants issued significantly fewer natural language requests with the full system \textcolorblack(4.28 1.82 vs. 6.25 2.50, paired -test, ), and the accumulated model response time was also significantly lower \textcolorblack(4 min 38 s 2 min 46 s vs. 6 min 22 s 2 min 58 s, ). User active operation time was comparable between the two conditions \textcolorblack(9 min 12 s 3 min 32 s vs. 9 min 49 s 3 min 50 s, ), while the average total task time was shorter with the full system (\textcolorblackmean SD: 13 min 51 s 5 min 03 s vs. 16 min 11 s 6 min 06 s, ).
blackThe objective quality evaluation further shows that the reduced interaction cost did not come at the expense of final-chart quality. Across all tasks, RAGE-Vis achieved a comparable overall quality score to the baseline condition (8.20 vs. 8.36). The two sub-scores also remained close overall, including target edit completion (3.88 vs. 3.97) and preservation of non-target elements (4.31 vs. 4.40). The slightly lower score of RAGE-Vis may be partly related to the fixed condition order in our study: participants used RAGE-Vis before the baseline condition, which may have introduced a learning effect that benefited the later baseline tasks. The full scoring results are provided in the supplementary material.
The post-task questionnaire results further support these observations (\creffig:task-questionnaire). In terms of perceived system capability and task experience, the full system received higher ratings than the control condition across all TQ1–TQ9 items. The differences were especially evident in support for comparing editing alternatives \textcolorblack(TQ4: median 6.0, IQR 2.00 vs. median 2.0, IQR 4.00, ), discovery of related chart components or properties \textcolorblack(TQ6: median 7.0, IQR 1.00 vs. median 2.5, IQR 2.50, ), and consistency maintenance among chart elements \textcolorblack(TQ7: median 7.0, IQR 1.00 vs. median 4.0, IQR 5.00, ), all with \textcolorblackHolm-adjusted . Results indicate the full system effectively supported alternative comparison and affected-field inspection. For underspecified requests, Design Presets expanded vague goals into a comparable design space; as P4 noted, the candidate options let he “see several possible directions… instead of having to know all parameters from the beginning.” Meanwhile, Affected Fields enhanced awareness of cross-component dependencies, reminding P11 to check peripheral elements like “legends and labels” rather than just the most obvious parts. Consequently, the full system yielded lower subjective workload scores, demonstrating that these guidance features reduced user effort and frustration without introducing extra cognitive burden.
The post-study questionnaire results reveal a strong overall preference for RAGE-Vis, particularly regarding ease of use (\creffig:post-study-questionnaire). Participants highly rated the full system for exploring alternatives (SQ5), discovering related components (SQ6), maintaining consistency (SQ7), and reducing effort (SQ13). Unlike the control condition’s localized panels, RAGE-Vis integrates candidate options, target fields, and affected fields into a unified workflow, enabling continuous refinement from a single natural language request. P8 commented, “The full system felt like it listed the things I might need to ask about later, so I could just check them in the panel.” This effectively explains the observed decrease in both NL requests and accumulated model latency.
4.2.3 Core Pipeline Evaluation
blackTo further examine the reliability of the core pipeline, we conducted an offline evaluation on the natural-language requests used in the user study. For intent decomposition, two experts manually annotated the expected sub-intents for each request and compared them with the system outputs. RAGE-Vis achieved an intent-decomposition precision of 82.02%. For affected-field expansion, the experts judged whether the generated affected fields were necessary for each target edit. The false-positive ratio among affected fields was 0.84%, suggesting that RAGE-Vis introduced few irrelevant fields during relation-aware expansion.
5 Discussion
5.1 Lessons Learned
blackRAGE-Vis is designed for iterative chart refinement rather than one-shot chart generation. It is useful when users know their high-level editing goals but are uncertain about which related parameters may also be affected. By exposing candidate schemes, target fields, and affected fields, RAGE-Vis turns vague language instructions into inspectable editing spaces and keeps users in control of final design decisions. The detailed comparison with existing natural language-driven chart editing tools is provided in supplemental material.
5.2 Generalization and Scalability
The scalability of RAGE-Vis mainly depends on whether an input chart can be converted into a parameterized and re-renderable representation. Although our current implementation targets D3 charts, the workflow could be transferred to Vega-Lite, ECharts, SVG, or other structured visualization representations if similar parameter extraction and update mechanisms are available. More broadly, relation-aware editing may also apply to infographics, visual reports, and interface editing, where local changes can affect annotations, layout, narrative hierarchy, or interaction feedback.
5.3 Limitations and Future Work
RAGE-Vis still has several limitations. First, performance bottlenecks stem from chart representation extraction and LLM latency, while image-based reconstruction lacks pixel-level accuracy and complex tasks can degrade interaction responsiveness. Future work will explore robust extraction methods, lightweight model calls, and caching mechanisms to enhance robustness and response efficiency.
Second, the relation scope and quality control are constrained. The three predefined relation types omit complex dependencies like cross-view consistency and high-level design constraints. Lacking automated quality-checking, the system still relies on manual refinement. We plan to integrate visualization design rules and conflict-resolution strategies to provide clearer decision support.
blackThird, model dependency on a proprietary LLM poses risks for reproducibility. While our training-free workflow generalizes to other structured-output models, weaker models may yield incomplete intents or inconsistent options. Future work will evaluate sensitivity across proprietary and open-source models and implement validation or fallback mechanisms for failure cases.
6 Conclusion
In this paper, we present RAGE-Vis, a relation-aware generative editing interface for natural language-based chart editing. RAGE-Vis parses composite and underspecified requests into structured sub-intents and generates Visual Panels containing candidate schemes, target fields, and affected fields. By incorporating visual encoding, structural, and expressive consistency relations, the system helps users inspect cross-component effects and coordinate related edits. Case studies and a user study show that RAGE-Vis supports iterative refinement, alternative exploration, related-field discovery, and consistency maintenance in complex chart editing tasks.
Acknowledgements.
We would like to thank the domain experts and anonymous reviewers for their constructive comments. This paper is partially supported by National Natural Science Foundation of China (NO. U23A20313, 62372471). CRediT authorship contribution statement. Ziyao Kang: Software, Data curation, Writing – original draft (equal). Yiping Sun: Investigation, Writing – original draft (equal). Linxuan Tian: Formal analysis, Writing – original draft (equal). Henghuan Qu: Validation. Wei Zeng: Visualization, Methodology(supporting), Writing – review & editing. Jiazhi Xia: Conceptualization, Methodology (lead), Writing – review & editing, Funding acquisition, Project administration, Resources, Supervision.References
- [1] Y. Cao, P. Jiang, and H. Xia. Generative and malleable user interfaces with generative and evolving task-driven data model. In Proceedings of the 2025 CHI Conference on Human Factors in Computing Systems, CHI ’25. Association for Computing Machinery, 2025. doi: 10.1145/3706598.3713285
- [2] S. Cha, S. Jo, J. Shin, and K. Seo. Design system-compliant user interface generation with llm agents: A comparative study of context engineering strategies. In Proceedings of the Extended Abstracts of the 2026 CHI Conference on Human Factors in Computing Systems, CHI EA ’26. Association for Computing Machinery, 2026. doi: 10.1145/3772363.3798616
- [3] J. Chen, Y. Zhang, Y. Zhang, Y. Shao, and D. Yang. Generative interfaces for language models. CoRR, abs/2508.19227, 2025. doi: 10.48550/ARXIV.2508.19227
- [4] N. Chen, Y. Zhang, J. Xu, K. Ren, and Y. Yang. Viseval: A benchmark for data visualization in the era of large language models. IEEE Transactions on Visualization and Computer Graphics, 31(1):1301–1311, 2025. doi: 10.1109/TVCG.2024.3456320
- [5] Y. Chen, R. Li, A. Mac, T. Xie, T. Yu, and E. Wu. NL2INTERFACE: interactive visualization interface generation from natural language queries. CoRR, abs/2209.08834, 2022. doi: 10.48550/ARXIV.2209.08834
- [6] Y. Chen, C. Shi, and L. Chen. Specifyui: Supporting iterative UI design intent expression through structured specifications and generative AI. CoRR, abs/2509.07334, 2025. doi: 10.48550/ARXIV.2509.07334
- [7] R. Cheng, T. Barik, A. Leung, F. Hohman, and J. Nichols. Biscuit: Scaffolding llm-generated code with ephemeral uis in computational notebooks. In 2024 IEEE Symposium on Visual Languages and Human-Centric Computing (VL/HCC), pp. 13–23, 2024. doi: 10.1109/VL/HCC60511.2024.00012
- [8] K. Dhamdhere, K. S. McCurley, R. Nahmias, M. Sundararajan, and Q. Yan. Analyza: Exploring data with conversation. In Proceedings of the 22nd International Conference on Intelligent User Interfaces, IUI ’17, p. 493–504. Association for Computing Machinery, 2017. doi: 10.1145/3025171.3025227
- [9] V. Dibia. LIDA: A tool for automatic generation of grammar-agnostic visualizations and infographics using large language models. In D. Bollegala, R. Huang, and A. Ritter, eds., Proceedings of the 61st Annual Meeting of the Association for Computational Linguistics (Volume 3: System Demonstrations), pp. 113–126. Association for Computational Linguistics, 2023. doi: 10.18653/v1/2023.acl-demo.11
- [10] T. Gao, M. Dontcheva, E. Adar, Z. Liu, and K. G. Karahalios. Datatone: Managing ambiguity in natural language interfaces for data visualization. In Proceedings of the 28th Annual ACM Symposium on User Interface Software & Technology, UIST ’15, p. 489–500. Association for Computing Machinery, 2015. doi: 10.1145/2807442.2807478
- [11] J. Hao, M. Yang, Q. Shi, Y. Jiang, G. Zhang, and W. Zeng. Finflier: Automating graphical overlays for financial visualizations with knowledge-grounding large language model. IEEE Transactions on Visualization and Computer Graphics, 31(9):6353–6369, 2025. doi: 10.1109/TVCG.2024.3514138
- [12] J. Harper and M. Agrawala. Deconstructing and restyling d3 visualizations. In Proceedings of the 27th Annual ACM Symposium on User Interface Software and Technology, UIST ’14, p. 253–262. Association for Computing Machinery, 2014. doi: 10.1145/2642918.2647411
- [13] M. N. Kapadnis, L. Baghel, A. Naik, and C. P. Rosé. Charteditbench: Evaluating grounded multi-turn chart editing in multimodal language models. CoRR, abs/2602.15758, 2026. doi: 10.48550/ARXIV.2602.15758
- [14] Z. Kaputa, A. Rajaram, V. Feliciano, Z. Lyu, M. Agrawala, and H. Subramonyam. Simstep: Human-in-the-loop authoring of interactive educational simulations through task-level abstractions. In Proceedings of the 2026 CHI Conference on Human Factors in Computing Systems, CHI ’26. Association for Computing Machinery, 2026. doi: 10.1145/3772318.3791514
- [15] D. J.-L. Lee, J. Lee, T. Siddiqui, J. Kim, K. Karahalios, and A. Parameswaran. You can’t always sketch what you want: Understanding sensemaking in visual query systems. IEEE Transactions on Visualization and Computer Graphics, 26(1):1267–1277, 2020. doi: 10.1109/TVCG.2019.2934666
- [16] Y. Leviathan, D. Valevski, M. Kalman, D. Lumen, E. Segalis, E. Molad, S. Pasternak, V. Natchu, V. Nygaard, Srinivasan Venkatachary, J. Manyika, and Y. Matias. Generative ui: Llms are effective ui generators, 2026. doi: 10.48550/arXiv.2604.09577
- [17] S. Li, R. A. Rossi, S. Kim, S. Choudhary, F. Dernoncourt, P. Mathur, Z. Tu, and Y. Zhao. Charts are not images: On the challenges of scientific chart editing. CoRR, abs/2512.00752, 2025. doi: 10.48550/ARXIV.2512.00752
- [18] T. J.-J. Li, M. Radensky, J. Jia, K. Singarajah, T. M. Mitchell, and B. A. Myers. Pumice: A multi-modal agent that learns concepts and conditionals from natural language and demonstrations. In Proceedings of the 32nd Annual ACM Symposium on User Interface Software and Technology, UIST ’19, p. 577–589. Association for Computing Machinery, New York, NY, USA, 2019. doi: 10.1145/3332165.3347899
- [19] Z. Li, W. Zhang, and J. Tao. Flowllm: Large language model driven flow visualization. Visual Informatics, 9(3):100241, 2025. doi: 10.1016/j.visinf.2025.100241
- [20] Z. Liu, J. Thompson, A. Wilson, M. Dontcheva, J. Delorey, S. Grigg, B. Kerr, and J. Stasko. Data illustrator: Augmenting vector design tools with lazy data binding for expressive visualization authoring. In Proceedings of the 2018 CHI Conference on Human Factors in Computing Systems, CHI ’18, p. 1–13. Association for Computing Machinery, 2018. doi: 10.1145/3173574.3173697
- [21] W. Lu, J. Zhang, J. Fan, Z. Fu, Y. Chen, and X. Du. Large language model for table processing: A survey. Frontiers of Computer Science, 19(2):192350, 2025. doi: 10.1007/s11704-024-40763-6
- [22] Y. Luo, N. Tang, G. Li, J. Tang, C. Chai, and X. Qin. Natural language to visualization by neural machine translation. IEEE Transactions on Visualization and Computer Graphics, 28(1):217–226, 2022. doi: 10.1109/TVCG.2021.3114848
- [23] J. Ma, L. Shi, K. A. Robertsen, and P. Chi. Ambigchat: Interactive hierarchical clarification for ambiguous open-domain question answering. In Proceedings of the 38th Annual ACM Symposium on User Interface Software and Technology, UIST ’25. Association for Computing Machinery, 2025. doi: 10.1145/3746059.3747686
- [24] P. Maddigan and T. Susnjak. Chat2vis: Generating data visualizations via natural language using chatgpt, codex and gpt-3 large language models. IEEE Access, 11:45181–45193, 2023. doi: 10.1109/ACCESS.2023.3274199
- [25] A. M. McNutt and R. Chugh. Integrated visualization editing via parameterized declarative templates. In Proceedings of the 2021 CHI Conference on Human Factors in Computing Systems, CHI ’21. Association for Computing Machinery, 2021. doi: 10.1145/3411764.3445356
- [26] B. Min, A. Chen, Y. Cao, and H. Xia. Malleable overview-detail interfaces. In Proceedings of the 2025 CHI Conference on Human Factors in Computing Systems, CHI ’25. Association for Computing Machinery, 2025. doi: 10.1145/3706598.3714164
- [27] R. Mitra, A. Narechania, A. Endert, and J. Stasko. Facilitating conversational interaction in natural language interfaces for visualization. In 2022 IEEE Visualization and Visual Analytics (VIS), pp. 6–10, 2022. doi: 10.1109/VIS54862.2022.00010
- [28] A. Narechania, A. Srinivasan, and J. Stasko. Nl4dv: A toolkit for generating analytic specifications for data visualization from natural language queries. IEEE Transactions on Visualization and Computer Graphics, 27(2):369–379, 2021. doi: 10.1109/TVCG.2020.3030378
- [29] J. Nichols, B. A. Myers, M. Higgins, J. Hughes, T. K. Harris, R. Rosenfeld, and M. Pignol. Generating remote control interfaces for complex appliances. In Proceedings of the 15th Annual ACM Symposium on User Interface Software and Technology, UIST ’02, p. 161–170. Association for Computing Machinery, 2002. doi: 10.1145/571985.572008
- [30] J. Nichols, B. A. Myers, and K. Litwack. Improving automatic interface generation with smart templates. In Proceedings of the 9th International Conference on Intelligent User Interfaces, IUI ’04, p. 286–288. Association for Computing Machinery, 2004. doi: 10.1145/964442.964507
- [31] D. R. Olsen. Mike: the menu interaction kontrol environment. ACM Trans. Graph., 5(4):318–344, 1986. doi: 10.1145/27623.28868
- [32] S. Park, S. Lee, E. Choi, H. Kim, M. Kweon, Y. Song, and J. Seo. Bridging gulfs in ui generation through semantic guidance. In Proceedings of the 2026 CHI Conference on Human Factors in Computing Systems, CHI ’26. Association for Computing Machinery, 2026. doi: 10.1145/3772318.3791966
- [33] A. R. Puerta and J. Eisenstein. Towards a general computational framework for model-based interface development systems. In M. T. Maybury, P. A. Szekely, and C. G. Thomas, eds., Proceedings of the 4th International Conference on Intelligent User Interfaces, IUI 1999, Los Angeles, CA, USA, January 5-8, 1999, pp. 171–178. ACM, 1999. doi: 10.1145/291080.291108
- [34] D. Ren, B. Lee, and M. Brehmer. Charticulator: Interactive construction of bespoke chart layouts. IEEE Transactions on Visualization and Computer Graphics, 25(1):789–799, 2019. doi: 10.1109/TVCG.2018.2865158
- [35] A. Satyanarayan and J. Heer. Lyra: An interactive visualization design environment. Comput. Graph. Forum, 33(3):351–360, 2014. doi: 10.1111/CGF.12391
- [36] A. Satyanarayan, D. Moritz, K. Wongsuphasawat, and J. Heer. Vega-lite: A grammar of interactive graphics. IEEE Transactions on Visualization and Computer Graphics, 23(1):341–350, 2017. doi: 10.1109/TVCG.2016.2599030
- [37] M. Savva, N. Kong, A. Chhajta, L. Fei-Fei, M. Agrawala, and J. Heer. Revision: automated classification, analysis and redesign of chart images. In Proceedings of the 24th Annual ACM Symposium on User Interface Software and Technology, UIST ’11, p. 393–402. Association for Computing Machinery, 2011. doi: 10.1145/2047196.2047247
- [38] V. Setlur, S. E. Battersby, M. Tory, R. Gossweiler, and A. X. Chang. Eviza: A natural language interface for visual analysis. In Proceedings of the 29th Annual Symposium on User Interface Software and Technology, UIST ’16, p. 365–377. Association for Computing Machinery, 2016. doi: 10.1145/2984511.2984588
- [39] V. Setlur, M. Tory, and A. Djalali. Inferencing underspecified natural language utterances in visual analysis. In Proceedings of the 24th International Conference on Intelligent User Interfaces, IUI ’19, p. 40–51. Association for Computing Machinery, 2019. doi: 10.1145/3301275.3302270
- [40] L. Shen, E. Shen, Y. Luo, X. Yang, X. Hu, X. Zhang, Z. Tai, and J. Wang. Towards natural language interfaces for data visualization: A survey. IEEE Transactions on Visualization and Computer Graphics, 29(6):3121–3144, 2023. doi: 10.1109/TVCG.2022.3148007
- [41] C. Shi, W. Cui, C. Liu, C. Zheng, H. Zhang, Q. Luo, and X. Ma. Nl2color: Refining color palettes for charts with natural language. IEEE Transactions on Visualization and Computer Graphics, 30(1):814–824, 2024. doi: 10.1109/TVCG.2023.3326522
- [42] A. Srinivasan and J. Stasko. Orko: Facilitating multimodal interaction for visual exploration and analysis of networks. IEEE Transactions on Visualization and Computer Graphics, 24(1):511–521, 2018. doi: 10.1109/TVCG.2017.2745219
- [43] Y. Sun, J. Leigh, A. Johnson, and S. Lee. Articulate: A semi-automated model for translating natural language queries into meaningful visualizations. In R. Taylor, P. Boulanger, A. Krüger, and P. Olivier, eds., Smart Graphics, pp. 184–195. Springer Berlin Heidelberg, 2010.
- [44] P. Szekely, P. Luo, and R. Neches. Facilitating the exploration of interface design alternatives: the humanoid model of interface design. In Proceedings of the SIGCHI Conference on Human Factors in Computing Systems, CHI ’92, p. 507–515. Association for Computing Machinery, 1992. doi: 10.1145/142750.142912
- [45] P. Szekely, P. Sukaviriya, P. Castells, J. Muthukumarasamy, and E. Salcher. Declarative interface models for user interface construction tools: the Mastermind approach, pp. 120–150. Springer US, 1996. doi: 10.1007/978-0-387-34907-7_8
- [46] Y. Tian, W. Cui, D. Deng, X. Yi, Y. Yang, H. Zhang, and Y. Wu. Chartgpt: Leveraging llms to generate charts from abstract natural language. IEEE Transactions on Visualization and Computer Graphics, 31(3):1731–1745, 2025. doi: 10.1109/TVCG.2024.3368621
- [47] P. Vaithilingam, E. L. Glassman, J. P. Inala, and C. Wang. Dynavis: Dynamically synthesized ui widgets for visualization editing. In Proceedings of the 2024 CHI Conference on Human Factors in Computing Systems, CHI ’24. Association for Computing Machinery, 2024. doi: 10.1145/3613904.3642639
- [48] P. Vaithilingam and P. J. Guo. Bespoke: Interactively synthesizing custom guis from command-line applications by demonstration. In Proceedings of the 32nd Annual ACM Symposium on User Interface Software and Technology, UIST ’19, p. 563–576. Association for Computing Machinery, 2019. doi: 10.1145/3332165.3347944
- [49] C. Wang, Y. Feng, R. Bodik, I. Dillig, A. Cheung, and A. J. Ko. Falx: Synthesis-powered visualization authoring. In Proceedings of the 2021 CHI Conference on Human Factors in Computing Systems, CHI ’21. Association for Computing Machinery, 2021. doi: 10.1145/3411764.3445249
- [50] C. Wang, B. Lee, S. M. Drucker, D. Marshall, and J. Gao. Data formulator 2: Iterative creation of data visualizations, with ai transforming data along the way. In Proceedings of the 2025 CHI Conference on Human Factors in Computing Systems, CHI ’25. Association for Computing Machinery, 2025. doi: 10.1145/3706598.3713296
- [51] C. Wang, J. Thompson, and B. Lee. Data formulator: Ai-powered concept-driven visualization authoring. IEEE Transactions on Visualization and Computer Graphics, 30(1):1128–1138, 2024. doi: 10.1109/TVCG.2023.3326585
- [52] Y. Wang, Z. Hou, L. Shen, T. Wu, J. Wang, H. Huang, H. Zhang, and D. Zhang. Towards natural language-based visualization authoring. IEEE Transactions on Visualization and Computer Graphics, 29(1):1222–1232, 2023. doi: 10.1109/TVCG.2022.3209357
- [53] C. Wiecha, W. Bennett, S. Boies, J. Gould, and S. Greene. Its: a tool for rapidly developing interactive applications. ACM Trans. Inf. Syst., 8(3):204–236, 1990. doi: 10.1145/98188.98194
- [54] L. Xie, Y. Lin, C. Liu, H. Qu, and X. Shu. Datawink: Reusing and adapting svg-based visualization examples with large multimodal models. IEEE Transactions on Visualization and Computer Graphics, 32(1):824–834, 2026. doi: 10.1109/TVCG.2025.3634635
- [55] Y. Xu, S. Xiang, Y. Song, R. Sun, and X. Tong. Duetui: A bidirectional context loop for human-agent co-generation of task-oriented interfaces. In Proceedings of the 2026 CHI Conference on Human Factors in Computing Systems, CHI ’26. Association for Computing Machinery, 2026. doi: 10.1145/3772318.3790441
- [56] D. Yang, L. Zhang, Z. Yue, L. Chen, Y. Xu, W. Wang, and Q. Jin. Chartm3: Benchmarking chart editing with multimodal instructions. In Proceedings of the 33rd ACM International Conference on Multimedia, MM ’25, p. 5001–5009. Association for Computing Machinery, 2025. doi: 10.1145/3746027.3755714
- [57] Y. Ye, J. Hao, Y. Hou, Z. Wang, S. Xiao, Y. Luo, and W. Zeng. Generative AI for Visualization: State of the Art and Future Directions. Visual Informatics, 8:43–66, 2024. doi: 10.1016/j.visinf.2024.04.003
- [58] L. Ying, Y. Wang, H. Li, S. Dou, H. Zhang, X. Jiang, H. Qu, and Y. Wu. Reviving static charts into live charts. IEEE Transactions on Visualization and Computer Graphics, 31(8):4314–4328, 2025. doi: 10.1109/TVCG.2024.3397004
- [59] B. Yu and C. T. Silva. Flowsense: A natural language interface for visual data exploration within a dataflow system. IEEE Transactions on Visualization and Computer Graphics, 26(1):1–11, 2020. doi: 10.1109/TVCG.2019.2934668
- [60] X. Zeng, H. Lin, Y. Ye, and W. Zeng. Advancing Multimodal Large Language Models in Chart Question Answering with Visualization-Referenced Instruction Tuning. IEEE Transactions on Visualization and Computer Graphics, 31(1):525–535, 2024. doi: 10.1109/TVCG.2024.3456159
- [61] X. Zhao, X. Liu, Y. Haoyue, X. Luo, F. Zeng, J. Li, Q. Shi, and C. Chen. ChartEdit: How far are MLLMs from automating chart analysis? evaluating MLLMs’ capability via chart editing. In W. Che, J. Nabende, E. Shutova, and M. T. Pilehvar, eds., Findings of the Association for Computational Linguistics: ACL 2025, pp. 3616–3630. Association for Computational Linguistics, 2025. doi: 10.18653/v1/2025.findings-acl.185