CMD-3 Collaboration
Evidence of the reaction with the CMD-3 detector at VEPP-2000
Abstract
A search for the reaction is performed with the CMD-3 detector at the VEPP-2000 collider. Data from a scan in the center-of-mass energy range =1.20–1.36 GeV with 109.1 pb-1 of the integrated luminosity is used. A dedicated 51.7 pb-1 have been collected at the resonance peak energy =1282 MeV, where events have been found in the reaction. No indication of the signal is observed in the scan data. We interpret the result as 4.5 evidence of the C-even resonance production in the reaction via the two-photon interaction. The production cross section is found to be nb, and the corresponding branching fraction to the pair is .
pacs:
13.66.Bc, 14.40.Cs, 13.25.Gv, 13.25.Jx, 13.20.JfA single C-even resonance in the collision can be produced only via two-photon annihilation, which is suppressed by a factor , fine structure constant squared, comparing with the dominant single photon mechanism. However, observation of events in the collision for such a resonance provides a significantly better estimate of the decay rate to in this ”inverse” reaction in comparison to a direct decay search. Many experiments were performed for the search of single C-even resonances using inverse reaction, see for example ND ; SND1 ; SND2 ; SND3 ; BES1 , but unfortunately only upper limits were set. For the first time the charmonium state has been observed in the annihilation by the BESIII Collaboration BES2 as an interference pattern in the energy scan, and a branching fraction for the decay is extracted.
Axial-vector resonance does not decay into two real photons, but can be produced via two virtual photons in the annihilation. It makes this process very interesting from the theoretical point of view, in particular for the understanding of the light-by-light contribution to the anomalous magnetic moment of muon .
The SND collaboration reported detection of two events, indicated the reaction sndf1 , corresponding to the branching fraction , or to the upper limit for 90% CL. The result is in agreement with theoretical estimations Rud ; Milst , but uncertainties, both in the experiment and theory, are relatively large.
In this paper we present results of the new search for the reaction, based on the 109.1 pb-1 integrated luminosity collected in the scan of the =1200–1360 MeV center-of-mass (c.m.) energy range with 20 MeV step, and dedicated 51.7 pb-1 at the c.m. energy corresponding to the resonance mass pdg . We search a signal from the resonance in the decay () pdg which is forbidden for the single photon production. More than 70% of the decays have intermediate state, and it helps to identify the reaction.
The general-purpose detector CMD-3 has been described in detail elsewhere sndcmd3 . The detector tracking system consists of a cylindrical drift chamber (DC) dc placed inside a thin (0.2 X0) superconducting solenoid with a field of 1.3 T. The barrel liquid-xenon (LXe) calorimeter with a 5.4 X0 thickness has fine electrode structure, providing a 1–2 mm spatial resolution for photons lxe , and also improving separation of the close showers. The barrel CsI crystal calorimeter is placed outside the LXe calorimeter and increases the total thickness to 13.5 X0. The end cap BGO calorimeter with a thickness of 13.4 X0 is placed inside the solenoid cal . The luminosity is measured using events of Bhabha scattering at large angles with about 1% accuracy lum . The simulation for the reaction uses a primary generator with matrix elements, corresponding to the dominant decay as well as a possible contribution from the reaction. The Monte Carlo (MC) simulation of the detector is based on the GEANT4 geant4 package, and all generated events pass the full reconstruction and selection procedure. The generators also include a soft photon radiation by the initial electron or positron calculated according to Ref. kur_fad .
In this analysis we use the data collected at the expected resonance maximum =1282 MeV with the integrated luminosity of 51.7 pb-1, and data from the scan in the energy range =1200–1360 MeV with 20 MeV step with the total 57.4 pb luminosity integral which is used as a control sample.

We identify the candidate events using the decay with six or more (background) photons in final state. A major background process with a large cross section is . This process has five photons in the final state, but the calorimeter detects many soft background photons with the energy exceeding 25 MeV, therefore it contribute to the signal sample. We study the process separately and keep events also with five and more photons. The reconstructed energy and angles of each six (five) photon combination in the event is subject to the 6C kinematic fit for the () hypothesis, with the total energy and momentum constrained to and zero, respectively, and two photon pairs with are constrained to the mass. All possible photon pair combinations are tested. The events with the best () values are retained. Figure 1(a) demonstrates the distribution for data (points) and simulation (shaded histogram). The events with the best and are used for the next analysis step. The latter requirement reduces a large fraction of the background events. For the remaining events with the two ’s and two unconstrained photons we calculate a invariant mass (take one combinations closest to the mass), and retain events with to suppress a remaining background. The simulated and experimental histograms after requirement are demonstrated in Fig. 2 for =1282 MeV.

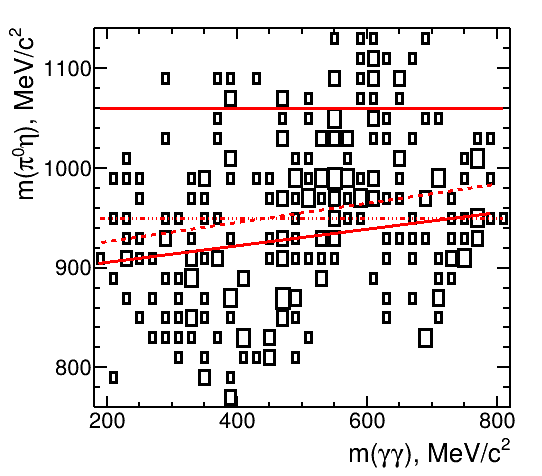


Figure 3(a) shows a two-dimentional plot of the invariant mass (one combination closest to the mass is taken) vs invariant mass of the unconstrained photon pair after applied selections. A clear indication of the signal bump at the mass and the mass is seen. Similar plot for the scan data is shown in Fig. 3(b) with no signal indication. To maximize the signal-to-background ratio (FOM = S/sqrt(B)) we select events within solid lines shown in Fig. 3 around the mass. This selection makes the background distributions almost ”flat” and simplifies a signal extraction procedure. Other selections, shown by dashed and dash-dotted line in Fig. 3(a), are used for the systematic uncertainties estimation, discussed below. A projection plot of the invariant mass within these lines is shown in Fig. 4(a). A projection plot of the invariant mass in the 500–600 interval of the invariant mass is shown in Fig. 4(b), demonstrating the resonance signal.
A fit of the distribution with a sum of double Gaussian function for a signal and 2-nd order polynomial function to describe a background is shown by a solid curve in Fig. 4(a). All parameters of the signal function, except number of events are fixed from the simulated distribution, shown by a shaded histogram. The nominal likelihood fit gives events with = 21.8/26. The signal significance is , and is calculated as , where and are the likelihood values with and without (shown by a dashed curve in Fig. 4(a)) signal component, respectively. We use the obtained numbers for the cross section calculation.
A similar fit with the background described by the constant gives events with = 22.7/28 and significance. We cannot prove that the background has uniform distribution, and the difference in the number of events with the nominal fit above is used to estimate the uncertainty from the background subtraction procedure.
We also use a direct count of the events in the 500–600 signal region, 41 events, and use 56 events from the two intervals, 200–460 and 640–800 , to estimate a background level in the signal mass interval. With the 13.3 events of the estimated background we obtain signal events associated with the reaction, close to that from the fits. This approach less depends on the uncertainty in the signal shape but also assumes linear background shape.
To be confident that no other processes influence the result, we process data from the = 1200 – 1360 MeV scan with 20 MeV step with the integrated luminosity of 57.4 pb-1 which is comparable with that at =1282 MeV. All above selections are applied to the scan data, and the result is shown in Fig. 3(b) and Fig. 4(c). A background events level for the scan data is comparable with that for signal region and is almost flat. No indication of a peaking background is seen. The fit with the double Gaussian and 2-nd order polynomial functions yields signal events.
We calculate a cross section of the reaction at the resonance maximum using
expression, where nb-1 is the integrated luminosity, is the detection efficiency, is the radiative correction, and is the relative decay rate of the to the detected final state. For the detection efficiency we use a mixture of the 50000 simulated events in the decay mode and 20000 events in the mode, approximately corresponding to the (738)% dominance of the first one pdg . Uncertainties in the efficiency and radiative correction are negligibly small. We obtain
as the peak cross section, and the corresponding branching fraction
where MeV2nb is the conversion constant.
Systematic uncertainties, shown as the second errors above, are dominated by the uncertainty in the background subtraction procedure, 1-2 events, and the uncertainties from variations of the selection criteria in the 2D plot, shown by dashed and dash-dotted lines in Fig. 3, 10% in total. The uncertainty in the cross section normalization, 5%, is estimated by the comparison of the background process cross section with the other measurement from Ref. snd5g . The uncertainty in the decay modes gives 5%.
In summary: we perform a search for the reaction with the CMD-3 detector at the VEPP-2000 collider. At the expected resonance maximum with the 51.7 pb-1 of the integrated luminosity events have been found corresponding significance of the signal. In the control sample, collected at the nearby energies with the 57.4 pb-1 of the integrated luminosity, no significant signal is observed. The calculated cross section nb is in agreement with that presented by the SND experiment sndf1 , and is in agreement with the theoretical estimate in Ref. Milst . The branching fraction of the to the pair is found to be . The systematic uncertainties allow us conservatively to interpret our result as the first evidence of the direct C-even resonance production in the collision.
References
- (1) P. V. Vorob’ev et al. (ND Collaboration), Sov. J. Nucl. Phys. 48, 273 (1988) [Yad. Fiz. 48, 436 (1988)].
- (2) M. N. Achasov et al. (SND Collaboration), Phys. Lett. B 492, 8 (2000).
- (3) M. N. Achasov et al. (SND Collaboration), Phys. Rev. D 91, 092010 (2015).
- (4) M. N. Achasov et al. (SND Collaboration), Phys. Rev. D 98, 052007 (2018).
- (5) M. Ablikim et al. (BESIII Collaboration), Phys. Lett. B 749, 414 (2015).
- (6) M. Ablikim et al. (BESIII Collaboration), Phys.Rev.Lett. 129 (2022) 12, 12
- (7) M. N. Achasov et al. (SND Collaboration), Phys.Lett.B 800 (2020) 135074
- (8) A. S. Rudenko, Phys. Rev. D 96, 076004 (2017).
- (9) A. I. Milstein and A. S. Rudenko, arXiv:1909.07938 [hep-ph].
- (10) S. Navas et al. (Particle Data Group), Phys. Rev. D110, 030001 (2024) and 2025 update.
- (11) V.V. Danilov et al., Proceedings EPAC96, Barcelona, p.1593 (1996); I.A. Koop, Nucl. Phys. B (Proc. Suppl.) 181-182 (2008) 371.
- (12) B.I. Khazin, Nucl. Phys. B (Proc. Suppl.) 181-182, (2008) 376.
- (13) F. Grancagnolo et al., Nucl. Instr. Meth. A623 (2010) 114.
- (14) A.V. Anisyonkov et al., Nucl. Instr. Meth. A598 (2009) 266.
- (15) D. Epifanov (CMD-3 Collaboration), J. Phys. Conf. Ser. 293 (2011) 012009.
- (16) R.R. Akhmetshin et al., Nucl. Phys. B (Proc. Suppl.) 225-227 (2012) 69.
- (17) S. Agostinelli et al. (GEANT4 Collaboration), Nucl. Instr. Meth. A506 (2003) 250.
- (18) E.A. Kuraev and V.S. Fadin, Sov. J. Nucl. Phys. 41, (1985) 466; S. Actis et al., Eur. Phys. J. C66 (2010) 585.
- (19) V. Abakumova et al., Phys. Rev. Lett. 110 (2013) 140402.
- (20) S.S. Gribanov and A.S. Popov, JINST 18 (2023) P05030.
- (21) M. N. Achasov et al. (SND Collaboration), Phys. Rev. D94 (2016) 11, 112001