Cataclysmic variables from Gaia XP spectra: The Gaia emission-line magnitude (GEM) diagram
Abstract
Gaia Data Release 3 (DR3) opens a new window for the census of Galactic stellar populations in all-sky surveys, specifically for identifying cataclysmic variables (CVs). While the majority of CVs are distributed below the main sequence on the Gaia Hertzsprung-Russell (HR) diagram, identifying them among dominant background stellar populations remains a significant challenge. Here, we present the Gaia Emission-line Magnitude (GEM) diagram — a tool designed to isolate CV candidates from background stars located below the main sequence. Using Gaia photometric data and low-resolution BP/RP (XP) spectra, we construct the GEM diagram by plotting the extinction-corrected absolute magnitude () against the pseudo-equivalent width of the H line (), which is computed via a Gaussian line-profile approximation. We find that known CVs and major stellar background populations, including white dwarfs, hot subdwarfs, and white dwarf-main sequence binaries, occupy distinct regions on the GEM diagram, reflecting both their physical properties and the low-resolution nature of the Gaia XP spectra. We define an empirical selection line on the GEM diagram to separate true H-emitting CVs from background contaminants. As a proof of concept, we apply the GEM diagram to a Gaia volume-limited sample within 250 pc () distributed below the main sequence, recovering known CVs. Additionally, we identify three new CV candidates whose accreting nature is supported by archival X-ray data and optical variability. Compared to traditional optical color-based selection techniques, the GEM diagram uses Gaia’s low-resolution spectra for initial target identification in all-sky surveys. This provides a more reliable framework for the statistical selection of CV candidates prior to ground-based spectroscopic follow-up and can be scaled to future Gaia data releases to map Galactic emission-line star populations.
1 Introduction
Cataclysmic variables (CVs) are semi-detached binaries in which a primary white dwarf (WD) accretes matter from a companion star that fills its Roche lobe (Warner, 2003). Being the most numerous accreting binaries in the Milky Way, CVs serve as good laboratories for studying binary evolution, accretion physics, and high-energy phenomena (see for reviews, Mukai, 2017; Scaringi et al., 2026). New CVs are commonly discovered as by-products of wide-field photometric, spectroscopic, and X-ray surveys rather than through dedicated systematic searches in all-sky surveys (e.g., Motch et al., 1996; Szkody et al., 2002; Gänsicke et al., 2009; Szkody et al., 2020). A recent example of a systematic approach is the X-ray main sequence (Rodriguez, 2024), which combines Gaia colors with the X-ray-to-optical flux ratio to efficiently identify accreting compact objects (e.g., Galiullin et al., 2024; Rodriguez et al., 2025; Liu et al., 2025).
The Gaia mission has transformed stellar astronomy by providing homogeneous all-sky astrometry and broadband photometry for more than a billion sources (Gaia Collaboration et al., 2016, 2018, 2021, 2023b). Gaia Data Release 3 (DR3) introduced low-resolution mean spectra from the Blue and Red Photometers (BP/RP), commonly referred to as XP spectra, for approximately 220 million sources (Gaia Collaboration et al., 2023b; De Angeli et al., 2023). These spectra cover a wavelength range of – nm. While the resolving power of Gaia XP spectra is insufficient for detailed line analyses, sufficiently strong lines (e.g., the H line) can be detected at that resolution. Recent studies have used Gaia XP spectra to estimate stellar atmospheric parameters (Andrae et al., 2023a, b; Zhang et al., 2023), as well as to systematically search for H emitters (Carrasco et al., 2026; Malhotra et al., 2026; Rodriguez et al., 2026), polluted WDs (Pérez-Couto et al., 2024; Kao et al., 2024), metal-poor stars (Yao et al., 2024), binary stars (Li et al., 2025b, a), carbon stars (Roulston et al., 2025), hot subdwarfs (Ambrosch et al., 2026), and young stellar objects (Delfini et al., 2025). These diverse applications demonstrate that the vast number of available Gaia XP spectra, combined with precise parallaxes and photometry, provides a powerful statistical foundation for the systematic classification and candidate selection of Galactic stellar populations.
On the Gaia Hertzsprung–Russell (HR) diagram, the region below the main sequence is primarily dominated by non-accreting background stellar populations, including isolated WDs, hot subdwarfs, and inactive binaries. Abril et al. (2020) demonstrated that the majority of known CVs are also distributed below the main sequence, placing them co-spatial with these stellar classes. This alignment makes CVs indistinguishable from the background stellar populations through broadband photometry alone. In the optical spectrum, CVs exhibit prominent emission lines, most notably the H line, while most background populations remain spectrally featureless or display absorption lines. The primary exception arises from white dwarf-main sequence (WD+MS) binaries. In these systems, real chromospheric H emission from the active M-dwarf companion, combined with steep titanium oxide (TiO) molecular absorption bands, can create pseudo-lines in low-resolution Gaia XP spectra. Analyzing the specific spectral features in the Gaia XP spectra of both CVs and background stellar populations allows us to define empirical selection boundaries between these groups. To date, no systematic search for CV candidates has been performed using Gaia XP spectra.
In this paper, we present the Gaia Emission-line Magnitude (GEM) diagram, a diagnostic tool designed to isolate CV candidates from the dominant background stellar populations distributed below the main sequence on the Gaia HR diagram. The GEM diagram improves upon traditional color-based selection methods by using the spectroscopic information available in Gaia XP data. This approach provides a practical framework to statistically select CV candidates prior to ground-based spectroscopic follow-up. As a proof of concept, we apply the GEM diagram to a Gaia volume-limited sample within 250 pc (). Our approach recovers the known CVs within this volume while simultaneously identifying three promising new CV candidates.
This paper is structured as follows. In Section 2, we describe the compilation of the sample of known CVs and background stellar populations used to construct the GEM diagram. In Section 3, we describe the H line identification pipeline and the calculation of pseudo-equivalent widths from Gaia XP spectra. In Section 4, we present the GEM diagram, define our empirical selection criterion, and demonstrate its application to a Gaia volume-limited sample within 250 pc. Finally, we summarize our results in Section 5.
2 Data
The region below the main sequence on the Gaia HR diagram is primarily occupied by isolated hot subdwarfs, WDs, and WD+MS binaries (see Figure 1). None of these stars are expected to show prominent emission lines in the optical spectra, with the exception of active M dwarfs within WD+MS systems. Therefore, any source located below the main sequence on the Gaia HR diagram that demonstrates strong emission lines serves as a reliable CV candidate.
To characterize the Gaia XP spectral signatures of both the CVs and background stellar populations below the main sequence on the Gaia HR diagram, we downloaded catalogs of known systems and then cross-matched them with Gaia DR3 (Gaia Collaboration et al., 2023b). We applied the following quality cuts to the Gaia data across all catalogs:
-
1.
mag
-
2.
-
3.
-
4.
We describe each of these stellar populations in more detail below.
– Cataclysmic variables. We compiled a sample of known CVs from multiple catalogs: SDSS I–IV (Inight et al., 2023); LAMOST Data Release 11 (DR11) (Cui et al., 2012; Luo et al., 2026); the final version (December 31, 2015) of the Ritter and Kolb (R&K) catalog (Ritter and Kolb, 2003); and the catalog of polars, low-accretion rate polars (LARP), and candidate objects (PolarCat; Schwope, 2025). For the R&K catalog, we kept only sources with a positional accuracy better than 2, resulting in 1399 objects. We cross-matched this catalog with Gaia DR3 using a 2 search radius, leaving 1313 objects. We then applied our Gaia quality cuts to all the CV catalogs. This reduced the sample size to 48 objects for SDSS I–IV, 124 for LAMOST DR11, 335 for the R&K catalog, 35 for PolarCat polars, and 11 for PolarCat LARPs. We merged these catalogs to create a sample of unique CVs based on their Gaia source identification number, prioritizing the R&K catalog if a source was duplicated in SDSS I–IV or LAMOST DR11. This merger resulted in 372 unique CVs. We defined five general CV classes by grouping specific catalog sub-types into broader categories. Specifically, dwarf novae were grouped into “Dwarf Nova” (139 objects), nova-like variables into “Nova-like” (133 objects), polars and intermediate polars into “Magnetic CVs” (49 objects), novae into “Nova” (11 objects), and LARPs into “LARPs” (11 objects). The remaining 29 objects without a specific classification were grouped as “CVs”.
– Hot subdwarfs. We used the catalog of known hot subdwarfs from Culpan et al. (2022), which was compiled from Gaia DR3 and contains 6616 unique sources. First, we applied Gaia quality cuts, which reduced our sample size to 3614 objects. We then filtered this subset based on the provided SIMBAD spectral classifications by grouping related subtypes into broader categories. Specifically, the “sdO”, “sdOC”, “sdOB”, “He-sdO”, and “sdBO” classes were combined into a broad “sdO” class, while the “sdB”, “sdBC”, and “sdBN” labels were combined into a broad “sdB” class. Additionally, any composite spectral label containing a ‘+’ symbol was grouped into the “sd binary” class. This classification yielded a final subset of 2412 hot subdwarfs, including 2198 isolated systems and 214 subdwarf binaries.
– White dwarfs. We used the 40 pc WD sample of O’Brien et al. (2024), constructed from Gaia DR3 data. The sample contains 1076 spectroscopically confirmed WDs spanning various spectral classes. We applied the Gaia quality cuts, which reduced our sample to 876 sources.
– WD+MS binaries. We used the catalog of WD + MS binaries from Rebassa-Mansergas et al. (2025), which contains 1312 objects. We applied the Gaia quality cuts to this dataset, which reduced our sample to 829 sources.
For each of these catalogs, we downloaded the Gaia XP spectral coefficients (Montegriffo et al., 2023; De Angeli et al., 2023) using the Python module astroquery. For all objects, we computed their geometric distances based on parallaxes. We then computed the extinction-corrected absolute magnitudes and colors based on the extinction value from a combination of three dust maps (Combined19map; Drimmel et al., 2003; Marshall et al., 2006; Green et al., 2019), implemented in the mwdust111https://github.com/jobovy/mwdust package (Bovy et al., 2016).

3 Methods

3.1 Line search in Gaia XP spectra
We used the Python package GaiaXPy222https://gaia-dpci.github.io/GaiaXPy-website/ v2.1.4 (Gaia Collaboration et al., 2023a) to sample the Gaia XP spectra from their continuous representation onto a discrete wavelength grid. To search for emission or absorption lines, we used the find_extrema tool333https://gaia-dpci.github.io/GaiaXPy-website/tutorials/Linefinder%20tutorial.html (Weiler et al., 2023). This tool provides a list of all detected extrema and their properties within the internally calibrated mean Gaia XP spectra. The extrema are identified where the first derivative of the spectrum is equal to zero. For each detected extremum, the tool provides a line identifier (line_name parameter) based on the spectral band (BP or RP) and the pseudo-wavelength. The wavelength at the extremum (wavelength parameter in units of nm) is calculated using the GaiaXPy dispersion function, and the flux value (line_flux parameter in units of ) is measured at that position. The inflection points are found as the closest roots of the second derivative of the spectrum. These inflection points are then used to find the local line width (width parameter in units of nm) and to estimate the local continuum. Finally, the tool gives the line depth (depth parameter in units of ), which is the difference between the line flux and the estimated local continuum. The significance in the internally calibrated Gaia XP spectrum (sig_pwl parameter) and in the externally calibrated spectrum (significance parameter) are calculated as the ratio of the line depth to the flux error at the extremum.
Figure 2 shows representative median Gaia XP spectra for the main classes of objects considered in this work. The optical spectra of CVs are typically characterized by a blue continuum along with strong Balmer, He I and He II emission lines arising from the accretion flow. In non-magnetic CVs, these emission lines often exhibit double-peaked profiles caused by Keplerian motion of matter in the accretion disk (e.g., Smak, 1981; Horne and Marsh, 1986). These double-peaked profiles are typically observed in high-inclination systems viewed near edge-on. While these structures are clearly visible in high-resolution spectra with peak separations of a few nanometers, the low-resolution Gaia XP spectra (see, e.g., ; Carrasco et al., 2021) are insufficient to resolve them. The Gaia XP spectra of WDs and hot subdwarfs generally exhibit blue continua similar to those observed in CVs, but show an absence of emission lines. The median Gaia XP spectrum of WD+MS binaries shows prominent TiO molecular absorption bands arising from the M-dwarf companion. This creates pseudo-emission lines, specifically at wavelengths nm due to Gaia’s low spectral resolution. Chromospherically active M dwarfs can also exhibit true H emission, which complicates the Gaia XP spectra of WD+MS binaries. An M-dwarf companion can also be present in CVs, where the donor star contributes to the red part of the spectrum, showing pseudo-emission lines caused by molecular absorption bands. However, the relative strength of the M-dwarf companion and the corresponding spectral features depend on the accretion rate, inclination angle of the system, magnetic field strength, and the relative contributions of the donor star and WD to the observed spectrum. Both the median Gaia XP spectrum of known CVs and that of the background stellar population show a smooth oscillatory structure. This structure arises from the low-resolution reconstruction and calibration procedure used to generate the Gaia XP spectra (De Angeli et al., 2023; Montegriffo et al., 2023). These features can complicate the identification of weak spectral lines and may introduce spurious line-like signatures. For this reason, we focus our analysis on the H line, where this feature in CVs is sufficiently strong to be detected with high significance.
To find the H line among all extrema identified by the find_extrema tool, we cross-matched the measured wavelength of each detected extremum with the expected wavelength of the H line (656.3 nm). We selected the extrema that fell within a search window of 5 nm ( nm) as the true H line. For multiple matches in the search window caused by spurious, line-like oscillatory structures from Gaia XP spectra, we selected the extremum with the highest sig_pwl parameter, representing the highest line significance in the pseudo-wavelength space. We chose this relatively wide 5 nm search window to account for the high velocities and broad line profiles typical of CV accretion disks (up to 2200 ). This window includes the extrema of most known CVs and the background stellar population used in this work (see Appendix A). We additionally filtered the extrema, keeping only those with a width of less than 15 nm ( nm). This excludes broad features that are not narrow H emission or absorption lines. By applying the 5 nm search window and width cut to identify the H line in the Gaia XP spectra, we obtained a final sample consisting of 245 CVs, 1029 hot subdwarfs, 264 WDs, and 361 WD+MS binaries.
3.2 Pseudo-Gaussian equivalent width
The equivalent width (EW) of a spectral line relative to the local continuum is defined as
| (1) |
where is the total flux at wavelength , is the wavelength-dependent continuum, represents the constant mean local continuum flux, and is the continuum-subtracted line flux. Equation 1 shows that for an absorption line, the equivalent width is negative (), while for an emission line, it is positive ().
We introduce the pseudo-Gaussian equivalent width () as a proxy to characterize the line properties in low-resolution Gaia XP spectra. Assuming a Gaussian line profile, the total area of the spectral line in this approach is given by
| (2) |
where is the maximum amplitude (depth or height) of the line, and is the standard deviation (Gaussian width). Under this Gaussian line profile approximation, the pseudo-Gaussian equivalent width is defined as
| (3) |
While standard equivalent width measurements typically require high-resolution spectroscopy, the framework provides a fast, automated, and self-consistent proxy for line strength in low-resolution Gaia XP spectra. It is calculated directly from the native outputs of the find_extrema pipeline as:
| (4) |
where the distance between the inflection points for a Gaussian line profile is , corresponding to . The factor of derives from the numerical value of . The error of the pseudo-Gaussian equivalent width () is calculated using the line significance given by the find_extrema tool, and is given by:
| (5) |
We used the pseudo-Gaussian equivalent width as a proxy for the H line properties (). We note that the value will differ significantly from a standard measured through high-resolution spectroscopy, primarily due to the low resolution of the Gaia XP spectra and our Gaussian line profile with constant continuum assumption. However, since is calculated uniformly across all objects, it serves as a consistent baseline for our target selection methodology. We applied a quality cut to the parameter, requiring a significance threshold of . This resulted in a final sample of 137 CVs, 637 hot subdwarfs, 142 WDs, and 159 WD+MS binaries.
4 Results and Discussion


4.1 Gaia emission-line magnitude (GEM) diagram
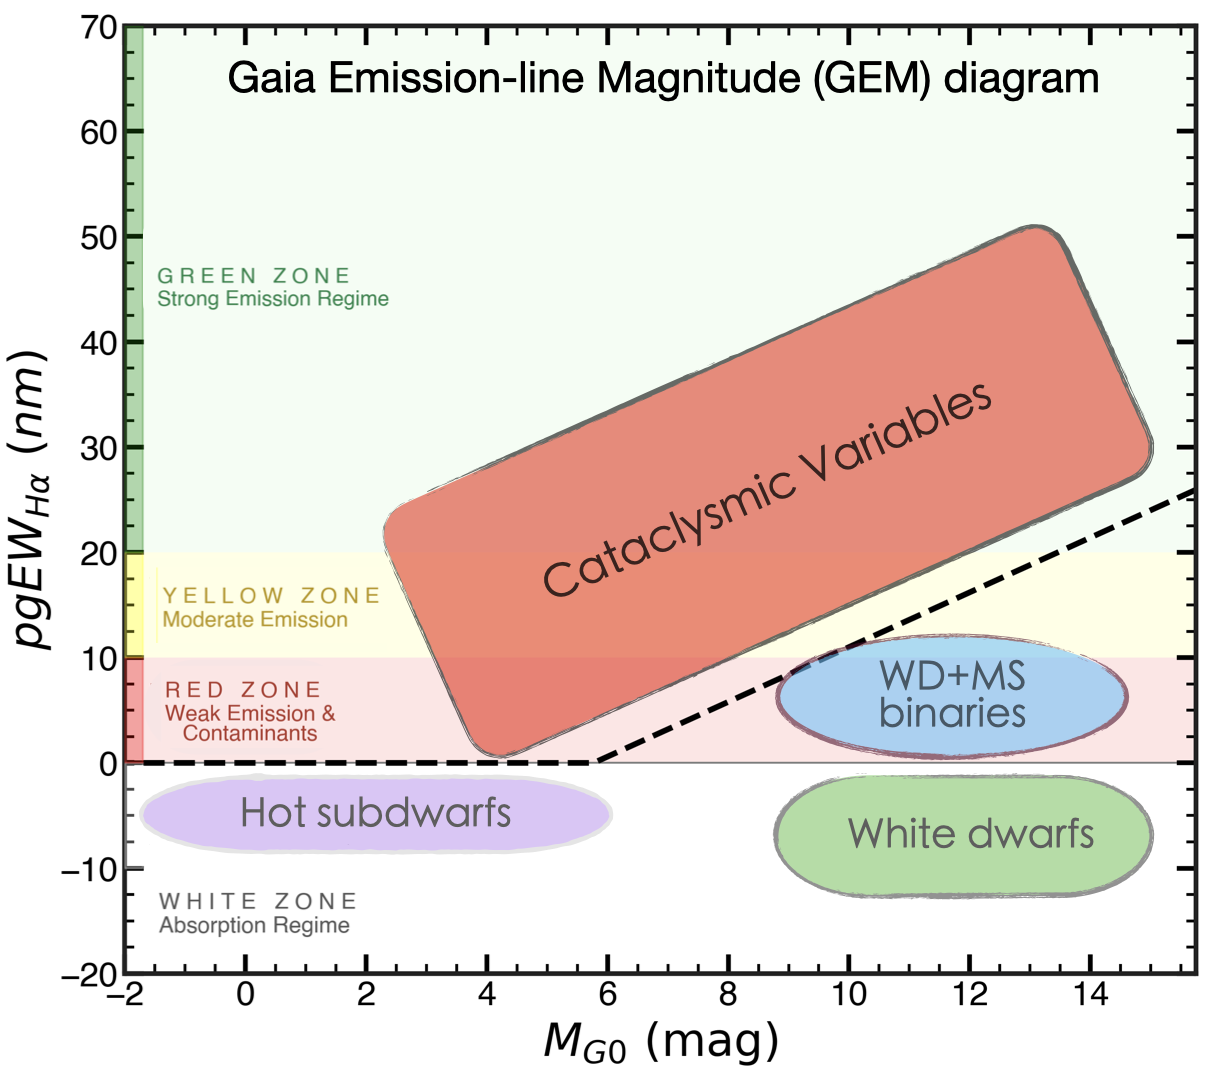
We introduce the Gaia Emission-line Magnitude (GEM) diagram as a diagnostic tool that combines Gaia colors with spectroscopic information from Gaia XP spectra to isolate CV candidates. This diagram plots the H line proxy, , against the absolute Gaia -band magnitude (). Figure 3 shows the GEM diagram for the known CVs along with the background stellar populations, including hot subdwarfs, WDs, and WD+MS binaries. These sources occupy distinct regions on the GEM diagram based on their physical properties and Gaia XP spectral features:
– Cataclysmic variables. CVs are distributed across the GEM diagram in the region with nm and mag. Figure 4 shows the GEM diagram specifically for the different types of CVs (137 objects in total): 60 dwarf novae, 50 nova-like variables, 16 magnetic CVs, 2 LARPs, 1 nova, and 8 unclassified CVs. Two distinct CV populations (nova-like variables and dwarf novae) are visible on the GEM diagram, reflecting fundamental differences in their underlying physics. The majority of nova-like variables clump within nm and mag. Because the optical spectra of nova-like variables are dominated by intense continuum emission from a hot, steady-state accretion disk, their H emission lines appear characteristically weak or diluted compared to dwarf novae. In contrast, the dwarf novae occupy a much broader, fainter regime where nm and mag. Within this population, the increases systematically as the system brightness drops ( increases). This trend continues toward mag, where the Gaia XP spectra of dwarf novae show strong, prominent H emission lines. The distribution of nova-like variables and dwarf novae on the GEM diagram traces the physical transition from disk-dominated light to the line-dominated emission typical of cooler, low-mass transfer systems. Furthermore, CVs are highly variable objects, meaning individual sources can change their positions on the diagram. Specifically, dwarf novae exhibit state transitions that can cause a system to temporarily show H absorption lines (), shifting its position down into the hot subdwarf or WD regions. While the majority of known CVs cluster in their unique region, several known CVs are distributed across the WD+MS binary region on the GEM diagram. Their Gaia XP spectra show M-dwarf donor signatures along with a weak H emission line. Notably, the two LARPs in our sample are distributed close to the WD+MS binary region. The magnetic CVs in our sample do not cluster tightly on the GEM diagram, being instead distributed across the nova-like variable, dwarf nova, and WD+MS binary regions.
– Hot subdwarfs. Hot subdwarfs show strong H absorption lines, primarily falling in the region nm with absolute magnitudes in the range of mag. A few hot subdwarfs show weak positive values ( nm). This artifact is not caused by real emission lines, but rather by systematic continuum fluctuations in the Gaia XP spectra.
– White dwarfs. WDs show strong H absorption lines, primarily falling in the region nm with absolute magnitudes in the range of mag. One object shows a weak positive value ( nm). This artifact is not caused by real emission lines, but rather by systematic continuum fluctuations in the Gaia XP spectra.
– WD+MS binaries. This population splits into two distinct groups on the GEM diagram. The first group has nm and mag, where the WD flux dominates the emission and H absorption lines are seen in the Gaia XP spectra. The second group forms a separate population with nm and mag. These positive pseudo-emission lines are primarily caused by TiO molecular absorption features in the M-dwarf companion, which mimic an H emission line in the low-resolution Gaia XP spectra. However, a subset of WD+MS binaries within this region can still exhibit true H emission lines due to the chromospheric activity of the companion. A few objects in the WD+MS binary catalog have nm and are located in the CV region444Two of these sources, Gaia DR3 6097584212806297984 ( nm) and Gaia DR3 5890007786261623680 ( nm), show M-dwarf signatures in their Gaia XP spectra and are classified as emission-line stars in the SIMBAD database, though a CV nature cannot be definitively ruled out.. Notably, one source, Gaia DR3 1951666884868218112 ( nm), is a known CV (TCP J21290156+3631056; Canbay et al., 2023), while the other source, Gaia DR3 3021820276571880064 ( nm), was independently identified by our GEM diagram as a new CV candidate in the Gaia 250 pc sample (see Appendix B).
Based on the distribution of sources in the GEM diagram, we define a simple, phenomenological zonation using the parameter space. This approach provides a practical framework for identifying the dominant source types across different emission regimes:
-
•
White Zone ( nm) – The Absorption Regime: This region is dominated by sources showing H absorption lines, such as WDs, hot subdwarfs, and a fraction of the WD+MS binaries.
-
•
Red Zone ( nm) – The Weak Emission/Contaminant Regime: This intermediate zone hosts a complex mixture of sources. It contains the majority of bright nova-like variables, some of dwarf novae and magnetic CVs. However, this zone is also heavily contaminated at fainter magnitudes by WD+MS binaries.
-
•
Yellow Zone ( nm) – The Moderate Emission Regime: This transitional zone contains CVs alongside a small number of WD+MS binaries.
-
•
Green Zone ( nm) – The Strong Emission Regime: This high-purity region contains objects showing prominent H emission lines. This zone is dominated by CVs, specifically dwarf novae. Contamination here is minimal, making any source in this zone a strong CV candidate.
While the flat color zones provide a useful descriptive overview of the GEM diagram, using them for target selection can lead to either missing true CVs or including a significant number of WD+MS binaries. We empirically define a boundary (a broken line) in the GEM diagram to capture the majority of true CV candidates while filtering out contaminants. This empirical selection line is defined as:
| (6) |
The first condition in Equation 6 for isolates the majority of CVs from WD+MS binaries, while the second condition for includes nova-like variables and separates them from the majority of hot subdwarfs. A source is subsequently classified as a CV candidate if it lies above this boundary. This empirical boundary is shown as a dashed line in Figures 3 and 4.
4.2 Proof of concept: Application to the Gaia 250 pc sample


To probe how the GEM diagram isolates CV candidates from stellar contaminants during a blind search, we constructed a Gaia volume-limited sample within 250 pc. The following criteria were applied to define this sample:
-
1.
mas
-
2.
-
3.
-
4.
-
5.
-
6.
mag
-
7.
-
8.
To keep only sources located below the main sequence, we applied the following color-magnitude cut:
-
1.
-
2.
This query results in 12247 sources, from which we detected and identified the H line in the Gaia XP spectra of 6728 objects. Filtering these targets with a significance threshold of yields a final sample of 4207 sources. Figure 5 shows the Gaia HR diagram within the 250 pc volume for the objects with detected H lines (left panel) along with their corresponding positions on the GEM diagram (right panel). The distribution of sources on the GEM diagram follows a pattern similar to that in Figure 3, clearly mapping out the expected populations of CVs, hot subdwarfs, WD+MS binaries, and WDs.
To select CV candidates, we applied our empirical selection cut from Equation 6 using the criterion , which resulted in a sample of 62 objects. We cross-matched these 62 candidates with the catalogs of known CVs described in Section 2. Additionally, we queried the SIMBAD database using a search radius to verify their classifications. We found 43 known CVs and 19 sources with different SIMBAD classifications. A manual inspection of these 19 objects using the VizieR database revealed five additional known CVs. In total, out of our 62 CV candidates, we identified 48 known CVs, 11 contaminants with prominent H emission lines (including young stellar objects, emission-line stars, and WD+MS binaries), and three new CV candidates: Gaia DR3 227766037015779200, Gaia DR3 3021820276571880064, and Gaia DR3 3446531278731142912. Based on these cross-matches, our empirical selection line missed only two known CVs, demonstrating that the vast majority of known CVs within our 250 pc sample are recovered by the GEM diagram. All identified CVs, along with the two missed systems, are highlighted in red in Figure 5. We note that emission-line stars or young stellar objects are generally not expected to contaminate the GEM diagram, as the majority of these populations reside on or above the main sequence on the Gaia HR diagram. However, due to peculiar colors or extreme properties (for example viewing through high inclination edge-on disks), a small number of these objects can scatter below the main sequence and fall into the CV zone on the GEM diagram.
Figure 6 shows the GEM diagram for the Gaia 250 pc sample along with variable objects identified by Gaia via the phot_variable_flag = VARIABLE criterion. Out of the 62 CV candidates, 44 exhibit variability. Some of the objects distributed within the WD+MS binary region also show variability, which is likely driven by ellipsoidal modulations or reflection effects. Objects within the WD and hot subdwarf regions are variable as well, primarily due to stellar pulsations. Combining this variability information with the GEM diagram classification provides a powerful tool for identifying true variable CV candidates.
The detailed source identification for the 62 CV candidates and the individual properties of the three new CV candidates are presented in Appendix B.
5 Conclusion
We present a diagnostic tool for stellar astronomy that uses Gaia spectroscopic and photometric data to isolate CV candidates from dominant background stellar populations distributed below the main sequence on the Gaia HR diagram. By combining extinction-corrected absolute magnitudes () with an H line proxy, the pseudo-Gaussian equivalent width (), we introduced the Gaia Emission-line Magnitude (GEM) diagram (see Figure 3). The GEM diagram maps distinct stellar populations, including isolated WDs, hot subdwarfs, and WD+MS binaries, into unique regions of the parameter space based on their intrinsic spectrophotometric properties and Gaia XP low-resolution line profiles. We isolate CVs from the dominant background stellar population by using an empirical target selection boundary on the GEM diagram (see Figure 3 and Equation 6). This selection threshold filters out stellar contaminants, most notably WD+MS binaries where the low-resolution TiO molecular absorption bands from the M-dwarf companion create prominent absorption edges that mimic pseudo H emission features in Gaia XP spectra.
As a proof of concept, we applied the GEM diagram to a volume-limited Gaia sample within (), targeting objects distributed below the main sequence on the Gaia HR diagram (see Figure 5). We identified CV candidates above our empirical boundary. Based on cross-matches with the SIMBAD database, we recovered known CVs while missing only two previously confirmed systems. We identified three new CV candidates (Gaia DR3 227766037015779200, Gaia DR3 3021820276571880064, and Gaia DR3 3446531278731142912), whose accreting natures are independently supported by archival X-ray data (ROSAT, Swift, and SRG/eROSITA) and optical variability in ZTF light curves. The remaining eleven objects are stellar contaminants, including emission-line stars, young stellar objects, and WD+MS binaries (see Appendix B and Table 1). Further spectroscopic follow-up observations of these sources are required to clarify their nature.
In conclusion, the GEM diagram is a promising tool for the initial classification of CV candidates using Gaia spectrophotometric data before performing ground-based spectroscopic observations. This approach provides a reliable framework to accelerate discoveries and expand our census of Galactic compact binaries using upcoming new data from Gaia in combination with the Rubin Observatory Legacy Survey of Space and Time (LSST) and other multi-wavelength missions. Furthermore, the GEM diagram can be applied to the entire Gaia dataset to help identify emission-line stars across the Milky Way.
Acknowledgments
This work has made use of data from the European Space Agency (ESA) mission Gaia (https://www.cosmos.esa.int/gaia), processed by the Gaia Data Processing and Analysis Consortium (DPAC, https://www.cosmos.esa.int/web/gaia/dpac/consortium). Funding for the DPAC has been provided by national institutions, in particular the institutions participating in the Gaia Multilateral Agreement. This work has made use of the Python package GaiaXPy, developed and maintained by members of the Gaia Data Processing and Analysis Consortium (DPAC), and in particular, Coordination Unit 5 (CU5), and the Data Processing Centre located at the Institute of Astronomy, Cambridge, UK (DPCI). This research has made use of the VizieR catalogue access tool, CDS, Strasbourg, France (Ochsenbein, 1996). The original description of the VizieR service was published in Ochsenbein et al. (2000). This research has made use of the SIMBAD database, operated at CDS, Strasbourg, France (Wenger et al., 2000).
References
- Disentangling cataclysmic variables in Gaia’s HR diagram. MNRAS 492 (1), pp. L40–L44. External Links: Document, 1912.01531 Cited by: §1.
- Detection of hot subdwarf binaries and He-poor hot subdwarf stars using machine learning methods and a large sample of Gaia XP spectra. A&A 708, pp. A23. External Links: Document, 2601.21727 Cited by: §1.
- Gaia Data Release 3. Analysis of the Gaia BP/RP spectra using the General Stellar Parameterizer from Photometry. A&A 674, pp. A27. External Links: Document, 2206.06138 Cited by: §1.
- Robust Data-driven Metallicities for 175 Million Stars from Gaia XP Spectra. ApJS 267 (1), pp. 8. External Links: Document, 2302.02611 Cited by: §1.
- Second ROSAT all-sky survey (2RXS) source catalogue. A&A 588, pp. A103. External Links: Document, 1609.09244 Cited by: item 1, item 3.
- On Galactic Density Modeling in the Presence of Dust Extinction. ApJ 818 (2), pp. 130. External Links: Document, 1509.06751 Cited by: §2.
- Galactic Model Parameters and Spatial Density of Cataclysmic Variables in the Gaia Era: New Constraints on Population Models. AJ 165 (4), pp. 163. External Links: Document, 2302.11568 Cited by: Table 1, §4.1.
- Internal calibration of Gaia BP/RP low-resolution spectra. A&A 652, pp. A86. External Links: Document, 2106.01752 Cited by: §3.1.
- XP-TEAL: Gaia XP tool for emission and absorption lines: I. Balmer lines in open clusters. A&A 711, pp. A215. External Links: Document, 2606.16520 Cited by: §1.
- The Zwicky Transient Facility Catalog of Periodic Variable Stars. ApJS 249 (1), pp. 18. External Links: Document, 2005.08662 Cited by: item 2, item 3.
- The Large Sky Area Multi-Object Fiber Spectroscopic Telescope (LAMOST). Research in Astronomy and Astrophysics 12 (9), pp. 1197–1242. External Links: Document Cited by: §2.
- The population of hot subdwarf stars studied with Gaia. IV. Catalogues of hot subluminous stars based on Gaia EDR3. A&A 662, pp. A40. External Links: Document, 2203.07938 Cited by: §2.
- Gaia Data Release 3. Processing and validation of BP/RP low-resolution spectral data. A&A 674, pp. A2. External Links: Document, 2206.06143 Cited by: §1, §2, §3.1.
- Star formation and accretion rates within 500 pc as traced by Gaia DR3 XP spectra. A&A 699, pp. A145. External Links: Document, 2505.04699 Cited by: §1.
- A three-dimensional Galactic extinction model. A&A 409, pp. 205–215. External Links: Document, astro-ph/0307273 Cited by: §2.
- A real-time transient detector and the living Swift-XRT point source catalogue. MNRAS 518 (1), pp. 174–184. External Links: Document, 2208.14478 Cited by: item 1.
- The SRG/eROSITA all-sky survey. Identifying the coronal content with HamStar. A&A 684, pp. A121. External Links: Document, 2401.17282 Cited by: item 2.
- The stellar content of the ROSAT all-sky survey. A&A 664, pp. A105. External Links: Document, 2205.12874 Cited by: item 1, item 3.
- Gaia Data Release 2. Summary of the contents and survey properties. A&A 616, pp. A1. External Links: Document, 1804.09365 Cited by: §1.
- Gaia Early Data Release 3. Summary of the contents and survey properties. A&A 649, pp. A1. External Links: Document, 2012.01533 Cited by: §1.
- Gaia Data Release 3. The Galaxy in your preferred colours: Synthetic photometry from Gaia low-resolution spectra. A&A 674, pp. A33. External Links: Document, 2206.06215 Cited by: §3.1.
- The Gaia mission. A&A 595, pp. A1. External Links: Document, 1609.04153 Cited by: §1.
- Gaia Data Release 3. Summary of the content and survey properties. A&A 674, pp. A1. External Links: Document, 2208.00211 Cited by: §1, §2.
- Searching for new cataclysmic variables in the Chandra Source Catalog. A&A 690, pp. A374. External Links: Document, 2408.00078 Cited by: item 1, item 2, item 3, §B.2, §1.
- SDSS unveils a population of intrinsically faint cataclysmic variables at the minimum orbital period. MNRAS 397 (4), pp. 2170–2188. External Links: Document, 0905.3476 Cited by: §1.
- A 3D Dust Map Based on Gaia, Pan-STARRS 1, and 2MASS. ApJ 887 (1), pp. 93. External Links: Document, 1905.02734 Cited by: §2.
- Emission line formation in accretion discs. MNRAS 218, pp. 761–773. External Links: Document Cited by: §3.1.
- Towards a volumetric census of close white dwarf binaries - I. Reference samples. MNRAS 504 (2), pp. 2420–2442. External Links: Document, 2103.06892 Cited by: Table 1, Table 1.
- A catalogue of cataclysmic variables from 20 yr of the Sloan Digital Sky Survey with new classifications, periods, trends, and oddities. MNRAS 524 (4), pp. 4867–4898. External Links: Document, 2304.06749 Cited by: §2.
- Cataclysmic variables from Sloan Digital Sky Survey - V (2020-2023) identified using machine learning. MNRAS 536 (2), pp. 1057–1076. External Links: Document, 2406.19459 Cited by: Table 1.
- Hunting for Polluted White Dwarfs and Other Treasures with Gaia XP Spectra and Unsupervised Machine Learning. ApJ 970 (2), pp. 181. External Links: Document, 2405.17667 Cited by: §1.
- Millions of main-sequence binary stars from Gaia BP/RP spectra. A&A 704, pp. A126. External Links: Document, 2507.09622 Cited by: §1.
- Identification of 30,000 White Dwarf─Main-sequence Binary Candidates from Gaia DR3 BP/RP (XP) Low-resolution Spectra. ApJS 279 (2), pp. 47. External Links: Document, 2501.14494 Cited by: §1.
- Searching for Accreting Compact Object Binaries in SRG/eROSITA eRASS1. ApJ 991 (2), pp. 125. External Links: Document, 2505.10478 Cited by: §1.
- Cited by: §2.
- XP-TEAL: Gaia XP Tool for Emission and Absorption Lines II. Gaia-HELIX catalogue of H emitters in Gaia BP/RP spectra. arXiv e-prints, pp. arXiv:2606.21420. External Links: Document, 2606.21420 Cited by: §1.
- Modelling the Galactic interstellar extinction distribution in three dimensions. A&A 453 (2), pp. 635–651. External Links: Document, astro-ph/0604427 Cited by: §2.
- Gaia Data Release 3. External calibration of BP/RP low-resolution spectroscopic data. A&A 674, pp. A3. External Links: Document, 2206.06205 Cited by: §2, §3.1.
- New cataclysmic variables from the ROSAT All-Sky Survey.. A&A 307, pp. 459–469. Cited by: §1.
- X-Ray Emissions from Accreting White Dwarfs: A Review. PASP 129 (976), pp. 062001. External Links: Document, 1703.06171 Cited by: §1.
- The 40 pc sample of white dwarfs from Gaia. MNRAS 527 (3), pp. 8687–8705. External Links: Document, 2312.02735 Cited by: §2.
- The VizieR database of astronomical catalogues. A&AS 143, pp. 23–32. External Links: Document, astro-ph/0002122 Cited by: Acknowledgments.
- The vizier database of astronomical catalogues. CDS, Centre de Données astronomiques de Strasbourg. External Links: Document, Link Cited by: Acknowledgments.
- A Volume-limited Sample of Cataclysmic Variables from Gaia DR2: Space Density and Population Properties. MNRAS 494 (3), pp. 3799–3827. External Links: Document, 1907.13152 Cited by: Table 1.
- Identifying New High-confidence Polluted White Dwarf Candidates Using Gaia XP Spectra and Self-organizing Maps. ApJ 977 (1), pp. 31. External Links: Document, 2410.16015 Cited by: §1.
- Magnitude-limited catalogue of unresolved white dwarf-main sequence binaries from Gaia DR3. A&A 699, pp. A153. External Links: Document, 2505.15895 Cited by: §2.
- Catalogue of cataclysmic binaries, low-mass X-ray binaries and related objects (Seventh edition). A&A 404, pp. 301–303. External Links: Document, astro-ph/0301444 Cited by: §2.
- Cataclysmic Variables and AM CVn Binaries in SRG/eROSITA + Gaia: Volume Limited Samples, X-Ray Luminosity Functions, and Space Densities. PASP 137 (1), pp. 014201. External Links: Document, 2408.16053 Cited by: §1.
- From active stars to black holes ii: discovery of h-alpha emission in ultra-low resolution gaia xp spectra with machine learning. In Proceedings of PAI 2026, Cited by: §1.
- From Active Stars to Black Holes: A Discovery Tool for Galactic X-Ray Sources. PASP 136 (5), pp. 054201. External Links: Document, 2401.09537 Cited by: item 1, item 2, item 3, §B.2, §1.
- Carbon Stars from Gaia Data Release 3 and the Space Density of Dwarf Carbon Stars. ApJ 982 (2), pp. 184. External Links: Document, 2501.18763 Cited by: §1.
- Accreting White Dwarfs: An Unreview. Space Sci. Rev. 222 (3), pp. 32. External Links: Document, 2603.10150 Cited by: §1.
- PolarCat: Catalog of polars, low-accretion rate polars, and candidate objects. A&A 698, pp. A106. External Links: Document, 2505.10337 Cited by: §2.
- On the emission lines from rotating gaseous disks.. Acta Astron. 31, pp. 395–408. Cited by: §3.1.
- Cataclysmic Variables from The Sloan Digital Sky Survey. I. The First Results. AJ 123 (1), pp. 430–442. External Links: Document, astro-ph/0110291 Cited by: §1.
- Cataclysmic Variables in the First Year of the Zwicky Transient Facility. AJ 159 (5), pp. 198. External Links: Document, 2002.08447 Cited by: §1.
- Cataclysmic Variable Stars. External Links: Document Cited by: §1.
- Analysing spectral lines in Gaia low-resolution spectra. A&A 671, pp. A52. External Links: Document, 2211.06946 Cited by: §3.1.
- The SIMBAD astronomical database. The CDS reference database for astronomical objects. A&AS 143, pp. 9–22. External Links: Document, astro-ph/0002110 Cited by: Acknowledgments.
- 200 000 candidate very metal-poor stars in Gaia DR3 XP spectra. MNRAS 527 (4), pp. 10937–10954. External Links: Document, 2303.17676 Cited by: §1.
- Parameters of 220 million stars from Gaia BP/RP spectra. MNRAS 524 (2), pp. 1855–1884. External Links: Document, 2303.03420 Cited by: §1.
Appendix A H line identification


In this Appendix, we discuss the empirical thresholds applied to our H line identification pipeline using the output list from the find_extrema tool.
Left panel of Figure 7 shows the distribution of all detected extrema wavelengths ( nm) across different stellar populations: CVs, WDs, WD+MS binaries, and hot subdwarfs. No filtering based on the sig_pwl parameter was applied to these detected extrema. The wavelength distribution for CVs is narrow and drops off significantly beyond nm, with a similar shape observed for WDs. In contrast, the WD+MS binaries exhibit a wider distribution. This broadening is primarily driven by the molecular absorption bands of M-dwarf companions, which are smoothed out by the low-resolution nature of the Gaia XP spectra. The distribution for hot subdwarfs is also wide, extending past nm. Right panel of Figure 7 shows the distribution of all detected extrema wavelengths for the Gaia sample within 250 pc located below the main sequence on the Gaia HR diagram. The 5 nm search window isolates the true H line, specifically for CVs. In contrast, a wider window would include artifact peaks and pseudo-lines, introducing false-positive sources to the GEM diagram. While individual stellar subclasses in the left panel of Figure 7 show asymmetric or distinct profile variations, the collective distribution for the bulk of the Gaia 250 pc sample is remarkably symmetric. The empirical 5 nm window thus serves as a clean, symmetric boundary for H line identification.
Figure 8 shows the distribution of the detected line widths within the 5 nm search window for each stellar population (left panel) and for the Gaia 250 pc sample (right panel). The line width distribution for CVs primarily extends up to 15 nm, with a few outliers above this value. In contrast, the distributions for WDs, hot subdwarfs, and WD+MS binaries extend well beyond 15 nm, reaching widths up to 40 nm. The nm cut excludes broad, smoothed continuum features or fluctuations that do not correspond to true H lines.
Based on the empirical distributions shown in Figures 7 and 8, we adopt a 5 nm search window and a line width threshold of nm for the H line identification in this work. All sources presented in the GEM diagram are selected using these exact criteria. We note that while alternative thresholds could be chosen to prioritize either the completeness or the purity of the sample, our current selections are optimized specifically for the GEM diagram and are applied uniformly to all objects.
Appendix B Gaia 250 pc sample
In this Appendix, we describe in more detail the identification of known sources from the Gaia 250 pc sample located above our empirical selection line on the GEM diagram. We present the individual properties of our three newly identified CV candidates.
B.1 Known source identification


Based on our empirical selection line in Equation 6, we selected 62 objects as CV candidates satisfying the criterion . We cross-matched this sample with the catalogs of known CVs described in Section 2 using their Gaia source IDs. We also queried the SIMBAD database using a search radius to find remaining known CVs. Out of these 62 objects, 43 objects were classified as known CVs. The remaining 19 sources had different SIMBAD classifications:
-
•
Emission-line stars (8 objects)
-
•
White dwarfs (2 objects)
-
•
Young stellar objects (2 objects)
-
•
Planetary nebula candidate (1 object)
-
•
Proper motion stars (1 object)
-
•
Star (1 object)
-
•
Eclipsing binaries (1 object)
-
•
Possible CV candidates (1 object)
-
•
Unclassified sources (2 objects)
We manually investigated these 19 sources by cross-matching them with the VizieR database. Out of these 19 objects, we identified 5 additional known CVs, which were originally classified in SIMBAD as a possible CV candidate (1 object), a star (1 object), a WD (1 object), or unclassified (2 objects). The remaining sources were grouped into four main categories based on their SIMBAD types and properties:
-
1.
Emission-line stars (ELS): This group includes 7 objects originally classified as emission-line stars (6 objects) or a planetary nebula candidate (1 object) in the SIMBAD database.
-
2.
Young stellar objects (YSO): This group includes 2 objects with young stellar object classifications from the SIMBAD database.
-
3.
WD+MS binaries (WD+MS): This group includes 2 objects (originally classified as an eclipsing binary and a proper motion star) where visual inspection of their Gaia XP spectra showed clear M-dwarf type signatures alongside a hot compact component.
-
4.
New CV candidates: This group includes 3 objects originally classified as emission-line stars (2 objects) or a WD (1 object).
Finally, out of our 62 selected CV candidates, 48 are known CVs, 7 are emission-line stars, 2 are young stellar objects, 2 are WD+MS binaries, and 3 are new CV candidates. Figure 9 shows the distribution of the 62 sources on the Gaia HR diagram (left) and GEM diagram (right) along with their identified groups. The young stellar objects, emission-line stars, and WD+MS binaries groups are distributed close to the main sequence on the Gaia HR diagram. While these stellar populations (except WD+MS binaries) are normally expected to lie on or above the main sequence, peculiar properties can cause them to shift downward and locate them within the CV selection zone on the GEM diagram. A detailed individual investigation of all selection outliers is beyond the scope of this paper.
To estimate how many known CVs might have been missed, we cross-matched the entire Gaia 250 pc sample (4207 objects) with the SIMBAD database using a search radius. This query revealed 44 known CVs across the entire volume sample555One object, Gaia DR3 1111086122258605952, is classified as a CV by the SIMBAD database but showed an H absorption line in Gaia XP spectrum along with . Recent classification of Gaia DR3 1111086122258605952 shows that this is a WD, so we removed it from the sample., while only two sources were located below the selection line on the GEM diagram. We included these two sources in Figure 9 for completeness.
Table 1 presents the full list of the 62 CV candidates located above the empirical selection line on the GEM diagram. For each object, we provide its celestial coordinates (R.A. and Dec.), Gaia apparent () and absolute magnitudes (), pseudo-Gaussian equivalent widths for the H line (), Gaia variability flags, and its primary SIMBAD classification. Individual notes for each object are given in the final column of the table. We note that the two emission-line stars with nm were removed from Figure 3 and Figure 9 for illustrative purposes.
B.2 New CV candidates
We analyzed the X-ray and optical properties of the three new CV candidates identified with our empirical selection cut on the GEM diagram. We manually searched for available data in the VizieR database using a 2 search radius. We used the X-ray fluxes of our targets to estimate their X-ray luminosities and X-ray-to-optical flux ratios (). Optical fluxes were derived from the Gaia -band magnitudes, assuming the AB magnitude system and a central wavelength of Å. All X-ray fluxes were converted to the keV energy band using the WebPIMMS tool666https://heasarc.gsfc.nasa.gov/cgi-bin/Tools/w3pimms/w3pimms.pl, assuming a power-law model with a photon index of 1.7. We investigated the presence of accretion activity using the X-ray main sequence diagram (Rodriguez, 2024), where selection cuts from Rodriguez (2024) and the stricter criteria from Galiullin et al. (2024) were applied to independently verify our targets as CV candidates. We analyzed the optical variability of the CV candidates using ZTF light curves. We searched for periodicities in the range of 0.5 to 12 hours using the Lomb-Scargle periodogram, identifying the best-fit period based on the peak value of the power spectrum. The individual properties of the three new CV candidates are discussed below.
-
1.
Gaia DR3 227766037015779200: This source is classified as a WD in the SIMBAD database. The source has an apparent Gaia -band magnitude of mag, a color of mag, and a distance of pc. It is located close to the WD sequence on the Gaia HR diagram (see Figure 9, left panel). The target was detected in the X-rays by both the ROSAT (Boller et al., 2016; Freund et al., 2022) and Swift-XRT (Evans et al., 2023) observatories, showing a mean X-ray flux of erg s-1 cm-2. This corresponds to an X-ray luminosity of erg s-1. Its X-ray-to-optical flux ratio is , which significantly exceeds the selection thresholds for CV candidates proposed by both Rodriguez (2024) () and Galiullin et al. (2024) (). The Gaia XP spectrum displays a blue continuum with an emission line, a characteristic signature of CVs (see Figure 10, left panel). Analysis of the ZTF light curve reveals only long-term variability (see Figure 10, right panel). No significant periodicity was detected in the ZTF data, with the only notable peaks in the periodogram corresponding to 1-day daily aliases. Its position on the X-ray main sequence diagram, combined with the features in the Gaia XP spectrum, strongly indicates that this object is a highly probable CV candidate.
-
2.
Gaia DR3 3021820276571880064: This source is classified as an emission-line star in the SIMBAD database. The object has an apparent Gaia -band magnitude of mag, a color of mag, and a distance of pc. It is located close to the main sequence on the Gaia HR diagram (see Figure 9, left panel). Notably, this object was an outlier in our original WD+MS sample used to define the GEM diagram (see Figure 3). The target was detected in the X-rays by the SRG/eROSITA observatory (Freund et al., 2024), exhibiting an X-ray flux of erg s-1 cm-2, which corresponds to an X-ray luminosity of erg s-1. Its X-ray-to-optical flux ratio is , which exceeds the baseline selection threshold for CV candidates proposed by Rodriguez (2024) () but falls below the stricter criterion of Galiullin et al. (2024) (). The Gaia XP spectrum shows an emission line along with M-dwarf features, such as TiO molecular bands (see Figure 10, left panel). Analysis of the ZTF light curve reveals a period of hr (see Figure 10, right panel), consistent with values from Chen et al. (2020). Its position on the X-ray main sequence along with the GEM diagram suggests it is a potential CV candidate. However, the strong emission could also be caused by an active M-dwarf companion, or be a blend with molecular bands at the Gaia low spectral resolution, rather than an accretion disk in a CV. The hr period is consistent with CVs, but could be a factor-of-two subharmonic or harmonic of the estimated period. Therefore, this object is a good CV candidate, but it could also be an active binary star.
-
3.
Gaia DR3 3446531278731142912: This source is classified as an emission-line star in the SIMBAD database. The object has an apparent Gaia -band magnitude of mag, a color of mag, and a distance of pc. It is located close to the main sequence on the Gaia HR diagram (see Figure 9, left panel). The target was detected in X-rays by the ROSAT observatory (Boller et al., 2016; Freund et al., 2022), exhibiting an X-ray flux of erg s-1 cm-2, which corresponds to an X-ray luminosity of erg s-1. Its X-ray-to-optical flux ratio is , which exceeds the baseline selection threshold for CV candidates proposed by Rodriguez (2024) () but falls below the stricter criterion of Galiullin et al. (2024) (). Similar to the previous object, the Gaia XP spectrum shows an emission line along with M-dwarf features, such as TiO molecular bands (see Figure 10, left panel). Analysis of the ZTF light curve reveals a period of hr (see Figure 10, right panel), consistent with values from Chen et al. (2020). Its position on the X-ray main sequence along with the GEM diagram suggests it is a potential CV candidate. As discussed for the previous objects, emission can be caused by an active M-dwarf companion or be an artifact of blending with molecular bands at the Gaia low spectral resolution. The hr period is consistent with CVs, but could be a factor-of-two subharmonic or harmonic of the estimated period. Therefore, this object is a good CV candidate, but it could also be an active binary star.
| # | Gaia DR3 | R.A. | Dec. | Gaia | SIMBAD | Note | |||
|---|---|---|---|---|---|---|---|---|---|
| Source ID | (deg) | (deg) | (mag) | (mag) | (nm) | Var. Flag | Class | ||
| 1 | 1030279027003254784 | 129.1779 | +53.4772 | 16.6 | 10.6 | 40.6 | VAR | CV (DN) | SW UMa |
| 2 | 1037411284055821568 | 133.4343 | +57.8112 | 16.1 | 10.2 | 38.6 | VAR | CV (DN) | BZ UMa |
| 3 | 1074721664954807040 | 175.9106 | +71.6891 | 15.2 | 8.8 | 32.3 | VAR | CV (IP) | DO Dra |
| 4 | 1289860214647954816 | 225.6704 | +33.5732 | 17.3 | 10.9 | 36.6 | VAR | CV (DN) | NZ Boo |
| 5 | 1558322303741820928 | 204.9212 | +48.7910 | 17.4 | 11.5 | 15.0 | VAR | CV (DN) | V355 UMa |
| 6 | 1597621426298361216 | 238.3794 | +55.2707 | 17.3 | 11.0 | 12.8 | VAR | CV (P) | MQ Dra |
| 7 | 176429285061830144 | 66.53892 | +35.6957 | 16.1 | 9.8 | 15.6 | VAR | CV (DN) | 1RXS J042608.9+354151 |
| 8 | 1800384942558699008 | 324.5280 | +26.3325 | 15.6 | 10.7 | 59.2 | – | CV (DN) | V627 Peg |
| 9 | 1809844934461976832 | 301.9024 | +17.7040 | 15.2 | 11.9 | 23.5 | VAR | CV (DN) | WZ Sge |
| 10 | 1920126431748251776 | 353.5057 | +39.3607 | 16.0 | 11.6 | 34.0 | VAR | CV (DN) | V455 And |
| 11 | 2208124536065383424 | 342.6677 | +63.4771 | 16.4 | 11.9 | 88.2 | VAR | CV (DN) | GD 552 |
| 12 | 2307289214897332480 | 358.2541 | –38.8632 | 16.3 | 11.4 | 30.2 | VAR | CV (DN) | BW Scl |
| 13 | 2488974302977323008 | 38.61593 | –4.90868 | 15.2 | 10.6 | 26.2 | VAR | CV (DN) | ASASSN-14dx |
| 14 | 2754909740118313344 | 6.295982 | +12.2866 | 17.5 | 11.5 | 38.0 | – | CV (DN) | FL Psc |
| 15 | 286497000368243200 | 83.14130 | +62.7979 | 15.5 | 9.4 | 27.6 | VAR | CV (DN) | V391 Cam |
| 16 | 2923643719394227328 | 100.1986 | –24.3871 | 15.2 | 9.1 | 24.1 | VAR | CV (DN) | PU CMa |
| 17 | 3071240270519385856 | 123.3269 | –1.05758 | 16.0 | 9.6 | 17.7 | VAR | CV (DN) | ASASSN-14ag |
| 18 | 3116059834803771904 | 106.7040 | +3.41298 | 17.1 | 10.6 | 27.3 | VAR | CV (P) | PM J07068+0324 |
| 19 | 3445477328117272576 | 82.13635 | +28.6436 | 16.4 | 9.7 | 13.4 | VAR | CV (P) | RX J0528+2838 |
| 20 | 3955313418148878080 | 189.8833 | +21.1351 | 16.7 | 10.0 | 35.2 | – | CV (DN) | IR Com |
| 21 | 4107290939047483008 | 258.6777 | –29.7293 | 17.2 | 11.0 | 23.4 | – | CV (DN) | OGLE BLG-DN-7 |
| 22 | 4111991385628196224 | 257.0794 | –25.8091 | 15.4 | 10.2 | 25.1 | – | CV (DN) | V2051 Oph |
| 23 | 426306363477869696 | 17.55491 | +60.0765 | 16.3 | 10.6 | 34.5 | VAR | CV (DN) | HT Cas |
| 24 | 4476137370261520000 | 270.1480 | +8.17071 | 16.6 | 11.2 | 30.8 | VAR | CV (P) | V2301 Oph |
| 25 | 4485786821746343680 | 265.1911 | +6.06403 | 15.8 | 9.0 | 31.3 | VAR | CV (P) | SDSS J1740+0603 |
| 26 | 4706297108508032128 | 1.640169 | –69.0094 | 15.1 | 8.2 | 14.7 | VAR | CV (DN) | HV 8001 |
| 27 | 5078976609103251456 | 43.90873 | –22.7842 | 17.2 | 10.6 | 62.4 | VAR | CV (DN) | IQ Eri |
| 28 | 5084805635638179584 | 53.86947 | –25.7394 | 16.6 | 9.7 | 29.2 | VAR | CV (P) | UZ For |
| 29 | 5091939988633728640 | 66.17152 | –20.1200 | 11.8 | 5.4 | 2.3 | VAR | CV (NL) | IM Eri |
| 30 | 5242787486412627072 | 151.5915 | –70.2346 | 15.6 | 10.8 | 22.9 | VAR | CV (DN) | OY Car |
| 31 | 5397102019219938944 | 168.4998 | –37.6799 | 16.4 | 10.4 | 48.3 | VAR | CV (DN) | V436 Cen |
| 32 | 5524430207364715520 | 134.6379 | –41.7979 | 16.6 | 10.6 | 12.0 | – | CV (DN) | CU Vel |
| 33 | 5665509162794290944 | 146.4624 | –19.7338 | 16.8 | 10.5 | 18.6 | VAR | CV (DN) | NSV 4618 |
| 34 | 6039131391540808832 | 243.8122 | –28.6259 | 14.6 | 9.1 | 15.3 | VAR | CV (DN) | V893 Sco |
| 35 | 6153373329716524800 | 189.5674 | –38.7127 | 17.2 | 10.7 | 38.3 | VAR | CV (IP) | V1025 Cen |
| 36 | 6185040879503491584 | 193.1003 | –29.2488 | 13.2 | 9.5 | 17.0 | VAR | CV (IP) | EX Hya |
| 37 | 6226943645600487552 | 229.9803 | –25.0067 | 16.5 | 11.2 | 14.8 | VAR | CV (DN) | GW Lib |
| 38 | 6453536224527716224 | 318.9213 | –58.6818 | 17.3 | 10.4 | 27.6 | VAR | CV (P) | CD Ind |
| 39 | 6557154200328277120 | 348.8825 | –30.8135 | 16.8 | 10.3 | 21.5 | VAR | CV (IP) | CC Scl |
| 40 | 667150159287327360 | 119.7209 | +16.2792 | 15.5 | 8.9 | 38.5 | VAR | CV (IP) | DW Cnc |
| 41 | 6896767366186700416 | 318.0387 | –8.82707 | 16.8 | 11.1 | 39.3 | VAR | CV (DN) | VY Aqr |
| 42 | 6911950900211768704 | 316.9922 | –5.29488 | 16.4 | 10.0 | 14.5 | VAR | CV (P) | HU Aqr |
| 43 | 855167540988615296 | 160.9859 | +58.1255 | 17.3 | 11.0 | 16.1 | VAR | CV (DN) | IY UMa |
| 44 | 3021820276571880064 | 93.35673 | –3.04419 | 17.2 | 11.3 | 30.3 | – | EM | New CV candidate† |
| 45 | 3446531278731142912 | 81.01973 | +29.6338 | 17.4 | 12.3 | 18.9 | – | EM | New CV candidate† |
| 46 | 4835425609500365184 | 59.19386 | –44.8056 | 16.7 | 10.6 | 11.6 | VAR | EM | ELS group† |
| 47 | 5093945085525624448 | 57.73343 | –20.8044 | 14.8 | 9.3 | 60.3 | – | EM | ELS group† |
| 48 | 5105520847021315712 | 51.79829 | –17.3162 | 17.1 | 11.6 | 244.9 | VAR | EM | ELS group† |
| 49 | 5788603818854455680 | 180.4302 | –78.5965 | 17.1 | 12.0 | 34.2 | – | EM | ELS group† |
| 50 | 6064536604140907136 | 205.9949 | –55.3288 | 13.9 | 8.3 | 34.8 | – | EM | ELS group† |
| 51 | 6097584212806297984 | 214.2756 | –42.9363 | 17.4 | 10.8 | 18.4 | – | EM | ELS group† |
| 52 | 5409115210248936832 | 144.5049 | –50.1616 | 15.8 | 10.3 | 214.4 | – | PN? | ELS group† |
| 53 | 1951666884868218112 | 322.2563 | +36.5179 | 17.3 | 10.8 | 40.8 | VAR | WD | CV (DN) (Inight et al., 2021) |
| 54 | 227766037015779200 | 64.16321 | +40.0426 | 16.6 | 11.6 | 23.8 | VAR | WD | New CV candidate† |
| 55 | 6086028036361965952 | 195.4860 | –47.0349 | 15.3 | 9.7 | 56.5 | – | YSO | YSO group† |
| 56 | 6243210920137332096 | 239.8717 | –22.6050 | 16.9 | 11.2 | 64.1 | – | YSO | YSO group† |
| 57 | 5362212384974013184 | 165.8220 | –48.5844 | 16.3 | 10.4 | 10.8 | VAR | EB | WD + MS group† |
| 58 | 4929395130249009024 | 23.13838 | –49.5267 | 16.1 | 12.5 | 15.5 | – | PM | WD + MS group† |
| 59 | 285957277597658240 | 79.76650 | +63.0610 | 15.0 | 9.7 | 28.1 | VAR | STAR | CV (DN) (Pala et al., 2020) |
| 60 | 4120637734561313664 | 266.4073 | –17.9397 | 16.7 | 9.8 | 17.3 | – | CV? | CV (Canbay et al., 2023) |
| 61 | 5343601913741261312 | 178.8603 | –56.6976 | 14.0 | 8.5 | 14.3 | – | – | CV, V1040 Cen (Inight et al., 2021) |
| 62 | 5825198967486003072 | 228.5004 | –65.0935 | 16.1 | 10.2 | 35.7 | VAR | – | CV, EK Tra (Inight et al., 2025) |
The Gaia variability status (“VAR” denotes VARIABLE, while “–” denotes NOT_AVAILABLE). The adopted abbreviations for CV subtypes are DN (dwarf nova), P (polar), IP (intermediate polar), and NL (nova-like variable). Object types from SIMBAD database: EM (emission-line object), WD (white dwarf), YSO (young stellar object), EB (eclipsing binary), PN (planetary nebula), and PM (high-proper-motion object). () - See Appendix B for details on the different groups.