ourdate\monthname[\THEMONTH] \THEDAY, \THEYEAR
Consuming Values††thanks: Email: jacob.conway@chicagobooth.edu, leviboxell@gmail.com. We particularly thank Matthew Gentzkow, Liran Einav, and Amit Seru for their invaluable mentorship and advice. We thank Elliott Ash, Efraim Benmelech, Marianne Bertrand, Julia Cagé, Emanuele Colonnelli, José Ignacio Cuesta, Daniel Diermeier, Kwabena Donkor, James Druckman, Wesley Hartmann, Caroline Hoxby, Guido Imbens, Emir Kamenica, John List, Neale Mahoney, Timothy McQuade, Muriel Niederle, Paola Sapienza, Jann Spiess, Francesco Trebbi, Ali Yurukoglu, Guangli Zhang, Luigi Zingales, and seminar participants at Stanford, the University of Chicago, and other universities and conferences for valuable suggestions. We thank Peng Zhang for excellent research assistance. We gratefully acknowledge financial support from the National Science Foundation (grant DGE-1656518), the Institute for Research in the Social Sciences at Stanford University, the Institute for Humane Studies, the Stanford Center on Philanthropy and Civil Society, the B.F. Haley and E.S. Shaw Fellowship for Economics (through a grant at the Stanford Institute for Economic Policy Research), and the George P. Shultz Dissertation Support Fund at SIEPR. This research was supported in part through the computational resources and staff contributions provided for the Mercury high-performance computing cluster at The University of Chicago Booth School of Business, which is supported by the Office of the Dean. We thank the data science team at a payment card company for generously providing data used in this paper. Researchers’ own secondary analyses (of advertising and prices) were conducted in part using data from The Nielsen Company (US), LLC, from Market Track, LLC dba Numerator, and from marketing databases provided through the Nielsen and Numerator Datasets at the Kilts Center for Marketing Data at The University of Chicago Booth School of Business. All conclusions drawn are those of the researchers and do not reflect data providers’ views. Data providers are not responsible for and had no role in analyzing and preparing the results reported herein. Levi Boxell worked on this paper while a Ph.D. student at Stanford University. Our research was approved by the Stanford IRB (eProtocol 53506).
Abstract
We study the extent to which individuals’ consumption decisions are influenced by firms’ stances on controversial social issues and the implied incentives for firms to take such stances. We use transactions from a major payment card company to predict cardholders’ likely social alignment with firm stances and to quantify effects on consumption. The social stances taken by firms increase revenue on average, with significant heterogeneity across consumers and firm stances. Consumers most aligned with a firm’s social stance increase their consumption at the firm by percent in the month following widely known social stance events, and consumers most opposed to the firm’s stance decrease their consumption by percent. These diverging consumption responses attenuate over time but persist even a year later. Firms tend to take stances that align with their consumers’ and employees’ social preferences and that correlate with the firm’s ownership structure. Together, our results show that consumers meaningfully respond to their social alignment with firms, and that this consumer response can incentivize profit-maximizing firms to engage with social issues.
1 Introduction
In recent years, both consumers and firms have frequently engaged with social issues and espoused social motives in their decision-making (Business Roundtable, 2019; Lin, 2022; Rajan et al., 2022). This has led to active debates about the extent to which socially conscious consumerism can meaningfully incentivize firm behavior, and about whether firms’ social engagement is consistent with traditional profit-maximization motives (Friedman, 1970; Graff Zivin and Small, 2005; Ramaswamy, 2021).
Most consumers state that they have made or avoided a purchase due to the social values of a company and that they are attracted by firm values that align with their own (ANES Data Center, 2016; Barton et al., 2018), but some researchers hypothesize that consumers’ self-reported demand may be “cheap talk” in that stated preferences may not reflect their actual purchase decisions (Auger and Devinney, 2007). The magnitude of this response matters for society as it determines the extent to which consumers can incentivize or discipline firm behavior. Some have argued that socially conscious consumerism can effectively cause firms to internalize their social externalities (Barboza et al., 2021; The Economist, 2021a), while others have argued that it is too weak to do so and may crowd out other forms of regulation (Csutora, 2012; Wicker, 2017; Sheffi, 2021).
One increasingly relevant setting for potential engagement occurs when firms take controversial social stances, such as advertising campaigns featuring divisive racial justice protesters, corporate policy on contraceptives and reproductive rights, or comments regarding sexual orientation and gender legislation (Lin, 2022). These controversial stances have become more frequent in recent years (Klostermann et al., 2022; The Economist, 2021b), while consumers have also become more socially divided and increasingly report caring about and seeking out information on firm stances (Iyengar and Westwood, 2015; Global Strategy Group, 2018).
In this paper, we study the extent to which individuals’ consumption decisions respond to their social alignment with firms around events in which firms took salient and controversial social stances, and we analyze the ensuing incentives for firms to take such stances. We use consumer transactions from a major payment card company (covering approximately 20 percent of all U.S. consumption) to predict cardholders’ likely social alignment with firm stances and to quantify effects on consumption. We estimate that observed firm stances increase revenue on average, with considerable heterogeneity across consumers and events. Consumers whose social views are likely aligned with a firm’s stance increase their consumption at the firm in the months following the social stance event, while consumers likely to be opposed to the firm’s stance decrease their consumption. Social stances thus typically have more positive revenue impacts when the stance better aligns with the views of the firm’s customers, and revenue-maximizing social stance decisions vary across firms. We also show that firms tend to take stances that align with their consumers’ and employees’ social preferences and that correlate with the firm’s ownership structure.
We start by building a dataset of events in which controversial social stances were taken by firms within our transaction data. We identify these events in part by searching systematically for unusual spikes combining the firm name with keywords indicative of social stances in either Google Trends searches or in news articles. We extend this list of events based on contemporaneous brand perception surveys and queries to a large language model (OpenAI’s GPT-4). We measure consumer awareness of each event in contemporaneous surveys that asked respondents whether they had recently heard any good or bad news about the firm.
We then use the transaction data to measure the effect of each stance on consumption at the firm, quantifying overall impacts as well as heterogeneity across consumer groups that are likely more aligned or less aligned with the firm’s stance. We account for changes in consumption at the firm unrelated to its stance by predicting the counterfactual consumption that would have occurred absent the firm’s stance. Following the synthetic difference-in-differences approach of Arkhangelsky et al. (2021), this prediction draws from contemporaneous consumption at each of the thousands of other firms in the economy and from past consumption at the firm taking a social stance. This synthetic series closely tracks consumption at the firm prior to its social stance.
Observed firm social stances increase revenue on average relative to the synthetic counterfactual. To illustrate how the magnitude of this response varies with consumer awareness, consider a stance that 25 percent of consumers report hearing about in contemporaneous surveys, which would be the fourth most salient event in our data. On average, such a stance significantly increases overall revenues by percent in the month following the firm’s stance. Our estimated impacts in subsequent months are weakly positive on average but not statistically significant at the 95 percent level.
We analyze heterogeneous treatment effects across consumers by first inferring cardholders’ likely alignment with firm stances from their transactions and demographics. To do so, we identify more than 30 million consumers who have clearly expressed their likely alignment on social issues through their donations to PACs, charitable organizations, and other non-profits. We use these donors to train a machine learning model that predicts an individual’s likely alignment based on a wider set of their other transactions and demographics, which we use to predict likely social alignment among all other consumers (“non-donors”). We then quantify the distribution of revenues across consumers by alignment for each firm in the year preceding its social stance event.
Disaggregating the overall consumption response by alignment reveals starkly diverging responses, thus providing clear evidence of consumer demand for social alignment with firms. Donors aligned with highly salient firm stances increase their consumption at the firm in the following month by percent, and donors opposed to the firm’s stance decrease their consumption at the firm by percent. These consumption responses attenuate over time but persist even a year later. There is also a strongly positive correlation between how likely non-donors are to be aligned with a firm’s stance and their consumption response.
Turning to the supply-side implications of our consumer response estimates, we analyze the revenue-maximizing stance for hypothetical firms facing different baseline consumption shares across consumer social alignment groups. For example, we show how revenue-maximizing social stance decisions vary for typical firms depending on the state or industry in which they operate.
Decision-makers taking firm social stances may care not only about impacts on revenues, but may also seek to align with their own preferences or the preferences of other stakeholders (Bénabou and Tirole, 2010). For example, companies often face internal pressure from employees (Maks-Solomon and Drewry, 2021) as well as external pressure from their shareholders and owners (Baron, 2009) on social issues.111Relatedly, there is an active normative debate regarding what the purpose and goals of a corporation should be. Normative theory in business ethics has long been dominated by the Friedman doctrine (Friedman, 1970), which argues that firms are beholden to their shareholders (i.e., “shareholder primacy”). More recently, however, the main business association for CEOs has argued that companies should also commit to benefiting their customers, employees, suppliers, and communities (Business Roundtable, 2019, i.e., “stakeholder theory”). Combining our stances with measures of the preferences of a firm’s different stakeholders, we analyze which stakeholders’ preferences best predict the direction of a firm’s stance and how this interacts with the firm’s corporate governance structure. The direction of a firm’s stance is best predicted by the preferences of its employees and consumers, as well as by its public vs. private ownership status. In contrast, the social alignment of its corporate board is not a strong predictor.
Our paper contributes to several existing literatures. The first analyzes socially conscious consumerism, quantifying the extent to which consumers’ preferences on social or environmental issues impact their purchase decisions. Closest to our own paper are studies that examine consumer responses to controversial firm social stances and the net impacts of these stances. For example, Liaukonytė et al. (2023) analyze a controversial social stance by Goya, finding evidence of increased consumption at store locations in counties that are home to many consumers who are likely aligned with the firm’s stance (“aligned buycotts”). They do not find similar evidence of “opposed boycotts” in more opposed areas, and thus estimate that Goya’s stance had a positive net impact on its sales in the following weeks. Similarly, Painter (2020) uses smartphone-location data to quantify foot traffic responses to a Walmart stance favoring increased gun control. Painter finds increases among locations in socially aligned counties, but (in contrast to Liaukonytė et al., 2023) also estimates decreases in generally socially opposed counties that result in a negative overall impact on foot traffic to Walmart. Klostermann et al. (2022) analyze the impact of controversial firm social stances on self-reported favorability toward the firm in YouGov BrandIndex data, finding negative overall impacts on favorability on average. Hydock et al. (2020) find evidence of aligned buycotts, opposed boycotts, and negative overall impacts on average when providing information about firm stances in unincentivized survey experiments. Schoenmueller et al. (2023) find evidence that after some types of firm stances, the firm’s Twitter following shifts toward users who are likely aligned with the firm’s stance.222Schoenmueller et al. (2023) focus primarily on documenting increased polarization in consumer behavior following the 2016 U.S. presidential election. These papers provide mixed evidence on the existence and relative magnitudes of aligned buycott and opposed boycott responses to controversial firm social stances, and on the net revenue impacts caused by firm stances.333Related research on socially conscious consumerism analyzes consumption responses to other forms of firm social engagement or social impact. For example, Panagopoulos et al. (2020) experimentally manipulate consumer beliefs about socially impactful behaviors and then observe subsequent choices between firm gift cards. They find evidence that consumers are more likely to choose gift cards from firms that align with personal social preferences. There is also a related literature examining consumer responses to foreign policy, with some finding evidence of a significant consumer response (e.g., Chavis and Leslie 2009; Fuchs and Klann 2013; Heilmann 2016; Pandya and Venkatesan 2016; Fouka and Voth 2023; Chen and Zhong 2023) and others finding no such evidence (e.g., Ashenfelter et al. 2007; Davis and Meunier 2011) in different contexts. Another group of papers, such as Elfenbein et al. (2012), Bartling et al. (2015), Barrage et al. (2020), Hart et al. (2024), and Leonelli et al. (2026), investigates consumer responses to firm activities on less controversial social issues on which most consumers hold similar views. Theoretical work emphasizes that socially responsible consumption may reflect altruism, reputation, or self-image motives (Bénabou and Tirole, 2006).
We make several contributions to the existing literature on socially conscious consumerism. First, we focus on actual consumption choices made by consumers representing a large and representative portion of firm revenues, rather than relying on self-reported survey responses or other proxies that might not reflect true consumer behavior. Second, we measure individuals’ social alignment and heterogeneous consumption responses at granular levels, thereby strengthening our identification relative to papers analyzing data at larger temporal or spatial aggregations, such as quarters or counties.444Chen et al. (2025) study how the distance between firms’ and consumers’ social values affects sales, analyzing plausibly exogenous shocks to county-level social values. They similarly find that sales decrease with the distance between consumers’ and firms’ values. This subsequent analysis complements our own research, as we use a distinct identification strategy combined with individual-level data that allows us to more precisely identify individuals’ social values and consumption choices, relative and absolute impacts on firm sales, and firm incentives. Third, we systematically identify and analyze a larger number of social stance events. This allows us to provide robust evidence of aligned buycotts and opposed boycotts, to quantify the ensuing revenue tradeoff between these two countervailing effects, to explain heterogeneous impacts across different events, and to better reconcile the mixed evidence in the existing literature. Lastly, we analyze the supply-side implications of consumer demand, examining the incentives of profit-maximizing firms to engage with controversial social issues.
We also build on a literature analyzing the impacts and drivers of firms’ ESG (Environmental, Social, and Governance) or CSR (Corporate Social Responsibility) behavior. This includes work in a variety of research fields including economics (reviewed in Kitzmueller and Shimshack, 2012), marketing (e.g., Hydock et al., 2019), and management science (e.g., McWilliams and Siegel, 2001). This literature has analyzed such firm behavior in relation to other (non-consumer) stakeholders, including work on employees (e.g., Hedblom et al., 2019; Burbano, 2021; Colonnelli et al., 2023; Makridis, 2023; Colonnelli et al., 2024; Ferreira and Nikolowa, 2025; Adrjan et al., 2026), on financial performance (e.g., Dimson et al., 2015; Bhagwat et al., 2020; Bhagat and Yoon, 2023; Mkrtchyan et al., 2023; Homroy and Gangopadhyay, 2025), on investors (e.g., Larcker and Watts, 2020; Broccardo et al., 2022; Kahn et al., 2024; Bonnefon et al., 2025), and on local governments (e.g., Bertrand et al., 2020). This literature provides the strongest support for impacts on employees, with mixed evidence of impacts on financial performance and investors. Contemporaneous work in Barari (2024) looks at the preferences of different stakeholders as potential predictors of firms’ controversial speech,555Firms have increasingly used controversial language in their corporate communication online (Cassidy and Kempf, 2025) and have experienced increased homophily in their executive teams (Fos et al., 2025). See also Colonnelli et al. (2025) for evidence of homophily between owners and their employees. finding moderate correlations between the firms’ choice of language and proxies for the preferences of potential consumers, employees, and elected officials, without quantifying connections to firm profits. An important hypothesis is that firms pursue social goals only to the extent that doing so increases their profits, whereas others have argued that firms are pushed to pursue social efforts by other stakeholders at a cost to shareholders and profits (Friedman, 1970; Graff Zivin and Small, 2005; Ramaswamy, 2021). We contribute to this literature by analyzing firms’ social stances on particularly controversial and salient issues, providing evidence of consumers’ and employees’ social preferences as drivers of firm behavior and showing that firms’ social stances have typically been consistent with traditional profit-maximization motives.
By considering the relative importance of different stakeholders’ preferences as drivers of firm behavior, our paper also contributes to a literature on corporate governance and agency problems within the firm. For summaries of this literature, see Shleifer and Vishny (1997), Becht et al. (2003), and Stein (2003). Our analysis also relates to debates around stakeholder theory vs. shareholder primacy as firm objective functions (e.g., Friedman, 1970; Hart et al., 2017). We contribute to this literature by analyzing realized firm behavior in a social stance context in which we can precisely quantify the revenue impacts of firm actions and in which we can measure the (potentially competing) personal preferences of different stakeholders.
The remainder of the paper is structured as follows. Section 2 provides our conceptual framework modeling a revenue-maximizing firm’s decision to take a social stance and highlights key empirical targets. Section 3 describes the data sources we use to estimate these empirical targets. Section 4 describes our event selection procedure and quantification of event size. In Section 5, we turn to analysis of our transaction dataset and describe our measurement of individual consumers’ social alignment. Section 6 presents our synthetic difference-in-differences procedure for imputing no-event counterfactual consumption and our resulting event-study estimates of overall and disaggregated consumption responses. With these empirical targets estimated, in Section 7 we return to our conceptual framework and discuss the supply-side implications of these consumer response estimates along with other potential drivers of firm behavior. Section 8 concludes.
2 Conceptual Framework
In this section, we provide a conceptual framework to illustrate the consumer demand elasticity we wish to estimate, the tradeoffs firms face when deciding whether and how to take social stances, and the key parameters that determine optimal firm behavior.
2.1 Firm Problem
We consider a single firm choosing to either take a stance on a binary social issue or not to take a stance, denoting its stance decision as . There exists a continuum of consumers partitioned into groups (). The net present value of revenues from each group may depend on the firm’s stance and adds up to total revenue at the firm: . Consumers are independently aware of the firm’s stance with probability , and otherwise believe that the firm has not taken a stance.666Although consumer awareness could in principle vary across groups, we show in Section 4 that consumer awareness is empirically similar across groups. Our conceptual framework and subsequent empirical analysis therefore assumes that consumer awareness of a given event does not vary across groups. The firm seeks to maximize its revenue, .777Revenue maximization may differ from profit maximization in that the former omits the direct cost of taking a stance as well as any impact this stance may have on the profit margin associated with a given dollar of revenue. Based on our understanding of the context and subsequent analyses, we believe the direct cost of these stances to be near zero on average, and we estimate mostly statistically insignificant impacts on non-consumer outcomes that might matter for profit margins (e.g., prices or employee responses). This is equivalent to maximizing the overall revenue growth induced by its social stance decision, which for estimation purposes can be split into the product of three terms that summarize our empirical targets:
| (1) |
The overall revenue growth induced by its stance is a weighted average of group-specific responses, with weights given by the share of consumption dollars a firm would receive from a given group if it did not take a stance (which we refer to as baseline shares). The induced consumption growth of a given group can be split into the product of two terms: the share of consumers aware of a firm’s stance, and the group’s consumption response conditional on awareness. This split is useful when comparing responses to social stance events with varying levels of consumer awareness, as induced consumption growth scales linearly with the share of consumers aware of the firm’s stance.888To see this linearity in , define as the consumption by group at the firm that would occur if all group members were aware of the firm’s stance, thus . Then . We can therefore think of as a measure of treatment intensity or event size that varies across events.
In this stylized model, firms face a potential tradeoff in catering to the preferences of different groups when taking controversial social stances. For example, suppose that there are two consumer groups denoted by their social views on this issue (i.e., ). The firm will prefer taking an stance to no stance if and only if the consumption increase among the aligned () group is at least as large as the decrease among the opposed group. The net revenue impact of an stance by the firm is more positive if aligned consumers account for a larger baseline share and/or if aligned consumers have greater consumption responsiveness (conditional on awareness) than opposed consumers. Consumer awareness () affects the magnitude of revenue impacts, but does not affect the firm’s optimal stance decision given the assumption that awareness is constant across consumer groups. This assumption is consistent with the empirics shown in Section 4.
2.2 Key Empirical Targets
Estimating the terms in Equation 1 requires: identifying salient social stance events (); measuring consumer awareness of each firm’s stance (); separating consumers into different groups () with likely similar social alignment; and assembling data that allow us to measure consumption at firms by each group and at different times (). We can then reasonably proxy for baseline shares () using consumption shares during the year preceding the firm’s social stance event. The final term left to then be estimated in the equation above is , the counterfactual consumption that would have occurred if the firm had not taken its stance. We can predict this value based on contemporaneous consumption at other firms as well as the firm’s historical seasonal patterns. We estimate each of these targets in the subsequent sections. These parameter estimates allow us to quantify the typical strength of consumer demand responses, to test the optimality of existing firm social stances, and to analyze the optimal behavior of a firm facing consumers with arbitrary baseline shares.
3 Data
In this section, we summarize the data sources we use to estimate the key empirical targets highlighted by our conceptual framework.
3.1 Transaction Data
We primarily use credit- and debit-card data from a large payment card company, which allow us to measure individuals’ actual consumption at particular firms over time. The dataset contains transactions in the U.S. from 2008 through March 2023, and covers approximately 20% of all U.S. consumption. The dataset is longitudinal and transactions can be linked at the card-level. For each transaction, we observe the date, dollar amount, and merchant (along with other information). The transaction data are depersonalized, so name, address, and other personal information about the cardholder is not observable, other than what can be inferred given the card’s transaction history. The data also do not specify which goods or services were purchased from a particular merchant, nor the prices of those items. Transaction data, in the aggregate, may be combined with depersonalized demographic data from consumer credit reports.999Demographic data from consumer credit reports are not available for cards that were only active during earlier years or for debit cards. These data instead cover only credit cards that were active in recent years, representing percent of cards in our sample. This demographic information includes the cardholder’s home census block, gender, age, and estimated household income.101010At no point do we analyze consumption responses at the level of an individual or card, instead aggregating cards into large groups prior to our analysis of consumption responses. Per the terms of our data agreement, all analyses also aggregate over at least five firms, with no one firm accounting for more than 50 percent of the total. We use this transaction dataset to impute cardholders’ likely alignment on social issues (forming groups from our conceptual framework), to measure a firm’s baseline shares across these groups (), to predict the counterfactual consumption that would have occurred had a firm not taken a social stance (), and to measure actual consumption by these groups at the firm over time ().
3.2 Other Complementary Data Sources
Our analysis also relies on several other complementary data sources, which we use to identify social stance events and measure consumer awareness of each event ( and ), and to analyze related outcomes associated with these events.
Our primary measure of consumer awareness comes from YouGov’s BrandIndex dataset of contemporaneous brand perception surveys of consumers, in which YouGov surveys a nationally representative sample of at least 5,000 people each day (from their panel of more than four million U.S. respondents) about their perceptions of more than 2,000 brands operating in the U.S. Importantly for our analysis, YouGov has been collecting the data continuously since 2007, allowing us to analyze changes in respondents’ contemporaneous perceptions of firms during the period surrounding their social stance event. YouGov also collects a large number of profile variables for each respondent (including information about their demographics, party affiliation, location, attitudes, and behaviors), allowing us to separately analyze responses among consumers with likely different social alignment starting in November 2012. In addition to measuring consumer awareness of firms’ social stances, we also analyze respondents’ interpretation of social stance news and their self-reported consumption responses.111111For additional information regarding BrandIndex data, including sampling methodology and complete text for all survey questions used, see Appendix Section A.5.
We use data from Google Trends and ProQuest’s U.S. Newsstream primarily to identify salient firm social stances, and to construct alternative proxies of events’ salience to consumers. Google Trends data consist of daily relative search frequencies for given keywords on Google, which can be compared over time, across search terms, or across geographies. ProQuest’s U.S. Newsstream dataset contains full-text news articles published by more than 350 U.S. print and online newspapers, and is intended as a comprehensive collection of U.S. news that is available throughout our analysis period. For each news article, we observe the full text, the publication date and outlet, and additional metadata including the names of firms mentioned as subjects in the article.
We also use several additional data sources to study other outcomes and behaviors for our event-study firms. We source stock prices from CRSP. Using data from Revelio Labs, we analyze: LinkedIn employment histories (to construct worker inflows and outflows at our event-study firms); job postings from LinkUp, LinkedIn, and job aggregator websites; and Glassdoor employee reviews. We use receipt-captured information from Numerator’s omni-channel consumer panel to analyze firm-level price indices based on online and in-store purchases.121212The Numerator data’s coverage begins in 2017. The availability of the job postings from LinkedIn and aggregator websites begins in 2012 and 2016, respectively. All other datasets used cover our entire analysis period, unless otherwise noted. We also use Nielsen’s Ad Intel data to study firm-level advertising expenditures across a variety of media types (e.g., television, radio, internet). We also use data from D&B Hoovers to construct a list of the largest U.S. firms by revenue, and make use of their definition of the 0–5 closest competitors of our event-study firms. We also source data on the social alignments of a firm’s non-consumer stakeholders from OpenSecrets and Bonica (2016). For additional detail on these different data sources and the precise construction of variables used in our analyses, see Appendix Section A.
4 Event Selection and Consumer Awareness
In this section, we describe how we systematically identify events in which firms took controversial and salient social stances () and measure consumer awareness () of each event based on Google Trends searches, news reports, contemporaneous surveys, and queries to a large language model.
4.1 Identifying Candidate Social Stance Events
We construct a dataset of salient social stance events that were associated with particular firms, had a clear event date, and which were likely to affect consumer perceptions of a firm’s social values.131313By analyzing social stance events that were salient to consumers, our event selection may exclude firm actions that the media did not report on and that consumers did not learn about. Because we would predict zero consumption response when consumers do not learn of a firm’s action, this restriction to salient stances is appropriate for analyses of individuals’ consumption decisions and their implications for firms’ incentives (especially coupled with our perception of near-zero direct costs for firms of taking these stances). Our results, however, should ultimately be understood as studying consumer responses and firm incentives around controversial and salient social stances. We restrict our analysis to events that occurred between 2011 and 2022Q1, inclusive, to align with the coverage of our transaction data and empirical methods.141414The transaction dataset we use covers 2008–2023Q1, and our empirical method requires data three years prior to and one year after the event date. Examples of the social stance events we identify include a controversial advertising campaign related to racial justice, stances on widely debated LGBTQ rights and legislation, corporate policy regarding the provision of contraceptives or abortion access, and salient stances on gun control issues or voting legislation.
We combine several different methods to identify these candidate corporate social stance events, which we overview in this section and describe in more detail in Appendix Section A.1.
We first implement a procedure to identify candidate events by searching systematically for spikes in daily Google Trends searches for a given firm name and for the firm name and keywords indicative of social stances, using keywords like “transgender” or “gun control” and repeating this search for each of the 10,000 largest U.S. firms by revenue.151515Additional detail on this procedure can be found in Appendix Section A.1, including a complete list of searched keywords and a description of how keywords were chosen.
We also implement a similar approach to identify candidate events based on news coverage in ProQuest’s U.S. Newsstream, looking for unusual spikes in the number of news articles that mention firm names together with keywords indicative of social stances. We complement our news-based approach using an existing list of firm stances from Klostermann et al. (2022), which identifies events by searching for any individual news articles that contain their own set of keywords indicative of corporate stances.
While the vast majority of events we analyze are selected by these keyword-based Google Trends and news methods, we complement these methods with two additional approaches based on brand perception surveys and queries to a large language model to ensure that we have not omitted salient events due to our choice of keywords.161616Appendix Section A.1 lists the share of events identified by each of our event selection methods. In practice, % of events in our final sample were not identified by our keyword-based methods and were added by our brand perception and/or large language model methods. In the first such complementary method, we identify candidate social stance events based on discrete shifts in favorability toward a firm among two groups of respondents who hold likely opposite views (based on their party affiliations) in contemporaneous brand perception surveys from the BrandIndex dataset. We further extend our list of candidate social stance events by querying OpenAI’s GPT-4 large language model for a list of the most salient events in which firms took stances on controversial social issues in the U.S., considering the top 50 most salient events returned by GPT-4 as candidate social stance events.171717The full text of the prompt provided to GPT-4 via ChatGPT can be found in Appendix Section A.1.
Taking the union of candidate firm-dates generated by the four methods above, we then manually filter this list by using news coverage to confirm the existence and exact timing of a social stance event while removing false positives. We also filter to firms that we can track consistently in our transaction data, excluding smaller firms and firms that are purchased by consumers only via other retailers.181818Our main results are robust to excluding firms with a significant resale component. Using the consumer awareness event-size measure defined below, we also exclude rare candidate firm-dates that occur within two years of a larger event at the same firm, as well as three candidate events that were estimated to have a weakly negative event size. We typically choose the ultimate event date based on the earliest news coverage of a given event. We note that events are often each selected by multiple methods, and that our main results are robust to dropping any one method from our event selection procedure.
We provide generic descriptions for each of the selected firm social stance events (we denote this set ) in Table LABEL:tab:event-list-All, also providing for each event the year, direction of alignment with our consumer clusters (as defined in Section 5.1), and the share of consumers we estimate were aware of the firm’s stance.191919These events represent social stances taken by unique firms. Results are similar if we restrict to the first or most salient event for each firm.
4.2 Quantifying Event Size Based on Awareness in Contemporaneous Consumer Surveys
Having selected a set of social stance events, we use contemporaneous surveys from YouGov’s BrandIndex dataset to measure consumer awareness of each stance. To do so, we first define the intermediate series as the share of BrandIndex respondents in event-time month who report having heard something positive and/or negative about firm in the past two weeks.202020When analyzing variation over time around firm events, we define event-time “months” as four-week periods relative to the firm’s event. Month is defined as the four-week period starting with the day of the firm’s event, with month then denoting the four weeks directly preceding the firm’s event. We then define our BrandIndex-based estimate of consumer awareness as , i.e., the pre- vs. post-month change in the share of respondents who have heard good or bad news about the firm, scaled by the share of respondents who were not already reporting having heard news about the firm.212121This scaling accounts for the fact that responses will not change among respondents who would have already reported hearing news about the firm in the absence of its stance. It is theoretically justified if news about the firm other than its social stance is constant over time and independent of news about the firm’s social stance (see Appendix Section A.2 for detail). This scaling is also closely related to the literature on persuasion rates (see DellaVigna and Gentzkow, 2010), which similarly scales changes by the share of respondents who could possibly be converted by a treatment. For the percent of events that are not covered by the BrandIndex dataset, we impute consumer awareness based on changes in news coverage and Google Trends searches for the firm.222222See Appendix Section A.2 for detail on this imputation procedure. Our results are robust to excluding events for which consumer awareness was imputed by news coverage and Google Trends, or to quantifying awareness using only these alternative proxies (see Figure 5).
In Figure 1 Panel A, we show variation in average consumer awareness over time for our social stance firms. BrandIndex respondents report hearing good and/or bad news about firms at fairly constant rates in the months before their social stance. In the month of the firm’s social stance, consumer awareness increases by percentage points on average. This consumer awareness measure varies significantly across events as shown in Figure 1 Panel B, with consumer awareness around percent for the most salient stances, whereas the 75th percentile and median values are much smaller at percent and percent, respectively. This variation highlights the need to scale observed consumption responses relative to consumer awareness, as discussed in Section 2.
In Figure B1, we report consumer awareness separately among respondents depending on their likely alignment with the firm’s stance (based on their self-reported party affiliations). Panel A shows similar magnitude spikes in consumer awareness among consumers who are likely aligned with the firm’s stance, opposed to the firm’s stance, or who are less strongly socially aligned/opposed. These spikes in the month of the firm’s social stance are slightly larger in magnitude on average among opposed vs. aligned consumers, but this difference is not statistically significant at standard significance levels (% vs. % awareness, respectively, p-value=). Similarly plotting the mean of itself over time by respondent alignment in Panel B, we note that aligned and opposed respondents report hearing good and/or bad news about the firm at nearly identical rates on average in the month of the firm’s stance (% vs. % among aligned and opposed respondents, respectively).232323The insignificant difference in estimated consumer awareness is driven by the fact that aligned consumers are slightly more likely to report having heard good or bad news about the firm throughout most of the ten months prior to the firm’s event. See Appendix Section A.5 for detail on the construction of these series. In the empirical analysis below, we assume that awareness does not vary with alignment.
5 Measurement of Consumer Social Alignment and Baseline Shares
In this section, we describe how we use transaction data to impute cardholders’ likely social alignment with firm stances, to aggregate consumers into groups with similar imputed social alignment (groups ), and to measure the baseline consumption share each of our social stance firms receives from these different groups (). We will use these imputed social alignment groups and baseline shares in our analysis of consumption responses in subsequent sections.
5.1 Imputing Social Alignment and Consumer Groups
The longitudinal nature of the transaction dataset allows us to impute a cardholder’s likelihood of alignment with the firm’s social stance based on the other transactions they make throughout the card’s history, as well as their demographics (when available). Prior work has demonstrated how consumption histories can predict a myriad of demographic characteristics including income, education, gender, race, and ideology (Bertrand and Kamenica, 2023). To impute social alignment in our context, we start with a subset of consumers with donations to PACs, charitable organizations, and other non-profits that clearly indicate that these donors are likely socially aligned with or opposed to one or more of the social stances in our analysis. For computational purposes, we then partition these donations into two clusters, which we arbitrarily label “For” and “Against.” All causes that are associated with a position direction on a given social issue are included in the same cluster, and we group together position directions across distinct issues when there is a higher relative co-occurrence of donations to those associated causes than to causes associated with the opposite position on this social issue (e.g., clustering “pro-LGBTQ+” donations with “support for stricter gun control” donations in the “For” cluster). We define a donor as aligned with a stance if they donate to a cause that is associated with a similar position to the firm’s social stance (or to other causes in the same cluster as these aligned causes), and as opposed if they donate to a cause that is associated with or shares a cluster with an opposing position on this issue.242424We would ideally like to estimate the likelihood of a cardholder’s alignment or opposition to each firm social stance separately, but doing so would increase the computation burden of these predictions by a factor of (the number of social stance events). We implement our clustering approach to minimize this computational burden. While this clustering is motivated primarily by computational constraints, this can be justified by the fact that individuals’ views are strongly and increasingly correlated across distinct social issues (Fiorina, 2016). We exclude from our definition of donors a small share ( percent) of would-be donors who donate to causes in both clusters.
We use these donors as a labeled dataset (including more than million cards) on which to train a machine learning model to predict social alignment with firm stances, defined as the probability of likely sharing the same For/Against position. Our predictors consist of: indicators for ever purchasing at each of the 1,000 merchants in the data most predictive of donor alignment on their own by (excluding the donations directly used to tag donor social preferences, as well as firms with social stance events and their closest competitors);252525This statistic is highest for firms that have particularly skewed consumption shares from donors by cluster (relative to their consumption shares in the entire economy) and high overall transaction counts by donors, which together make them useful for differentiating between a large number of donors by cluster. the demographics of inferred home counties;262626We infer an individual’s home county as the modal county of their in-person transactions throughout time. County characteristics include population distributions across age groups, race, voting, urbanicity, and other demographics. and other general demographics (when available from credit reports).
In our prediction exercise, we first randomly split the dataset into a training sample (70 percent of cards) and a holdout sample (30 percent). XGBoost (Chen and Guestrin, 2016), a tree-based ensemble method, is used to classify donors. We fit XGBoost to the full 70 percent training sample of donors using parameters selected by cross-validation, and make predictions for our holdout sample to evaluate the model’s out-of-sample performance.272727Additional detail on our predictive social preference exercise can be found in Appendix Section A.3.
We evaluate the performance of our predictive model among our holdout donor sample in Figure 2 Panel A, which shows the density of predicted alignment probabilities by true alignment status. These predicted class probabilities effectively separate donors socially aligned with For vs. Against positions, in that our predicted probabilities of being aligned with For positions are high among consumers truly aligned with For stances (based on their observed true donations, not used as predictors) and are low for consumers truly aligned with Against positions on those stance issues.282828Figure 2 Panel A also shows the density of our predicted alignment probabilities among non-donors, which are more diffuse than among our donor groups. When making out-of-sample predictions on our holdout sample, we achieve balanced accuracy, which can be interpreted as the probability that a randomly drawn donor would be assigned to the correct class (for which a random coin flip would be expected to produce ). The model achieves an area under the ROC-curve (i.e., ROC-AUC) of , which can be interpreted as the probability that a randomly drawn consumer truly aligned with a given class will receive a higher predicted probability of membership for that class than would a randomly drawn donor truly aligned with the other class (for which a random coin flip would be expected to produce ). Our predictive accuracy is primarily driven by the transaction indicators, rather than by home county or credit report demographics.292929To illustrate the drivers of our baseline out-of-sample performance ( balanced accuracy; ROC-AUC), we refit our predictive model separately for each of our three predictor subsets (transaction indicators; county-level demographics; and demographics from credit reports, when available). The out-of-sample balanced accuracy measures for these subsets are , , and , respectively. ROC-AUC values are , , and . We show a generic list of the most influential predictors selected by this algorithm (as defined by the gain in predictive accuracy from including this predictor) in Table 1, noting that these predictors are interpretable and intuitive. While we cannot identify individual merchants under our data agreement, these include media subscriptions, donations to other non-profit organizations associated with clear social alignments, purchases at merchants with industries and geographic distributions that are particularly correlated with likely social alignment, and other similar transactions and demographics that are plausibly predictive of an individual’s alignment on social issues.
Having estimated this predictive model on our training dataset of donors, we now have a function mapping an individual’s transactions and demographics to a measure of their social alignment (likelihood of alignment with a given For vs. Against stance among donors), which we apply to the transactions and demographics of non-donors to impute their individual social alignment. In doing so, we assume that the relationships between an individual’s social alignment and their transactions and demographics among observed donors are similar to the relationships among non-donors. We are more confident of this external validity when analyzing the relative ordering of consumers’ social alignment as opposed to the levels of predicted class probabilities due to the fact that our training data contain more donors from one of the two clusters and due to our computationally-motivated clustering approach (which ignores that true alignment levels likely vary across stances and issues). As a result, we focus on the relative ordering of consumers in terms of social alignment (rather than the predicted likelihood of alignment as levels) in our subsequent analysis.
We partition consumers into the following 12 groups ordered by likely social alignment: donors aligned with For causes (and likely opposed to Against positions); card-weighted deciles among non-donors decreasingly ordered by their likelihood of alignment with For causes; and donors aligned with Against causes. To give an intuition for how these predicted social alignments vary, in Figure 2 Panel B we map each state’s median imputed social preference decile across cards with imputed home counties in that state.303030See Figure B2 for an analogous map by county.
5.2 Measuring Baseline Consumption Shares by Group
To quantify the relative importance of each group to a given firm, we would ideally like to know the share of consumption (in $) that the firm would receive from that group (among all groups) if it did not take a stance (i.e., ). While we cannot directly observe this counterfactual quantity given that the firms in our analysis did take stances, we can reasonably proxy for this value as the share of consumption that the firm received from a group in the year preceding its stance.
We show these estimated baseline shares in Figure 3, taking a -weighted average of these baseline shares across events.313131We show these shares by position direction in Figure B3, as well as each group’s share of consumption (in $) when aggregating across all U.S. firms in the transaction data throughout the period studied (2008-2023Q1). We see that on average firms take stances that are aligned with the social preferences of their existing customer base. Firms that take stances received more pre-existing consumption from groups that are likely socially aligned with the direction of their stance than from groups that are likely opposed to the firm’s stance.
6 Consumption Responses
We now use our consumer awareness measures, alignment groups, and transaction data to estimate potentially heterogeneous consumption responses to firms’ social stances. Our empirical target throughout this section is consumption responsiveness conditional on awareness, i.e., , and we use this log approximation in our empirical estimation.323232We make this log approximation to consumption growth (coming from a first-order Taylor expansion) in our empirical estimation due to log consumption’s increased robustness to outliers and for increased tractability, as this avoids the appearance of the unknown in the denominator. We can think of estimating consumption responses to the firm’s stance as an imputation problem, in that we observe the actual consumption that occurred after the firm’s stance () but do not directly observe the consumption that would have occurred if the firm had not taken this stance (). We first show consumption changes by group, normalized by a simple counterfactual: each group’s consumption change at all other firms in the economy. We then provide our preferred causal estimates of consumption responsiveness by imputing our no-event consumption counterfactual via a synthetic difference-in-differences design that uses contemporaneous consumption at related firms and past historical patterns at the social stance firm.
6.1 Consumption Changes by Group
Before incorporating our synthetic counterfactual, we first show changes in consumption by each group at the event-study firm in the months surrounding the firm’s social stance event, relative to changes at all other firms. More precisely, we show , where denotes observed consumption in dollars by group at firm in event-time month , similarly denotes consumption for this group and month at all other firms in the economy, denotes changes from month to month , and scales by our measure of consumer awareness. Taking changes over time controls for pre-existing differences across firms and groups (i.e., removing any groupfirm effects) and removing group-specific trends in consumption at all other firms controls for group-specific trends in consumption that affect all firms (i.e., removing any grouptime effects). This simple counterfactual does not control for group time-trends that are specific to the social stance firm or shocks to consumption at the social stance firm itself that vary over time.
We plot these values in Figure B4, taking a weighted-average across events.333333For comparability with Figure 4, we use the same precision weights used in that analysis. These weights are proportional to , but also scale inversely with the estimated variance of our estimates of no-event counterfactual consumption. See Section 6.2 for detail on the construction of and motivation for these weights. We note that in the ten months preceding the firm’s event, the normalized consumption of relatively aligned and opposed consumer groups varies over time but generally moves similarly. This suggests that any time-specific shocks (such as seasonality) generally have similar effects across these groups.
In sharp contrast, in the month of a firm’s social stance event we see large and sharply diverging changes in normalized consumption across groups, consistent with a demand for social alignment with firms. Donors aligned with the firm’s stance see a sharp increase in consumption of about percent (per 25 percent consumer awareness) in the month of the stance, while donors opposed to the firm’s stance see a sharp decline in consumption of about percent in this same month. We see similar divergent sorting among non-donors by imputed social alignment decile; non-donors predicted to be most aligned with the firm’s stance increase their consumption by about percent while the most opposed non-donors decrease their consumption by about percent. All 12 groups’ consumption changes are ordered exactly as predicted by a preference for social alignment, with smaller change magnitudes among non-donors less clearly aligned with or opposed to the firm’s social stance. These differences attenuate in magnitude (especially for the large responses among donors) but largely persist even a year after the firm’s stance. The sharp timing and striking divergence in these consumption changes provide clear evidence of consumer demand for social alignment with firms.
However, these consumption responses also reflect other shocks to the firm (e.g., seasonality) that affect consumption, unrelated to the firm’s social stance. Indeed, we see some month-to-month changes that similarly affect all consumers during both pre-event and post-event months and are therefore most consistent with these confounds. We need to account for these potential confounds in order to quantify the causal effects of the firm’s stance on consumption (for each group and overall) and to analyze optimal behavior for revenue-maximizing firms.
6.2 Imputing No-Event Counterfactual Consumption
To control for these other shocks at the firm, we impute the counterfactual overall consumption that would have occurred at each event-study firm had it not taken a social stance, using a synthetic difference-in-differences (henceforth synthetic DiD) design (Arkhangelsky et al., 2021). We train this counterfactual by predicting, for each event, the weekly consumption series for the social stance firm ()) in the two years before the firm’s event (, where denotes weeks relative to the date of the firm’s social stance).343434The higher frequency of week-level data (relative to monthly data shown elsewhere) helps to inform the weights placed on different control units in our synthetic DiD counterfactual by ensuring that this counterfactual moves similarly to the firm week-by-week during the pre-event training period, while still aggregating across day-of-week patterns that are less important for our synthetic DiD to match. We then use this model to forecast consumption at the firm in the absence of an event.
Our synthetic DiD estimator can be expressed as follows:
In words, for a given event-firm’s weekly consumption series ()) we seek to form a synthetic series () as an -weighted average of control units () such that this synthetic series moves in parallel with the target social stance firm, while allowing for a fixed difference () between the two.353535Our intercept is chosen to normalize average consumption in the pre-event month to zero. We use the following as a superset of possible control units: consumption at the firm in the same week of the previous year (); consumption at each of the thousands of other U.S.-based firms in the economy for the same week (); and contemporaneous total consumption across all other firms in the same -digit NAICS industry as event-firm (, where denotes the set of firms with the same -digit industry as our event-study firm). We exclude a firm’s closest competitors363636Our synthetic DiD estimates are very similar when including or excluding the closest competitors of our event-study firms as potential control units. (as defined by D&B Hoovers) and other firms with a social stance event, both as possible control units and when defining industry-level consumption. When making predictions after the firm’s event, this choice of possible control units ensures that we only use pre-event data at the social stance firm and/or contemporaneous data at other firms that did not take a social stance. As in synthetic controls, the weights placed on these control units are constrained to be non-negative and sum to 1, which helps to avoid regularization bias. The synthetic DiD estimator also penalizes the sum of squared weights () in order to spread out weights across units, with the amount of this regularization determined by the hyperparameter .
We tune hyperparameters governing the set of possible control units373737We consider restricting to the set of possible control units based on revenue, industry, or a first-stage Lasso regression (regressing the social stance firm’s weekly consumption series on all potential controls). The associated hyperparameters we tune are: the L1 penalty in a first stage Lasso regression used to select predictors by restricting to firms with non-zero Lasso coefficients; the share of firms to keep when selecting the largest firms by revenue as predictors; and the number of digits to use when restricting to firms in the same -digit industry as predictors. We include values of and that allow for no filtering on these size and industry characteristics. and the regularization hyperparameter in a data-driven way for each firm-event by maximizing our out-of-sample forecast accuracy in pre-event data. More specifically, we look at a series of three-year periods that occur entirely before the firm’s social-stance event. For each three-year period and possible combination of hyperparameters, we use the first two years as training data on which we fit a synthetic DiD estimator, and then use this synthetic control to forecast (out-of-sample) weekly consumption at the event-study firm. We choose hyperparameters that minimize the mean squared error of these pre-event out-of-sample forecasts, as in these pre-event windows we directly observe “no stance” consumption (as the firm has not yet taken a stance) and want to forecast this series as accurately as possible. We also use this mean squared error as an estimate of the average variance of our estimator for a given firm, which we denote .
Having thus selected our model’s hyperparameters in a data-driven way, we fit our synthetic DiD estimator to the two years of data preceding a firm’s social stance event. This fit determines our choice of weights and intercept ( and ), which determines our synthetic control series () and estimated consumption responsiveness () in our training period () and in our out-of-sample forecasts following the firm’s event (). We aggregate these treatment effect estimates of consumption responsiveness by taking a precision-weighted average of event-specific estimates, with precision weights given by . We plot our actual and predicted consumption series by event-week in Figure B5.
6.3 Estimates of Consumption Responsiveness
Comparing actual scaled consumption at the firm () relative to our synthetic DiD control () allows us to estimate causal effects of the firm’s stance on consumption at the firm, which we plot in Figure 4. Panel A shows estimated overall consumption responsiveness along with a 95% confidence interval.383838When performing statistical inference on our consumption response estimates, it is important to account for uncertainty in our synthetic DiD control (). We do so using a wild cluster bootstrap approach that incorporates residuals from our past forecasts on pre-event data. See Appendix Section A.4 for detail. We estimate a statistically significant increase in overall consumption of about percent (per 25 percent consumer awareness) on average in the month of the firm’s event. This decreases on average in the following months to values which are generally weakly positive but not statistically significant (at the 95% level).
To provide group-specific estimates of consumption responsiveness, we assume that the group-specific consumption series in Figure B4 are on parallel trends except for the firm’s event (after having already differenced out groups’ consumption trends at all other firms and initial differences in consumption levels at ). We therefore shift each group’s series for a given firm by the same amount in a given month such that their average (weighted by baseline shares) aggregates up to our estimated treatment effect on overall consumption for that social stance firm (based on the synthetic DiD estimator above).393939More formally, we shift each group-level response for a given firm-event-month by the constant , where is our synthetic DiD counterfactual for overall consumption, are our estimated baseline shares, and is the group-specific consumption responses shown in Figure B4 (prior to this synthetic DiD adjustment). We then take a () precision-weighted average across events. This shift incorporates our synthetic DiD counterfactual to control for seasonality and other confounding shocks unrelated to the firm’s social stance, allowing us to estimate consumption responses under our parallel-trends assumption.404040Figure B6 shows alternative consumption responses shifted by group-specific synthetic DiD counterfactuals, relaxing this parallel trends assumption. Each group’s counterfactual is estimated using analogous group-specific potential control units (i.e., the group’s consumption at other U.S. firms, at -digit NAICS industry aggregates, and at the event-firm lagged by one year). Hyperparameters and synthetic weights are allowed to vary by group. Results are generally similar when adjusting relative to these group-specific counterfactuals, in that we again observe sharply diverging consumption responses by alignment. We prefer our baseline aggregate synthetic DiD adjustment over the group-specific version to ensure that our group-specific effects are consistent with our overall estimates, and because group-specific counterfactuals add significant noise to our relative responses over longer time horizons due to the need to compare different series that each have their own distinct forecast errors.
We show these shifted, group-specific estimates of consumption responsiveness in Figure 4 Panel B. We again observe sharply diverging consumption responses, with percent and percent effects among aligned and opposed donors, respectively, during the month of the firm’s social stance event. As expected given this constant shift, we again see ordering of consumption responses according to social value alignment. Responses are generally positive among aligned donors and most non-donor deciles, and are mostly negative among opposed donors and the deciles of non-donors most opposed to the firm’s stance. Consumption responses are remarkably persistent, with some gradual decreases in magnitudes. Figure 5 shows that our group-specific estimates of consumption responsiveness are robust to alternative proxies for consumer awareness.414141These alternative proxies for consumer awareness include changes in news coverage about the firm, changes in news coverage specifically about a social stance taken by the firm (as classified by an LLM), and changes in the firm’s Google Trends search index. Figure B7 shows robustness to changes in logs.
In Figure 6, we compare each group’s estimated consumption response to the mean probability of alignment with the firm’s stance among all cards in that group, using the prediction probabilities estimated in Section 5.1. We refer to this mean probability as the estimated share of that group aligned with the firm’s stance (). In Panel A of this figure, we plot each group’s estimated consumption response in the event-month against its share aligned. In addition to the ordering of consumption responses by alignment and the weakly positive response point estimates among most non-donors noted previously, this figure shows how the consumption response gradient with respect to the share aligned changes at different points in the distribution. Aligned and opposed donor responses (and to a lesser extent the responses of the most aligned and opposed non-donor deciles) are more extreme than we might expect were we to linearly extrapolate how consumption changes with based on the non-donor deciles. The second most extreme deciles (i.e., the 10th–20th and 80th–90th percentiles) differ in their share aligned by about and in their consumption response by about percent. The aligned and opposed donor groups themselves presumably differ in their aligned share by 1 (less than doubling the difference vs. these deciles) but differ in their consumption responses by percent (roughly quintupling the difference vs. these deciles). This suggests that the consumption of aligned and opposed donors is likely more responsive to social alignment than that of non-donors even after accounting for the fact that they hold a greater share of aligned/opposed consumers, which makes intuitive sense as these donors have already shown a willingness to pay financially for their social views through their donations.424242The weaker relationship between consumption responses and the share aligned among non-donors vs. donors could also be driven in part by attenuation given that the share aligned is measured with noise among non-donor groups. Given that the share aligned is calculated fairly precisely when aggregating across the many millions of cards within each group as we do here, attenuation is unlikely to be the primary driver of this result.
In Figure 6 Panel B, we estimate the gradient of consumption responses with respect to a group’s share aligned, comparing across groups within a month. We measure these gradients as the coefficients in the following regression specification:
We regress our estimated consumption response for a given group , event , and event-month on the alignment share of that group (allowed to vary flexibly by month), controlling for month fixed effects and using the same precision weights described in Section 6.2. Our estimated consumption response differences out our synthetic difference-in-differences no-stance counterfactual (), and is scaled by consumer awareness (), as described in Sections 6.2 and 4, respectively. We initially see a gradient of about percent in the event-month, so that going from 0% to 100% alignment is associated with a percentage point increase in consumption response. This gradually attenuates to about percent after ten months. This gradient estimate is statistically significant at the 95% level in each post-event month when clustering standard errors by event.
In Figure B8, we also visualize and provide 95% confidence intervals for the difference in consumption responses between the aligned and opposed donors (Panel A) and between the most aligned and most opposed non-donor deciles (Panel B). We similarly see a sharp and statistically significant jump in this consumption response in the month of the firm’s social stance, which gradually attenuates by about half after ten months while remaining statistically significant through this endpoint of our analysis.
Figure B9 shows analogous results by group from a placebo exercise in which we shift actual social stance event dates one year earlier and rerun all analysis (including synthetic DiD training and estimation) using these one-year-earlier placebo dates. In this placebo exercise we do not see the same patterns of a temporary spike in consumption during the month of the event, nor do we see sharply diverging consumption responses by alignment with the firm’s stance.
We note that our estimates rely on our parallel-trends assumption, which we evaluate during the pre-period by reproducing our group-level consumption responses with three years of pre-event data in Figure B10. Having already differenced out group-specific trends at all other firms in the economy, we see generally similar trends across groups in consumption at the event-study firms throughout the three years preceding an event. In particular, we never observe sharply diverging responses among consumers with different social preferences. This lends support to our parallel trends assumption, which we also relax in Figure B6.
We similarly show consumption responses over a longer 2-year post-event horizon in Figure B11.434343Panel A shows these responses in levels, while Panel B normalizes the average consumption response of the middle two deciles of non-donors to zero in each period. When analyzing this longer two-year post period, we normalize relative to these middle deciles rather than relative to our synthetic control because the latter relies on one-year-lagged consumption data at the firm taking a social stance. The responses in Panel B should thus be interpreted as relative rather than absolute consumption responses. Among non-donors, consumption by alignment deciles reconverges after roughly one year, with somewhat greater persistence among the most opposed decile until about two years after the firm’s stance. In contrast, alignedopposed donor differences persist strongly even two years later and show little sign of abating.
Figure B12 shows our overall and group-specific estimates of consumption responsiveness when separately aggregating events in which “For” cluster donors are likely aligned with vs. opposed to the firm’s stance. We observe similar divergent responses for both cluster For-aligned and -opposed stances, with aligned consumption increases and opposed consumption decreases in both cases on average. On average, stances aligned with Against donors seem to induce somewhat larger consumption responses (both positive and negative) for a given level of consumer awareness, and these events drive the increase in overall consumption during the event-month.
6.4 Stance Impacts on Related Outcomes
We also use BrandIndex data to analyze respondents’ interpretation of social stance news, as well as their self-reported consumption responses.444444See Appendix A.5 for detail regarding the construction and analysis of these related outcomes. Figure B13 shows that respondents who are socially aligned with the firm’s stance (based on the respondents’ self-reported demographics) interpret this news positively and increase their favorability toward the firm,454545Figure B14 shows that prior to the firm’s stance, different respondent alignment groups had similar favorability toward the firm. This similarity in pre-event favorability levels is consistent with the idea that these firms were on average viewed relatively neutrally prior to their social stance event. while socially opposed respondents feel more negatively about this news and about the firm following its social stance event.464646We note that we used divergence in favorability toward the firm or in interpretation of news about the firm as one of several criteria for selecting possible events. We observe similarly diverging BrandIndex favorability and news interpretation responses when restricting to events chosen by our other event selection methods, alleviating the potential concern that this result could mechanically reflect our BrandIndex-based event selection procedure, and suggesting that this is instead a real effect typical of controversial social stances taken by firms. This change in favorability translates into self-reported purchase behavior in Figure B15, as socially aligned consumers more frequently say that they would consider purchasing from or that they intend to purchase from the firm, while fewer socially opposed consumers do so following the firm’s stance. These favorability and self-reported consumption responses persist even a year after the firm’s stance. This finding corroborates and complements the more incentivized responses we estimate in our analysis of transaction data.474747Relative to our analysis of transaction data, our self-reported responses in consumer surveys have the benefit that they do not rely on imputed social preferences or no-stance counterfactuals, as we observe less seasonality in BrandIndex respondents’ consideration or purchase intent and we directly observe self-reported demographics/social views in these consumer surveys. However, these self-reported BrandIndex responses could be “cheap talk” in that they are not reflected in consumers’ actual purchase decisions. They also allow for only coarse measures of respondents’ social views and only capture the extensive margin, which leaves us unable to fully quantify impacts on the firms’ revenues (which depend on both extensive and intensive margin responses). This motivates our analysis of transaction data, through which we are able to address each of these limitations and to more fully quantify consumer responses and firms’ revenue-maximizing behavior.
In Figure B16, we also analyze changes in respondents’ exposure to information about the firm across different potential learning channels. We see that per 25 percent consumer awareness of a firm’s stance, there is a sharp percentage point increase on average in the share of consumers who report having recently talked with someone about the brand (i.e., Word-of-Mouth exposure, Panel A) and a percentage point increase in the share who report having recently seen advertising for the brand (Panel B). This suggests that consumers learn about firms’ stances through multiple channels, with most of this learning coming from channels other than direct advertising by the firm.484848In Figure B17, we analyze our event-study firms’ advertising spending in Nielsen Ad Intel data, finding that firms’ total advertising expenditures do not change significantly (either statistically or relative to pre-period variation) in the months following their social stance event. This rules out increased advertising spending as a likely driver of the estimated overall consumption increases, and is consistent with the idea that the direct cost of taking social stances is small relative to the revenue responses we estimate. This lack of increased advertising expenditures also suggests that the observed increase in the share of BrandIndex respondents reporting having seen an advertisement for the firm might partially reflect an increase in memorability or earned (rather than paid) impressions.
In Figure B18, we use Numerator’s receipt-captured data to analyze how our event-study firms change prices within the same products at different points in time. We see some mixed evidence weakly suggestive of a temporary increase in prices in the month of a firm’s social stance, with stronger increases for firm-branded products than for other products sold under the firm’s banner (i.e., in its stores or on its website) without the firm’s brand. This could reflect a profit-maximizing response to increased demand and a potential increase in profit margins per unit of revenue.
We also analyze stock price responses in Figures B19 and B20, both in raw returns and as abnormal returns in excess of various standard risk models.494949We show abnormal returns defined in excess of the following benchmarks: CRSP’s value-weighted market return; CAPM; a Fama-French 3-Factor Model; and a Fama-French 3-Factor Model with Momentum. We do not find clear evidence on average of immediate impacts from the firms’ social stances on their stock prices among publicly-owned firms in the month of the firm’s stance or in subsequent months. Any such impacts are difficult to separate from typical trends and variation in the firms’ stock prices, and we cannot rule out magnitudes consistent with our estimated temporary consumption increase.505050In our context, stock price analyses face limitations in that they are unavailable for privately-owned firms, are sensitive to the exact event-start date and horizon, and do not reveal the composition of a firm’s consumer base.
7 Supply-Side Implications and Predictors of Firm Behavior
Having now estimated group-specific consumption responsiveness, we return to our stylized model and discuss when our estimates imply that taking social stances maximizes revenue as a function of a firm’s baseline shares across consumer groups. We then analyze the extent to which the preferences of firms’ different stakeholder groups and their ownership structure predict the direction of a firm’s stance.
7.1 Net Revenue Impact by Counterfactual Baseline Shares
We analyze how the revenue impacts of the stances firms took would differ if they counterfactually faced different distributions of consumers. As described in Sections 2 and 6, the net revenue impact of a firm’s stance depends on the direction of the firm’s stance and on its baseline shares across consumer alignment groups, with more positive impacts when firm stances are better aligned with the firm’s consumer base. Figure B24 estimates the cumulative revenue impact implied by our average stance effects, weighting these same responses by two sets of baseline shares: the actual -weighted averages among firms that took social stances, and the reversed baseline shares they would have faced had they taken the opposite For/Against stance. Because firms’ social stances are better aligned with their actual existing consumers than are these opposite stance counterfactuals, we see that estimated cumulative net revenue impacts would be lower if firms faced consumer groups with these reversed baseline shares.
Figure B25 shows that baseline shares can vary even more dramatically in different contexts, such as across states or across industries. In Figure B26, we map states by the estimated cumulative net sales impact after five months induced by taking a stance, using our average estimates of consumption effects (as shown in Figure 4 Panel B) and assuming that firms face the baseline shares of overall consumer expenditures within that state. Taking a stance aligned with the Against cluster is estimated to have positive revenue impacts in the South, Midwest, and Southwest, and negative impacts in urban and coastal states, while the reverse is generally true if an average stance were instead taken in the opposite For direction. We thus estimate that a firm could, on average, benefit from or be hurt by taking either a For or Against stance on social issues given plausible distributions of consumer baseline shares, and that net revenue impacts will likely depend on the firm’s geographic distribution of consumers and on its industry.
7.2 Predictors of Firm Behavior
We next analyze the extent to which the alignments of our social stance firms’ different stakeholders predict stance directions (For vs. Against). We control for a firm’s ownership structure as an indicator for whether the firm is publicly (rather than privately) owned. We measure consumer social alignments as the baseline-share-weighted average of (for alignment with For cluster positions) across groups, i.e., the percentage of pre-existing consumption at the firm that we estimate comes from For-aligned vs. Against-aligned consumers. We measure the preferences of employees, CEOs, and boards of directors as the percentage of donations going to recipients aligned with the For direction, sourcing this data for employees from OpenSecrets and for the CEO and board members from Bonica (2016). We weight events in these regressions by .
Table 2 shows results from regressing an indicator for firms having taken a stance in this direction (rather than in the opposite direction) on these firm characteristics among our set of firm social stances. Stances taken by publicly-owned firms are more likely to be in the For direction than stances taken by privately held firms. Firms take stances that are aligned with their employees, consumers, and to some extent their CEO, but the social preferences expressed in board donations are not correlated with the direction of firms’ social stances. Because firms take stances that strongly align with their employees’ social preferences, the positive revenue impacts of these stances may underestimate their full profit benefits, as the latter would include any cost reductions that result from the labor supply or productivity responses of well-aligned employees.515151Motivated by the correlation between firm stances and employees’ social preferences, we also use data from Revelio Labs to analyze firm behavior toward and potential impacts on employees around the time of these stances. We find little evidence of clear changes. Figure B21 shows that the number of new job postings and the average salary of these postings for our event-study firms do not differ significantly from U.S. trends in the months surrounding firms’ stances. Figure B22 analyzes worker flows to and from the firm (based on LinkedIn employment histories), which also do not change significantly. Figure B23 shows no clear impacts on average Glassdoor employee reviews of the firm overall, on a “Culture and Values” dimension, or when splitting reviews by county-level alignment terciles. Taken together, these results provide little evidence of employee-side impacts of these firm social stances.
8 Conclusion
Our results demonstrate that social alignment between firms and consumers is an economically meaningful dimension of demand in our setting, not merely a stated preference. When firms take controversial social stances, consumers aligned with the stance increase their spending significantly, while opposed consumers reduce theirs. These diverging responses persist throughout the distribution of consumers’ social views and well beyond the initial event.
These findings speak to ongoing debates over corporate social engagement and the firm’s objective function. In our sample, firm stances can harm revenues when poorly aligned with consumers’ social views, but on average cause positive (but small) overall revenue impacts. This occurs both because aligned buycotts are larger than opposed boycotts on average, and because firms tend to take stances aligned with the social preferences of their existing consumers (and employees). This highlights how stakeholder rhetoric, which is frequently interpreted as evidence of a shift away from shareholder value, can in some cases be aligned with more traditional objectives through the market responses of these stakeholders.
Several directions for future research follow naturally. One direction would study the mechanisms underlying these responses, including the relative importance of extensive- and intensive-margin adjustments, consumer switching across firms, competitive interactions, and social-image concerns. Future research might also analyze consumers’ and other stakeholders’ preferences over firms’ social values outside the context of salient social stances, or might examine the causes of firm behavior. A related question is whether stakeholder responses, firms’ incentives to engage with social issues, and firms’ realized behavior have changed over time.525252Since our study period, there have been anecdotal reports of changing consumer behavior and shifts in the frequency or direction of firms’ controversial social stances, alongside changes in the regulatory, labor-market, and investor environments. Additional research might analyze how firms empirically aggregate the potentially distinct preferences of their different stakeholders, studying whose preferences matter for determining firm behavior and how this depends on institutions, such as the firm’s governance structure and regulatory environment.
References
- We’ve got you covered: Firms’ political stances on abortion and labor market sorting. Available at SSRN 4531372. Cited by: §1.
- ANES: American National Election Studies. Note: Accessible from https://electionstudies.org/data-center/ Cited by: §1.
- Synthetic difference-in-differences. American Economic Review 111 (12), pp. 4088–4118. Cited by: §1, §6.2.
- French wine and the US boycott of 2003: Does politics really affect commerce?. Journal of Wine Economics 2 (1), pp. 55–74. Cited by: footnote 3.
- Do what consumers say matter? The misalignment of preferences with unconstrained ethical intentions. Journal of Business Ethics 76 (4), pp. 361–383. Cited by: §1.
- Political speech from corporate America: Sparse, mostly for Democrats, and somewhat representative. Journal of Quantitative Description: Digital Media 4. Cited by: §1.
- Shared social responsibility. Dual role of consumers as stakeholders in firm strategy. Social Responsibility Journal 17 (1), pp. 48–68. Cited by: §1.
- A positive theory of moral management, social pressure, and corporate social performance. Journal of Economics & Management Strategy 18 (1), pp. 7–43. Cited by: §1.
- Advertising and environmental stewardship: Evidence from the BP oil spill. American Economic Journal: Economic Policy 12 (1), pp. 33–61. Cited by: footnote 3.
- Do markets erode social responsibility?. The Quarterly Journal of Economics 130 (1), pp. 219–266. External Links: Document, ISSN 0033-5533, Link Cited by: footnote 3.
- To affinity and beyond: From me to we, the rise of the purpose-led brand. Accenture. External Links: Link Cited by: §1.
- Corporate governance and control. In Handbook of the Economics of Finance, Vol. 1, pp. 1–109. Cited by: §1.
- Incentives and prosocial behavior. American Economic Review 96 (5), pp. 1652–1678. External Links: Document Cited by: footnote 3.
- Individual and corporate social responsibility. Economica 77 (305), pp. 1–19. Cited by: §1.
- Tax-exempt lobbying: Corporate philanthropy as a tool for political influence. American Economic Review 110 (7), pp. 2065–2102. Cited by: §1.
- Coming apart? Cultural distances in the United States over time. American Economic Journal: Applied Economics 15 (4), pp. 100–141. Cited by: §5.1.
- Corporate green bonds: Market response and corporate response. Available at SSRN 4492883. Cited by: §1.
- Corporate sociopolitical activism and firm value. Journal of Marketing 84 (5), pp. 1–21. Cited by: §1.
- Avenues of influence: On the political expenditures of corporations and their directors and executives. Business and Politics 18 (4), pp. 367–394. Cited by: §3.2, §7.2.
- The moral preferences of investors: Experimental evidence. Journal of Financial Economics 163, pp. 103955. Cited by: §1.
- Exit versus voice. Journal of Political Economy 130 (12), pp. 3101–3145. Cited by: §1.
- The demotivating effects of communicating a social-political stance: Field experimental evidence from an online labor market platform. Management Science 67 (2), pp. 1004–1025. Cited by: §1.
- Statement on the purpose of a corporation. Cited by: §1, footnote 1.
- On persistence in mutual fund performance. The Journal of Finance 52 (1), pp. 57–82. Cited by: §A.5.4.
- Partisan corporate speech. Available at SSRN 5249915. Cited by: footnote 5.
- Consumer boycotts: The impact of the Iraq war on French wine sales in the US. QME 7 (1), pp. 37–67. Cited by: footnote 3.
- Do consumers spend their money where their votes are? Ideology distance and local sales. Available at SSRN 5251614. Cited by: footnote 4.
- History and country-of-origin effects. Marketing Science 43 (1), pp. 192–212. Cited by: footnote 3.
- XGBoost: A scalable tree boosting system. In Proceedings of the 22nd ACM SIGKDD international conference on knowledge discovery and data mining, pp. 785–794. Cited by: §5.1.
- Selfish corporations. Review of Economic Studies 91 (3), pp. 1498–1536. Cited by: §1.
- Polarizing corporations: Does talent flow to “good” firms?. Available at SSRN 4652377. Cited by: §1.
- Politics at work. American Economic Review 115 (10), pp. 3367–3414. Cited by: footnote 5.
- One more awareness gap? The behaviour–impact gap problem. Journal of Consumer Policy 35 (1), pp. 145–163. Cited by: §1.
- Business as usual? Economic responses to political tensions. American Journal of Political Science 55 (3), pp. 628–646. Cited by: footnote 3.
- Persuasion: Empirical evidence. Annual Review of Economics 2 (1), pp. 643–669. External Links: Document, Link Cited by: §A.2.1, footnote 21.
- Active ownership. The Review of Financial Studies 28 (12), pp. 3225–3268. Cited by: §1.
- Charity as a substitute for reputation: Evidence from an online marketplace. The Review of Economic Studies 79 (4), pp. 1441–1468. External Links: Document, ISSN 0034-6527, Link Cited by: footnote 3.
- Common risk factors in the returns on stocks and bonds. Journal of Financial Economics 33 (1), pp. 3–56. Cited by: §A.5.4.
- Polarization, purpose and profit. Journal of Financial Economics 172, pp. 104147. Cited by: §1.
- The political parties have sorted. A Hoover Institution Essay on Contemporary American Politics, pp. 1–20. Cited by: footnote 24.
- The political polarization of corporate America. Available at SSRN 3784969. External Links: Document, Link Cited by: footnote 5.
- Collective remembrance and private choice: german–Greek conflict and behavior in times of crisis. American Political Science Review 117 (3), pp. 851–870. Cited by: footnote 3.
- The social responsibility of business is to increase its profits. The New York Times Magazine. Cited by: §1, §1, §1, footnote 1.
- Paying a visit: The Dalai Lama effect on international trade. Journal of International Economics 91 (1), pp. 164–177. Cited by: footnote 3.
- A call to action in the age of Trump: 5th annual business & politics study. External Links: Link Cited by: §1.
- A Modigliani-Miller theory of altruistic corporate social responsibility. The BE Journal of Economic Analysis & Policy 5 (1), pp. 10. Cited by: §1, §1.
- Private sanctions. Economic Policy 39 (117), pp. 203–268. Cited by: footnote 3.
- Companies should maximize shareholder welfare not market value. Journal of Law, Finance, and Accounting 2 (2), pp. 247–275. Cited by: §1.
- Toward an understanding of corporate social responsibility: Theory and field experimental evidence. Available at SSRN 3450248. Cited by: §1.
- Does political conflict hurt trade? Evidence from consumer boycotts. Journal of International Economics 99, pp. 179–191. Cited by: footnote 3.
- Strategic CEO activism in polarized markets. Journal of Financial and Quantitative Analysis 60 (2), pp. 617–657. Cited by: §1.
- Should your brand pick a side? How market share determines the impact of corporate political advocacy. Journal of Marketing Research 57 (6), pp. 1135–1151. Cited by: §1.
- The consumer response to corporate political advocacy: A review and future directions. Customer Needs and Solutions 6 (3), pp. 76–83. Cited by: §1.
- Fear and loathing across party lines: New evidence on group polarization. American Journal of Political Science 59 (3), pp. 690–707. Cited by: §1.
- Divestment and engagement: The effect of green investors on corporate carbon emissions. Available at SSRN 4592023. Cited by: §1.
- Economic perspectives on corporate social responsibility. Journal of Economic Literature 50 (1), pp. 51–84. Cited by: §1.
- The effect of corporate political advocacy on brand perception: An event study analysis. Journal of Product & Brand Management 31 (5), pp. 780–797. Cited by: §A.1.1, §A.1.2, §1, §1, §4.1.
- Where’s the greenium?. Journal of Accounting and Economics 69 (2-3), pp. 101312. Cited by: §1.
- How do consumers use ESG disclosure? Evidence from a randomized field experiment with everyday product purchases. Journal of Accounting and Economics 81 (1), pp. 101811. External Links: Document Cited by: footnote 3.
- Frontiers: Spilling the beans on political consumerism: Do social media boycotts and buycotts translate to real sales impact?. Marketing Science 42 (1), pp. 11–25. Cited by: §1.
- The capitalist and the activist: Corporate social activism and the new business of change. Berrett-Koehler Publishers. Cited by: §1, §1.
- Discrimination in the spotlight: The effects of political and religious bias on consumer behaviour and labour markets. Journal of Economics, Management and Religion 4 (02), pp. 2450001. Cited by: §1.
- Why do corporations engage in LGBT rights activism? LGBT employee groups as internal pressure groups. Business and Politics 23 (1), pp. 124–152. Cited by: §1.
- Corporate social responsibility: A theory of the firm perspective. Academy of Management Review 26 (1), pp. 117–127. Cited by: §1.
- CEO activism and firm value. Management Science 70 (10), pp. 6519–6549. Cited by: §1.
- Firm statements, consumer political beliefs, and the limits of stakeholder capitalism. Available at SSRN 3557961. Cited by: §1.
- Partisan consumerism: Experimental tests of consumer reactions to corporate political activity. The Journal of Politics 82 (3), pp. 996–1007. Cited by: footnote 3.
- French roast: Consumer response to international conflict–evidence from supermarket scanner data. Review of Economics and Statistics 98 (1), pp. 42–56. Cited by: footnote 3.
- What purpose do corporations purport? Evidence from letters to shareholders. Available at SSRN 4035849. Cited by: §1.
- Woke, inc.: Inside corporate america’s social justice scam. Hachette UK. Cited by: §1, §1.
- Frontiers: Polarized America: From political polarization to preference polarization. Marketing Science 42 (1), pp. 48–60. External Links: Document, Link Cited by: §1, footnote 2.
- Capital asset prices: A theory of market equilibrium under conditions of risk. The Journal of Finance 19 (3), pp. 425–442. Cited by: §A.5.4.
- Climate change: The real inconvenient truth. Management and Business Review 1 (1). Cited by: §1.
- A survey of corporate governance. The Journal of Finance 52 (2), pp. 737–783. Cited by: §1.
- Agency, information and corporate investment. Handbook of the Economics of Finance 1, pp. 111–165. Cited by: §1.
- An eco-wakening. The Economist. External Links: Link Cited by: §1.
- The political CEO. The Economist. External Links: Link Cited by: §1.
- Conscious consumerism is a lie. Here’s a better way to help save the world. Quartz. External Links: Link Cited by: §1.


Note: Figure shows changes in consumer awareness of firms, based on contemporaneous BrandIndex responses to the questions: “Over the past two weeks, which of the following brands have you heard something POSITIVE/NEGATIVE about (whether in the news, through advertising, or talking to friends and family)?” Defining as the share who report having heard positive and/or negative news about the brand among respondents in month , Panel A shows , averaged by month across event-study firms. Months are defined as 4-week periods relative to the firm’s event. Panel B shows a histogram summarizing across events our measure of consumer awareness ().


Note: Figure summarizes social alignments predicted by transactions and demographics. Panel A shows predicted social alignment density distributions by sample (i.e., for both of our holdout donor clusters, and for non-donors). Among the sample of cards with observed donations indicative of clear social alignments, densities are plotted separately for donors to causes in the (arbitrarily labeled) “For” vs. “Against” donation clusters. Panel B maps (for each state) the median predicted decile of alignment with causes in the “For” cluster among all cards in that state, with deciles 10 and 1 denoting non-donors most likely to be aligned with vs. opposed to causes in this cluster, respectively.

Note: Figure shows shares of consumption (in $) at social stance firms by alignment group in the year preceding these stances. Consumer groups are defined as described in Section 5, ordering consumers based on their predicted alignment with firm social stances. These baseline shares are averaged across social stance events, weighting events by consumer awareness of the firm’s stance (, as defined in Section 4).


Note: Figure shows estimated causal effects of the firm’s stance on log consumption in the months surrounding firms’ social stances, overall and by consumer group. Panel A shows overall effects, calculated as the difference between observed consumption and a no-stance counterfactual predicted using a synthetic difference-in-differences design (see Section 6.2). Effects are scaled relative to consumer awareness and are averaged across firms using a precision-weighted average. 95% confidence intervals are constructed using a wild cluster bootstrap approach that accounts for uncertainty in our synthetic difference-in-differences counterfactuals. Panel B similarly provides causal estimates for the impact of the firm’s social stance on consumption for each group (see Section 6).

Note: Figure analyzes group-specific consumption responses across awareness proxies. The first subpanel repeats Figure 4 Panel B, while other subpanels follow the same specification except that they use the event-month change in the subpanel title as their proxy for consumer awareness. This affects both the consumption response scaling and the precision weights used to aggregate across events, as described in Sections 4 and 6.2.


Note: Figure compares consumption responses (as shown in Figure 4 Panel B) by group to the mean share of individuals in that group predicted to be aligned with the firm’s stance. Panel A shows for each alignment group the average estimated consumption response in the month of the firm’s social stance event (y-axis, matching the value in Figure 4 Panel B) vs. the average share of consumers predicted to be aligned with the firm’s stance (x-axis). Alignment shares are constructed as the mean probability of alignment among all non-donors by decile group and direction (see Section 5.1 for detail), as 1 for the Aligned Donor group, and as 0 for the Opposed Donor group. Averages are then taken across firm-events and use the same precision weights described in Section 6.2. Panel B plots the coefficients and 95% confidence intervals from the regression of consumption responses on share aligned, as described in Section 6.3, clustering standard errors by event.
| Direction | Type | Name |
|---|---|---|
| Against | Demographic (County) | Republican Vote Share |
| For | Transaction | [National OnlinePrint Newspaper, Based in NY] |
| Against | Transaction | Other Political Organizations |
| Against | Transaction | [Pro-Gun Membership Org] |
| Against | Transaction | Other Religious Organizations |
| For | Transaction | Other Restaurants |
| For | Transaction | [Non-Profit Reproductive Healthcare Org] |
| Against | Demographic (County) | Share Commutes by Auto |
| Against | Transaction | Other Sporting Goods Stores |
| For | Transaction | Other Theatrical Producers |
| For | Transaction | Other Parking Lots,Meters,Garag |
| For | Transaction | [Non-Profit Human Rights Org] |
| Against | Transaction | [Christian Humanitarian Aid Org] |
| For | Transaction | Other Book Stores |
| For | Transaction | [National Grocery Chain, Based in CA] |
| For | Transaction | Other Local Commuter Transport |
| For | Transaction | Other Motion Picture Theatres |
| For | Transaction | [Online Marketplace for Handmade Goods] |
| For | Transaction | Other Eating Places And Restaur |
| For | Transaction | Other Colleges/Univ/Jc/Professi |
| Against | Transaction | [Farm Supplies and Home Improvement Retailer] |
| For | Transaction | Other Bars/Taverns/Lounges/Disc |
| Against | Transaction | [Online e-Commerce and Affiliate Marketplace, Based in ID] |
| Against | Transaction | [CableMedia Company] |
| Against | Transaction | [Hunting and Outdoors Retailer] |
| Against | Transaction | Other Automotive Parts Stores |
| Against | Transaction | [Steakhouse Restaurant Chain, Based in TX] |
| For | Transaction | [Audio Streaming and Media Company] |
| Against | Transaction | [Identity Theft Software Provider] |
| Against | Transaction | [Christian Catalog and Internet Retailer] |
| For | Transaction | [Food Delivery Platform] |
| Against | Transaction | [Tool and Equipment Retailer] |
| For | Transaction | [Newspaper, Magazine, and Media Company] |
| For | Transaction | [National Railroad Company] |
| For | Demographic (County) | Share Race Black |
| For | Transaction | [Furniture Retailer] |
| For | Demographic (County) | Share Commutes by Walk |
| Against | Transaction | Other Public Golf Courses |
| Against | Transaction | Other Religious Goods Stores |
| Against | Transaction | [National OnlinePrint Newspaper, Based in NY] |
| For | Transaction | [Child-Focused Humanitarian Aid Org] |
| Against | Demographic (Individual) | Age in Years |
| Against | Transaction | [Veterans Service Org] |
| For | Transaction | Wikimedia Foundation |
| Against | Transaction | [Pillow Manufacturer] |
Note: Table shows a list of the 45 most influential transaction and demographic predictors of social alignment, as defined by the gain in predictive accuracy from including this predictor in our XGBoost prediction model. Predictors are in decreasing order of influence. For each predictor, we list the univariate direction it would predict for alignment with the For vs. Against donation clusters, its type, and the name of this predictor. “Other *” predictors are groups of merchants created by the payment card company, aggregating all merchants in a given industry that aren’t consistently identifiable elsewhere as individual merchants. We replace the names of individual merchants with generic descriptions (in brackets), as we are unable to identify individual merchants under our data agreement.
| Model: | (1) | (2) | (3) | (4) | (5) |
|---|---|---|---|---|---|
| Is Public | 0.397∗∗ | ||||
| (0.157) | |||||
| Consumer For % | 0.011∗ | ||||
| (0.007) | |||||
| Employees For Donate % | 0.009∗∗∗ | ||||
| (0.001) | |||||
| CEO For Donate % | 0.003∗ | ||||
| (0.002) | |||||
| Board For Donate % | -0.001 | ||||
| (0.003) | |||||
| Observations | 116 | 116 | 101 | 36 | 42 |
| R2 | 0.168 | 0.068 | 0.449 | 0.128 | 0.011 |
Note: Signif. Codes: ***: 0.01, **: 0.05, *: 0.1. Table shows stance-level regressions in which the stance’s direction is predicted by the preferences of different stakeholder groups. The dependent variable is an indicator for the stance being aligned with causes in the (arbitrarily labeled) “For” donation cluster. Predictors include an indicator for being a publicly-owned (rather than privately held) firm, the percentage of consumers estimated to be similarly aligned with positions in the “For” donation cluster, and the percentage of donations that went to similarly aligned groups from a firm’s employees, CEO, and board of directors. See Section 7 for detail on these measures. Events are weighted by estimated consumer awareness (). Heteroskedasticity-robust standard errors in parentheses.
Appendix A Detail on Data and Measurement
A.1 Detail on Event Selection Procedures
A.1.1 Selecting Events Based on Google Trends:
We identify candidate events based on Google Trends searches for firm names in combination with particular keywords indicative of possible social stances. We generated a list of firm names over which to search by pulling the 10,000 largest U.S. firms from D&B Hoovers by 2021 revenues, excluding subsidiaries, public sector organizations, and non-profits. We pulled the name and tradestyle for each such firm from D&B Hoovers, and standardized these names (e.g., by removing common firm suffixes like Inc.). We then programmatically queried Google Trends searches for each firm name and keyword using the pytrends Python package. If no data was returned (due to insufficient searches) using the firm name, we repeated this pull using the company’s tradestyle. We pulled search data for each firm and keyword at the month-level (which indexed the largest value in a month to 100). We also separately pulled this series together with a common reference search across firms (so that searches for different firms could be compared in levels with a common reference index). We then created a composite index of these series by standardizing each series based on its mean and standard deviations over 6, 12, or 24-month backward-looking rolling windows, and then took an unweighted average of these values across these three different windows as well as our self-indexed vs. commonly-indexed series. By averaging these self-indexed and commonly-indexed series, we valued events with unusual increases relative to typical patterns for a given firm+keyword combination, and which showed a significant increase in absolute (rather than just relative) searches through this inclusion of a common reference search. We then selected the 2,500 largest firm-months by this index as candidate months. For each candidate month, we then pulled daily Google Trends searches for the firm+keyword combination in a 270-day window around the firm’s event (which is the maximum window length over which Google Trends returns daily searches). We then returned candidate event firm-dates as those with the largest increase from a 28-day backward- to a 28-day forward-looking moving average for this daily series.
The precise keywords used to identify potential Google Trends searches were: gay, transgender, immigration, political contributions, political, voting, controversy, buycott, boycott, gun control, abortion. These keywords were selected as common keywords and topics present in discussions around a set of firm social stances that we first identified through a manual search. Our choice of keywords was also guided by the stance topics identified in Klostermann et al. (2022), and by querying OpenAI’s ChatGPT for suggested keywords that could be used to identify social stances taken by firms based on Google Trends searches and news coverage.
A.1.2 Selecting Events Based on News Coverage:
We selected candidate events based on news coverage by initially pulling all articles from ProQuest’s U.S. Newsstream that mention at least one of a union of social keywords anywhere in their text and which mention a firm as a subject (as identified by the ORG metadata field). In addition to the full list of social keywords used when analyzing Google Trends, we also include the following additional keywords when analyzing news articles: racial, social issue, lesbian, queer, lgbtq, lgbtq+, lgbtqia, daca, guns, second amendment, reproductive rights. The smaller set of keywords used when analyzing Google Trends was motivated by computational constraints, as querying Google Trends for each additional keyword carried with it a higher computational cost than including additional keywords when filtering news articles from ProQuest’s U.S. Newsstream.
For each firm mentioned as a subject in an article containing these keywords, we produced a daily time series counting the number of such articles mentioning the firm, and selected candidate event firm-dates as those with the largest difference between a 28-day forward- and a 28-day backward-looking moving average for this daily series. We also supplement this list of events based on news coverage by adding events identified in Klostermann et al. (2022), which identifies events by searching for any individual news articles that contain their own set of keywords indicative of corporate stances.
A.1.3 Selecting Events Based on BrandIndex Favorability Responses:
We selected candidate events based on BrandIndex surveys by first calculating for each firm the difference in net favorability toward the firm (calculated as the share with a positive impression minus the share with a negative impression) between Democratic vs. Republican respondents. We similarly calculated this difference in the net share who reported having heard good minus bad news about the firm in the last two weeks. We then selected candidate firm-dates as those with the largest magnitude difference between a 28-day forward- and a 28-day backward-looking moving average for either of these daily series.
A.1.4 Selecting Events Based on Queries to GPT-4:
To generate a list of candidate social stance events from GPT-4, we provided the following prompt to OpenAI’s ChatGPT on April 22nd, 2023 (at which point ChatGPT was on its “Mar 23” version):
“List 40 of the most notable and widely covered events in which individual companies took partisan stances on controversial social/political issues in the U.S. between 2010 and 2022, inclusive. For each event, provide the following variables:
- company: company name,
- date: the start date of the company’s stance event (MM/DD/YY format)
- ideology: the ideological direction (conservative or liberal) of the firm’s stance
- description: a brief (2-6 word) description of the company’s stance
Order events according to their notability (descending), and
output this list in csv format.”
Querying ChatGPT for more than 40 events at a time typically exceeded limits to its output length. As a result, we extended this list beyond 40 events through the following follow-up prompt:
“Extend this list by adding another 40 of the most notable and widely covered events in which individual companies took partisan stances on controversial social/political issues in the U.S. between 2010 and 2022, inclusive. For each event, provide the following variables:
- company: company name,
- date: the start date of the company’s stance event (MM/DD/YY format)
- ideology: the ideological direction (conservative or liberal) of the firm’s stance
- description: a brief (2-6 word) description of the company’s stance
Order events according to their notability (descending), and output this list in csv format.
Avoid duplicates by not choosing any events which have the same
company name and month as an event you’ve already suggested.”
We then selected the first fifty suggestions from this combined list
as candidate social stance events.
A.1.5 Combining and Filtering Candidate Events
For each of the candidate firm-event dates selected by the automated Google Trends, news coverage, BrandIndex, and GPT-4-based methods described above, we then manually checked for the existence of a social stance taken by the firm around this date. We did so by searching the internet and querying news articles about the firm, and we filtered out candidate events that were not associated with a social stance taken by the firm. This included filtering out candidates for which we were unable to identify any salient event for the firm around this date. This also included dropping events that were falsely flagged by our automated methods as a social stance, for example dropping candidates that were associated with a spike in social keyword activity because a shooting occurred at one of the firm’s stores (without the firm taking a clear social stance in response) or because an executive used a racial slur. Having identified a clear social stance by the firm for each remaining candidate event, we also manually categorized the stances into topics based on discussions in the news articles and other online materials reviewed in our search. We also assigned a tentative start date for each social stance event. We also filtered out stances taken by firms that were not consistently identifiable as merchants in our transaction data, typically because they exclusively sell their products through other merchants or because they are particularly small firms.
After implementing this filtering procedure, we then took the union of candidates selected by our four different automated methods. We grouped together, as a single candidate event with multiple possible dates, candidates that occurred within 28 days of each other for the same firm, using fuzzy string matching to identify different names that correspond to the same firm. We then finalized the single start date for each event as the date on which the firm initially took its social stance. In rare cases for which this date was not itself directly reported, we used the earliest publication date of news articles or other online materials that mention the firm’s social stance.
Having identified a set of actual social stances taken by firms, we then used BrandIndex responses and other data to quantify consumer awareness of each firm’s stance, as described in Appendix Section A.2. We then dropped a small number of events by restricting our list to events which are the largest social stance events (in terms of consumer awareness) for that firm within a 2 year window. We then dropped three events for which we estimated that a non-positive share of consumers were aware of the firm’s stance (because the share of consumers who reported hearing recent good or bad news about the firm decreased in the month following the firm’s stance).
This procedure ultimately selected social stance events, which were taken by unique firms. We list each event’s year, direction, estimated consumer awareness, and generic description in Table LABEL:tab:event-list-All. Of these social stance events, some are selected only by our Google Trends method (%), by our news coverage method (%), by our BrandIndex method (%), and by our GPT-4-based method (%). The remaining % of events are selected by multiple methods. The share of events selected by multiple methods increases to % when weighting events by their estimated consumer awareness, as events that were more salient to consumers are more frequently identified by multiple methods.
A.2 Detail on Event Size Measurement
A.2.1 Quantifying Consumer Awareness Based on BrandIndex Responses
As described in Section 4, for most events, we use contemporaneous brand perception surveys from BrandIndex to quantify the share of consumers who were likely aware of the firm’s stance. We refer to this share as “consumer awareness.” We identify this share based on responses to the following question asked by BrandIndex: “Over the past two weeks, which of the following brands have you heard something [positive/negative] about (whether in the news, through advertising, or talking to friends and family)?” Defining as the share of BrandIndex respondents in event-time month who report having heard something positive or negative about firm in the past two weeks, we then define our BrandIndex-based estimate of consumer awareness as . This share represents the pre- vs. post-event-month change in the share of respondents who report having recently heard good or bad news about the firm, scaled by the share of respondents who were not already reporting having heard recent news about the firm.
This denominator scaling accounts for the fact that the numerator will undercount awareness among respondents who hear about the firm’s stance but who would already have reported hearing other news about the firm unrelated to its social stance. As one potential justification for this metric, suppose that a continuum of respondents become aware of the firm’s social stance with i.i.d. probability and independently become aware of other news about the firm with i.i.d. probability , fixed over time. We can then see that our empirical measure provides an estimate of consumer awareness under these assumptions as follows:
The extent of this undercounting will, in practice, depend on the correlation between social stance awareness and awareness of other news about the firm. Here we assume independence between these two events, following calculations of persuasion rates in the literature (e.g., DellaVigna and Gentzkow, 2010) in using this scaling as our adjustment factor.
In Figure B27, we plot (Panel A) and (Panel B) by event. Panel A shows that firms vary substantially in the share of consumers reporting good/bad news about the firm in the pre-period (values range from near zero to shares around 0.5), highlighting the need for this scaling adjustment in order to avoid differential undercounting across events. Panel A also shows reasonable consistency in within firms over pre-event months, consistent with being similar over time and suggesting that is likely a reasonable proxy for the share of consumers that would hear about news other than the firm’s social stance in month .
A.2.2 Quantifying Event Salience Based on News Coverage and Google Trends
As an alternative to our BrandIndex-based quantification of consumer awareness, we also proxy for the relative salience of each candidate event using data from ProQuest’s U.S. Newsstream. To quantify the salience of each event, we define an event’s size as the increase in the number of news articles mentioning the social stance firm () as a subject in the month following the event relative to the preceding month, i.e., .
We visualize the salience of these social stances to consumers in Figure B28. Panel A shows variation in news coverage of social stance firms by month around their social stance event, relative to the month preceding the firm’s event and averaged across firm-events (i.e., showing for months ). We see that on average across events, the firm taking a social stance is covered by additional news articles in the month following relative to the month preceding its social stance event. This represents an unusual percent increase in news coverage relative to the average number of articles covering the firm in the month preceding its stance (i.e., =). We have confirmed by looking at the text of these news articles that this increase in news coverage is primarily driven by the firm’s social stance event itself, rather than by news covering some other aspect of the firm. News coverage is relatively constant during the months preceding the firm’s event and is somewhat elevated in subsequent months following the firm’s event month. This sharp spike in news coverage is consistent with the occurrence of an event (the firm’s social stance) which is likely to be salient to consumers and to affect their perceptions of the social values associated with the firm, thus enabling our analysis of how individuals’ consumption responds to these changes in perceptions.
In Panel B of this same figure, we use a histogram to show heterogeneity in the event-month news coverage increases across events. We see that events vary in their induced news coverage. A handful of the largest social stance events see more than 1,000 article increases in news coverage in the month following the firm’s event, suggesting that consumers are most likely to be aware of these events. Many of these events are much less salient to consumers, as the 75th percentile and median values are and news article increases, respectively.
In Figure B29, we show an analogous figure after using an LLM (gpt-4o-mini) to restrict to news articles that specifically discuss a controversial social stance taken by the event-study firm. On average, we see additional news articles covering controversial social stances taken by the firm in the month following its stance relative to the preceding month, an percent increase relative to the average number of such articles () in that preceding month. This suggests that most of the increased news coverage of the firm is indeed discussing its controversial social stance.
We also show changes in log Google Trends searches for the firm around its social stance event in Figure B30, observing a sharp spike in Google searches in the month of the firm’s social stance. Relative to our BrandIndex-based measure of awareness, we also observe greater month-to-month variation in both firm news coverage and Google searches in months far removed from the firm’s social stance. This suggests that these alternative measures are likely noisier proxies for consumer awareness.
Figures 5 and B7 re-estimate our grouped consumption responses after scaling by these alternative awareness proxies.535353These figures also include a panel in which an LLM (gpt-4o-mini) identifies and filters to articles about the firm, dropping cases in which the firm name in the ORG metadata field was a false positive. These alternatives generate response gradients that are similar to our preferred baseline, with consumption rising most among groups aligned with the firm’s stance and falling most among opposed groups.
A.2.3 Imputing Consumer Awareness for Events Not Covered by BrandIndex
We prefer BrandIndex-based measures of consumer awareness (when available) to measures based on news coverage and Google Trends searches, as this preferred measure is most closely related to the empirical target highlighted by our conceptual framework. It also appears more stable over time in the absence of an event (e.g., exhibits less seasonality and noise) than alternative measures, and avoids potential issues when comparing the news mentions or searches of firms that vary in their name’s commonality or potential for variants. Estimates based on Google Trends also face a concern that searches for a firm could in part reflect purchase intent (i.e., searching for their website in order to buy a product) and might therefore directly reflect changes in consumer demand.
As mentioned in Section 4, percent of firm-events in our sample are not covered by the BrandIndex dataset in the months around the firm’s event. This means that we cannot quantify consumer awareness of these firm-events directly from BrandIndex responses and must instead impute consumer awareness of these events using other data sources. We choose our imputation method via cross-validation. We include the following as potential predictors in this imputation exercise: the (pre- vs. post-month) change in Google Trends searches for the firm (without specifying additional keywords); the change in the number of news articles mentioning the firm as a subject (without specifying additional keywords); and the change in the number of news articles mentioning the firm as a subject and that also include at least one of our news coverage social stance keywords. We also include as predictors changes in logs for each of the three metrics above. When any of these six variables are missing, we replace this missing value with the average value of this predictor across events, and include as a potential predictor an indicator for whether the firm had a missing value for this variable.
To make these imputation predictions, we consider the following four methods: an elastic net; random forest; XGBoost; and stepwise selection. We select our preferred model by minimizing the five-fold cross-validated RMSE when predicting consumer awareness among the set of firms covered by BrandIndex data. This cross-validation procedure selects stepwise selection with nine features as our preferred imputation method, including the following as controls in a linear regression (in addition to a constant term): the six changes in levels and in logs mentioned above, as well as missingness indicators for changes in Google Trends searches, for changes in log Google Trends searches, and for changes in the log number of news articles mentioning the firm in conjunction with social keywords. The cross-validated RMSE of these predictions was .
A.3 Detail on Imputing Social Preferences and Alignment
As described in Section 5.1, we use a machine learning model (XGBoost) to predict an individual’s social preferences and alignment based on her transactions and demographics. To do so, we form a labeled dataset of consumers with donations to PACs, charitable organizations, and other non-profits that clearly indicate that these donors are likely socially aligned with or opposed to one or more of the social stances. After partitioning these donors into two arbitrarily-labeled “For” and “Against” clusters of correlated social views, we split donors into a training sample (70 percent of cards) and a holdout sample (30 percent). We include the following as predictors: indicators for ever purchasing at each of the 1,000 merchants in the data most predictive of donor alignment on their own by (excluding the donations directly used to tag donor social preferences, as well as firms with social stance events and their closest competitors);545454For a given firm , , where is defined as the number of transactions by cluster donors at firm at any point in time, and denotes the number of transactions by cluster at all firms in the economy other than (excluding the merchants used to define our clusters). the demographics of inferred home counties;555555We infer an individual’s home county as the modal county of their in-person transactions throughout time. This agrees with their home county as listed in a credit report snapshot (when available) percent of the time, with much of the disagreement due to changing home locations over time. We exclude from our analysis cards with zero in-person transactions. and other general demographics (when available from credit reports). We fit this model via weighted maximum likelihood estimation. We observe a smaller number of donors in the Against cluster, and so we uniformly upweight donors from this cluster so that both clusters are given the same total weight when evaluating the likelihood of our predictions. We empirically tune the parameters of the XGBoost algorithm using five-fold cross-validation on the 70 percent training sample.565656We gradually tighten the grid of tuning parameters over which we search as we increase the sample size used for training. These tuned parameters take the following final values: learning_rate=0.12, gamma=1, max_depth=6, subsample=0.8, colsample_bytree=0.8, reg_lambda=10, reg_alpha=0.1. All other parameters are kept at their defaults unless otherwise noted. We then fit XGBoost to the full 70 percent training sample of donors using the parameters selected by this cross-validation, and we make predictions for our holdout sample to evaluate the model’s out-of-sample performance.575757We exclude 10 percent of the training sample as an evaluation set to determine when adding trees to our XGBoost ensemble no longer improves our evaluation-set predictions (i.e., early stopping). Based on this early stopping criterion, our final fit uses trees. All out-of-sample predictive measures refer to the 30 percent of the data not used during training, and do not include the 7 percent of the overall sample used as an evaluation dataset to determine early stopping during training. These performance metrics and the outputs of our predictions are described in Section 5.1. This trained model gives us a mapping from individuals’ transactions and demographics to a measure of their social alignment (likelihood of alignment with a given For vs. Against stance among donors). Applying this mapping to the transactions and demographics of non-donors allows us to impute their individual social alignment and to partition them into social-alignment deciles based on these predictions.
A.4 Detail on Wild Cluster Bootstrap
When performing statistical inference on the overall consumption response estimates (see Section 6.2), it is important to account for uncertainty in our synthetic DiD control (). We do so using a wild cluster bootstrap approach that incorporates residuals from our past forecasts on pre-event data. Recall that in these past forecasts, we look at a series of three-year periods that occur entirely before the firm’s social-stance event. For each three-year period, we use the first two years as training data on which we fit a synthetic DiD estimator, and then use this synthetic control to forecast (out-of-sample) weekly consumption at the event-study firm. We treat these residuals as forecast errors, as in these pre-event windows we directly observe “no stance” consumption (as the firm has not yet taken a stance) and want to forecast this series accurately.
In each bootstrap iteration, we randomly sample firm-events with sampling probabilities proportional to their precision weights. Once we have drawn the time-series for a given firm-event within a bootstrap iteration, we then uniformly sample one past forecast series from the set of all possible past forecasts for that firm-event, and add the residuals from the drawn past forecast series multiplied by a Rademacher weight ( each with 50% probability) to the estimated overall consumption for that firm-event. We then average across the sampled firm-event+residual series within a bootstrap iteration to produce an estimated overall consumption time series for that bootstrap iteration. We conduct ten thousand such independent bootstrap iterations. We then construct a 95% confidence interval for our overall consumption response estimates in Figure 4 Panel A by using as our bounds the 2.5% and 97.5% quantiles across bootstrap iterations for each month.
A.5 Detail on Construction of Other Variables
A.5.1 YouGov BrandIndex Survey Details and Question Text
To produce its BrandIndex dataset, YouGov owns and operates a syndicated global panel of more than 17 million respondents. More than four million of these respondents are located in the U.S., and we restrict our analysis only to this subset for consistency with the other data sources we analyze. Panel members sign up through a double opt-in process through which they register to join YouGov’s panel, validate their email address, and start by sharing demographics about themselves (e.g., age, gender, and race). Panelists are then invited to complete brand preference surveys, in which they answer questions about multiple brands from a single product category (e.g., “Grocery Stores” or “Skin Care and Cosmetics”) on a given day.585858In their U.S. subsample, YouGov elicits preferences regarding 2,000+ brands spread over 45+ product categories. Both numbers have varied over time. Panelists can only complete a particular survey on a given day if they receive an invitation to do so from YouGov, and YouGov employs a lock-out period following the completion of a survey to ensure that a given respondent does not complete multiple surveys within a short time window. Panelists are randomly assigned to product categories using a quota system to ensure that responses for each product-categoryday are in expectation nationally representative based on race, income, gender, and region (relative to U.S. Census data). YouGov also uses weights when aggregating responses to account for unexpected variation in completion rates, thereby ensuring that responses are also nationally representative ex-post. YouGov respondents receive points for their survey completion, which they can exchange for rewards like Amazon gift cards or movie tickets. YouGov collects responses from at least 5,000 U.S. respondents each day, collecting these data since June 3rd, 2007.
Within a given survey, respondents first select the brands that they are aware of within the product category (from a list of up to 40 brands). They then answer the remaining questions in the survey only for the brands of which they said they were aware. BrandIndex produces two kinds of metrics: 2-point metrics (e.g., Yes/No responses), and 3-point metrics (e.g., Positive, Negative, or Neutral). The exact wording of questions varies by product category to reflect the product category name, type of good, and typical purchase frequency. Here we provide the questions seen by YouGov BrandIndex respondents for each of the BrandIndex-based metrics used in our analysis, using as an example the exact question text for the “Dining: Fast Food” product category. For each question, we list the name given to this metric by YouGov, and specify whether the metric is on a 2-point or 3-point response scale.
-
•
“Aided Brand Awareness” (2-point, initial question): Which of the following restaurant chains have you *ever* heard of? Please select all that apply.
-
•
“Buzz” (3-point): Over the PAST TWO WEEKS, which of the following restaurant chains have you heard something POSITIVE about (whether in the news, through advertising, or talking to friends and family)? / Now which of the following have you heard something NEGATIVE about over the PAST TWO WEEKS?
-
•
“Attention” (2-point): [Yes if respondent reported Positive and/or Negative “Buzz”]
-
•
“Consideration” (2-point): When you are in the market next to purchase food or drink, from which of the following would you consider purchasing?
-
•
“Purchase Intent” (2-point): From which of these would you be most likely to purchase? [Follow-up to “Consideration”]
-
•
“Current Customer” (2-point): Have you purchased food or drink from any of the following restaurant chains in the past 30 days?
-
•
“Former Customer” (2-point): Have you ever purchased food or drink from any of the following restaurant chains? [Excludes “Current Customers”]
-
•
“Impression” (3-point): Overall, of which of the following restaurant chains do you have a POSITIVE impression? / Now which of the following restaurant chains do you have an overall NEGATIVE impression?
-
•
“Word-of-Mouth Exposure” (2-point): Which of the following restaurant chains have you talked about with friends and family in the PAST TWO WEEKS (whether in-person, online, or through social media)?
-
•
“Advertising Awareness” (2-point): Which of the following restaurant chains have you seen an advertisement for in the PAST TWO WEEKS?
We construct the variables used in our analysis from these questions as follows. As described in Section 4, we define as the share reporting having heard something positive and/or negative about the firm in the past two weeks, among all responses that asked about ’s firm in event-month .595959We do not exclude individuals who were unaware of the firm (in the “Aided Brand Awareness” question) from the denominator, although they did not answer subsequent questions about the brand. Responses are weighted by the survey weights provided by YouGov to make responses nationally-representative for that product-category and day. Constructing , Figure 1 Panel A then plots the average of across all event-firms in a given event-month, among events covered by BrandIndex. Constructing as equal to for events covered by BrandIndex and imputing this value from Google Trends and news coverage when not covered by BrandIndex (as described in Appendix Section A.2), Figure 1 Panel B then plots a histogram of this consumer awareness measure across all events.
Figure B1 shows averages of and across firms, adding an alignment group dimension by calculating these metrics for each firm-event separately among respondents () split by their social alignment.606060We define social alignment among BrandIndex survey respondents based on their self-reported party affiliation, oriented relative to our donation clusters and stances based on related donations in those clusters. This demographic question was answered previously and asks “Generally speaking, do you think of yourself as a…? [Democrat, Republican, Independent, Other, Not Sure].” We drop the percent of respondents answering “Other” or “Not Sure” to this question from all analyses of splits by alignment group in the BrandIndex data. YouGov’s 2-point metrics (with the exception of “Attention”) and the splits by party affiliation are also only available starting in 11/13/2012. When producing any given time-series figure, we balance our panel by dropping events that aren’t covered throughout the period for the metric shown in that figure (e.g., a hypothetical event with date 1/1/2013 would be dropped from any figure showing splits by party affiliation ten months prior).
When producing Figure B13 Panel A, we first calculate for each group, firm-event, and month , i.e., the share of respondents in a given alignment group reporting positive news about the firm minus the share reporting negative news. We then define our outcome metric for each group, firm-event, and month as and calculate a precision-weighted average of this series across firm-events for a given month and group (i.e., weighting firm-events by ).616161In all plots showing how responses scale with awareness, we actually divide by , so that responses are scaled relative to 25 percent awareness rather than 100 percent awareness. We do so because the latter is not within the range of observed awareness for actual social stance events. For expositional simplicity, we sometimes abuse notation by also referring to this denominator as . In Panel B, we similarly calculate favorability toward the firm using responses to “Impression” rather than “Buzz.” We plot -weighted averages of the levels and in Figure B14.
To produce Figure B15 Panel A, we first calculate for each group, firm-event, and month , i.e., the share of respondents who report that they would consider purchasing from that firm when next in the market for its product category. We then similarly define our outcome metric as and calculate a precision-weighted average of this series across firm-events for a given month and group (i.e., weighting firm-events by ). We similarly produce Panel B by calculating purchase intent (or more precisely, that the respondent reports being most likely to purchase from the firm) using responses to “Purchase Intent” rather than “Consideration”. We similarly produce Panels A and B of Figure B16 using responses to “Word-of-Mouth Exposure” and “Ad Awareness,” respectively.
A.5.2 Nielsen Ad Intel Data on Advertising Expenditures
We source data on advertising expenditures from the Nielsen Ad Intel dataset at the Kilts Center. We linked our event-study firms to Nielsen identifiers based on a combination of fuzzy name matching and manual linking. We then use the Occurrence data files to identify advertisements in which each event-study firm is listed as an associated brand, and sum the dollars spent across all such advertisements within a firm-month to get the firm’s total spending. We include all media types available through Nielsen’s Ad Intel dataset, except for Spot TV ads, which we exclude throughout our analysis due to inconsistencies in the availability of spending over time. Measuring this quantity () in thousands of dollars, we then analyze as our outcome variable in Figure B17.
A.5.3 Numerator Receipt-Captured Transaction Data
We source item-level data on quantities sold and their prices from Numerator’s omni-channel consumer panel (accessed via the Kilts Center). We link our event-study firms to Numerator data using fuzzy-string matching and manual linking for each of two criteria: (1) identifying items in which the firm is listed as the brand, parent-brand, or in the item description; and (2) identifying items in which the firm is listed under the banner field, indicating that the product was sold in the firm’s store or on its website, but isn’t necessarily branded as the firm’s product. We use Numerator’s ITEM_ID to identify when two items being sold represent the same product, dropping items with ITEM_ID values that are zero or missing. We also drop purchases in which an item’s unit price is listed as zero, balance our panel of items, and filter to event-firms with at least five distinct items.
In order to construct price indices for each firm, we then define the following variables. Let denote the quantity of item purchased by user in period , let denote the unit price of this transaction, and let denote the user weights provided by Numerator to make their panel representative of the U.S. population. We then define the weighted quantity and the weighted average unit price as . For firm with items , we then define our Laspeyres and Paasche price indices, respectively, as:
A.5.4 CRSP Stock Returns
We source daily data on stock prices from CRSP, accessed via WRDS. We manually construct matches of our event-study firms to PERMCO and PERMNO identifiers in CRSP. For firms with multiple PERMNOs, we retain the identifier whose security start and end date cover the event date and analysis window. If multiple PERMNOs satisfy this criterion, we retain the most liquid share class. We source from CRSP the daily total return for each of these securities, CRSP’s value-weighted market return, and daily Fama-French factors plus momentum. For one event-study firm listed outside the U.S., we use the firm’s comparable daily returns from Compustat–Capital IQ (again accessed via WRDS), the corresponding continental market return, and (from Kenneth French’s online data library) the corresponding continental Fama-French plus momentum factors.
We follow standard practice when constructing our market-adjusted (Sharpe, 1964), Fama-French 3-Factor (Fama and French, 1993), and Fama-French 3-Factor plus Momentum (Carhart, 1997) risk models. When constructing these risk model benchmarks, we follow the default parameters in WRDS U.S. daily event-study tool in selecting: an estimation window of 100 trading days to estimate the expected return and residual return variance; a required minimum of 70 non-missing return observations within this estimation window; and a gap of 50 trading days between the end of the estimation window and the beginning of the event window (with our event window matching our plotting window).
A.5.5 Revelio Labs Data (Job Postings, Worker Flows, Employee Reviews)
We use data purchased directly from Revelio Labs to analyze firms’ behavior toward and impacts on employees. The data contain a firm reference file, job postings gathered from LinkUp, LinkedIn, and job aggregator websites, worker employment histories gathered from LinkedIn, and employee reviews gathered from Glassdoor. We first link our firms to identifiers in the Revelio Labs data (common across these datasets) based on fuzzy name matching, manual linking, and searches for known employees, for company/LinkedIn URLs, and for reviews pertaining to the target firm. We also link to identifiers listed as subsidiaries of our target firm. We then use this unified set of firm identifiers throughout our analysis of Revelio Labs data.
When analyzing job postings, we count the number of job postings that have an originally posted date in our target month. To avoid dropping zeros when taking logs, we add one to all firm-month job posting totals before taking logs. We also analyze the average salary (in thousands of dollars) listed among these new job postings. In Figure B21 Panels A and C, we then analyze the log of this value as our dependent variable. In Panels B and D, we construct analogous series among all U.S. job postings other than those by our target firm, and subtract this U.S. aggregate from our firm-specific series in order to detrend (with any fixed difference in levels handled by the fact that we normalize relative to month ).
When analyzing worker flows in Figure B22, we count as inflows the number of users who are listed as working for our target firm in month but not in . We count as outflows the number of users listed as working for the firm in month but not in month . This figure analyzes of each of these values.
In Figure B23, we analyze anonymous Glassdoor reviews of firms by their employees. We do so by taking the average rating (initially on a 1-5 star scale) across reviews of the firm posted in a given month. We compute metrics for two rating dimensions: the “Overall” rating and the “Culture and Values” rating. We plot these averages in Panels A and B. To construct Panels C and D, we first geocode each review’s raw location using the Google Maps API to get the review’s associated county. We then split counties into social value terciles by their 2016 presidential vote shares,626262Reviews from New York City are associated with the aggregate share of its five constituent counties. Reviews from Alaska are dropped due to data availability. such that each tercile contains roughly the same number of U.S. reviews. We then average ratings for our event-study firms by firm, month, and alignment tercile (based on the direction of the firm’s stance), shown as the dependent variables in Panels C and D.
Appendix B Appendix Exhibits


Note: Figure shows consumer awareness of firms’ social stance events by social alignment, based on BrandIndex survey responses. Define as the share who report having heard positive or negative news about the brand in the last two weeks among all respondents in month . Panel A shows our consumer awareness measure , averaged by month across event-study firms separately for respondents by alignment. Panel B similarly shows averages of .

Note: Figure maps (for each county) the median predicted decile of alignment with causes in the (arbitrarily labeled) “For” donation cluster among all cards in that county, with deciles 10 and 1 denoting non-donors most likely to be aligned with vs. opposed to causes in this cluster, respectively.

Note: Figure shows shares of consumption (in $) by group. Consumer groups are defined as described in Section 5, ordering consumers based on their predicted social preference alignment with the For donation cluster on social issues. The leftmost and rightmost columns show baseline shares at firms taking social stances aligned with vs. opposed to donations in this cluster, respectively. Baseline shares refer to the share of consumption (in $) coming from each group at the firm in the year preceding these stances. Baseline shares are weighted by consumer awareness of the firm’s stance (, as defined in Section 4) when averaging baseline shares across these firm-events. In the middle bar, we show each group’s share of consumption (in $) aggregated across all U.S. firms in the transaction data throughout the period studied (2008–2023Q1).

Note: Figure shows changes in log consumption at firms in the months surrounding their social stances, by consumer social alignment groups. Consumer social alignment groups are constructed as defined in Section 5.1. Changes in log consumption by group are normalized relative to the month before a firm’s social stance and relative to changes in that group’s consumption at all other firms in the economy. Changes are scaled relative to consumer awareness and are averaged across firms using a precision-weighted average, as described in Sections 4 and 6.2.

Note: Figure shows actual and predicted log consumption at firms taking social stances by event-week, normalized for visualization purposes relative to the month prior to the firm’s social stance event and to changes in log consumption at all other firms in the economy. Log consumption in the absence of a firm’s social stance is predicted using a synthetic difference-in-differences design as described in Section 6.2, using as predictors contemporaneous consumption at other firms and past consumption at the social stance firm. Changes are scaled relative to consumer awareness and are averaged across firms using a precision-weighted average, as described in Sections 4 and 6.2.

Note: Figure follows Figure 4 Panel B in showing estimated causal effects of the firm’s stance on log consumption in the months surrounding their social stances, by consumer group and relative to a synthetic DiD counterfactual. Whereas Figure 4 Panel B shifts group-level consumption responses by the same amount within a period so that they aggregate up to our estimated overall effect on consumption for the firm (estimated relative to a synthetic counterfactual for firm-wide consumption), this figure estimates causal effects by comparing each group’s observed consumption response relative to a group-specific synthetic DiD counterfactual (based on that group’s consumption at analogous possible control units). Hyperparameters and synthetic weights are allowed to vary by group. As in Figure 4 Panel B, effects are scaled relative to consumer awareness and are averaged across firms using a precision-weighted average.

Note: Figure follows Figure 5 in showing how estimated consumption responses by group vary with our choice of awareness proxy. This figure differs from Figure 5 in that it proxies for awareness using the event-month change in the log value of the variable listed in the subpanel title, rather than change in level.
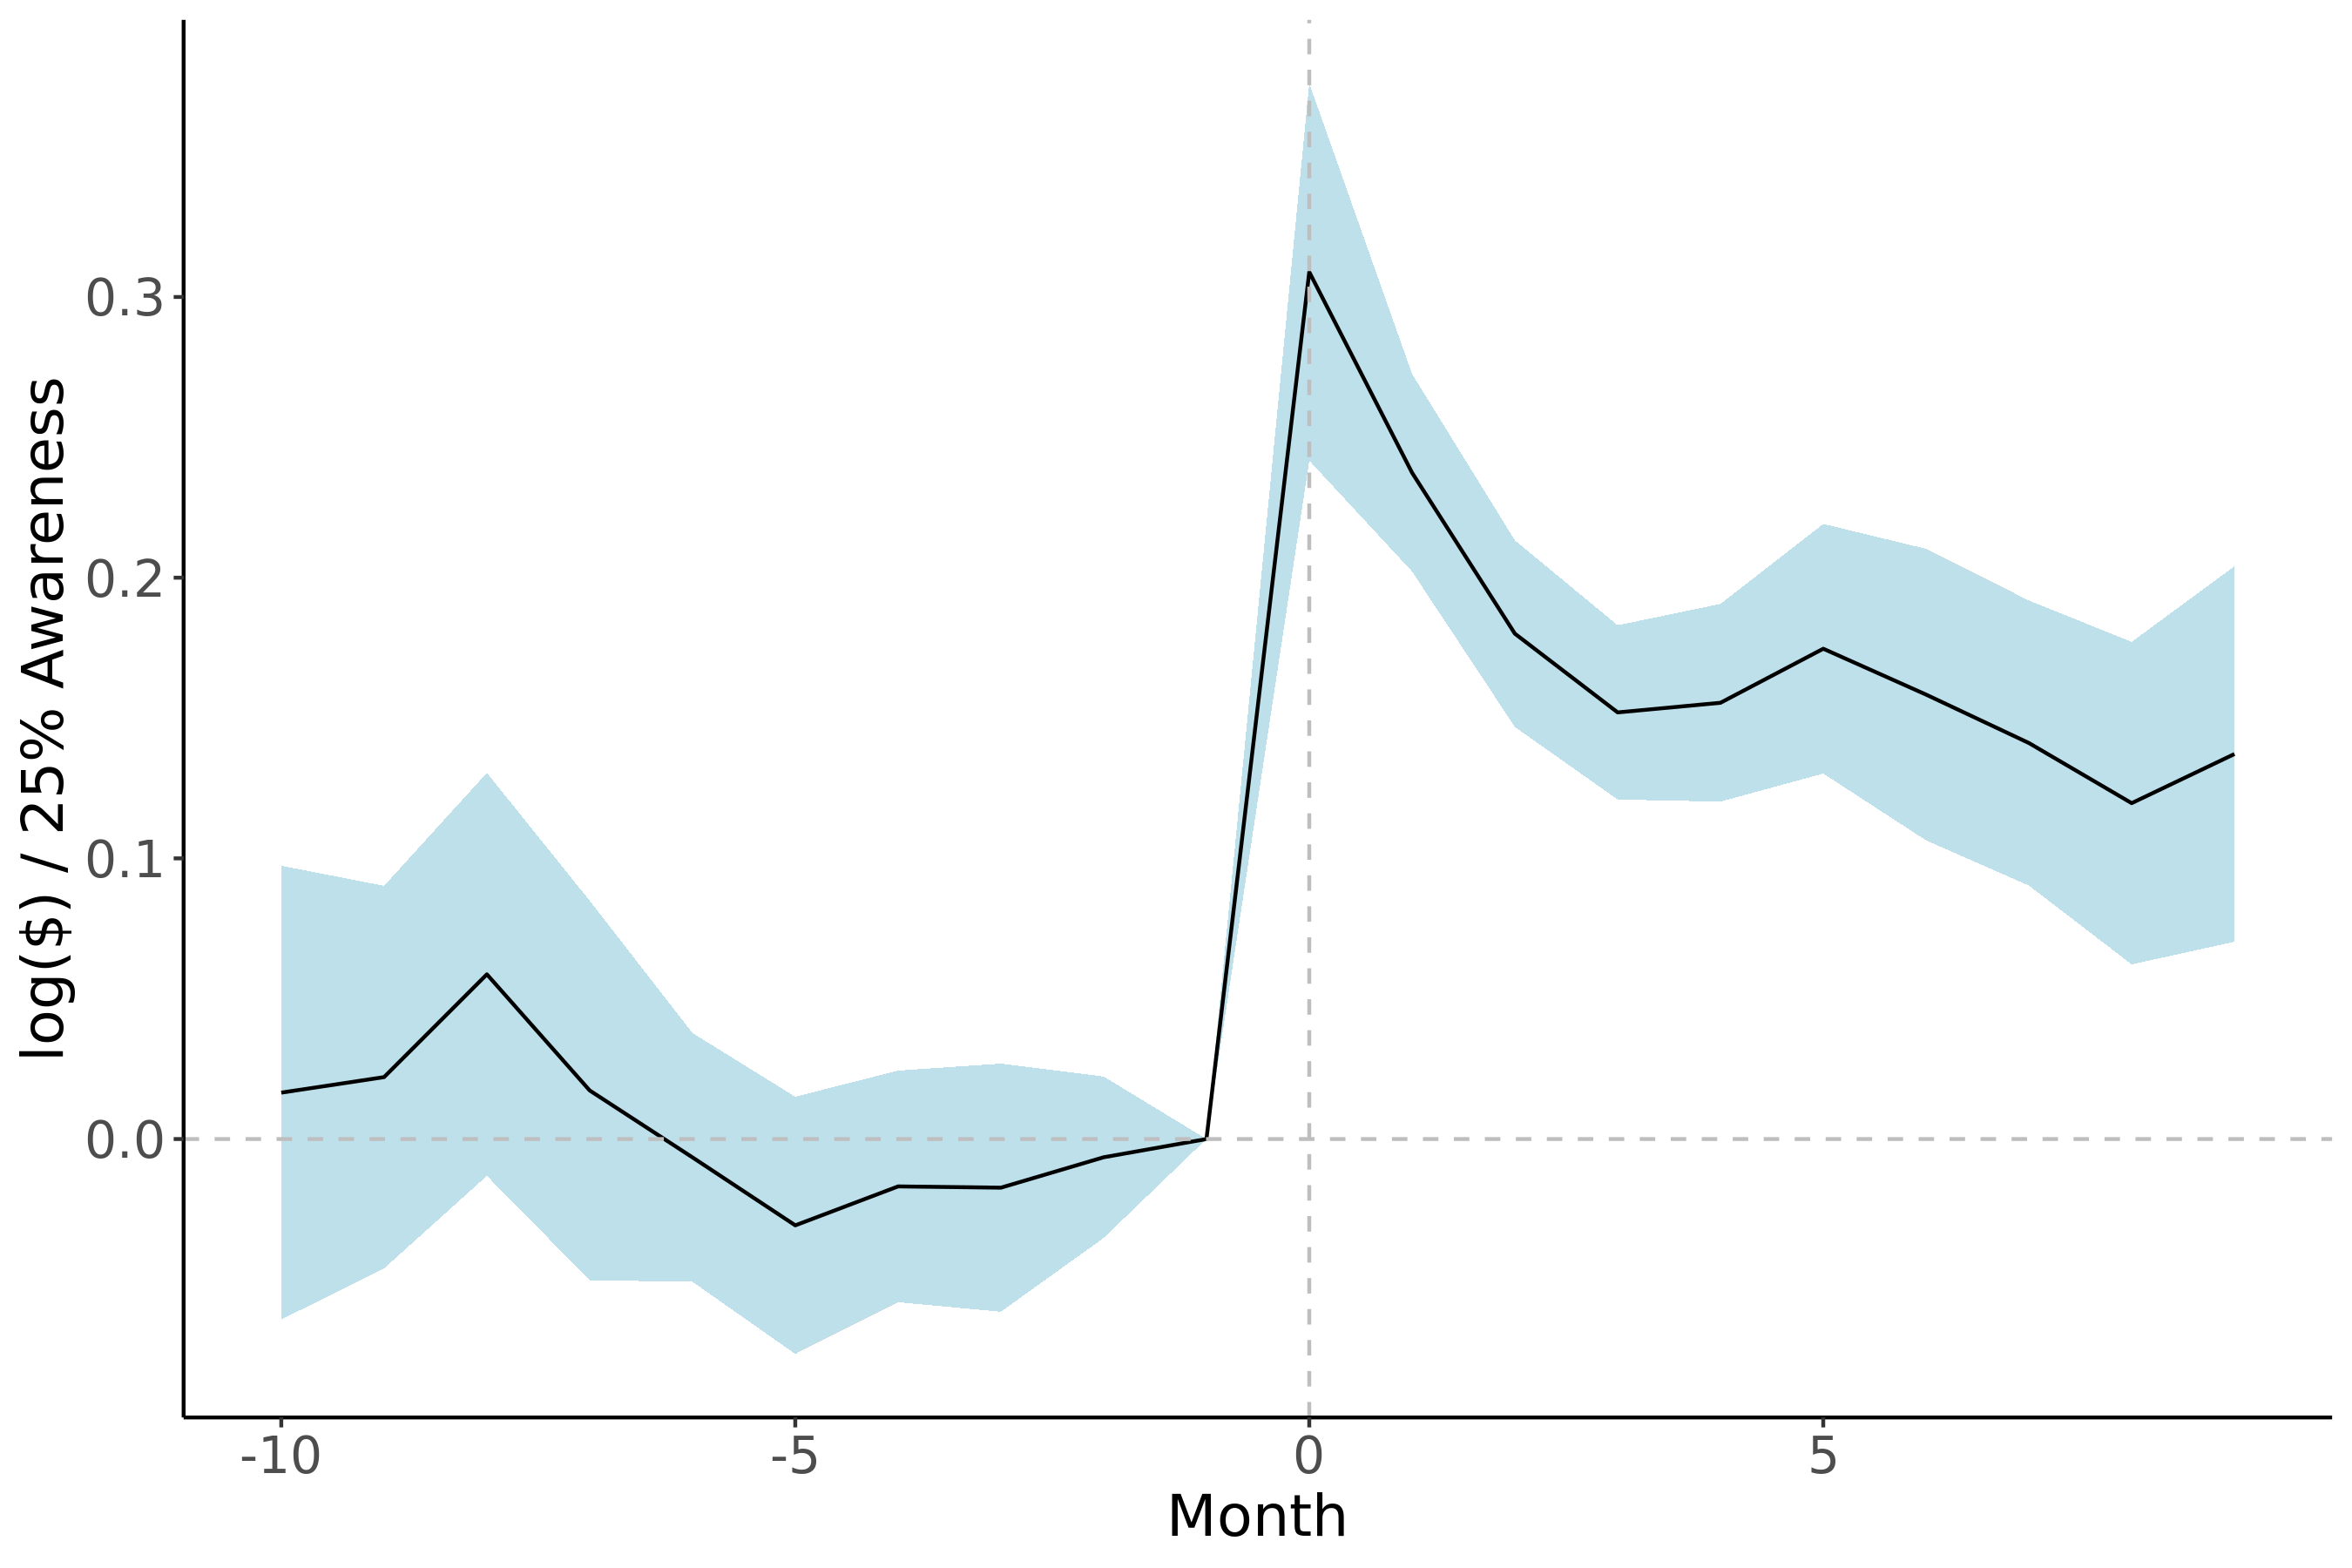
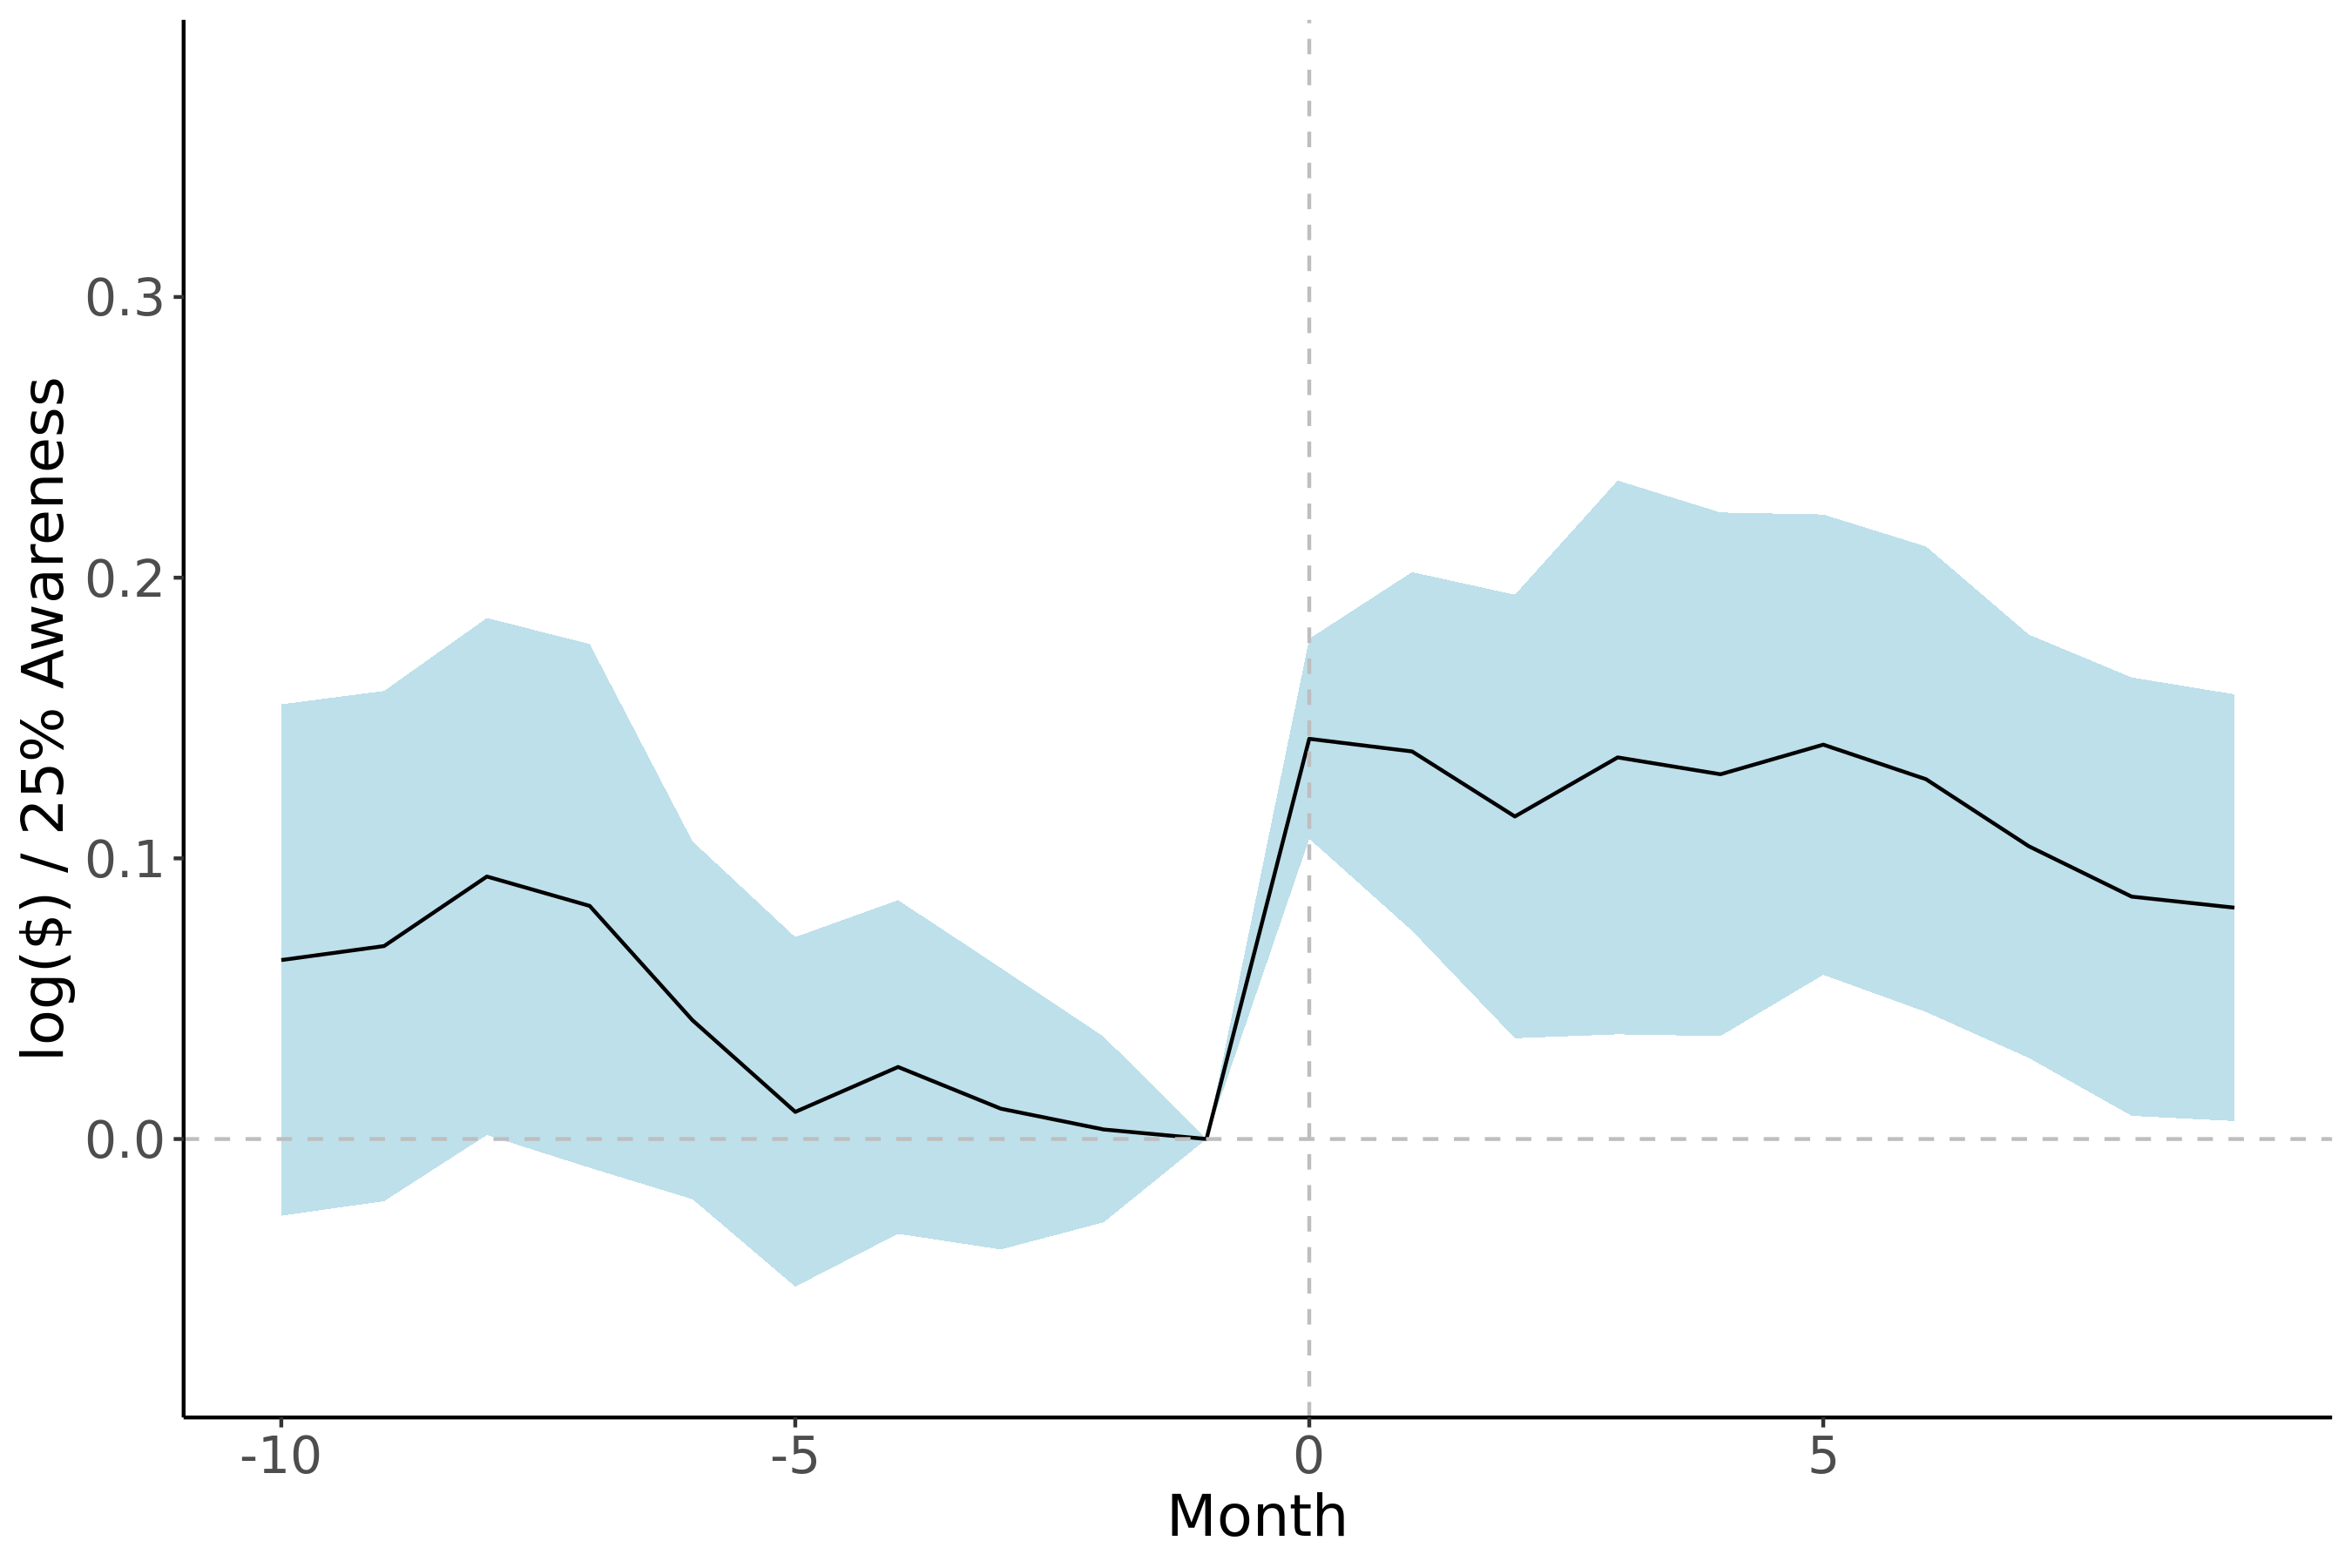
Note: Figure shows differences between the consumption responses of different groups (as shown in Figure 4), along with a 95% confidence interval for this difference. Panel A shows the consumption response difference among the Aligned vs. Opposed donor groups. Panel B shows the consumption response difference among the most aligned decile vs. most opposed non-donor deciles. Responses are scaled relative to consumer awareness and averaged across firms using a precision-weighted average, as described in Sections 4 and 6.2. Standard errors are clustered by event.


Note: Figure shows changes in log consumption at firms by consumer social alignment groups in a placebo exercise, rerunning our analysis as if social stance events occurred one year prior to their actual date. Panel A shows consumption response in levels, Panel B shifts these to aggregate up to an estimated overall consumption impact, and Panel C compares consumption levels to group-specific synthetic counterfactuals. The y-axis range and all other specifications of Panels A-C follow Figure B4, Figure 4 Panel B, and Figure B6, respectively.


Note: Figure shows changes in log consumption at firms in the months surrounding their social stances by consumer social alignment groups. Panels A and B have been modified to show 3 years of pre-event data (i.e., 39 pre-event 4-week “months”), with all other specifications following Figure B4 and Figure 4 Panel B, respectively.


Note: Figure shows changes in log consumption at firms in the months surrounding their social stances by consumer social alignment groups. Panel A modifies Figure B4 to show two years of post-event data (i.e., 26 post-event 4-week “months”), with all other specifications following this appendix figure. Panel B then shifts all levels within a period such that the resulting consumption responses of the middle two deciles of non-donors sum to zero.


Note: Figure shows estimated overall and disaggregated consumption impacts separately among events where donors in the For cluster are likely aligned with vs. opposed to the firm’s stance. Panel A extends Figure 4 Panel A to separately show estimated overall consumption impacts. 95% confidence intervals are constructed using a wild cluster bootstrap approach that accounts for uncertainty in our synthetic difference-in-differences counterfactuals. Panel B extends Figure 4 Panel B to separately show estimated consumption responsiveness by social alignment group. Groups in Panel B are colored according to their likely alignment with the firm’s stance.


Note: Figure shows changes in favorability around firms’ social stance events by social alignment, based on BrandIndex responses. Panel A shows favorability regarding news about the firm, coded as if the respondent reported having heard “Positive” news about the firm in the last two weeks, if reported having heard “Negative” news, and otherwise. Panel B shows favorability toward the firm more generally, again coded as (Positive), (Negative), or (Neutral). Responses are scaled relative to consumer awareness, averaged across firms using a -weighted average, and normalized relative to the month before a firm’s event ().


Note: Figure shows favorability levels around firms’ social stance events by social alignment, based on BrandIndex responses. Panel A shows favorability regarding news about the firm, coded as if the respondent reported having heard “Positive” news about the firm in the last two weeks, if reported having heard “Negative” news, and otherwise. Panel B shows favorability toward the firm more generally, again coded as (Positive), (Negative), or (Neutral). Figure differs from Figure B13 in that responses are not scaled relative to consumer awareness nor normalized relative to month . Favorability levels are averaged across firms using a -weighted average.


Note: Figure shows changes in self-reported purchase behavior at firms in the months surrounding their social stances, based on BrandIndex responses. Panel A shows an indicator for whether a respondent would consider purchasing from the firm when next shopping in that firm’s market (1 if yes; 0 if no), and Panel B shows an indicator for whether a respondent would be most likely to purchase from that firm. Responses are scaled relative to consumer awareness, averaged across firms using a -weighted average, and normalized relative to the month before a firm’s event ().


Note: Figure shows changes in exposure to information about firms, based on BrandIndex responses. Panel A shows an indicator for whether a respondent recently talked with someone about the brand (in-person, online, or through social media), and Panel B shows an indicator for whether a respondent recently saw an advertisement from that firm. Responses are scaled relative to consumer awareness, averaged across firms using a -weighted average, and normalized relative to the month before a firm’s event (). A dashed gray horizontal line at 0.25 in each plot shows our 25 percent consumer awareness benchmark.

Note: Figure shows advertising expenditures for firms in the months surrounding their social stances. Advertising expenditures are calculated in thousands of dollars, summing advertising expenditures within an event-month across channels in Nielsen’s Ad Intel dataset. To avoid dropping zero expenditures, we add one to this value for all firm-month totals before taking logs. Outcomes are scaled relative to consumer awareness, averaged across firms using a -weighted average, and normalized relative to the month before a firm’s event ().


Note: Figure shows price indices for firms in the months surrounding their social stances. Panels A-B are based on the products that belong to a firm’s brand or that are sold under its banner (i.e., in its stores or website, regardless of branding), and show Laspeyres and Paasche price indices, respectively. Panels C-D show analogous Laspeyres and Paasche price indices when restricting only to products with the firm’s brand (excluding other products sold within its stores but without its brand). Outcomes are scaled relative to consumer awareness, averaged across firms using a -weighted average, and normalized relative to the month before a firm’s event (). Data consist of receipt-captured information from Numerator’s omni-channel consumer panel, and all plots use event-month as the base period.


Note: Figure shows cumulative stock returns (Panel A) and cumulative abnormal stock returns (Panels B-C) for firms around their social stances. Abnormal returns are defined in excess of the CRSP value-weighted market return. Outcomes are scaled relative to consumer awareness, averaged across firms using a -weighted average, and normalized relative to the day before a firm’s event ().


Note: Figure shows cumulative abnormal stock returns for firms in the days surrounding their social stances. Abnormal returns are defined according to CAPM (Panel A), the Fama-French 3-Factor Model (Panel B), or the Fama-French Plus Momentum model (Panel C). Outcomes are scaled relative to consumer awareness, averaged across firms using a -weighted average, and normalized relative to the day before a firm’s event ().


Note: Figure shows new job postings (Panels A-B) and average posted salaries (Panels C-D) for firms in the months surrounding their social stances. Panel A counts the number of new job postings by a firm in a given event-month across three job posting datasets from Revelio Labs; these three datasets are sourced from LinkUp, LinkedIn, and job aggregator websites, respectively. To avoid dropping zeros when taking logs, we add one to all firm-month job posting totals before taking logs. Panel B normalizes relative to U.S. trends by calculating an analogous log total across all other U.S. job postings in these data, and then subtracting this value from our event-firm series. Panel C plots the log of the average posted salary across a firm’s job postings from a given event-month. Panel D similarly subtracts the log average salary across all other U.S. job postings in these data. Outcomes are scaled relative to consumer awareness, averaged across firms using a -weighted average, and normalized relative to the month before a firm’s event ().


Note: Figure shows worker flows for firms in the months surrounding their social stances, based on LinkedIn employment histories accessed via Revelio Labs. Panel A plots inflows, calculated as the log number of employees working for an event-study firm in event-month that weren’t working for the firm in event-month . Panel B plots outflows, calculated as the log number of employees who were working for an event-study firm in event-month but not in . To avoid dropping zeros, we add one to all totals before taking logs. Outcomes are scaled relative to consumer awareness, averaged across firms using a -weighted average, and normalized relative to the month before a firm’s event ().


Note: Figure shows employee reviews of firms in the months surrounding their social stances, based on Glassdoor data accessed via Revelio Labs. Reviews are anonymous and are provided on a 1-5 star scale. Panel A shows the average overall rating for the firm, while Panel B shows the average rating for the firm on the “Culture and Values” dimension specifically. Panels C-D respectively plot average ratings on these two dimensions now split by alignment tercile, inferring alignments from the vote share of the review’s county. Outcomes are scaled relative to consumer awareness, averaged across firms using a -weighted average, and normalized relative to the month before a firm’s event ().

Note: Figure shows the cumulative monthly impact of aggregated group-specific consumption responses after a given number of months. These cumulative monthly impacts are estimated using the average stance consumption response estimates from Figure 4 Panel B. These effects are aggregated across groups using either the -weighted average baseline consumption shares shown in Figure 3 of firms’ actual consumer base, or alternatively by the (reversed) baseline shares they would have faced had they taken counterfactual stances in the opposite For/Against direction on the same issue topic. See Section 7 for detail.


Note: Figure shows the share of consumption (in $) by group, which we refer to as baseline shares, in different markets. Consumer groups are defined as described in Section 5, ordering consumers based on their predicted social alignment with positions in the For donation cluster. Panel A shows each group’s share of consumption (in $) by state for Massachusetts and Alabama separately, aggregating across all transactions throughout the period studied (2008-2023Q1) made by consumers based in the specified state. Panel B shows each group’s share of consumption (in $) separately for two example industries (“Arts, Entertainment & Recreation” and “Agriculture, Forestry, Fishing & Hunting”), aggregating all transactions made at firms in the specified industry throughout the period studied.


Note: Figure shows the average monthly log sales impact of a firm’s social stance after five months, using average consumption response estimates identified in Figure 4 Panel B combined with state-specific baseline shares. These baseline shares are constructed using all consumption within a state, as shown in Figure B25 Panel A for Massachusetts and Alabama. Panels A and B, respectively, show the average monthly log sales impact (per 25 percent consumer awareness) induced by an average stance in the same direction vs. in the opposite direction as positions in the For donation cluster.


Note: Figure shows time trends related to our BrandIndex-based consumer awareness measure, plotting separate blue lines for each event covered by BrandIndex as well as a black line for the mean across events. Panel A shows monthly trends in the share of consumers who report having good or bad news about the firm in the last two weeks, as described in Appendix Section A.2. Denoting this share as for event-firm in month , Panel B then shows trends in . The value for a given line in month gives our estimate of the share of consumers who were aware of that firm’s social stance event (see Appendix Section A.2 for detail).


Note: Figure shows changes in news coverage of firms in the months surrounding their social stances. Panel A shows the number of TDM ProQuest U.S. Newsstream articles about the firm, averaged by month across event-study firms. Social stance firms are the subject of articles in month , and this value is normalized to zero in Panel A. Panel B shows a histogram summarizing across events the change in news coverage of the event-study firm between months and , which is an alternative proxy for an event’s size or salience as defined in Section 4.


Note: Figure follows Figure B28 in showing changes in news coverage of firms in the months surrounding their social stances. It modifies this previous figure by using an LLM (gpt-4o-mini) to identify and filter to articles that specifically discuss a controversial social stance taken by the event-study firm. Panel A shows the number of TDM ProQuest U.S. Newsstream articles about the firm’s stance, averaged by month across event-study firms. Panel B shows a histogram summarizing across events the change in news coverage of the firm’s stance between months and .

Note: Figure shows changes in log Google Trends searches for firms in the months surrounding their social stances. Changes are normalized relative to the month before a firm’s event (). Months are defined as 4-week periods relative to the firm’s event.
| Description | Imputed | Year | Direction | |
|---|---|---|---|---|
| 0.440 | Comments against same-sex marriage | No | 2012 | Against |
| 0.392 | Endorsement of controversial racial justice protester | No | 2018 | For |
| 0.272 | Contraceptive-related corporate policy | Yes | 2014 | Against |
| 0.217 | Gun control stance and policies | No | 2018 | For |
| 0.179 | Removed brand of controversial figure | No | 2017 | For |
| 0.171 | Transgender bathroom policy | No | 2016 | For |
| 0.165 | Pro-immigration stance and ad campaign | Yes | 2017 | For |
| 0.156 | Controversial diversity training | No | 2020 | For |
| 0.137 | Criticism of protesters | No | 2017 | Against |
| 0.121 | Severed ties with pro-gun group | No | 2018 | For |
| 0.119 | Severed ties with pro-gun group | No | 2018 | For |
| 0.117 | Prioritized privacy over law enforcement cooperation | No | 2016 | For |
| 0.116 | Stance on voting legislation | No | 2021 | For |
| 0.113 | Controversial diversity and inclusion campaign | No | 2015 | For |
| 0.106 | Pulled ads from controversial program | No | 2011 | Against |
| 0.104 | Banned account of controversial figure | No | 2021 | For |
| 0.098 | Supported controversial public policy | No | 2021 | For |
| 0.091 | Opposition to controversial figure | No | 2018 | For |
| 0.086 | Removed popular figure for anti-LGBTQ remarks | No | 2013 | For |
| 0.086 | Removed controversial video and app | No | 2021 | For |
| 0.084 | Opposition to anti-LGBTQ legislation | No | 2022 | For |
| 0.075 | Donated to controversial cause | No | 2018 | Against |
| 0.074 | Banned controversial group | No | 2020 | For |
| 0.068 | Opposed immigration restrictions | No | 2017 | For |
| 0.067 | Supported same-sex marriage | No | 2012 | For |
| 0.062 | Removed brand of controversial figure | No | 2015 | For |
| 0.062 | Supported same-sex marriage | Yes | 2015 | For |
| 0.060 | Supported controversial figure | No | 2017 | Against |
| 0.055 | Donated to controversial causes | No | 2021 | Against |
| 0.055 | Stance on voting legislation | No | 2021 | For |
| 0.055 | Employee fired over anti-diversity memo | No | 2017 | For |
| 0.052 | Supported controversial figure | No | 2016 | Against |
| 0.051 | Continued ties with pro-gun group | Yes | 2018 | Against |
| 0.049 | Supported Black Lives Matter | Yes | 2016 | For |
| 0.049 | Severed ties with pro-gun group | No | 2018 | For |
| 0.048 | Pro-LGBTQ+ campaign | No | 2014 | For |
| 0.048 | Supported abortion access | No | 2021 | For |
| 0.047 | Produced program perceived as anti-transgender | No | 2021 | Against |
| 0.045 | Response to immigration restrictions | No | 2017 | Against |
| 0.044 | Suspended sale of some types of firearms | No | 2012 | For |
| 0.042 | Opposition to controversial figure | No | 2016 | For |
| 0.041 | Opposition to anti-LGBTQ legislation | No | 2016 | For |
| 0.040 | Pro-LGBTQ+ stance | No | 2018 | For |
| 0.040 | Opposition to anti-LGBTQ legislation | No | 2016 | For |
| 0.040 | Asked customers not to bring their firearms in stores | No | 2019 | For |
| 0.038 | Supported abortion access | No | 2021 | For |
| 0.038 | Donations to causes perceived as anti-abortion | No | 2021 | Against |
| 0.037 | Pro-LGBTQ+ advertisement | No | 2015 | For |
| 0.035 | Criticized comment by controversial figure | No | 2017 | For |
| 0.034 | Asked customers not to bring their firearms in stores | No | 2014 | For |
| 0.034 | Controversial donations by key stakeholder | Yes | 2017 | Against |
| 0.034 | Stopped promoting brand of controversial figure | No | 2017 | For |
| 0.032 | Pulled ads from controversial program | No | 2017 | For |
| 0.032 | Donations to causes perceived as anti-abortion | No | 2019 | Against |
| 0.031 | Severed ties with controversial figure | No | 2017 | For |
| 0.030 | Controversial donations by key stakeholder | No | 2021 | Against |
| 0.029 | Opposed anti-LGBTQ legislation | Yes | 2016 | For |
| 0.029 | Donations to causes perceived as pro-gun | No | 2018 | Against |
| 0.029 | Severed ties with pro-gun group | No | 2018 | For |
| 0.027 | Supported controversial figure | No | 2019 | Against |
| 0.027 | Perceived opposition to controversial figure | No | 2016 | For |
| 0.026 | Opposed anti-LGBTQ legislation | Yes | 2015 | For |
| 0.026 | Opposed immigration restrictions | No | 2017 | For |
| 0.026 | Supported Black Lives Matter | No | 2020 | For |
| 0.025 | Continued selling brand of controversial figure | No | 2017 | Against |
| 0.025 | Opposition to controversial figure | No | 2021 | Against |
| 0.024 | Supported gun control | No | 2018 | For |
| 0.023 | Pulled ads from controversial program | No | 2018 | For |
| 0.023 | Supported pro-choice abortion activist | Yes | 2016 | For |
| 0.023 | Imposed health mandates | No | 2020 | For |
| 0.023 | Supported Black Lives Matter | No | 2016 | For |
| 0.022 | Pulled ads from controversial program | Yes | 2018 | For |
| 0.022 | Supported abortion access | No | 2021 | For |
| 0.022 | Severed ties with pro-gun group | No | 2018 | For |
| 0.021 | Confirmed severed ties with pro-gun group | No | 2018 | For |
| 0.021 | Removed brand of controversial figure | No | 2017 | For |
| 0.020 | Supported Black Lives Matter and racial justice initiatives | No | 2020 | For |
| 0.020 | Removed book from controversial figure | No | 2014 | For |
| 0.019 | Imposed health mandates | Yes | 2022 | For |
| 0.017 | Criticism of healthcare reform | No | 2012 | Against |
| 0.017 | Removed brand of controversial figure | No | 2021 | For |
| 0.017 | Asked customers not to openly carry firearms in stores | No | 2019 | For |
| 0.016 | Supported controversial figure | Yes | 2016 | Against |
| 0.016 | Opposed immigration restrictions | No | 2017 | For |
| 0.016 | Donated to controversial cause | Yes | 2020 | Against |
| 0.016 | Transgender locker room policy | Yes | 2015 | For |
| 0.016 | Severed ties with pro-gun group | No | 2018 | For |
| 0.016 | LGBTQ+ support/inclusion | No | 2017 | For |
| 0.015 | Opposed immigration restrictions | No | 2017 | For |
| 0.015 | Ad subverting gender stereotypes | No | 2011 | For |
| 0.013 | Pulled ads from controversial program | No | 2018 | For |
| 0.013 | Asked customers not to bring their firearms in stores | No | 2016 | For |
| 0.010 | Opposed controversial figure and changes to national monuments | No | 2017 | For |
| 0.010 | Severed ties with military-style weapons makers | No | 2018 | For |
| 0.010 | Pulled ads from controversial program | No | 2018 | For |
| 0.010 | Halted orders from supplier over gun sales | No | 2018 | For |
| 0.009 | Donations to causes perceived as anti-abortion | No | 2021 | Against |
| 0.009 | Removed brand of controversial figure | No | 2017 | For |
| 0.009 | Stopped promoting brand of controversial figure | No | 2017 | For |
| 0.009 | Severed ties with pro-gun group | No | 2018 | For |
| 0.009 | Opposed anti-abortion legislation | No | 2019 | For |
| 0.008 | Stated intent to continue flying confederate-era flag | No | 2017 | Against |
| 0.008 | Severed ties with controversial figure | No | 2017 | For |
| 0.006 | Severed ties with pro-gun group | No | 2018 | For |
| 0.006 | Ad criticizing policy of controversial figure | No | 2018 | For |
| 0.005 | Continued ties with controversial figure | No | 2021 | Against |
| 0.004 | Severed ties with controversial figure | No | 2014 | For |
| 0.004 | Pulled ads from controversial program | No | 2018 | For |
| 0.004 | Stopped selling controversial family’s brand | No | 2017 | For |
| 0.004 | Severed ties with pro-gun group | No | 2018 | For |
| 0.004 | Opposed controversial figure and his supporters | Yes | 2017 | For |
| 0.003 | Affirmative action hiring initiative | No | 2020 | For |
| 0.002 | Pulled ads from controversial program | No | 2017 | For |
| 0.002 | Key stakeholder supported controversial figure | Yes | 2021 | Against |
| 0.001 | Pulled ads from controversial platform | No | 2016 | For |
| 0.000 | Opposed immigration restrictions | No | 2017 | For |
Note: Table shows the complete list of social stance events we analyze. For each event, we provide the year, whether the stance was aligned with positions in the For vs. Against donation cluster, our estimate of the share of consumers who were aware of this event (), an indication of whether was imputed from Google Trends data and news reports because this event was not covered by BrandIndex data, and a brief description of each event. These descriptions are generic, as we are unable to identify the firms included in our analysis under the terms of the agreement with our data provider.