11email: matteo.bonato@inaf.it 22institutetext: INAF, Osservatorio Astronomico di Padova, Vicolo Osservatorio 5, I-35122 Padova, Italy
22email: gianfranco.dezotti@inaf.it
Local luminosity functions of galaxies at (sub)millimeter wavelengths from Planck surveys
Abstract
Aims. The Planck all-sky surveys at (sub)millimeter wavelengths enable us to accurately determine the corresponding local luminosity functions up to the highest luminosities. The detected galaxies are strictly local, so evolutionary effects, which are known to be particularly strong at these wavelengths, are not a problem. However, previous studies have so far relied only on the Planck Early Release Compact Source Catalog (ERCSC) for this purpose. Another important improvement over earlier estimates is the availability of complete all-sky catalogs of galaxies within hundreds of megaparsecs, with redshift-independent distances for nearby objects, for which redshifts are not reliable distance estimators. In this paper we re-estimate the (sub)millimeter local luminosity functions using data from the Second Planck Catalog of Compact Sources, which supersedes the previously used ERCSC and contains far more sources and more accurate photometry.
Methods. We computed the luminosity functions using both the classical and the nonparametric kernel density estimation (KDE) method, which overcomes limitations of binning techniques. Our implementation of the KDE uses the weighting to account for survey selection effects.
Results. We obtain Planck-based local luminosity functions at 857, 545, 353, and 217 GHz, as well as the total IR luminosity function and the dust mass function. We find significant differences from earlier estimates and discuss their possible origins.
Key Words.:
galaxies: luminosity function, mass function – galaxies: photometry – galaxies: starburst – submillimeter: galaxies1 Introduction
The local luminosity function (LLF) is the necessary benchmark for assessing the evolutionary properties of extragalactic sources. The first estimates of the galaxy LLF at submillimeter (submm) wavelengths based on blind surveys were obtained with the Balloon-borne Large Aperture Submillimeter Telescope (BLAST), which surveyed at 250, 350, and m (Eales et al., 2009). Surveys with the Spectral and Photometric Imaging REceiver (SPIRE) and the Photodetector Array Camera and Spectrometer (PACS) on board the Herschel Space Observatory provided better statistics and improved angular resolution, enabling firmer identifications (Eales et al., 2010; Oliver et al., 2012; Lutz, 2014); areas of a few tens of square degrees were used for luminosity function (LF) estimates (Vaccari et al., 2010; Gruppioni et al., 2013; Marchetti et al., 2016).
The shallow Planck all-sky surveys with the High Frequency Instrument (HFI) are ideal for sampling the LLF up to the highest luminosities, without being affected by the strong evolutionary effects present at submm wavelengths. They are the only blind surveys that allow estimates of the galaxy LLF at 850 and 1382m, since no other instrument has covered a sufficiently large area at these wavelengths. So far, only a preliminary exploitation of Planck/HFI data has been published. Negrello et al. (2013) used the Planck Early Release Compact Source Catalog (ERCSC; Planck Collaboration VII, 2011) to derive the LLF of dusty galaxies in the local Universe (distances Mpc) at 350, 500, and m and also to provide a preliminary estimate at 1.382 mm.
The Planck galaxy catalogs have been subsequently much improved (Planck Collaboration XXVIII, 2014; Planck Collaboration XXVI, 2016; Planck Collaboration Int. LV, 2020). While the ERCSC used data from one complete survey and 60% of the second survey, the Second Planck Catalog of Compact Sources (PCCS2) lists discrete objects extracted from the full mission maps. These include five surveys with the HFI and eight surveys with the Low Frequency Instrument (LFI). The PCCS2 not only reaches significantly fainter flux densities but also takes advantage of a much better knowledge of the instrument, leading to improved calibration and map quality, as well as better beam characterization, which is crucial for obtaining precise flux density measurements. Despite the extensive work carried out by Negrello et al. (2013) to account for various problems affecting ERCSC flux densities, substantial uncertainties remained.
Catalogs were produced for each of the nine Planck frequency channels. The HFI catalogs (at 100, 143, 217, 353, 545, and 857 GHz, corresponding to 3000, 2100, 1382, 850, 550, and m, respectively) were divided into two subcatalogs, PCCS2 and PCCS2E, based on source reliability, defined as the fraction of sources above a given signal-to-noise ratio (S/N) that are real. The PCCS2 catalog contains sources whose reliability could be quantified and was found to be at least 80%, while PCCS2E contains sources of unknown reliability. The S/N threshold corresponding to the 80% reliability is generally in the range 4–5 in the high Galactic latitude area of interest here but may increase to up to 10 around the Galactic plane. The right-hand panels of Fig. 8 of Planck Collaboration XXVI (2016) show maps of such S/N thresholds for all HFI channels.
Planck Collaboration Int. LV (2020) present a reanalysis of all PCCS2 and PCCS2E (PCCS22E) sources detected at 857 GHz (Bayesian Extraction and Estimation Package (BeeP) catalog). In this paper, data re-extracted from Planck and Infrared Astronomical Satellite (IRAS) maps are combined to assess the reliability of each source and to redetermine the flux densities at 857, 545, 353, and 217 GHz. It also contains flux densities at 3000 GHz (m) derived from the corresponding IRIS map (a reprocessed IRAS map; Miville-Deschênes and Lagache, 2005), using the same pixelization as the Planck maps.
Singling out dusty galaxies in the ERCSC was another laborious task (Negrello et al., 2013). In recent years, the situation has greatly improved in this respect. Kovlakas et al. (2021) compiled an all-sky catalog of 204,733 galaxies within a distance of 200 Mpc, called the Heraklion Extragalactic Catalog (HECATE). This catalog contains accurate positions, galaxy sizes, distances (redshift-independent as far as possible for the nearest objects), multiband photometry, and several global properties of galaxies.
The source of -independent distances in HECATE is the NASA/IPAC Extragalactic Database (NED) master list of redshift-independent extragalactic distances (NED-D111https://ned.ipac.caltech.edu/Library/Distances/). The NED-D catalog was compiled through an extensive literature search of distances based on primary methods (standard candles or standard rulers) or secondary methods, such as the Tully-Fisher or fundamental plane relations. The methodology is described in Steer et al. (2017). For galaxies not in NED-D, Kovlakas et al. (2021) used spectroscopic redshifts. To avoid the effects of peculiar velocities and local deviations from the Hubble flow, they used -independent distances as the training data set to infer distances at similar recession velocities. The HECATE catalog was estimated to be complete for up to distances of Mpc.
The growth of large-scale imaging surveys in different wavebands and the constantly increasing completeness of redshift and redshift-independent distance measurements in the regularly updated NED have allowed the construction of the NED Local Volume Sample (NED-LVS; Cook et al., 2023). The NED-LVS catalog contains objects with distances of up to 1000 Mpc. It was found to be nearly 100% complete out to Mpc for galaxies with and about 80% complete out to 180 Mpc with no luminosity cut. Redshift-independent distances, when available, were chosen at distances less than 200 Mpc. The NED-LVS catalog was found to be 10–20% more complete than HECATE and is adopted in the following. These catalogs of local galaxies allow us to identify Planck-detected galaxies by cross-matching Planck catalogs with them.
In this paper we take advantage of the much improved data situation to obtain novel determinations of the LLF at 857, 545, 353, and 217 GHz. We describe the data in Sect. 2 and present the two methods adopted to compute the LLFs in Sect. 3 . We also used the 857 GHz sample to derive the total infrared (IR; 8–m) LF because it corresponds to the Planck frequency closest to the dust emission peak. Following a widely used approach (Dunne et al., 2000; Vlahakis et al., 2005; Clemens et al., 2013), we estimate the dust mass function based on the 353 GHz sample. Section 5 discusses the results and summarizes our conclusions.
Throughout this paper we adopted a spatially flat cosmology with and (Planck Collaboration VI, 2020). Whenever the NED-LVS distances were derived from redshift, we adopted a Hubble constant and a flat cosmology with . We applied a small correction for the different cosmological model used here.
2 Data
This paper is based on the PCCS22E catalogs (Planck Collaboration XXVI, 2016) at 217, 353, 545, and 857 GHz, downloaded from the Planck Legacy Archive (PLA222https://pla.esac.esa.int/pla/#catalogues). These remain the most up-to-date Planck products.
We restricted our analysis to galaxies at Galactic latitudes to minimize the contamination of the flux densities by diffuse Galactic emission. This region almost entirely comprises the “extragalactic zone,” which, for HFI channels, is defined as the region where the source reliability can be accurately quantified. For each HFI frequency channel the PLA provides a “zone mask” where source reliability is unquantified; the “extragalactic zone” is thus the region outside the “zone mask” (see Fig. 8 of Planck Collaboration XXVI 2016 for an example).
The PCCS2 provides four flux density measures for each source: DETFLUX, supplied by the source detection algorithm; aperture photometry (APERFLUX); fitting a model of the point spread function at the position of the source (PSFFLUX); and fitting an elliptical Gaussian model to the source (GAUFLUX). We used APERFLUX for all channels except 857 GHz, where we used BeeP photometry, because Planck Collaboration XXVI (2016) find APERFLUX to be the most appropriate flux-density measure to use for the higher frequency channels.
The BeeP catalog contains exactly the same sources as the original PCCS22E 857 GHz catalog. Planck Collaboration Int. LV (2020) did not attempt to detect new sources, but remeasured the photometric data of the cataloged sources. Thus, we relied on the PCCS22E to determine the completeness limits. In the extragalactic zone they are 791 mJy for the PCCS2 and 927 mJy for the PCCS2E at the 90% level.
The 857 GHz selection implies that the BeeP catalog is not suitable for defining complete samples at the other Planck frequencies. We therefore referred directly to the PCCS22E catalogs.
3 Methodology
We computed the LFs using the classical (Schmidt, 1968) and the kernel density estimation (KDE) method (Caditz and Petrosian, 1993; Yuan et al., 2020, 2022).
The method is a nonparametric technique that starts with dividing the data into luminosity bins. Each source is weighted by the reciprocal of the maximum volume, , within which it can be detected. We confined our analysis to distances Mpc, at which NED-LVS is expected to be complete for the relatively bright galaxies considered here (Cook et al., 2023). For these nearby galaxies, is given by
| (1) |
where is the solid angle covered by the sample and , with Mpc and is the distance at which the source would be at the detection limit, . The K-correction, , is not completely negligible for the most distant objects because of the steepness of the dust emission spectrum at (sub)mm wavelengths. We computed it using the spectral energy distribution (SED) of starburst galaxies defined by Cai et al. (2013), which is available online333http://staff.ustc.edu.cn/~zcai/galaxy_agn/index.html.
The space density in the i-th luminosity bin, with central luminosity is
| (2) |
where the sum is over the sources in the bin.
We computed the errors following Ananna et al. (2022, their Appendix A). The upper and lower limits of the 0.8413 confidence level to are given by
| (3) | ||||
The weight and the effective number of sources in the bin, , are given by
| (4) | ||||
We computed the functions and using eqs. (9) and (14) of Gehrels 1986:
| (5) | ||||
The KDE is a nonparametric approach for estimating continuous density functions that avoids the discretization artifacts inherent to traditional binning techniques while properly accounting for survey selection effects. We followed the adaptive framework described in Yuan et al. (2022), accounting for survey selection effects through weighting.
The weighted KDE estimator for the LF , with , is defined as
| (6) |
where are the observed log-luminosities, is the smoothing bandwidth, and the sum is over the galaxies in the sample. This formulation ensures that each galaxy contributes to the total density estimate in proportion to its accessible volume, providing a continuous and smooth representation of the LF.
A critical aspect of KDE is the choice of bandwidth, which governs the smoothing scale. Too large a bandwidth can lead to over-smoothing; in the case of a sharp steepening of the LF, this would generate spurious excesses by scattering sources from below to above the knee. Conversely, too narrow a bandwidth results in a noisy estimator dominated by Poisson fluctuations. While automated selection criteria exist, such as the widely used “rule of thumb” methods by Silverman (1986) and Scott (1992), these are often optimized for Gaussian-like distributions and may lead to significant over-smoothing when applied to functions with a sharp break or an exponential tail, such as the LF. We therefore performed an empirical optimization by testing a range of bandwidths and comparing the resulting KDEs with the binned estimates. We find that a constant bandwidth of 0.25 (in log-luminosity space) provides the optimal balance between bias and variance. This value ensures that the steep decline at the bright end of the LF is accurately preserved without introducing spurious oscillations driven by local fluctuations.
We estimated statistical uncertainties via bootstrap resampling. We generated 200 realizations of the source catalog and adopted the median of the resulting distributions as our best estimate, with the 16th and 84th percentiles defining the confidence interval.
4 Luminosity functions

| ) | err | err | |||
|---|---|---|---|---|---|
| 21.750 | 9 | 6.749 | -1.622 | 0.191 | 0.204 |
| 22.250 | 34 | 26.780 | -1.777 | 0.091 | 0.093 |
| 22.625 | 54 | 45.255 | -1.828 | 0.065 | 0.066 |
| 22.875 | 96 | 89.878 | -1.945 | 0.048 | 0.048 |
| 23.100 | 115 | 110.096 | -2.106 | 0.043 | 0.043 |
| 23.300 | 130 | 124.289 | -2.357 | 0.041 | 0.041 |
| 23.500 | 145 | 139.443 | -2.624 | 0.038 | 0.038 |
| 23.700 | 129 | 123.535 | -2.977 | 0.041 | 0.041 |
| 23.900 | 106 | 102.330 | -3.371 | 0.045 | 0.045 |
| 24.100 | 85 | 81.426 | -3.804 | 0.051 | 0.051 |
| 24.300 | 63 | 60.373 | -4.223 | 0.059 | 0.060 |
| 24.500 | 30 | 29.522 | -4.824 | 0.086 | 0.088 |
| 24.800 | 22 | 22.000 | -5.347 | 0.101 | 0.103 |
| Model | ||||
| 857 GHz | ||||
| Eq. (7) | -1.506 | 22.763 | 0.765 | 2.734 |
| Eq. (8) | -1.953 | 22.850 | 0.264 | 2.649 |
| KDE | -1.779 | 23.186 | -0.021 | 2.137 |
| 545 GHz | ||||
| Eq. (7) | -1.512 | 22.457 | 0.992 | 3.374 |
| Eq. (8) | -1.963 | 22.850 | 0.264 | 2.649 |
| KDE | -2.029 | 23.007 | 0.176 | 3.012 |
| 353 GHz | ||||
| Eq. (7) | -1.400 | 21.864 | 0.790 | 3.437 |
| Eq. (8) | -1.854 | 22.336 | 0.093 | 2.705 |
| KDE | -2.001 | 22.449 | 0.202 | 2.600 |
| 217 GHz | ||||
| Eq. (7) | -1.668 | 21.635 | 1.313 | 3.230 |
| Eq. (8) | -2.063 | 21.986 | 0.270 | 4.194 |
| KDE | -2.372 | 22.137 | 0.446 | 3.388 |
4.1 The 857 GHz (m) LLF
There are 1361 sources at with at 857 GHz. Only 28 of them have Jy. We confined the analysis to the 1333 sources brighter than 1 Jy. A cross-match with NED-LVS yields 1049 matches within 1 arcmin. Conservatively restricting ourselves to distances Mpc leaves 1022 sources. We obtain exactly the same number of matches using HECATE instead of NED-LVS. This suggests that both catalogs are complete for the local Planck-detected galaxies, which are bright. However, the two samples are not identical: 28 sources differ. We expected a small difference because of the slightly different recipes used to compute the distances, implying that some sources moved below or above the chosen distance limit of 180 Mpc.
Here and for the other Planck channels, we chose the cross-match with NED-LVS, considering the improved completeness of redshift and -independent distance measurements. A close inspection of the sample identified five sources that are not galaxies and were therefore removed. They are PCCS2 857 G289.93+64.36 (blazar), PCCS2E 857 G144.38-49.91 (cirrus), PCCS2 857 G208.54+33.29 (planetary nebula), PCCS2 857 G075.84-73.62 (HII region), and PCCS2E 857 G133.69-46.66 (molecular cloud). We kept the 32 sources classified as multiples (30 pairs, two triplets). If the far-infrared (FIR)/submm emission is not dominated by one member of the system, the bright tail of the LF, where these sources reside, is slightly overestimated. Ignoring them would cause a slight incompleteness.
The surface density of NED-LVS galaxies within 180 Mpc is , implying that the expected number of random associations within for 1017 trials is , i.e., . Extending the search radius to adds 12 matches. Using the Aladin sky atlas (Bonnarel et al., 2000), we checked whether these additional matches are real counterparts to Planck sources. We find that two very extended, nearby galaxies (NGC 55 and M81) are real counterparts; they were added to the sample, which then includes 1019 galaxies. The other matches are either Galactic sources or blazars, dominated by nonthermal radio emission from the active nucleus.
Figure 1 shows our LLF estimates, obtained with the and KDE methods. The results of the two methods are fully consistent with each other, with the central KDE estimates slightly higher at high luminosity. The figure also shows the estimates of Marchetti et al. (2016) and Negrello et al. (2013) for comparison. The latter are based on Planck/ERCSC data, while the former rely on the Herschel Multi-tiered Extragalactic Survey (HerMES) covering , carried out with the SPIRE instrument.
We reach luminosities about a factor of three higher than Marchetti et al. (2016) and have statistical and systematic errors much lower than those of Negrello et al. (2013). We find a significantly steeper decline above the knee luminosity than in earlier estimates.
We fitted the results with the double power-law functions introduced by Lawrence et al. (1986):
| (7) |
and by Massardi et al. (2010):
| (8) |
Both fits are similarly good (reduced ). We also used Eq. (8) to fit the KDE results. Table 2 lists the best-fit values of the parameters.
Table 3. shows the total local luminosity densities obtained by integrating from zero to using eq. (7), eq. (8), and the KDE LF. We note that the KDE value refers to the central estimates (solid dark blue line in Fig. 1), not to the double power-law fit (solid red line in the same figure); the latter gives a value that is 6% higher. Since the low-luminosity slope is flat and the high-luminosity slope is steep, the luminosity density is only weakly sensitive to the integration limits. The integral from zero to infinity is only 3% higher than the integral over the range covered by observations. Our luminosity density is lower than the estimate of Marchetti et al. (2016).
The exponential function of Saunders et al. (1990) gave a substantially worse fit and was not considered further.
| ) | err | err | |||
|---|---|---|---|---|---|
| 8.250 | 3 | 2.355 | -1.556 | 0.335 | 0.400 |
| 8.625 | 7 | 5.291 | -1.484 | 0.217 | 0.236 |
| 8.875 | 17 | 11.679 | -1.491 | 0.142 | 0.148 |
| 9.100 | 20 | 14.816 | -1.740 | 0.125 | 0.129 |
| 9.300 | 47 | 39.275 | -1.664 | 0.074 | 0.075 |
| 9.500 | 72 | 59.181 | -1.809 | 0.060 | 0.060 |
| 9.700 | 92 | 74.884 | -1.952 | 0.053 | 0.053 |
| 9.900 | 125 | 99.236 | -2.126 | 0.046 | 0.046 |
| 10.100 | 142 | 124.447 | -2.408 | 0.041 | 0.041 |
| 10.300 | 127 | 102.524 | -2.722 | 0.045 | 0.045 |
| 10.500 | 116 | 91.961 | -3.037 | 0.047 | 0.048 |
| 10.700 | 92 | 71.333 | -3.443 | 0.054 | 0.055 |
| 10.900 | 64 | 50.771 | -3.850 | 0.065 | 0.065 |
| 11.100 | 51 | 38.949 | -4.203 | 0.075 | 0.075 |
| 11.300 | 26 | 20.670 | -4.685 | 0.104 | 0.107 |
| 11.500 | 9 | 7.530 | -5.308 | 0.180 | 0.191 |
| 11.800 | 7 | 7.000 | -5.844 | 0.187 | 0.199 |
4.2 The IR LLF
We used the sample of 1019 galaxies selected at 857 GHz to compute the total IR luminosity function. Since the Planck data do not encompass the dust emission peak of local galaxies, which generally occurs at m, we complemented them with photometry at shorter wavelengths to estimate the IR luminosity, (8–m). At m we preferentially used the BeeP flux density derived from the IRIS map, which is missing for only 67 sources.
To better constrain the dust emission spectrum, we searched for IRAS m data. The cross-match with the IRAS Faint Source Catalog (IRAS-FSC; Moshir and et al., 1990) yielded 947 matches within 2 arcmin. Only three of these are at a separation ; we checked that they are real associations. We find six of the 72 IRAS-FSC unmatched galaxies to have counterparts in the IRAS Small Scale Structure Catalog (Helou and Walker, 1988). We retrieved IRAS flux densities from the NED at m for 12 additional sources and at m for seven more.
Overall, we find IRAS m flux densities for 31 of the 67 galaxies missing IRIS flux densities, so that only 36 lack m measurements; five of the latter have m photometry obtained by the Multiband Imaging Photometer for Spitzer (MIPS) and one more has m photometry obtained by the Infrared Space Observatory (ISO). We retrieved IRAS m photometry for 968 galaxies; seven of the remaining 54 have m MIPS photometry. Only 30 galaxies (2.9%) lack flux densities at or at shorter wavelengths than the dust emission peak.
A cross-match of the sample with the Herschel/PACS Point Source Catalog (Marton et al., 2024) yielded one match at m, 281 matches at m, and 170 matches at m. The m measurements allowed us to assess the effect of very different resolutions: the typical PACS full widths at half maximum (FWHMs) are , , and in the 70, 100, and m bands, respectively. The median ratio between the IRIS and PACS m flux densities is (the mean is 6, with a dispersion of 17.7). In this situation, we decided not to use PACS photometry. Specifically, out of the 30 galaxies lacking data at or shortward of the dust emission peak, only three have a PACS detection at 100 m. Given the severe flux discrepancies and resolution issues discussed above, we chose to omit the PACS data even for these three sources. At the same wavelength, the mean ratio of IRIS to IRAS flux densities (angular resolution 888see https://lambda.gsfc.nasa.gov/product/iras/) is 0.95 with a dispersion of 0.22.
We computed the total IR luminosity by fitting the SED of starburst galaxies by Cai et al. (2013) to these data. The only parameter was normalization.
The small number of photometric points, together with their rather large uncertainties, especially in the Planck data, did not allow us to use more parameters for the fit. To overcome this limitation, we attempted to exploit also the optical/near-IR photometry, available for almost all our sources, to take advantage of codes interpreting the full SED while ensuring the balance between the energy absorbed and re-emitted by dust. This did not work: the two data sets turned out to be incompatible, and we could not find acceptable global fits respecting the energy balance. One reason for this is the strongly different resolutions between short- and long-wavelength observations. Our galaxies are quite extended, with sizes of up to several tens of arcminutes, although most of them are unresolved by Planck (HFI beams have a FWHM of ). In contrast, much higher optical/near-IR resolution requires large and highly uncertain aperture corrections, which frequently turn out to be insufficient (a situation similar to that encountered at m). Moreover, the colors in the latter bands indicate that in most cases measurements are dominated by regions with low dust obscuration; in other words, the optical/near-IR colors are not consistent with the amount of dust obscuration necessary to account for the submm measurements. Whittam et al. (2025) reached similar conclusions in a different framework.
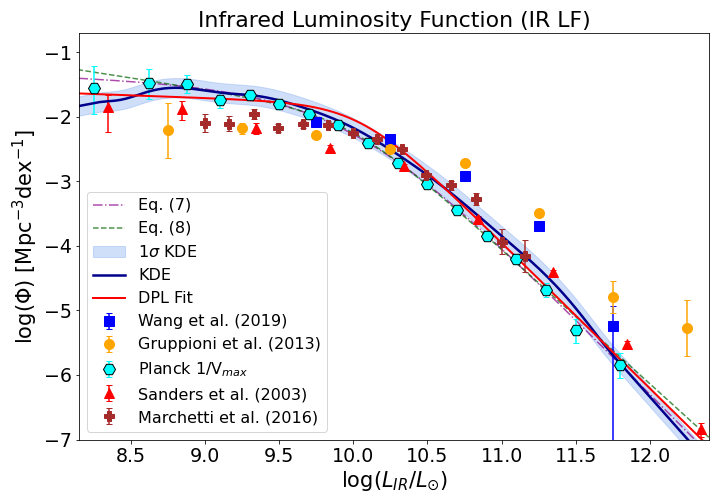
Figure 2 shows our estimates of the total IR luminosity function obtained with both the and KDE methods. The results are listed in Table 4; we computed the using the flux density at 857 GHz, the Planck frequency closest to the emission peak. Table 5 lists the best-fit values of the parameters. Again, both fits of eq. (7) and eq. (8) are similarly good.
Our IR LLF spans a luminosity range similar to that of the estimate by Sanders et al. (2003), derived from the IRAS Revised Bright Galaxy Sample, and is in reasonably good agreement with it. For the IR LLFs from Herschel surveys are flatter than both the IRAS LLF and ours. At high luminosity, the latter LLFs move from above to below those of Gruppioni et al. (2013) and Wang et al. (2019), while that of Marchetti et al. (2016) is intermediate between the IRAS LLF and ours.
The log of the local IR luminosity densities, , obtained by fitting eq. (7) and eq. (8), are 7.965 and 7.987, respectively. Our results agree well with the estimate by Marchetti et al. (2016) for the redshift range , based on the HerMES survey over an area of , . Gruppioni et al. (2013) obtained a slightly higher value, ,for a Herschel/PACS-selected sample with SPIRE data; however, this value refers to a wider redshift interval (), where evolutionary effects start to be significant.
| ) | err | err | |||
|---|---|---|---|---|---|
| 20.750 | 2 | 1.714 | -0.959 | 0.394 | 0.501 |
| 21.250 | 4 | 3.702 | -1.673 | 0.263 | 0.296 |
| 21.750 | 21 | 15.848 | -1.666 | 0.120 | 0.124 |
| 22.100 | 25 | 24.111 | -1.654 | 0.096 | 0.098 |
| 22.300 | 24 | 22.946 | -1.986 | 0.099 | 0.101 |
| 22.500 | 47 | 44.988 | -1.967 | 0.069 | 0.070 |
| 22.700 | 79 | 75.761 | -2.035 | 0.053 | 0.053 |
| 22.900 | 74 | 71.197 | -2.379 | 0.054 | 0.055 |
| 23.100 | 60 | 57.937 | -2.779 | 0.060 | 0.061 |
| 23.300 | 57 | 55.199 | -3.080 | 0.062 | 0.063 |
| 23.500 | 25 | 23.985 | -3.758 | 0.096 | 0.098 |
| 23.700 | 21 | 20.358 | -4.210 | 0.105 | 0.108 |
| 24.000 | 9 | 8.183 | -5.223 | 0.172 | 0.182 |
| 24.350 | 5 | 4.996 | -5.859 | 0.224 | 0.245 |

4.3 The 545 GHz (m) LLF
The PCCS2 90% completeness limit at 545 GHz is 555 mJy (Table 1 of Planck Collaboration XXVI, 2016). For PCCS2E the limit is almost the same (557 mJy). We selected sources at , mJy and . This initial sample contained 697 sources (540 from the PCCS2 and 157 from the PCCS2E), 484 of which (443 from the PCCS2 plus 41 from the PCCS2E) have a NED-LVS counterpart within .
We restricted our sample to Mpc and obtained 460 matches, 50 of which are at from the PCCS position. We find all the objects within to be bona fide galaxies. We used the Aladin sky atlas to inspect the sources at individually. We find that one is a planetary nebula and six reside in regions heavily contaminated by cirrus emission. The NED photometric data confirmed that these sources would not have met our detection threshold without the cirrus contribution; we therefore removed them from the sample, leaving 453 galaxies. The higher fraction of matches at compared to 857 GHz may be due to the better positional accuracy of the BeeP catalog.
We computed the LLF as described above. We present the results in Table 6 and display them in Fig. 3, where we compare them with those of Negrello et al. (2007) and Marchetti et al. (2016). The latter were computed from the HerMES survey at m. The luminosities at this wavelength were scaled down by a factor of 1.35 to convert them to 545 GHz (Maddox et al., 2018).
We list the best-fit parameters for the fits of the and KDE results in Table 2. Around the knee luminosity, , the KDE estimate slightly exceeds the estimate, perhaps due to smoothing by the bandwidth parameter.
Our results agree with earlier estimates by Negrello et al. (2013) and Marchetti et al. (2016) below , but at higher luminosities they are consistently lower. Similarly, we find a local luminosity density that is somewhat lower than that reported by Marchetti et al. (2016, see Table 3).
| err | err | ||||
|---|---|---|---|---|---|
| 21.250 | 9 | 7.581 | -1.647 | 0.179 | 0.190 |
| 21.625 | 15 | 14.642 | -1.671 | 0.126 | 0.130 |
| 21.875 | 11 | 10.375 | -2.143 | 0.151 | 0.158 |
| 22.100 | 32 | 30.652 | -1.912 | 0.085 | 0.086 |
| 22.300 | 37 | 35.599 | -2.131 | 0.078 | 0.079 |
| 22.500 | 38 | 36.578 | -2.451 | 0.077 | 0.078 |
| 22.700 | 31 | 30.114 | -2.804 | 0.085 | 0.087 |
| 22.900 | 12 | 11.817 | -3.503 | 0.141 | 0.147 |
| 23.250 | 9 | 8.060 | -4.439 | 0.173 | 0.183 |
| 24.000 | 4 | 3.094 | -6.243 | 0.290 | 0.333 |

4.4 The 353 GHz (m) LLF
According to Table 1 of Planck Collaboration XXVI (2016), the 90% completeness limits at 353 GHz are 304 mJy for PCCS2 and 311 mJy for PCCS2E. We find 888 (700 PCCS2 and 188 PCCS2E) sources with mJy, and . The cross-match with NED-LVS yielded 280 matches within 2 arcmin (242 PCCS2 and 38 PCCS2E), of which 208 are within 1 arcmin. At distances Mpc we find 179 sources within 1 arcmin and 215 within 2 arcmin. We identified eight of the latter as being dominated by nuclear radio emission and removed them from the sample. We also removed two of the matches at distances : one was not classified as a galaxy, and the other is too faint to be a credible counterpart to the Planck source.
We inspected all 27 matches with separations larger than 1 arcmin in Aladin, and find that five are not valid counterparts to Planck sources. We removed these five sources, leaving a sample of 200 galaxies.
We present our estimates of the LLF, computed as described above, in Fig. 4 and in Table 7. Table 2 lists the parameters of the analytic fits and Table 3 gives the luminosity density.
Our results improve upon those of Negrello et al. (2013) and extend to luminosities about an order of magnitude fainter than the estimates by Dunne et al. (2000) and Vlahakis et al. (2005), both based on the SCUBA Local Universe Galaxy Survey (SLUGS). There are hints of incompleteness of the SLUGS survey at .
| ) | err | err | |
|---|---|---|---|
| 6.359 | -1.647 | 0.190 | 0.179 |
| 6.734 | -1.671 | 0.130 | 0.126 |
| 6.984 | -2.143 | 0.158 | 0.151 |
| 7.209 | -1.912 | 0.086 | 0.085 |
| 7.409 | -2.131 | 0.079 | 0.078 |
| 7.609 | -2.451 | 0.078 | 0.077 |
| 7.809 | -2.804 | 0.087 | 0.085 |
| 8.009 | -3.503 | 0.147 | 0.141 |
| 8.359 | -4.439 | 0.183 | 0.173 |
| 9.109 | -6.243 | 0.333 | 0.290 |
| Model | ||||
|---|---|---|---|---|
| Eq. (7) | -1.400 | 6.973 | 0.790 | 3.437 |
| Eq. (8) | -1.854 | 7.445 | 0.093 | 2.705 |
.
4.5 The dust mass function
We computed the dust mass from the 353 GHz (m) luminosity using the formula (Hildebrand, 1983)
| (9) |
where is the dust temperature, is the dust absorption coefficient, and is the black-body function. Following Clemens et al. (2013) we adopted K. The value of is still debated. We chose , following Dunne et al. (2000), Vlahakis et al. (2005), and Beeston et al. (2018).
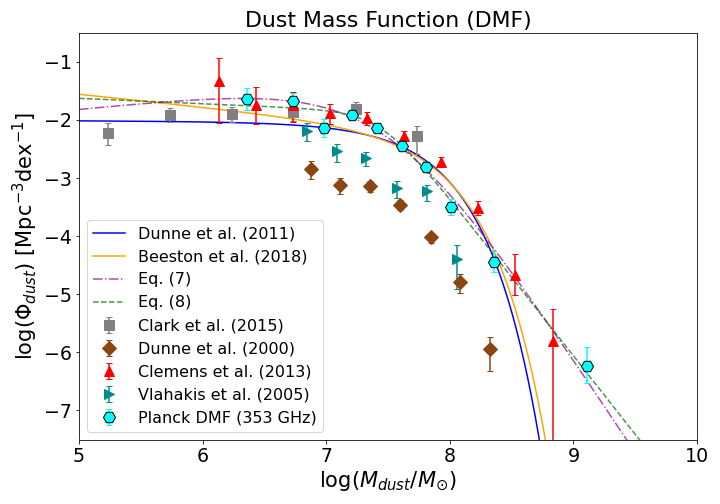
We then derived the local dust mass function (DMF) from the 353 GHz (m) LLF. We present the results in Table 8 and Fig. 5. Table 9 shows the best-fit values of the double power-law parameters (eqs. (7) and (8)).
Figure 5 shows the DMF data points derived by Dunne et al. (2000), Vlahakis et al. (2005), Clemens et al. (2013), and Clark et al. (2015) for comparison. In addition, we plotted the best-fitting Schechter functions obtained by Dunne et al. (2011) and Beeston et al. (2018), whose data points are not tabulated. We scaled all estimates to the values of the parameters used here.
Dunne et al. (2000) and Vlahakis et al. (2005) used SLUGS observations of IRAS-selected or optically-selected samples, respectively. Both papers cautioned that these selections could miss a fraction of dusty galaxies; subsequent estimates based on blind surveys confirmed this concern.
Clemens et al. (2013) derived the dust masses using the public code Multiwavelength Analysis of Galaxy Physical Properties (MAGPHYS; da Cunha et al., 2008). To account for the different dust temperatures of the sources, they computed the bivariate GHz–luminosity/dust mass function. They then obtained the local dust mass function from the LLF at GHz built by Negrello et al. (2013) using the Planck ERCSC, summing the contributions of all GHz luminosities to each dust mass bin.
Clark et al. (2015) built a sample of 42 nearby galaxies (distance in the range Mpc), extracted from the Herschel Astrophysical Terahertz Large Area Survey (H-ATLAS; Eales et al., 2010) Phase 1 catalog (Valiante et al., 2016). They derived distances from spectroscopic redshifts, correcting for bulk deviations from the Hubble flow. To estimate dust temperatures and masses they fitted the Herschel PACS and SPIRE plus the IRAS m photometry with two dust components, both represented by modified black bodies. They derived the dust mass function with the method.
Beeston et al. (2018) computed the local dust mass function with the method, applied to a sample of 15,750 galaxies in the redshift range , drawn from the H-ATLAS survey. They determined distances as in Clark et al. (2015) and obtained dust masses using the MAGPHYS package.
The DMF by Beeston et al. (2018) spans the broadest range of dust masses, extending down to . Figure 5 shows that our low-mass slope is almost identical to theirs, although our normalization is slightly higher. We differ at the highest masses where the decline of our DMF is consistent with a power-law instead of an exponential, in agreement with the findings of Clemens et al. (2013). Integrating our DMF, we obtain a local dust mass density of for the fit with eq. (7) and 5.36 with eq. (8). The corresponding densities in units of the critical density are or , respectively, which are somewhat higher than the value , found by Beeston et al. (2018).
| err | err | ||||
|---|---|---|---|---|---|
| 21.000 | 5 | 4.304 | -1.510 | 0.243 | 0.269 |
| 21.500 | 8 | 6.676 | -2.224 | 0.192 | 0.205 |
| 21.875 | 13 | 11.947 | -2.131 | 0.140 | 0.146 |
| 22.250 | 7 | 5.920 | -3.225 | 0.205 | 0.221 |

4.6 The 217 GHz (1.38 mm) LLF
At this frequency, the 90% PCCS2 completeness limit is 152 mJy, while the PCCSE limit is unclear (Planck Collaboration XXVI, 2016). There are 235 PCCS2 and 72 PCCS2E sources at and ; all have mJy. We adopted this value as the flux limit.
The cross-match with NED-LVS (2 arcmin radius) yields 42 matches within 180 Mpc for the PCCS2 sample and an additional match for the PCCS2E sample. We removed PCCS2 217 G144.03+38.39 because its flux density is heavily contaminated by cirrus. We also removed the ten sources that, after a search of NED, were found to be dominated by nuclear radio emission. Using the interacting Aladin sky atlas, we verified the associations of the remaining 33 sources with NED-LVS galaxies, including the six sources with nominal separations larger than (maximum separation ). These six sources are all very extended galaxies, with sizes larger than .
We present the derived LLF in Table 10 and Fig. 6. This figure shows that our results are in good agreement with the estimate of Negrello et al. (2013). The best-fit values of the parameters of the two power-law fits are listed in Table 2, and the corresponding local luminosity densities are given in Table 3.
5 Discussion and conclusions
The shallow Planck surveys with the HFI, with their all-sky coverage (except for a zone above and below the Galactic plane) allow us to sample the truly local (sub)mm LF up to the rarest highest luminosities, being immune to the dramatic evolutionary effects present in this spectral region. These effects are already significant at (Dunne et al., 2011; Marchetti et al., 2016), that is, over the redshift range spanned by some Herschel samples used to derive the LLF. Moreover, thanks to the large area, sampling variance due to inhomogeneities in the spatial distribution is reduced. Moreover, Planck surveys extend to frequencies GHz, where no other large-area survey exists. However, much deeper Herschel surveys can, in principle, reach fainter luminosities.
Compared with the preliminary estimates of Negrello et al. (2013), which were based on Planck ERCSC, our analysis benefits from substantially improved data. The use of full-mission maps (five HFI surveys instead of the 1.6 ERCSC surveys) and improved data processing increased the sensitivity (measured as the flux density of 90% completeness) by almost a factor of three and the corresponding number of detections by almost an order of magnitude. The reliability of the detections is also better characterized.
Equally important, the all-sky catalogs of local galaxies, HECATE and NED-LVS, have provided a powerful tool for the optical identification of Planck sources, providing redshifts for all galaxies and redshift-independent distances, whenever possible, for the nearest objects for which redshifts are not reliable distance indicators.
We computed the LLFs at 857, 545, 353, and 217 GHz (350, 550, 850, and m, respectively) with both the classical and the nonparametric KDE method. The results from both approaches are in good agreement across the entire luminosity range. This consistency confirms the robustness of the derived spatial densities and demonstrates that the empirical optimization of the KDE bandwidth parameter described in Sect. 4 successfully suppresses Poisson noise without introducing systematic smoothing biases.
Below the knee luminosity of the LLF, our results agree with those derived from Herschel surveys at 857 and 600 GHz (350 and m) and with those of Negrello et al. (2013). At higher luminosities, we find somewhat lower space densities. For Negrello et al. (2013), this discrepancy is likely caused by boosting of ERCSC flux densities below by the Eddington (1913) bias (Planck Collaboration, 2012; Herranz et al., 2013). The origin of the discrepancy with Herschel-based results is unclear. We note, however, that the LFs at 857 and 600 GHz by Marchetti et al. (2016) were derived from a sample selected at m, with the luminosities at the other frequencies inferred by SED fitting, whereas our estimates rely on samples directly selected at each specific frequency. Furthermore, the Marchetti et al. (2016) sample covers a wider redshift range (), where mild evolutionary effects might already begin to emerge (see also Dunne et al., 2011), while our study is strictly restricted to the immediate local volume ( Mpc). The multiwavelength selection framework adopted in that work, combining an -magnitude limit with flux cuts at m (MIPS) and m (Herschel), introduces additional selection effects that must be carefully modeled in the evaluation. These combined factors introduce systematic uncertainties that are difficult to quantify and may not be fully captured by the nominal statistical error bars, making a rigorous comparison of the significance of the discrepancies between the two sets of estimates challenging.
The total IR LLF, derived from the LLF at 857 GHz, is reasonably consistent with that derived from IRAS data (Sanders et al., 2003), which span a similar luminosity range. Interestingly, both estimates show a power-law decline at high luminosity, at variance with the steeper exponential (Schechter) decline generally assumed to fit Herschel-derived LFs.
The IR LFs of Gruppioni et al. (2013) and Wang et al. (2019), derived from Herschel data, are substantially higher than ours and the IRAS-based LF above . This is expected since their samples span the range –0.3 and show strong evolution, already appreciable at . Moreover, Gruppioni et al. (2013) adopted a detection limit, which makes the flux densities susceptible to flux boosting effects (Eddington 1913 bias). Below , our results are above those of Marchetti et al. (2016) and Gruppioni et al. (2013); again, the significance of the difference is difficult to assess, given the issues mentioned above.
At 353 GHz we are again consistent with Negrello et al. (2013) up to the knee luminosity, while their LLF by is somewhat higher over the following decade in luminosity. Once again, the discrepancy can be explained by the boosting of ERCSC flux densities. Above our results agree with those of Dunne et al. (2000) and Vlahakis et al. (2005), based on the pointed SLUGS observations, which show indications of incompleteness at lower luminosity. The SLUGS samples, which were IRAS or optically selected, may easily miss faint 353 GHz sources. In fact, the dust mass functions of Dunne et al. (2000) and Vlahakis et al. (2005), derived from their 353 GHz LF, are also well below those obtained by Dunne et al. (2011), Clark et al. (2015), and Beeston et al. (2018) from H-ATLAS samples. The latter estimates are in reasonably good agreement with ours, which are also derived from the 353 GHz LF. The Schechter fits of the DMF by Dunne et al. (2011) and Beeston et al. (2018) deviate from our fits at the highest dust masses, but their samples do not sample the DMF above a few times . At 217 GHz our results are in excellent agreement with Negrello et al. (2013).
Acknowledgements.
We are grateful to the anonymous referee for the accurate reading of the manuscript and many useful comments. M.B. acknowledges support from INAF under the mini-grant “A systematic search for ultra-bright high-z strongly lensed galaxies in Planck catalogues”. This paper is based on observations obtained with Planck101010http://www.esa.int/Planck, an ESA science mission with instruments and contributions directly funded by ESA Member States, NASA, and Canada. We have made use of the TOPCAT package (Taylor2005), of the “Aladin sky atlas” developed at Centre de Données astronomiques de Strasbourg (CDS), Strasbourg Observatory, France (Bonnarel et al., 2000) and of the NASA/IPAC Extragalactic Database, which is funded by the National Aeronautics and Space Administration and operated by the California Institute of Technology.References
- BASS. XXX. Distribution Functions of DR2 Eddington Ratios, Black Hole Masses, and X-Ray Luminosities. ApJS 261 (1), pp. 9. External Links: Document, 2201.05603, ADS entry Cited by: §3, footnote 4.
- GAMA/H-ATLAS: the local dust mass function and cosmic density as a function of galaxy type - a benchmark for models of galaxy evolution. MNRAS 479 (1), pp. 1077–1099. External Links: Document, 1712.07261, ADS entry Cited by: Figure 5, Figure 5, §4.5, §4.5, §4.5, §4.5, §5.
- The ALADIN interactive sky atlas. A reference tool for identification of astronomical sources. A&AS 143, pp. 33–40. External Links: Document, ADS entry Cited by: §4.1.
- Smoothed Nonparametric Estimation of the Luminosity Function for Flux-limited Samples. ApJ 416, pp. 450. External Links: Document, ADS entry Cited by: §3.
- A Hybrid Model for the Evolution of Galaxies and Active Galactic Nuclei in the Infrared. ApJ 768 (1), pp. 21. External Links: Document, 1303.2335, ADS entry Cited by: §3, §4.2.
- Herschel-ATLAS: the surprising diversity of dust-selected galaxies in the local submillimetre Universe. MNRAS 452 (1), pp. 397–430. External Links: Document, 1502.03843, ADS entry Cited by: Figure 5, Figure 5, §4.5, §4.5, §4.5, §5.
- Dust and star formation properties of a complete sample of local galaxies drawn from the Planck Early Release Compact Source Catalogue. MNRAS 433 (1), pp. 695–711. External Links: Document, 1305.1647, ADS entry Cited by: §1, Figure 5, Figure 5, §4.5, §4.5, §4.5, §4.5.
- Completeness of the NASA/IPAC Extragalactic Database (NED) Local Volume Sample. ApJS 268 (1), pp. 14. External Links: Document, 2306.06271, ADS entry Cited by: §1, §3.
- A simple model to interpret the ultraviolet, optical and infrared emission from galaxies. MNRAS 388 (4), pp. 1595–1617. External Links: Document, 0806.1020, ADS entry Cited by: §4.5.
- Herschel-ATLAS: rapid evolution of dust in galaxies over the last 5 billion years. MNRAS 417 (2), pp. 1510–1533. External Links: Document, 1012.5186, ADS entry Cited by: Figure 5, Figure 5, §4.5, §5, §5, §5.
- The SCUBA Local Universe Galaxy Survey - I. First measurements of the submillimetre luminosity and dust mass functions. MNRAS 315 (1), pp. 115–139. External Links: Document, astro-ph/0002234, ADS entry Cited by: §1, Figure 4, Figure 4, Figure 5, Figure 5, §4.4, §4.5, §4.5, §4.5, §5.
- The Herschel ATLAS. PASP 122 (891), pp. 499–515. External Links: Document, 0910.4279, ADS entry Cited by: §1, §4.5.
- BLAST: The Redshift Survey. ApJ 707 (2), pp. 1779–1808. External Links: Document, 0907.4156, ADS entry Cited by: §1.
- On a formula for correcting statistics for the effects of a known error of observation. MNRAS 73, pp. 359–360. External Links: Document, ADS entry Cited by: §5, §5.
- Confidence Limits for Small Numbers of Events in Astrophysical Data. ApJ 303, pp. 336. External Links: Document, ADS entry Cited by: §3, footnote 4.
- The Herschel PEP/HerMES luminosity function - I. Probing the evolution of PACS selected Galaxies to z ≃ 4. MNRAS 432 (1), pp. 23–52. External Links: Document, 1302.5209, ADS entry Cited by: §1, Figure 2, Figure 2, §4.2, §4.2, §5.
- Infrared Astronomical Satellite (IRAS), Catalogs and Atlases. Vol. 7. The Small Scale Structure Catalog.. Studies in Surface Science and Catalysis 7, pp. 0. External Links: ADS entry Cited by: §4.2.
- Herschel-ATLAS: Planck sources in the phase 1 fields. A&A 549, pp. A31. External Links: Document, 1204.3917, ADS entry Cited by: §5.
- The determination of cloud masses and dust characteristics from submillimetre thermal emission.. QJRAS 24, pp. 267–282. External Links: ADS entry Cited by: §4.5.
- The Heraklion Extragalactic Catalogue (HECATE): a value-added galaxy catalogue for multimessenger astrophysics. MNRAS 506 (2), pp. 1896–1915. External Links: Document, 2106.12101, ADS entry Cited by: §1, §1.
- Studies of IRAS sources at high galactic latitudes - II. Results froma redshift survey at b¿60 : distribution in depth, luminosity function, and physical nature of IRAS galaxies.. MNRAS 219, pp. 687–701. External Links: Document, ADS entry Cited by: §4.1.
- Far-Infrared Surveys of Galaxy Evolution. ARA&A 52, pp. 373–414. External Links: Document, 1403.3334, ADS entry Cited by: §1.
- The Herschel-ATLAS Data Release 2. Paper II. Catalogs of Far-infrared and Submillimeter Sources in the Fields at the South and North Galactic Poles. ApJS 236 (2), pp. 30. External Links: Document, 1712.07241, ADS entry Cited by: §4.3.
- The HerMES submillimetre local and low-redshift luminosity functions. MNRAS 456 (2), pp. 1999–2023. External Links: Document, 1511.06167, ADS entry Cited by: §1, Figure 1, Figure 1, Figure 2, Figure 2, Figure 3, Figure 3, §4.1, §4.1, §4.1, §4.2, §4.2, §4.3, §4.3, Table 3, Table 3, §5, §5, §5.
- The new Herschel/PACS Point Source Catalogue. A&A 688, pp. A203. External Links: Document, 2406.03116, ADS entry Cited by: §4.2.
- A model for the cosmological evolution of low-frequency radio sources. MNRAS 404 (1), pp. 532–544. External Links: Document, 1001.1069, ADS entry Cited by: §4.1.
- IRIS: A New Generation of IRAS Maps. ApJS 157 (2), pp. 302–323. External Links: Document, astro-ph/0412216, ADS entry Cited by: §1.
- IRAS Faint Source Catalogue, version 2.0.. IRAS Faint Source Catalogue, pp. 0. External Links: ADS entry Cited by: §4.2.
- The local luminosity function of star-forming galaxies derived from the Planck Early Release Compact Source Catalogue. MNRAS 429 (2), pp. 1309–1323. External Links: Document, 1211.3832, ADS entry Cited by: §1, §1, §1, Figure 1, Figure 1, Figure 3, Figure 3, Figure 4, Figure 4, Figure 6, Figure 6, §4.1, §4.1, §4.3, §4.4, §4.5, §4.6, §5, §5, §5.
- Astrophysical and cosmological information from large-scale submillimetre surveys of extragalactic sources. MNRAS 377 (4), pp. 1557–1568. External Links: Document, astro-ph/0703210, ADS entry Cited by: §4.3.
- The Herschel Multi-tiered Extragalactic Survey: HerMES. MNRAS 424 (3), pp. 1614–1635. External Links: Document, 1203.2562, ADS entry Cited by: §1.
- Planck intermediate results. LV. Reliability and thermal properties of high-frequency sources in the Second Planck Catalogue of Compact Sources. A&A 644, pp. A99. External Links: Document, 2009.06333, ADS entry Cited by: §1, §1, §2.
- Planck 2018 results. VI. Cosmological parameters. A&A 641, pp. A6. External Links: Document, 1807.06209, ADS entry Cited by: §1.
- Planck early results. VII. The Early Release Compact Source Catalogue. A&A 536, pp. A7. External Links: Document, 1101.2041, ADS entry Cited by: §1.
- Planck 2015 results. XXVI. The Second Planck Catalogue of Compact Sources. A&A 594, pp. A26. External Links: Document, 1507.02058, ADS entry Cited by: §1, §1, §2, §2, §2, §4.3, §4.4, §4.6.
- Planck 2013 results. XXVIII. The Planck Catalogue of Compact Sources. A&A 571, pp. A28. External Links: Document, 1303.5088, ADS entry Cited by: §1.
- Explanatory Supplement to the Planck1,2 Early Release Compact Source Catalogue. Technical report ESA. Cited by: §5.
- The IRAS Revised Bright Galaxy Sample. AJ 126 (4), pp. 1607–1664. External Links: Document, astro-ph/0306263, ADS entry Cited by: Figure 2, Figure 2, §4.2, §5.
- The 60-mu.m and far-infrared luminosity functions of IRAS galaxies.. MNRAS 242, pp. 318–337. External Links: Document, ADS entry Cited by: §4.1.
- Space Distribution and Luminosity Functions of Quasi-Stellar Radio Sources. ApJ 151, pp. 393. External Links: Document, ADS entry Cited by: §3.
- Multivariate density estimation: theory, practice, and visualization. John Wiley & Sons, New York. Cited by: §3.
- Density estimation for statistics and data analysis. Monographs on Statistics and Applied Probability, Chapman and Hall, London. Cited by: §3.
- Redshift-independent Distances in the NASA/IPAC Extragalactic Database: Methodology, Content, and Use of NED-D. AJ 153 (1), pp. 37. External Links: Document, 1612.09263, ADS entry Cited by: §1.
- The HerMES SPIRE submillimeter local luminosity function. A&A 518, pp. L20. External Links: Document, 1005.2187, ADS entry Cited by: §1.
- The Herschel-ATLAS data release 1 - I. Maps, catalogues and number counts. MNRAS 462 (3), pp. 3146–3179. External Links: Document, 1606.09615, ADS entry Cited by: §4.5.
- The SCUBA Local Universe Galaxy Survey - III. Dust along the Hubble sequence. MNRAS 364 (4), pp. 1253–1285. External Links: Document, astro-ph/0510768, ADS entry Cited by: §1, Figure 4, Figure 4, Figure 5, Figure 5, §4.4, §4.5, §4.5, §4.5, §5.
- Multi-wavelength de-blended Herschel view of the statistical properties of dusty star-forming galaxies across cosmic time. A&A 624, pp. A98. External Links: Document, 1902.09172, ADS entry Cited by: Figure 2, Figure 2, §4.2, §5.
- Evidence for inverse Compton scattering in high-redshift Lyman-break galaxies. MNRAS 543 (1), pp. 507–517. External Links: Document, 2509.06677, ADS entry Cited by: §4.2.
- A Flexible Method for Estimating Luminosity Functions via Kernel Density Estimation. ApJS 248 (1), pp. 1. External Links: Document, 2003.13373, ADS entry Cited by: §3.
- A Flexible Method for Estimating Luminosity Functions via Kernel Density Estimation. II. Generalization and Python Implementation. ApJS 260 (1), pp. 10. External Links: Document, 2203.06700, ADS entry Cited by: §3, §3.