Outflows in super-Eddington quasars drive clumpy circumgalactic medium and extended H nebulae at
Abstract
The discovery of gargantuan black holes with masses exceeding a billion solar masses at suggests rapid black hole growth and significant energy input into their host galaxies in the early Universe. With JWST probing previously unseen phases of the interstellar (ISM) and circumgalactic (CGM) medium around quasars, detailed theoretical studies can now be directly confronted with observations. We use zoom-in simulations of a massive protocluster at , employing both the fiducial fable galaxy formation model and modifications that allow earlier black hole seeding and mildly super-Eddington accretion. The central quasar remains Compton-thick throughout most of its evolution, with the obscuration arising from the ISM of its compact host galaxy. The onset of sufficiently strong quasar feedback drives a ‘blow-out’ episode, clearing out escape channels for ionizing radiation and leaving the central engine unobscured. This leads to a complete transformation of the CGM, whereby powerful, metal-enriched outflows produce a population of cold, fast, neutral clumps, significantly increasing the covering fraction of neutral hydrogen in the host halo. Radiative transfer calculations performed with a new ray-tracing code show that the CGM responds to quasar activity through the formation of H nebulae, whose size and luminosity increase with the strength of quasar feedback and decrease with obscuration level. Enhanced early black hole growth thus fundamentally reshapes the ISM and CGM of quasars, leaving clear observable signatures in their obscuration, neutral hydrogen distribution, and extended H emission.
keywords:
methods: numerical – galaxies: formation – galaxies: high-redshift – quasars: supermassive black holes.1 Introduction
The existence of supermassive black holes (SMBHs) is well-established, as they are ubiquitously found in the centre of local galaxies (see, e.g., Genzel et al., 2000; Ghez et al., 2000; Event Horizon Telescope Collaboration et al., 2019, 2022; GRAVITY Collaboration et al., 2022). Over the last decades, observations have accumulated strong evidence linking the properties of SMBHs with several properties of their galactic hosts. These are reflected in so-called scaling relations between, e.g., black hole and stellar masses, and velocity dispersion (e.g., Magorrian et al., 1998; Kormendy and Ho, 2013; McConnell and Ma, 2013; Reines and Volonteri, 2015; Greene et al., 2020). These connections may suggest co-evolution between SMBHs and the galaxies in which they reside, mediated by a variety of physical processes such as gas accretion, galaxy mergers, and feedback (e.g., Haehnelt et al., 1998; Silk and Rees, 1998; King, 2003; Di Matteo et al., 2005; Sijacki et al., 2007; Hopkins et al., 2008; Fabian, 2012; King and Pounds, 2015; Somerville_Davé_2015; Alexander et al., 2025).
The observed population of active galactic nuclei (AGN) are thought to be powered by accretion of gas onto SMBHs, with quasars (or QSOs) corresponding to the brightest and most extreme manifestation of AGN (e.g., Schmidt, 1963; Salpeter, 1964; Lynden-Bell, 1969; Rees, 1984; Inayoshi et al., 2020; Wang et al., 2021; Fan et al., 2023). Their exceptional luminosities (–) make them detectable out to very early cosmic times. Over 300 quasars have been discovered at redshifts across the entire electromagnetic spectrum with a variety of instruments (see Inayoshi et al., 2020; Fan et al., 2023; Bañados, 2026, for comprehensive reviews). The masses of the accreting SMBHs powering such quasars are usually inferred by converting the widths of broad emission lines in their spectra into masses using the so-called single-epoch virial relations (e.g., Peterson et al., 2004; Vestergaard and Peterson, 2006; Vestergaard and Osmer, 2009). At , the C iv and Mg ii lines have been extensively used in the past (e.g., Schindler et al., 2020; Farina et al., 2022; Mazzucchelli et al., 2023), while the advent of the James Webb Space Telescope (JWST; Gardner et al., 2006, 2023) has enabled the use of the more reliable H and H lines (e.g., Kokorev et al., 2023; Marshall et al., 2023; Yang et al., 2023b; Maiolino et al., 2024a; Juodžbalis et al., 2026). These observations confirm the implication that quasars are powered by SMBHs with masses in excess of M☉.
The very existence of this population of likely extremely massive SMBHs is surprising, as it is non-trivial to explain how such objects could assemble within the first billion years of the Universe (e.g., Turner, 1991; Haiman and Loeb, 2001; Inayoshi et al., 2020). Massive black hole seeds (–) may provide a ‘head-start’ (see, e.g., Sijacki et al., 2009; Volonteri et al., 2021), though the subsequent growth of the black hole has to proceed at close to the Eddington rate for a significant fraction of a Hubble time (e.g., Wang et al., 2021; Maiolino et al., 2024b) or, alternatively, through multiple bursts of super-Eddington accretion (e.g., Volonteri and Rees, 2005; Madau et al., 2014; Volonteri et al., 2015; Inayoshi et al., 2020; Bennett et al., 2024). Even if black holes are seeded massive, the rapid assembly of high-redshift SMBHs requires sustained, high accretion rates despite feedback and/or gas supply limitations to be able to explain the detections of luminous quasars.
Puzzlingly, recent measurements indicate that the luminous lifetimes of quasars are often remarkably short (e.g., Eilers et al., 2024). Hints of short quasar lifetimes are provided by quasar proximity zones, which constrain total luminous timescales through the response of the surrounding intergalactic medium (IGM) to its net absorption of ionizing photons (Eilers et al., 2018, 2020, 2021; Davies et al., 2020; Morey et al., 2021; Ďurovčíková et al., 2024, 2026). This observational data may support a picture in which a large majority of the accretion onto SMBHs is primarily obscured or inherently radiatively inefficient (e.g., Hopkins et al., 2005; Ramos Almeida and Ricci, 2017; Hickox and Alexander, 2018; Vito et al., 2018; Circosta et al., 2019; Davies et al., 2019; D’Amato et al., 2020; Gilli et al., 2022; Satyavolu et al., 2023; Yang et al., 2023a; Bulichi et al., 2026; Leung et al., 2026). Cosmological, hydrodynamical simulations of galaxy formation and black hole growth indeed show that high ( per cent) obscuration fractions are achieved in the special environments of high-redshift quasars, providing further support for obscured SMBH growth in the early Universe (e.g., Costa et al., 2018b; Trebitsch et al., 2019; Ni et al., 2020; Bennett et al., 2024).
Theoretical models also predict that accretion releases enormous amounts of energy. The resulting radiative and mechanical feedback should power large-scale outflows that disrupt the interstellar (ISM) and circumgalactic (CGM) media of haloes hosting quasars (e.g., Sijacki et al., 2009; Fabian, 2012; Costa et al., 2014, 2015, 2018b, 2020, 2022; King and Pounds, 2015; Bieri et al., 2017; Barai et al., 2018; Smidt et al., 2018; Zhu et al., 2022; Ward et al., 2024), while simultaneously setting the local scaling relations as a result of the co-evolution between SMBHs and their host galaxies (e.g., Haehnelt et al., 1998; Silk and Rees, 1998; Sijacki et al., 2007; Volonteri and Reines, 2016; Fiore et al., 2017; Valentini et al., 2021). While detections of broad absorption-line features suggest that small-scale, vigorous () winds capable of launching galactic outflows exist in the nuclei of quasar host galaxies (e.g., Meyer et al., 2019; Choi et al., 2020; Schindler et al., 2020; Wang et al., 2021; Yang et al., 2021; Bischetti et al., 2022, 2023), observational evidence for the latter has proven controversial. Historically, Maiolino et al. (2012) and Cicone et al. (2015) were the first to report on an extended () outflow traced by [C ii] 158 emission in a quasar, with further evidence for outflows corroborated by stacked analyses of high-redshift QSOs (Bischetti et al., 2019; Stanley et al., 2019). Other studies including similar targets, however, refuted these results and found no strong evidence for outflows (Decarli et al., 2018; Novak et al., 2020). Most recently, several studies leveraging new Atacama Large Millimetre Array (ALMA) data as well as the capabilities of JWST have revealed that outflows are ubiquitous around high-redshift quasars, and may be more extreme than seen in their counterparts in the local Universe (e.g., Marshall et al., 2023; Yang et al., 2023b; Bischetti et al., 2025; Spilker et al., 2025; Liu et al., 2026).
Another source of ambiguity is the environment of quasars. In the concordance CDM cosmology, the brightest high-redshift quasars should reside in the most massive haloes that lie within overdensities of the cosmic density field, effectively tracing the first large-scale structure in the Universe (e.g., Efstathiou and Rees, 1988; Volonteri and Rees, 2006; Latif and Ferrara, 2016; Inayoshi et al., 2020). These regions rapidly assemble into dark matter haloes with exceptionally high masses ( at ), where both frequent mergers and sustained, ‘smooth’ cosmic gas inflows facilitate the growth of the first SMBHs by accretion (e.g., Li et al., 2007; Sijacki et al., 2009; Di Matteo et al., 2012; Costa et al., 2014). In fact, this is practically a requirement for simulations to grow SMBHs on par with the most massive objects observed in our Universe (e.g., Bennett et al., 2024; Costa, 2024). A direct observational prediction of this hypothesis is the presence of an anomalously large quantity of companion galaxies in the vicinity of high-redshift quasars (Muñoz and Loeb, 2008; Tinker et al., 2010). Despite sustained and targeted efforts to search for these companions in the supposedly overdense environments of luminous quasars, no clear consensus has been reached. Mixed and contradictory results are reported in the literature, wherein some quasar fields appear overdense while others are not, and may even be underdense (e.g., Bañados et al., 2013; Mazzucchelli et al., 2017; Meyer et al., 2022; Kashino et al., 2023; Wang et al., 2023; Eilers et al., 2024).
A better understanding of quasar environments, lifetimes, and feedback processes could potentially be attained by probing the CGM, which forms the primary reservoir for the gas flows that regulate SMBH growth (see Tumlinson et al., 2017; Faucher-Giguère and Oh, 2023, for reviews). As a result, a variety of observational signatures spanning the electromagnetic spectrum, accessible with both current and upcoming facilities, could be used to constrain the physical properties of quasars and their gaseous haloes at high redshift (see, e.g., Costa et al., 2022; Bennett et al., 2024, and references therein). For example, extended X-ray absorption and emission, and Sunyaev-Zeldovich effect (SZ; Sunyaev and Zeldovich, 1970, 1972, 1980) maps can help constrain the strength of AGN feedback (e.g., Nandra et al., 2013; Brownson et al., 2019; Di Mascolo et al., 2023; Bogdán et al., 2023). The CGM of high-redshift quasars is also now being targeted by JWST in the rest-optical and rest-NIR, supplemented by new data from ALMA and the Multi Unit Spectroscopic Explorer (MUSE) at the VLT, to offer new probes of the ISM, dust, outflows and their interplay with the extended gaseous halo (e.g., Ding et al., 2023; Galbiati et al., 2023; Tripodi et al., 2023; Bischetti et al., 2025; Liu et al., 2025; Valentino et al., 2026; Ďurovčíková et al., 2026; Wolf et al., 2026). Additionally, Euclid (Euclid Collaboration et al., 2022) is accelerating the discovery of high-redshift quasars, which will be crucial to probe a greater variety of objects and environments (e.g., Euclid Collaboration et al., 2019; Belladitta et al., 2026; Yang et al., 2026).
In the last decade, multiple models have been used to simulate black hole formation, accretion and feedback in a fully cosmological context, largely matching local constraints despite varying numerical implementations (e.g., Habouzit et al., 2021, 2022b; Feldmann and Bieri, 2026). At high redshift, however, these models disagree and predict fundamentally different physical pictures (Habouzit et al., 2022a). To better resolve black hole feeding and its impact on quasar hosts, the ‘zoom-in’ technique is often used, targeting the rarest, most massive overdensities found in large dark-matter-only simulations and resimulating them at higher resolution. While these works have successfully produced multiple SMBHs with at (e.g., Sijacki et al., 2009; Costa et al., 2014; Lupi et al., 2019; Valentini et al., 2021; Bhowmick et al., 2022, 2026; Zhu et al., 2022; Bennett et al., 2024; Huško et al., 2025; Quadri et al., 2025), it remains challenging for numerical simulations to form the most extreme SMBHs exceeding at , as estimated for the record-holder J010013.02+280225.8 (Wu et al., 2015). Where achieved, simulations disagree on the exact formation mechanisms: in some cases, this can only be achieved by turning AGN feedback off (Valentini et al., 2021), while in others, very steep requirements for the halo () and seed () masses must be invoked (Zhu et al., 2022).
Theoretical predictions for the growth mechanisms and impact on the gaseous halo of ultramassive SMBHs at high redshift thus remain scarce. In Bennett et al. (2024), small modifications to the fable galaxy formation model (Henden et al., 2018; Bigwood et al., 2025), such as earlier seeding of black holes and mildly super-Eddington accretion, enabled the formation and growth of a gargantuan object at , whose progenitors are also consistent with the brightest quasars at (e.g., Larson et al., 2023; Maiolino et al., 2024b). It was noted that feedback from the super-Eddington accreting SMBH was much stronger, launching powerful metal-enriched outflows that significantly perturbed the CGM of the host halo. However, the impact of the quasar radiation field was not explicitly studied. The aim of this paper is to provide an in-depth study and characterisation of the outflows launched by super-Eddington accreting SMBHs and the response of the CGM of the host haloes by modelling the radiation from quasar phases in post-processing. This regime is now widely-discussed, as super-Eddington accretion and the related outflows may explain recent JWST findings (Hu et al., 2022; Madau and Haardt, 2024; Pacucci and Narayan, 2024; Tortosa et al., 2024; Saccheo et al., 2025; Suh et al., 2025; Inayoshi et al., 2025; Inayoshi and Maiolino, 2025; Chaikin et al., 2026; Madau, 2026). By connecting these scales to the obscuration stage of the central engine, we aim to gain a better understanding of the relation between black hole feeding and phenomena on scales of the host halo, and to provide new constraints for interpreting current and upcoming observations of the CGM of quasars.
This paper is organized in the following manner. In Section 2, we introduce the simulations used in this work and present our methodology for performing the radiative transfer simulations with a novel ray-tracing code. In Section 3, we present our findings, focusing firstly on characterising the outflows found in the simulations before showing the outcome of the radiative transfer calculations. We discuss our results in the context of other works in Section 4, and finally summarise our work and present our conclusions in Section 5.
2 Methodology
2.1 Simulations
In this paper, we analyse the suite of three zoom-in simulations introduced in Bennett et al. (2024). The simulations are performed with the cosmological, hydrodynamical code arepo (Springel, 2010; Pakmor et al., 2016; Weinberger et al., 2020). The code follows gas hydrodynamics on a moving mesh constructed from the Voronoi tessellation of a discrete number of mesh-generating points. To identify bound structures in the simulations, we use an on-the-fly friends-of-friends (Davis et al., 1985) and subfind (Springel et al., 2001; Dolag et al., 2009) algorithms. We briefly review the setup of the zoom-in simulations here and refer the reader to the previous paper for additional details.
The zoom-in simulations target the largest halo from the Millennium cosmological box at redshift (Springel et al., 2005a), with varying models of baryonic physics. At , its virial mass111We use the spherical overdensity criterion to compute virial quantities, such that refers to the mass contained within , the radius within which the average density is 200 times the critical density of the universe at a given redshift. is and virial radius is . While the descendants of such haloes can range from galaxy groups to rich clusters (Angulo et al., 2012), the halo targeted by our simulations evolves into a rich galaxy cluster with by . The mass resolution of the gas and stellar component is , and for dark matter. The comoving softening lengths are and adaptive, such that the mass-weighted mean radii of cells at a distance of from the halo centre are , and they increase to at from the centre. We assume cosmological parameters are consistent with constraints set by WMAP (Spergel et al., 2007), namely: , , , and . Throughout the rest of the paper, units are given in proper (physical) coordinates. For further details on the setup of the zoom-in simulations, see Sijacki et al. (2009); Bennett et al. (2024).
The simulations analysed here use varying flavours of the fable galaxy formation model (Henden et al., 2018; Bigwood et al., 2025), which itself builds upon the Illustris model (Vogelsberger et al., 2013, 2014; Genel et al., 2014; Torrey et al., 2014; Sijacki et al., 2015). The models for gas cooling, star formation and stellar feedback are identical to those in fable for all three simulations.
We use a similar nomenclature to Bennett et al. (2024), wherein the three simulations in our suite are labelled ‘NoAGN’, ‘fable’ and ‘fable-sE’ (formerly ‘Reference’). In the NoAGN run, all physics related to black holes (as introduced in the next paragraphs) is excluded, while in the fable and fable-sE runs, respectively, the fiducial and modified black hole physics are used (see Bennett et al., 2024, for details).
In the fiducial model, black holes are seeded with a mass at the position of the gravitational potential minimum of every dark matter halo once its mass exceeds . Black hole particles are modelled as collisionless sink particles that can grow through mergers with other black holes and gas accretion. The latter is parametrized by an Eddington-limited Bondi-Hoyle-Lyttleton-like model (Bondi and Hoyle, 1944; Bondi, 1952) wherein
| (1) |
where is the black hole accretion rate, is the gravitational constant, is the mass of the black hole, and are, respectively, the density and sound speed of the surrounding gas (evaluated from kernel-averaging over the 32 nearest gas cells in the simulation), and is a numerical boost factor. The latter is introduced to artificially boost the accretion of gas onto black holes, which in reality should reside in a denser, multi-phase environment that cannot be captured when the ISM is not explicitly resolved (see e.g. Springel et al., 2005b, for discussions); fable employs a boost factor .
The luminosity of the AGN is defined as where is the radiative efficiency. In fable, this value is set to (Soltan, 1982; Rees, 1984; Yu and Tremaine, 2002; Shankar et al., 2004; Henden et al., 2018). The fiducial model assumes the accretion rate is capped at the Eddington limit due to this radiation output, which (assuming ionized hydrogen) is given by
| (2) |
with the proton mass, the speed of light and the Thomson scattering cross-section. We define the Eddington ratio as . Finally, an additional ‘pressure criterion’ modulates the accretion rate, such that is reduced when large () SMBHs are embedded in low-density background gas to avoid unphysical inflation of hot, diffuse bubbles (Vogelsberger et al., 2013).
Feedback from AGN is treated via a dual-mode model depending on the normalised black hole accretion rate . At , the luminous quasar mode operates, wherein a fraction of the luminosity powering the bright quasar is isotropically injected as thermal energy in the surroundings of the black hole. The energy injection rate is thus
| (3) |
To mitigate artificial cooling losses in the neighbouring gas, a duty cycle on the quasar mode is invoked, such that the feedback energy is stored for Myr and then injected into the gas in a single feedback event (see Henden et al., 2018, for further details). At , the AGN operates in the (radiatively inefficient) radio mode, in which hot bubbles are injected into the gas at a distance of from the black hole as if inflated by AGN jets, following Sijacki et al. (2007). Bubbles are periodically injected when the gain in mass exceeds with mechanical heating efficiency , such that
| (4) |
Fiducially, we use the following values: and .
Due to insufficient numerical resolution, it is very challenging for cosmological simulations to resolve dynamical friction correctly. To avoid numerical wandering of black holes, they are kept at the centre of their host halo by repositioning them at the gravitational potential minimum of particles within their smoothing length at each active time-step (Springel et al., 2005b). Furthermore, black hole mergers are assumed to happen instantaneously when two black holes are within each other’s smoothing lengths. These effects likely combine to produce overly efficient and overabundant mergers in these models (see, e.g., Buttigieg et al., 2025, for a detailed discussion), though we note that a majority of the final black hole mass comes from accretion.
The fable-sE simulation introduces several modifications to the physics of black holes from the fiducial fable model to promote early black hole growth. We refer the reader to Bennett et al. (2024, section 2.3) for details. We emphasize that these simulations were not designed to ‘correctly’ grow extremely massive SMBHs, but rather to offer a “plausible” pathway to their assembly and to study the impact that such objects would have on their surroundings.
In fable-sE, black hole seeds are placed in smaller mass haloes with , and we allow for mildly super-Eddington accretion of gas, with up from the Eddington-limited case of fable (with ). Additionally, we slightly reduce the feedback coupling efficiency in fable-sE to , which encourages earlier accretion and means that the stronger feedback, as we show later, is actually produced with lower coupling. In combination, these modifications produce an SMBH with the gargantuan mass of at for the fable-sE run, one order of magnitude higher than the already large of the fable run. Detailed discussions on the black hole mass and its evolution in these simulations, including the effect of the host assembly history, are presented in Bennett et al. (2024).
2.2 Tracing neutral hydrogen
The purpose of the present study is to characterize, in post-processing, the ionization state of hydrogen when exposed to radiation from a quasar. Gas in and around the quasar host halo is also irradiated by stars and background sources, which we do not explicitly model in the radiative transfer simulations. In this work, we thus make the approximation that gas is in ionization equilibrium with a homogeneous, redshift-dependent ionizing ultraviolet background (UVB) from Puchwein et al. (2019). From the output of the hydrodynamical simulations, we compute the predicted ionization state of hydrogen and use this as the initial conditions for the radiative transfer simulations. We present a detailed summary of this approach in Appendix A.
One important subtlety of this procedure concerns the star-forming gas, whose temperature is defined by the imposed pressure of the ‘effective’ polytropic equation of state (Springel and Hernquist, 2003) and is not representative of a physical temperature. For this reason, we manually impose for star-forming gas throughout this paper, including for the recombination and collisional ionization states used in the radiative transfer and to compute emission properties (see, e.g., Rahmati et al., 2013).
We make use of the covering fraction to quantify the distribution of neutral hydrogen around the simulated halo. We mainly consider strong H i absorbers, specifically Damped Lyman- systems (DLAs) with cm-2. The cumulative H i covering fraction is defined as
| (5) |
where is the area covered by lines of sight above the DLA threshold within the field of view defined by . This is equivalent to the probability of finding DLAs within a circular aperture of radius (see Faucher-Giguère et al., 2015, 2016; Rahmati et al., 2015; Tortora et al., 2024).
From the ionization state of the gas, we compute the H luminosity and surface brightness to produce mock images. For every gas cell in the simulations, we compute the H emissivity given as
| (6) |
where is the energy of an H photon (6564.6 Å), is the effective Case B recombination emissivity coefficient for the H line (Pequignot et al., 1991), and and are the electron and ionized hydrogen number densities, respectively. To obtain the H luminosity, we simply project the emissivity along the line of sight; for the surface brightness, we also account for cosmological dimming () and the pixel size in arcsec2.
2.3 Radiative transfer in post-processing
We post-process the simulations with a new radiative transfer tool, VoroLite, designed specifically to perform ray-tracing on a Voronoi grid. Rays are cast from a single source into arepo cells within a chosen spherical volume centred on the source. The number of rays is set such that every cell is guaranteed to be traversed by at least one ray. Each ray is directed from the source towards the centre of a target cell, defining a unique propagation direction through the mesh. The rays are then grouped into equal-area angular bins using a HEALPix tessellation (Górski et al., 2005), allowing a weight to be assigned to each ray such that the total emitted luminosity is conserved and distributed isotropically.
As rays propagate through the Voronoi mesh, neighbour-to-neighbour traversal is performed by calculating the distance along the ray direction to the interfaces separating each adjacent arepo cell. The interface corresponding to the smallest positive distance determines the next cell crossed by the ray, following the strategy presented in Camps et al. (2013). The traversed distance and corresponding column density are accumulated cell-by-cell until the ray exits the spherical domain. Note that since the gas distribution is fixed during post-processing, the geometric ray paths are computed only once at the beginning of the calculation and subsequently reused throughout the radiative transfer step.
The resulting ray trajectories are then used to perform the radiative transfer calculation. Column densities are accumulated cell-by-cell along each ray and subsequently used to evaluate optical depths and compute the attenuation of the photon flux. Since the ionization state, and therefore the optical depth, can evolve significantly during a time step, evaluating photon attenuation using the ionization fractions from the beginning of the time step can lead to substantial operator-splitting errors. To prevent this effect, the radiative transfer calculation is first performed using the ionization fractions from the previous time-step, after which a predicted time-averaged ionization state is computed, as in Mellema et al. (2006), and subsequently used in a second radiative transfer update prior to the final photo-chemistry step.
The converged photon absorption rates are used to evolve the ionization state of hydrogen. The hydrogen ionization fraction, , evolves according to
| (7) |
where is the photoionization rate, is the collisional ionization coefficient, is the Case B recombination coefficient, and is the electron density. The recombination and collisional ionization coefficients are calculated using the fitting formulae presented in Hui and Gnedin (1997).
Integrating this equation explicitly requires extremely short time-steps. We follow the approach outlined in Mellema et al. (2006), whereby the solver computes the equilibrium ionization fraction and corresponding equilibrium timescale in each cell. Under the assumption that the ionization and recombination rates remain constant during a time-step, the ionization equation admits an analytic solution describing exponential relaxation toward the local equilibrium ionization state over the equilibrium timescale. The ionization state is therefore updated analytically over each time-step by relaxing the previous solution towards the equilibrium state. This strategy improves numerical stability for stiff ionization problems and avoids the restrictive time-step requirements associated with explicit integration schemes.
We adopt an infinite-speed-of-light approximation within the illuminated region (see, e.g., Cantalupo and Porciani, 2011). A causal propagation condition is additionally imposed by suppressing photon absorption in cells whose light-travel time from the source exceeds the elapsed simulation time, following Abel and Wandelt (2002). This approximation is expected to remain accurate once ionization fronts evolve at velocities well below the speed of light.
Photo-heated gas is expected to respond hydrodynamically (e.g., Ledos et al., 2026), expanding and thereby modifying its density structure. Since the radiative transfer is performed in post-processing, however, the gas density and temperature remain fixed while evolving the ionization state and radiation field. We therefore neglect photo-heating and assume the radiation source emits an ionizing flux above the hydrogen ionization threshold (). The approach adopted here is therefore primarily intended to identify and characterize the spatial distribution of ionized gas associated with H ii regions. We focus here on relative trends and environmental dependencies rather than precise quantitative predictions for nebular emission.

2.4 Modelling of AGN emission
To simulate a bright quasar phase, we place an ionizing source at the position of the most massive black hole in the simulations at a given snapshot and explicitly track the ionization state of every cell as photons propagate outward. As outlined in Section 2.3, the radiative transfer is performed in post-processing, such that the arepo mesh and properties of gas cells (e.g., density and temperature) remain fixed. To compute the ionizing flux of the source, we convert the bolometric luminosity predicted from the hydrodynamic simulations into an ionizing photon rate for neutral hydrogen , assuming some form for the intrinsic spectral energy distribution (SED) of the source:
| (8) |
where is the spectral luminosity density of the source in the frequency range and (the SED, such that ) and is the hydrogen ionization threshold. Generally, the SED for AGN is a complex function spanning the entire electromagnetic spectrum, whose shape is a direct reflection of the multi-scale, multi-temperature nature of accreting SMBHs. It thus also depends on the properties of the black holes, such as mass and accretion rate.
In this work, we adopt a simplified approach wherein we associate an SED with the central SMBH in the simulations from standard models found in the literature. There exist several such models that can be both physically and empirically motivated (e.g., Collinson et al., 2015; Castelló-Mor et al., 2016; Hickox and Alexander, 2018; Shen et al., 2020; Temple et al., 2021; Su et al., 2026). Throughout the paper, we use the physically motivated standard qsosed222Note that we do not consider the super-Eddington extension agnslim (Kubota and Done, 2019), as the latter only produces marked changes for , which is above the maximal accretion rate in our simulations. model (Kubota and Done, 2018), and provide further details of this methodology in Appendix B.
The ionization cross-section used for the radiative transfer is computed as the luminosity-weighted average over the H-ionizing range (e.g., Rosdahl et al., 2013; Bieri et al., 2017):
| (9) |
where is the frequency-dependent H i photoionization cross-section from Verner et al. (1996). In principle, this expression should be evaluated for every SED. However, we find that varying does not significantly alter our results, and we thus choose for consistency and simplicity to use the median value for the range of spectra adopted in our work, which is .

2.5 Attenuation by dust
The radiative transfer simulations performed in this work do not explicitly account for the effects of dust. The predicted surface brightness maps are computed directly from the output of the simulations and correspond to the intrinsic (unattenuated) emission. To mimic the effects of dust attenuation and obtain attenuated surface brightness maps, we make the simplified approximation wherein the intrinsic emission is attenuated by a dust screen placed in front of the maps. Specifically, from the intrinsic flux we obtain the attenuated flux:
| (10) |
where with the absorption cross section for and the projected dust column density. We use333See the table provided at: https://www.astro.princeton.edu/~draine/dust/extcurvs/kext_albedo_WD_MW_3.1_60_D03.all (Draine, 2003). To estimate the dust mass, we make the approximation that dust traces metal-rich and cool gas, specifically that dust makes up 15 per cent of the metal mass of cold ( + star-forming) gas (as in Di Mascia et al., 2021; Vito et al., 2022; Bennett et al., 2024). This represents a pessimistic estimate for the level of attenuation, such that the results model a worst-case scenario for our approximations, and we leave a more thorough analysis of the effects of dust for future work.

3 Results
3.1 Overview
We present a visual inspection of the suite of simulations analysed in this paper in Fig. 1. This includes the density, temperature, radial velocity and metallicity of gas found in a box within of the halo centre.
The quantities presented are density-weighted projection maps. To obtain the map for a variable (e.g., temperature, radial velocity, pressure, metallicity, etc), we perform a projection by tracing through the mesh and incorporating the gradient along mesh cells; for every pixel on the final grid, we compute
| (11) |
where the integration is done by collecting cell contributions along the chosen line of sight. Column density maps, instead, are obtained by directly projecting the density, e.g., . For panels A, B and C, we display the metallicity-weighted projected density, which is obtained via the following method:
| (12) |
We choose to represent the density in this way to more clearly highlight the difference in the CGM of the fable-sE halo with those of the NoAGN and fable runs.
All simulations show a prominent filamentary structure that connects the central halo to the IGM and cosmic web. These filaments are cold and the gas within them flows towards the centre, fuelling star formation in the galaxy and feeding the SMBH at its core. The rest of the diffuse halo makes up a hot atmosphere of gas, as supernova and AGN feedback eject gas which thermalizes within the host’s CGM. On the smallest scales, we see that the NoAGN simulation produces a very dense, structured, and disc-like central galaxy, whereas the simulations with black hole physics have a disturbed core showing prominent cavities as a result of AGN feedback. On the other hand, although there is a massive black hole in the centre of the fable halo, its CGM visually appears very similar to the one found in the NoAGN run, though there are a number of quantitative differences which we highlight in the next section. This is to be contrasted with the CGM in the fable-sE run, where clear structural differences arise from the very strong feedback from its central quasar. Significant outflows completely alter the halo atmosphere, which is generally hotter with faster gas () than in the other runs (see also Bennett et al., 2024). The filaments are visibly perturbed and fragmented, and the outer () regions of the halo are filled with clumps of dense gas.
These clumps are also found to have markedly different physical properties from the rest of the halo. As highlighted in panels D and E from Fig. 1, clumps are metal-enriched, preferentially outflowing, and are cooler than their surroundings. The presence of cool and dense gas clumps in the outer halo has clear consequences on observational properties of the fable-sE run, which we discuss in Section 3.4.
3.2 AGN obscuration with VoroLite
In this section, we zoom into the central parts of the halo to study the obscuration of the black hole.
We compute the total hydrogen column density () in two different ways. For the first method, we construct a grid of equally-spaced rays on the unit sphere using HEALPix (Górski et al., 2005, with NSIDE=32), further subdivided into 1024 logarithmically-spaced radial bins, from the centre out to . The column density is then computed by assigning to each voxel in the grid the density of the nearest simulation cell and numerically integrating radially, assuming piecewise-constant values along each ray (as in Bennett et al., 2024). For the second method, we sample viewing angles isotropically and explicitly trace through the arepo mesh with VoroLite to compute the column density (see Section 2.3) from the centre until . We have explicitly checked that extending up to 50 kpc does not significantly alter our conclusions for either method, as most of the dense gas is confined to the centre. Note that, for the fable(-sE) runs, the centre is defined as the position of the central SMBH, while for the NoAGN run, we use the halo centre determined from the Subfind halo finder.
Fig. 2 shows the time evolution of the hydrogen column density within . In the NoAGN run, the column density gradually increases with time as large quantities of gas are funnelled from the cosmic web and accumulate in the centre, which cannot be pushed out and regulated by supernova feedback alone. By , most lines of sight appear Compton-thick, highlighting an extreme level of obscuration. This is to be contrasted with simulations with black hole physics, which, on average, have lower values of (up to at ) while exhibiting significant time variation due to AGN feedback, which redistributes and ejects gas from the central galaxy. Nonetheless, the simulations predict that the black hole undergoes obscured growth for much of its history, which we discuss in more detail below.
In the lower panel of Fig. 2, we compare the approximation used in Bennett et al. (2024) against tracing through the mesh with VoroLite. While their original conclusions are largely unchanged, we find that accurately ray-tracing through the arepo mesh generally yields higher column densities, with differences of the order of per cent, and up to per cent during certain evolutionary phases.
In Fig. 3, we present a detailed view of various obscuration stages for the central SMBH in the fable-sE simulation. The upper panel reproduces the curve shown in Fig. 2, including, for alternate snapshots, the full range (min-max) of column densities as probed by 20000 isotropically sampled sightlines. In the lower panels, we show density-weighted radial velocity (upper row) and surface density (lower row) maps of the central at three epochs with distinctive obscuration: A (, obscured), B (, in transition) and C (, unobscured). We also provide a zoomed-in view of the surface density of the inner , with the position of the central black hole shown by a black dot (for visual purposes only). In every inset, the dashed circle represents the physical extent within which the rays are computed (5 kpc).
When obscured (phase A), we see large quantities of inflowing gas surrounding a very dense nucleus, which completely obscures the central engine. At later times (phase B), the gas is distributed irregularly, showing cavities and various gas streams extending outward. In this phase, AGN feedback drives cycles of small blow-out events in the centre, which clear out some gas while leaving some of it behind. This results in a highly anisotropic distribution of gas, wherein some lines of sight are cleared while others remain obscured. In fact, the width of the distribution of column density along the various sightlines remains large, with column densities that cover dex from one sightline to another. In particular, there are always some lines of sight that are Compton thick (cf. the grey dashed vertical line), which would signal heavily obscured accretion down to . By , the immediate surroundings of the black hole are dominated by strong outflows, which have removed gas and significantly lowered the gas density, leaving the engine entirely unobscured (phase C).
3.3 Hot and cold outflowing gas


We now focus on the outflow properties in the simulations. We adopt a similar convention as introduced in Costa et al. (2015), and distinguish two phases: ‘hot gas’ with and ‘cold gas’ with , further including star-forming gas. Additionally, we select outflowing gas using a velocity threshold of , to search for AGN-driven outflows. The broad velocity distribution of gas accelerated by AGN makes it challenging to isolate outflows due to AGN feedback from motions caused by stellar feedback or gravity (Costa et al., 2015; Ward et al., 2024). We verified that using a more conservative velocity cut of deepens the differences between the fable-sE and the other simulations, strengthening our conclusions.
In Fig. 4, we show the total outflowing mass within for each simulation, distinguishing hot (solid curves) and cold gas (dashed curves), as a function of redshift. Different colours represent the different simulations. Outflows have substantial cold and hot components at all times, though hot outflows always dominate the mass budget. The outflowing masses are initially comparable, but significantly diverge at , after which the hot component dominates by over one order of magnitude and the cold gas is much less abundant. We find relatively small differences in the outflow masses between the NoAGN and fable simulations, with a slight increase in the hot outflowing gas for in fable, suggesting that feedback from the massive black hole in fable can affect the CGM, though it is delayed and less powerful. This is to be contrasted with the fable-sE simulation, wherein there is more hot and cold outflowing gas at all times, indicating that this simulation produces systematically stronger feedback. We also note that the presence of cold gas in outflows is only ubiquitous in the fable-sE simulation. At in the fable-sE run, the repeated effect of small-scale feedback injection by the AGN, as discussed in Section 3.2, culminates in a strong blow-out event. This results in a massive () and sustained () cold gas outflow that sweeps through the halo, approximately one dex more massive than in the other simulations.
We investigate the radial extent and kinematic properties of the outflowing gas in Fig. 5. The panels show histograms of the mass of outflowing gas binned by radial velocity. From left to right, we show results for NoAGN, fable, and fable-sE. As in Fig. 4, we separate hot and cold phases, shown in red and blue, respectively. Different line styles show the distributions obtained within spheres of increasing radius . Signatures of AGN feedback are evident in both fable and fable-sE, where hot gas is ejected to exceptionally high velocities (). We also see striking differences in the properties of the cold outflowing gas in the fable-sE run compared to the other two. There are large quantities () of cold gas reaching far into the CGM () and IGM (up to ), whereas the majority of cold gas in the NoAGN and fable simulations remains in the central galaxy and is confined to the inner halo (). Additionally, cold gas in fable-sE is very fast, with a significant amount () with , reaching up to .

We now analyse the properties of the hot phase to understand whether it can efficiently cool to give rise to the significant cold component we find in the outflows (Costa et al., 2015). Outflow cooling is expected in regions where the cooling time is shorter than the flow time. We define the cooling time , where is the internal energy, is the gas density and is the net cooling rate; and the flow time is , where is the radial position and is the radial velocity. In Fig. 6, we show histograms of the outflowing gas mass binned by radial velocity for the different simulations (columns) and as a function of redshift (decreasing, from top to bottom). The cold gas is indicated by line-filled histograms, whereas the distribution of hot gas is colour-coded by the density-weighted ratio of cooling to flow time . Cooling of the hot outflowing component occurs when this ratio is , shown in bluish hues.
The kinematics of both hot and cold gas for the fable and fable-sE runs differ from the NoAGN simulation at all redshifts. At higher redshifts (), a large fraction of the hot outflow is in the rapid cooling regime (bluish hues), which explains why the masses of the two components are initially similar. However, the hot gas cannot cool as efficiently at later times, thus explaining why there is more hot than cold gas at lower redshifts. At , we see that there are large quantities of hot gas with short cooling times only in the fable-sE run. We identify this as the primary mechanism for the formation and sustenance of fast, cold gas in the outflows in fable-sE, which is only ubiquitous in that simulation and can at times reach extreme velocities (). In particular, we note such rapidly-cooling hot gas is not found in the NoAGN or the fable simulations, thus explaining how the dex difference in outflowing cold mass arises (cf. Fig. 4). By , there is very little gas that can efficiently cool in the hot outflows of the fable-sE simulation, and we see that the cold gas masses are again similar across the suite.


We continue the investigation into the properties of the outflows in the simulations by describing their interaction with the CGM. In Fig. 7, we show maps of the projected density-weighted normalised pressure ratio of gas, , for the three simulations (columns) and at various redshifts (decreasing, from top to bottom row). This ratio quantifies the dominant source of pressure, differentiating between ram pressure () and thermal pressure (). It can be used to identify regions where gas is dynamically compressed (e.g., by outflows driven by AGN feedback) and to inform on the dominant form of energy (kinetic versus thermal) and Mach number of the gas (e.g., Bourne and Sijacki, 2017).
At high redshift (, upper row), all simulations look qualitatively very similar, with gas on the largest scales being ram pressure-dominated in the IGM and across the filaments which feed gas into the central halo. Along the filaments, the rapidly accreting cold gas is likely supersonic and ram-pressure dominated as it penetrates through the halo down to the central galaxy, while in the halo we see a mixture of diffuse hot halo gas thermalised approximately at the virial temperature (e.g., Birnboim and Dekel, 2003) and outflowing, pressure-dominated gas. In the second row for the fable-sE run, the maps show a clear ram pressure-dominated gas region, highlighted with an arrow, growing from the centre and extending outwards. This coincides exactly with a strong blowout event, which happens around . By , there is a remarkable difference between the fable-sE and other simulations, whereby the gas is ram pressure-dominated in the entire halo. We directly attribute this to the outflows launched from the centre of the halo by the more massive black hole in this simulation. Gas along the filaments is disrupted as they are being shattered, and the gas in the diffuse halo is shocked by the material launched by the AGN.
Specifically, the highlighted gas clumps in Fig. 1 spatially correlate with regions in the diffuse halo that are strongly ram pressure-dominated. This indicates that the formation of cool gas follows from interactions between the AGN-driven outflows and gas in the CGM. This is consistent with detailed simulations of the interaction between AGN winds and a clumpy ISM, which found that the existence and survival of cold gas is linked to the formation of cold clouds by radiative cooling entrained within a faster, hot phase (see, e.g., Gronke and Oh, 2018; Fielding and Bryan, 2022; Jennings et al., 2023; Ward et al., 2024, 2025; Gronke and E. Schneider, 2026). In a cosmological setting, the efficient cooling of gas is attributed to supernovae and AGN feedback working in tandem, wherein the former pre-enriches the CGM and IGM with metals that lead to efficient cooling as it interacts with the shocked hot gas launched by the latter (Costa et al., 2015; Biernacki et al., 2017).
3.4 The ionization state of the CGM
In this section, we inspect the response of the CGM to the radiative activity of the central SMBH in the simulations by considering the ionization state of neutral hydrogen H i.
3.4.1 Neutral hydrogen in ionization equilibrium with the UVB
To begin with, we consider the situation in which the gas is in ionization equilibrium with a metagalactic UVB in the absence of quasar radiation. For this investigation, the properties of the gas obtained directly from the hydrodynamical simulations are sufficient, as outlined in Section 2 and Appendix A. We investigate the effects of the quasar radiation with additional radiative transfer simulations in the following Section 3.4.2.
We first provide a visual inspection of simulations at in Fig. 8. The upper row shows the ionization state of hydrogen for each simulation in the suite. The majority of the hot, diffuse gas in the halo is fully ionized, while cold, dense gas found in cosmic filaments and in gas clumps is neutral. In the fable-sE run, these clumps are more abundant and cover more lines of sight. In the lower row, we show a bivariate projection to simultaneously trace the velocity (green hues for inflowing and red hues for outflowing gas) and the column density of neutral hydrogen (higher brightness translates to higher column). Along lines of sight with , the column density is very high (), with a large fraction of sightlines in DLA systems with cm-2 (highlighted as white contours). The neutral gas clumps populate the CGM of the halo in fable-sE, resulting in multiple lines of sight covered by high column densities, which are almost entirely found in the outflows (orange/red hues). These are not present in either the NoAGN or fable runs, highlighting that it is a consequence of the strong AGN feedback in the fable-sE simulation driven by the early assembly of an extremely massive black hole.

We thus see a connection between the strength of outflows originating from AGN feedback and the H i covering fraction. This is related to the blow-out in fable-sE, during which large quantities of dense, cold and neutral gas (clumps) are expelled, intercepting more lines of sight out to . For any given radius , the covering fraction of neutral hydrogen is expected to increase as the clumps fill the area, then reach a peak and finally decrease once the clumps have left the region. Naturally, the timing and exact value for these changes will depend on the chosen impact parameter within which the covering fraction is evaluated.
We investigate the variation of the DLA covering fraction in Fig. 9. We compare 444We have checked that these conclusions are not affected by choosing kpc at , where most of the difference is found, see Fig. 5. for DLAs versus the cumulative energy injected by the accreting black hole. In the ordinate, we show , the difference in the covering fraction within 50 kpc between the NoAGN and the fable and fable-sE runs, respectively. In the abscissa, we show , which corresponds to the difference in injected energy by the black hole from the beginning of the blow-out phase in fable-sE . We show the evolution of both quantities for the fable and fable-sE simulations with coloured tracks. The time evolution is indicated by the transparency of the lines, starting from (lighter colours) down to (darker colours). We also use markers to help match the same snapshots for the simulations.
Focusing first on fable, we note very little difference in the DLA covering fraction from the NoAGN run at all times, peaking at around . The large quantities of energy injected by the accreting black hole do not result in outflows which quantitatively distinguish the H i content in its CGM from that of a halo without any black hole. For the fable-sE run, we note that at (marker pointing up and to the right) there is already around one dex more injected energy by the central SMBH than in fable, and a steady rise in . The disruption caused by the SMBH is then clearly visible as the enhancement of the covering fraction within 50 kpc reaches a maximum of at , during the blow-out phase. We also show the DLA covering fraction value within 50 kpc at that time in the figure. The enhancement corresponds to a per cent increase with respect to the NoAGN covering fraction of DLAs, which can be attributed to the presence of cold, dense clumps of neutral gas which cover more sightlines. As noted previously, this is a transient phenomenon, as the blow-out phase ejects gas for Myr; by the end of the simulation (), there is a noticeable but more modest enhancement () as most clumps reach kpc 555We verified that the conclusions are not dependent on the chosen line of sight (Tortora et al., 2024; Gelli et al., 2025), as we find enhancements of per cent and per cent along two further orthogonal projection axes for the fable-sE run at ..

The enhancement in the quantity of neutral gas is a result of strong outflows launched by AGN feedback, which may not be connected to the instantaneous activity of the central engine. To quantify this, we compare a measure of outflow strength with a measure of the black hole’s instantaneous activity. For the former we choose the kinetic energy outflow rate of hot gas at the virial radius and for the latter we choose the instantaneous thermal feedback energy injected by the SMBH in quasar mode accretion . The kinetic outflow rate is computed by selecting all hot, outflowing gas within a shell at with thickness kpc, and summing up the contribution of each cell (as in Koudmani et al., 2021):
| (13) |
while the thermal feedback energy is proportional to the bolometric luminosity (or, equivalently, accretion rate ), see equation (3).
We show the evolution of both quantities as a function of time in Fig. 10. For the injected feedback energy , the lines are computed from the value of bolometric luminosity computed by taking a rolling mean of width 1000 time-steps around each snapshot. There is also significant scatter, due to large variations in accretion rate from one time-step to another, which we display with hulls indicating a +0.5/-1 dex variation in (Bennett et al., 2024). The time evolution is indicated by the transparency of the lines, starting at down to , corresponding to the final snapshot of the simulations. We use markers to match snapshots for the simulations, with the same values as in Fig. 9. The two quantities are initially correlated, with increased energy injection from feedback causing stronger outflows, as signalled by the increased kinetic outflow rate measured at the virial radius. This is likely the case because, at higher redshift, the virial radius is smaller, thus causing the outflow crossing time to also be short. We see that the kinetic outflow rate can evolve rapidly or more slowly depending on the cosmic time and simulation, but significantly increases after some time in fable-sE. The kinetic outflow rate and injected feedback energy are also decoupled at later times. This is particularly the case for the fable-sE run, in which we see that the feedback energy varies rapidly by dex as a result of decreased accretion from self-regulation, while the kinetic outflow rate remains high. For the fable run, both quantities stagnate at later times.
The feedback energy injection rate thus does not correlate very well with stronger outflows as measured, for instance, with the kinetic energy outflow rate. In particular, at , the former is higher in the fable run, even though the outflows are stronger in fable-sE. Our simulations clearly show that instantaneous AGN activity cannot be linked to the presence of sustained outflows further out into the halo ( kpc at ). Instead, outflows are the result of cumulative energy injection by the accreting SMBH at the centre of the halo, which disturbs and expels gas in its vicinity and creates channels out of which large outflows may escape after some time.
Additionally, we caution that there is significant scatter in the abscissa of Fig. 10, because of very large and rapid variations in the instantaneous accretion rate and bolometric luminosity of the black holes in the fable and fable-sE simulations. These rapid variations should be interpreted cautiously, as detailed modelling of gas accretion through a non-steady accretion disc is ultimately needed to robustly quantify and interpret the likely variability. We thus generally caution against directly comparing and correlating the instantaneous activity of the accreting SMBH with the presence of sustained outflows.
3.4.2 The effects of quasar radiation
In this section, we present the results of radiative transfer simulations to assess the effects of quasar radiation in post-processing. Here, the ionizing photon rate is kept constant for the duration of the radiative transfer, and we leave the study of time-dependent lightcurves for future work. We focus our attention on two comparisons: across the suite of simulations at , and at three key obscuration stages in fable-sE.

We show the effects of performing the radiative transfer simulations using the same ionizing luminosity in the different simulations of our suite at in Fig. 11. Each column shows one of the simulations and the different rows show the neutral hydrogen fraction, neutral hydrogen column density and H surface brightness. The chosen constant ionizing luminosity is s-1. This roughly corresponds to the ionizing photon production rate of a typical quasar assuming the qsosed family of AGN spectra (Kubota and Done, 2018). While there is no accreting black hole in the NoAGN run, we also post-process this simulation, assuming the same luminous source is placed at the centre of the halo, to assess the effect of pre-processing by AGN feedback on the escape of radiation. The simulations are run for a total time of , which we find to be sufficiently long for the radiative transfer simulations to reach photoionization equilibrium.


The ionization state of the CGM is distinct for the different simulations. In NoAGN, the high column densities of gas in the centre ( cm-2) shield much of the outgoing radiation, leaving most of the neutral gas in the halo untouched. The radiation only escapes through limited lines of sight, and the resulting H maps are relatively faint, with only some (filamentary) gas illuminated. In the simulations with black holes, the cumulative effect of AGN feedback reduces central column densities and clears out channels through which the ionizing radiation can escape. A much larger portion of the halo and cosmic filaments is ionized, leading to extended emission in H. Focusing on fable-sE, the H emission is much more diffuse and reveals the disrupted morphology of gas in the halo. The fragmented filaments and gas clumps are illuminated by the central quasar and become partially ionized, which allows them to produce emission and contribute to nebular emission. The activity and strength of AGN feedback is thus closely linked to the distribution and extent of emission and the response of the CGM.
In Fig. 12, we provide a visual overview of the radiative transfer simulations at three distinct obscuration stages for the fable-sE run, previously selected based on the median column density of gas in the central 5 kpc surrounding the black hole (see Fig. 3). Here, we use the equivalent-constant value of that would produce the same total ionizing rate over the quasar period, i.e.:
| (14) |
where is the time-dependent ionizing rate, corresponds to the time of the snapshot that is being post-processed, and is the duration of the quasar phase. is obtained from the black hole mass and accretion rate after converting the bolometric luminosity using spectra from the qsosed model (see Appendix B). Specifically, the constant ionizing rates used here are: , , and . Each row of Fig 12 shows the neutral hydrogen fraction, neutral hydrogen column density and H surface brightness for ‘obscured’, ‘in transition’ and ‘unobscured’ phases.
At (upper row of Fig. 12), the quasar is heavily obscured and enshrouded by very dense gas, with a median hydrogen column density cm-2, and a significant fraction of the halo is neutral. After an extended bright quasar phase lasting at , the halo is not strongly affected by the radiation, and we only see H emission along one direction. This can be explained by the column density varying by several orders of magnitude along different lines of sight, such that some radiation can escape the galaxy, but only along a very narrow solid angle. During that phase, the central engine could not be detected and would have little radiative impact on the surrounding gaseous halo.
During a transitional stage at (middle row of Fig. 12), significant gas accretion flow obscures the central black hole, while AGN feedback is clearing out lower-density channels out of which radiation can escape. In fact, some of the radiation escapes out to the IGM () and partially ionizes some of the filaments, which contribute to emission in that is much more extended than when the central engine is obscured. Nonetheless, the majority of the emission is concentrated in the central region that is immediately irradiated by the quasar. We also note that the propagation of radiation, as traced by the emission, remains anisotropic, given that feedback from the AGN also operates anisotropically along the directions of least resistance (Costa et al., 2014).
The unobscured stage at (lower row of Fig. 12) is characterised by the lowest central hydrogen column densities ( cm-2) and the smallest scatter across different lines of sight. The continuous and sustained AGN feedback of fable-sE has ejected most of the gas from the centre, so that the radiation can easily escape and photoionize the entire halo. Some structures, e.g. a ‘blob’ in the centre-right, remain shielded from the radiation, while most of the gas is ionized by the quasar. We see extended and clumpy emission in , which reflects the structure of gas in fable-sE following repeated outflow episodes from strong AGN feedback.
In Fig 13, we show annulus-averaged radial profiles of surface brightness for the three obscuration stages of the fable-sE run, obtained from the maps in Fig. 12. To assess the impact of the chosen line of sight, we include three orthogonal projections. We also show the predicted profiles assuming that the intrinsic emission is attenuated by a dust screen (see Section 2 for details). We include recent observations from the BEES survey (Ďurovčíková et al., 2026) in the rightmost panel. The sample consists of five bright quasars (–), four of which have detections of nebular emission and one does not. We display the surface brightness profiles of each detection after converting measured angular offsets to physical kpc, assuming the quasars are at . For two of the quasars, the profiles do not extend to the outermost radial bins, attributed to shorter lifetimes, while the two other quasars extend to ; see details in Ďurovčíková et al. (2026). We include the noise level and FOV for the NIRSpec IFU as labelled on the figure.
We see that the slope of the surface brightness profiles is less steep as the quasar becomes unobscured, consistent with what is inferred from the maps. For the obscured stage (left panel), the central surface brightness is high in the centre and rapidly drops off below detection levels, decreasing to by . During the transitional stage (middle panel), the profile reaches this value at . When the quasar is unobscured (right panel), the surface brightness profile is bright and remains above this threshold out to . One caveat of this analysis, however, is that we compare the different obscuration stages at different cosmic times. In particular, the central black hole, the galaxy and the host halo significantly grow between and , and some of the differences in the surface brightness profiles may arise from this evolution. One would have to compare the obscured and unobscured stages at the same time (e.g., ) to more quantitatively disentangle these effects, though we note that this cannot be self-consistently achieved with only one object.
The simulated profiles are generally in agreement with observations from the BEES quasars. The quasars with shorter lifetimes and smaller observed surface brightness radial extent almost overlap with the profiles for the unobscured quasar in fable-sE. For the quasars with more extended profiles, the simulations predict slightly lower surface brightness, likely because the resolution of the simulations or the ISM modelling starts to impact how well smaller substructures that are likely to be illuminated are modelled (e.g., Bennett et al., 2026).
The level of attenuation by dust also depends strongly on the obscuration stage. It is systematically higher when the quasar is obscured and systematically lower when it is unobscured. In the transitional stage, we note that there is a lot of variation from one viewing angle to another, which is consistent with Fig. 3 wherein some lines of sight are heavily obscured while others are not. Additionally, the attenuation mostly affects the central () surface brightness while the outer parts are largely unchanged. In fact, the regions where attenuation is strongest are observationally inaccessible due to PSF residuals dominating within – at (Ďurovčíková et al., 2026).
4 Discussion
In this section, we discuss the results obtained in this paper and outline various caveats of the simulations that are relevant to this work.
4.1 The effect of different SED models for quasar emission
Recent works suggest that the SED of super-Eddington accreting SMBHs could differ from that of standard quasars, which may explain some peculiar properties of JWST-detected high-redshift AGN (such as their intrinsic X-ray weakness, e.g., Madau and Haardt, 2024; Pacucci and Narayan, 2024; Inayoshi et al., 2025; Trinca et al., 2026). To tentatively explore this issue, we compare the predicted H i ionizing photon rate for a black hole accreting at for the qsosed model and for spectra from Trinca et al. (2026). We find that the Trinca et al. (2026) model produces fewer ionizing photons, around 26–32 per cent of that predicted by qsosed for the same black hole mass and accretion rate. We simulated a quasar phase lasting at and find that this difference in ionizing rates predicted from varying SED models leads to small but systematic differences in surface brightness profiles. Specifically, the total luminosity produced with the Trinca et al. (2026) model is around 64–70 per cent of the total luminosity produced with qsosed. While this represents only a modest difference, we anticipate that higher ionization lines will be affected more significantly than (which mostly depends on the optical luminosity that is very similar across models), which future work should address, along with modelling of dust and time-varying light curves in the radiative transfer, to more accurately capture the physics of emission during bright quasar phases.
4.2 Emission line nebulae as probes of high-redshift quasar activity
High-redshift quasar lifetimes and duty cycles inferred from proximity zones are extremely short (–), challenging the paradigm wherein accretion feeds the black hole and directly illuminates the surrounding gas, instead requiring strong obscuration and/or perturbation from line of sight effects. There have been alternative attempts to probe quasar lifetimes and past line of sight obscuration at by measuring the imprints of the quasar’s ionizing radiation in the transverse direction, which should power extended emission-line nebulae (e.g., Heckman et al., 1991; Liu et al., 2013). Ďurovčíková et al. (2025) search for extended nebulae around quasars and find that the independent measurements agree, though the resonant nature of the line renders its interpretation more complex (Costa et al., 2022). More robust measurements come from rest-frame optical emission lines such as or [O iii], which JWST is now targeting (e.g., Liu et al., 2025; Ďurovčíková et al., 2026; Wolf et al., 2026), confirming the existence of quasars with short lifetimes () and providing further empirical support for obscured growth in the early Universe.
The results obtained in this work highlight that the central engine remains undetected and goes through obscured growth for most of its lifetime (see Fig. 3). We further show that nebular emission directly probes the obscuration stage of the accreting SMBH, with profiles remaining centrally concentrated and dropping off steeply when heavily obscured, even after a sustained bright quasar phase lasting around . While the nebular emission shown in the left panel of Fig. 13 could be observationally attributed to short-lived quasar lifetimes, we rather find that it is associated with a period of intense accretion and radiation output that is heavily obscured. Such constant ‘lightbulb’ scenarios, however, are unlikely to be realistic because quasar light curves show significant variability. Nonetheless, Satyavolu et al. (2023) show that quasars with small duty cycle () and short active periods () can reconcile measurements of both small and large proximity zones assuming that much of the black hole’s growth is obscured. Future radiative transfer simulations using realistic light curves from the simulations will enable us to study the effect of quasar variability (whose luminosity may vary rapidly by 1–2 dex) on lifetime estimates and provide further theoretical support for obscured growth and short but bright radiative phases in high-redshift quasars.
4.3 Gas clumps in the CGM of fable-sE
In this work, we find that large-scale outflows launched by strong AGN feedback from super-Eddington accreting SMBHs significantly perturb and transform the CGM of the quasar host halo at . We show that radiatively efficient accretion episodes can probe the obscuration stage and/or feedback strength of the central engine, as gas is generally more clumpy in fable-sE, leading to the formation of a brighter and more extended nebula.
The clumpiness of the halo is a result of multiple processes that stem from the interaction between AGN-driven outflows and gas in the CGM, including efficient cooling of hot, metal-enriched outflows and shattering of infalling cosmic filaments into several substructures. There remain several exciting open questions concerning the detailed properties of the gas clumps in fable-sE. For instance, the lifetime and eventual fate of these clumps remain uncertain. These systems may also form stars and become ‘fleeing’ sites for star formation outside of the main galaxy, which may be counterparts to the “cosmic wallflowers” stellar clusters discussed in van Donkelaar et al. (2026). We provide a detailed investigation into the properties of the gas clumps in fable-sE in future work (van Donkelaar et al. in prep.).
4.4 Modelling limitations
4.4.1 Physics of the ISM
One serious limitation of this study, shared with many other similar works, is the modelling of the (unresolved) ISM, which is approximated via an ‘effective’ equation of state (Springel and Hernquist, 2003). A more realistic treatment of the ISM would account for cold, dense, neutral and star-forming clumps embedded in the ambient warm, ionized medium. This could have a major impact on the growth and feedback of black holes, as they would couple differently with multi-phase gas compared to the current subgrid modelling (e.g., Wagner et al., 2012, 2013). This would also affect the radiative transfer simulations. Here, we manually set , such that star-forming/ISM gas cells are almost entirely neutral and comprise a dense neutral cocoon inside of which the quasar resides. The quasar’s radiation would naturally couple differently to a multi-phase ISM, further affecting its propagation out into the CGM and IGM. Given the resolution and modelling assumptions presented here, we do not attempt a more complex approach. We note that recent works have included a model for the multiphase ISM (e.g., Lupi et al., 2019, 2022, 2024; Trebitsch et al., 2021; Sanati et al., 2025; Quadri et al., 2025), enabling a more detailed assessment of the impact of AGN feedback and radiation at high redshift which future work should address.
4.4.2 Dust physics
The simulations performed in this work do not explicitly track dust; instead, we assume that dust is traced by cool, metal-enriched gas (as in Bennett et al., 2024) where appropriate. This represents another caveat of this work, because dust regulates much of the evolution of the ISM and directly affects observational predictions (see detailed discussions in McKinnon et al., 2017; Byun et al., 2025; Rodríguez Montero et al., 2026). Furthermore, we do not model the direct effects of radiation pressure on dusty gas, which is predicted to be an important channel of AGN feedback capable of launching galactic-scale outflows and regulating star formation already at (e.g., Fabian, 1999; Murray et al., 2005; Ishibashi and Fabian, 2015; Thompson et al., 2015; Bieri et al., 2017; Costa et al., 2018a, b). This could affect the interplay between the AGN and surrounding gas, as well as the propagation and properties of large-scale outflows, but would require including a detailed dust model and on-the-fly radiative transfer.
Additionally, we do not include dust in the radiative transfer simulations in post-processing, which we plan to model in future work. Under the adopted assumptions, however, including further attenuation by dust in the radiative transfer would accentuate and further strengthen our conclusions: in the obscured stage, the gas cocoon would shield the quasar even more and potentially block all of the escaping radiation; in the transitional stage, the anisotropy of the gas distribution caused by AGN feedback would be more important, and the escaping radiation would be more directional; finally, when the quasar is unobscured, there is not enough gas to strongly attenuate the emitted radiation in the centre. To mimic the effects of dust on the observability of the emission following a quasar episode, we attenuate the profiles assuming that a dust screen is placed in front of the emission. While the central profiles are significantly attenuated, the outer edges are not affected. Furthermore, most of the attenuation remains observationally inaccessible with, e.g., JWST because the central regions are PSF-dominated (Ďurovčíková et al., 2026). Finally, we caution that our estimates for the attenuation are pessimistic and that realistic profiles are likely not as attenuated.
4.4.3 Numerical resolution
Previous work has shown that increased spatial and mass resolution may dramatically alter CGM structure on small scales (e.g., Hummels et al., 2019; van de Voort et al., 2019; Ramesh and Nelson, 2024). This manifests as an increase in the number of small-scale clouds (e.g., Ramesh et al., 2026) and a greater quantity of cool gas condensing out of the CGM (e.g., van de Voort et al., 2019; Bennett and Sijacki, 2020; Lucchini et al., 2026) with higher resolution. In our simulations, the limited resolution significantly affects the formation and survival of dense structures in the CGM. This specifically impacts the number, properties and structure of gas clumps, as we cannot track their fragmentation and collapse into finer sub-kpc-scale substructures, and the impact they have on the observational tracers used in this work (e.g., H i covering fraction and nebular emission; see also Bennett et al., 2026, van Donkelaar et al. in prep., for further discussions).
4.4.4 Self-consistent modelling of radiative effects
In this study, we have quantified the radiative output of high-redshift quasars in post-processing, representing an improvement in the modelling of the physics of SMBHs in numerical simulations and offering new avenues for the detectability and observational diagnostics of AGN feedback. However, this approach is not self-consistent because the radiation and hydrodynamics do not directly co-evolve (e.g., Ledos et al., 2026). Instead, properly investigating this would require re-running the simulations, including the effects of radiation on-the-fly, which is beyond the scope of the current paper. Another caveat of the present study is the lack of radiation from stars which may contribute to the ionization of the CGM; instead, we have opted to model gas as being in equilibrium with a metagalactic UVB, and leave the addition of stellar radiation in the radiative transfer calculations to future work.
There are multiple recent works from the literature that include modelling of radiative effects on-the-fly for high-redshift AGN in differing ways (Lupi et al., 2019; Kannan et al., 2022; Bulichi et al., 2025; Quadri et al., 2025; Sanati et al., 2025; Shen et al., 2026; Zier et al., 2026). For instance, while both the thesan (Kannan et al., 2022) and Lumina (Bulichi et al., 2025; Shen et al., 2026; Zier et al., 2026) projects employ the same sub-grid ISM model from Springel and Hernquist (2003), also adopted in our work, they vary in the implementation of radiative effects depending on the target of the study. In the former, non-equilibrium cooling below the effective equation of state is allowed as star-forming gas is coupled to the radiation, which results in a departure from the black hole model on which it was calibrated. In contrast, the latter models a transparent ISM in which star-forming gas is decoupled from radiation, adhering more faithfully to the IllustrisTNG (Weinberger et al., 2017; Pillepich et al., 2018) implementation and matching the relations on which it was calibrated. The authors note, however, that the Lumina model should be recalibrated to match the constraints of rare high-redshift quasars (Bulichi et al., 2025).
One of the major limitations hindering simulations with radiative transfer on-the-fly remains the unresolved nature of the ISM, because it underpins the interactions between sources (stellar and AGN) and the escape of radiation on extremely small scales, thereby significantly affecting predictive accuracy (e.g., Smith et al., 2022). Current and future higher-resolution simulations, including more sophisticated modelling of the multi-phase ISM and non-equilibrium coupling between matter and radiation (e.g., Weinberger and Hernquist, 2023; Bollati and Weinberger, 2026), will be essential to advance our physical understanding of these mechanisms. For example, this approach has been adopted in the serra simulations (Pallottini et al., 2022) and for the re-runs in thesan-zoom (Kannan et al., 2025) to more realistically interpret new ALMA and JWST observations, albeit without the inclusion of black hole physics at the moment.
5 Summary and conclusions
We have analysed a suite of three zoom-in simulations targeting the most massive halo from the Millennium cosmological volume (Springel et al., 2005a) to investigate the response of the CGM and observational signatures of strong AGN feedback at high redshift. The suite includes a simulation without black hole physics (NoAGN), one with the fiducial fable galaxy formation model, and a modified simulation allowing for mildly super-Eddington accretion in combination with earlier seeding of black holes to produce an extremely massive black hole () at (fable-sE). The growth of such extreme objects was previously found to severely impact gas in and out of the halo as a result of enhanced AGN feedback (Bennett et al., 2024). We quantitatively investigated how AGN feedback shapes the CGM and performed radiative transfer simulations of quasar phases using the novel ray-tracing code VoroLite in post-processing. Here, the main aim was to track ionized hydrogen to estimate how well this and associated optical recombination lines such as H trace feedback episodes driven by a high-redshift quasar. This is particularly timely given that current and upcoming surveys with JWST, such as the Aether project (Farina et al., 2026, in prep.), are actively probing the diversity of quasar environments at . Our main conclusions are:
-
The quasar host halo, embedded in a large-scale overdensity, lies at the intersection of multiple cosmic filaments that provide a steady supply of cold gas that feeds the central SMBH. Provided that the SMBH is seeded early enough and allowed to accrete up to mildly super-Eddington rates, it will power a quasar with a luminosity of up to at early cosmic times.
-
Interestingly, despite the early onset of quasar activity, the central engine remains heavily obscured throughout most of its lifetime, with many lines of sight being Compton-thick down to . Our work thus suggest that we are likely missing an abundant population of heavily obscured quasars at . However, successive episodes of AGN feedback eventually clear out several escape channels in a protracted ‘transition’ stage, ultimately depleting the central reservoir through a strong ‘blow-out’ event lasting , leaving the engine exposed and unobscured. The demographics of unobscured/blue quasars at can hence serve as a powerful constraint on the mechanisms and strength of AGN feedback and how it regulates quasar obscuration.
-
During the ‘blow-out’ phase, massive and powerful large-scale outflows induce cosmic filament shattering, and drive dense, cold, outflowing () and metal-enriched gas ‘clumps’ out to and beyond the virial radius. This outflow transforms the CGM in fable-sE, which temporarily acquires a much higher covering fraction of neutral hydrogen in the CGM (up to more than in the NoAGN run). Our results indicate that observations probing the CGM of quasars may play a major role in distinguishing between alternative BH growth pathways in the early Universe.
-
We find that quasar phases significantly boost hydrogen ionized fractions in the CGM and IGM up to scales. The associated H emission provides a distinctive tracer of both AGN feedback strength and AGN obscuration state. During the ‘unobscured’ phase, the reduced central gas column densities enable more ionizing radiation to escape into the CGM, illuminating the dense, predominantly neutral clumps produced during the ‘blow out’ phase. These photoionized structures subsequently contribute to the formation of brighter and more spatially extended nebulae that may be detected out to .
-
Simulated radial profiles of emission agree well with recent observations of quasars, suggesting that the observed quasar populations at may have experienced significant feedback. Future JWST observations of extended nebular emission in the rest-frame optical will help further constrain quasar radiative activity at high redshift.
As observations of high-redshift quasars and their environment continue to probe a greater number of these objects at earlier cosmic epochs (accelerated by Euclid, see e.g., Belladitta et al., 2026; Yang et al., 2026) with ever-increasing depth, it becomes increasingly important for theoretical and simulation work to directly model this wealth of data. This can only be achieved through improved modelling of AGN physics, and, in particular, their radiative output. The simulations presented in this work mark an important step forward in connecting the strength of AGN feedback to observational tracers, revealing the formation of extended emission-line nebulae in following sustained bright quasar phases. To further scrutinise black hole physics at high redshift, it will be necessary for future simulations to include a more realistic treatment of the multiphase ISM and its interaction with the quasar radiation field. Explicit modelling of the cold phase will also enable access to complementary observational diagnostics which, together with current and future observations from, e.g., ALMA and JWST, will be crucial to constrain the growth and feedback of extremely massive black holes within the first billion years of the Universe.
Acknowledgements
LT is grateful to Martin Haehnelt, Laura Keating and Chris Done for insightful discussions. LT thanks Matthew Smith and Angus Beane for providing vortrace666See https://vortrace.readthedocs.io/en/latest/index.html to create projection maps of arepo simulations. LT is grateful to Stephen Wilkins for sharing qsosed spectra, and to Alessandro Trinca and Alessandro Lupi for sharing their SED models. LT acknowledges support from the Science and Technology Facilities Council (STFC) for a PhD studentship (STFC Quota Award - ST/Y509139/1). DS acknowledges support from the Science and Technology Facilities Council (STFC) under grant ST/W000997/1. JSB acknowledges support from a Leverhulme Trust Early Career Fellowship. This work was performed through DiRAC DP317 and DP379 projects, using resources provided by: the DiRAC@Durham facility managed by the Institute for Computational Cosmology on behalf of the STFC DiRAC HPC Facility (www.dirac.ac.uk). The equipment was funded by BEIS capital funding via STFC capital grants ST/P002293/1, ST/R002371/1, and ST/S002502/1, Durham University and STFC operations grant ST/R000832/1. DiRAC is part of the National eInfrastructure; the Cambridge Service for Data Driven Discovery (CSD3) operated by the University of Cambridge Research Computing Service (www.csd3.cam.ac.uk), provided by Dell EMC and Intel using Tier-2 funding from the Engineering and Physical Sciences Research Council (capital grant EP/P020259/1).
Data Availability
The data underlying this article will be shared upon reasonable request to the corresponding author.
References
- Adaptive ray tracing for radiative transfer around point sources. MNRAS 330 (3), pp. L53–L56. External Links: Document, astro-ph/0111033 Cited by: §2.3.
- What drives the growth of black holes: A decade of progress. New Astron. Rev. 101, pp. 101733. External Links: Document, 2506.19166 Cited by: §1.
- Through Thick and Thin—H I Absorption in Cosmological Simulations. ApJ 737 (2), pp. L37. External Links: Document, 1012.4014 Cited by: Appendix A.
- The journey of QSO haloes from z 6 to the present. MNRAS 425 (4), pp. 2722–2730. External Links: Document, 1203.5339 Cited by: §2.1.
- The Galaxy Environment of a QSO at z ~5.7. ApJ 773 (2), pp. 178. External Links: Document, 1306.6642 Cited by: §1.
- Observations of Early Black Holes Before and After JWST. 54th Saas-Fee Advanced Course lectures, pp. arXiv:2603.21976. External Links: Document, 2603.21976 Cited by: §1.
- Quasar outflows at z 6: the impact on the host galaxies. MNRAS 473 (3), pp. 4003–4020. External Links: Document, 1707.03014 Cited by: §1.
- Euclid: A UV-faint quasar in a highly luminous star-forming host galaxy at z ≍ 7.7. A&A 711, pp. A150. External Links: Document, 2607.03430 Cited by: §1, §5.
- The growth of the gargantuan black holes powering high-redshift quasars and their impact on the formation of early galaxies and protoclusters. MNRAS 527 (1), pp. 1033–1054. External Links: Document, 2305.11932 Cited by: §1, §1, §1, §1, §1, §1, Figure 2, §2.1, §2.1, §2.1, §2.1, §2.1, §2.5, §3.1, §3.2, §3.2, §3.4.1, §4.4.2, §5, footnote 8.
- Resolving shocks and filaments in galaxy formation simulations: effects on gas properties and star formation in the circumgalactic medium. MNRAS 499 (1), pp. 597–615. External Links: Document, 2006.10058 Cited by: §4.4.3.
- The birth of the intracluster medium: the evolution of multiphase gas and Lyman- haloes in a simulated protocluster. published in OJA, pp. arXiv:2603.16991. External Links: Document, 2603.16991 Cited by: §3.4.2, §4.4.3.
- Probing the z 6 quasars in a universe with IllustrisTNG physics: impact of gas-based black hole seeding models. MNRAS 516 (1), pp. 138–157. External Links: Document, 2205.05717 Cited by: §1.
- Heavy Seeds and the First Black Holes: Insights from the BRAHMA Simulations. ApJ 997 (2), pp. 187. External Links: Document, 2510.01322 Cited by: §1.
- Outflows driven by quasars in high-redshift galaxies with radiation hydrodynamics. MNRAS 464 (2), pp. 1854–1873. External Links: Document, 1606.06281 Cited by: §1, §2.4, §4.4.2.
- On the dynamics of supermassive black holes in gas-rich, star-forming galaxies: the case for nuclear star cluster co-evolution. MNRAS 469 (1), pp. 295–313. External Links: Document, 1701.05190 Cited by: §3.3.
- The case for large-scale AGN feedback in galaxy formation simulations: insights from XFABLE. MNRAS 542 (4), pp. 3206–3230. External Links: Document, 2501.16983 Cited by: §1, §2.1.
- Virial shocks in galactic haloes?. MNRAS 345 (1), pp. 349–364. External Links: Document, astro-ph/0302161 Cited by: §3.3.
- Suppression of black-hole growth by strong outflows at redshifts 5.8-6.6. Nature 605 (7909), pp. 244–247. External Links: Document, 2205.00021 Cited by: §1.
- Widespread QSO-driven outflows in the early Universe. AA 630, pp. A59. External Links: Document, 1806.00786 Cited by: §1.
- ALMA Reveals Bright Circumgalactic Emission and a Biconical Outflow in z 6.4 Quasar PSOJ183+05. ApJ 990 (2), pp. L31. External Links: Document, 2504.15357 Cited by: §1, §1.
- The Fraction and Kinematics of Broad Absorption Line Quasars across Cosmic Time. ApJ 952 (1), pp. 44. External Links: Document, 2301.09731 Cited by: §1.
- Circumgalactic Medium on the Largest Scales: Detecting X-Ray Absorption Lines with Large-area Microcalorimeters. ApJ 953 (1), pp. 42. External Links: Document, 2306.05449 Cited by: §1.
- Modeling multiphase galactic outflows: A multifluid moving-mesh approach. A&A 710, pp. A88. External Links: Document, 2508.16971 Cited by: §4.4.4.
- On the mechanism of accretion by stars. MNRAS 104, pp. 273. External Links: Document Cited by: §2.1.
- On spherically symmetrical accretion. MNRAS 112, pp. 195. External Links: Document Cited by: §2.1.
- AGN jet feedback on a moving mesh: cocoon inflation, gas flows and turbulence. MNRAS 472 (4), pp. 4707–4735. External Links: Document, 1705.07900 Cited by: §3.3.
- Detecting the halo heating from AGN feedback with ALMA. MNRAS 490 (4), pp. 5134–5146. External Links: Document, 1910.02088 Cited by: §1.
- MEOW: The increase in the obscured AGN fraction in mid-infrared from 0 < z < 6 with JWST MIRI. submitted to ApJ, pp. arXiv:2603.22393. External Links: 2603.22393 Cited by: §1.
- High-redshift AGN population in radiation-hydrodynamics simulations. MNRAS 544 (1), pp. 355–371. External Links: Document, 2507.11605 Cited by: §4.4.4.
- Premature supermassive black hole mergers in cosmological simulations of structure formation. MNRAS 542 (3), pp. 2019–2038. External Links: Document, 2504.17549 Cited by: §2.1.
- How Dust Models Shape High-z Galaxy Morphology: Insights from the NewCluster Simulation. ApJ 992 (1), pp. 92. External Links: Document, 2508.18374 Cited by: §4.4.2.
- Using 3D Voronoi grids in radiative transfer simulations. A&A 560, pp. A35. External Links: Document, 1310.1854 Cited by: §2.3.
- RADAMESH: cosmological radiative transfer for Adaptive Mesh Refinement simulations. MNRAS 411 (3), pp. 1678–1694. External Links: Document, 1009.1625 Cited by: §2.3.
- Super- and sub-Eddington accreting massive black holes: a comparison of slim and thin accretion discs through study of the spectral energy distribution. MNRAS 458 (2), pp. 1839–1858. External Links: Document, 1601.07177 Cited by: §2.4.
- The importance of super-Eddington black hole accretion for the emergence of massive quiescent galaxies at high redshift. MNRAS 550 (2), pp. stag1148. External Links: Document, 2601.15207 Cited by: §1.
- Self-shielding of hydrogen in the IGM during the epoch of reionization. MNRAS 478 (1), pp. 1065–1076. External Links: Document, 1707.06993 Cited by: Appendix A.
- Discovery of a Remarkably Powerful Broad Absorption-line Quasar Outflow in SDSS J135246.37+423923.5. ApJ 891 (1), pp. 53. External Links: Document, 2001.07347 Cited by: §1.
- Very extended cold gas, star formation and outflows in the halo of a bright quasar at z > 6. A&A 574, pp. A14. External Links: Document, 1409.4418 Cited by: §1.
- X-ray emission of z > 2.5 active galactic nuclei can be obscured by their host galaxies. AA 623, pp. A172. External Links: Document, 1901.07108 Cited by: §1.
- Reaching the peak of the quasar spectral energy distribution - I. Observations and models. MNRAS 449 (2), pp. 2174–2193. External Links: Document, 1502.05850 Cited by: §2.4.
- Fast cold gas in hot AGN outflows.. MNRAS 448, pp. L30–L34. External Links: Document, 1411.0678 Cited by: §1, §3.3, §3.3, §3.3.
- AGN-driven outflows and the formation of Ly nebulae around high-z quasars. MNRAS 517 (2), pp. 1767–1790. External Links: Document, 2203.11232 Cited by: §1, §1, §4.2.
- Powering galactic superwinds with small-scale AGN winds. MNRAS 497 (4), pp. 5229–5255. External Links: Document, 2006.05997 Cited by: §1.
- Driving gas shells with radiation pressure on dust in radiation-hydrodynamic simulations. MNRAS 473 (3), pp. 4197–4219. External Links: Document, 1703.05766 Cited by: §4.4.2.
- Quenching star formation with quasar outflows launched by trapped IR radiation. MNRAS 479 (2), pp. 2079–2111. External Links: Document, 1709.08638 Cited by: §1, §1, §4.4.2.
- The environment of bright QSOs at z 6: star-forming galaxies and X-ray emission. MNRAS 439 (2), pp. 2146–2174. External Links: Document, 1307.5854 Cited by: §1, §1, §1, §3.4.2.
- The host dark matter haloes of the first quasars. MNRAS 531 (1), pp. 930–944. External Links: Document, 2308.12987 Cited by: §1.
- Dust and gas content of high-redshift galaxies hosting obscured AGN in the Chandra Deep Field-South. AA 636, pp. A37. External Links: Document, 2003.08631 Cited by: §1.
- Evidence for Low Radiative Efficiency or Highly Obscured Growth of z > 7 Quasars. ApJ 884 (1), pp. L19. External Links: Document, 1906.10130 Cited by: §1.
- Constraining the Gravitational Lensing of z 6 Quasars from Their Proximity Zones. ApJ 904 (2), pp. L32. External Links: Document, 2007.15657 Cited by: §1.
- The evolution of large-scale structure in a universe dominated by cold dark matter. ApJ 292, pp. 371–394. External Links: Document Cited by: §2.1.
- An ALMA [C II] Survey of 27 Quasars at z > 5.94. ApJ 854 (2), pp. 97. External Links: Document, 1801.02641 Cited by: §1.
- The dust attenuation law in z 6 quasars. MNRAS 506 (3), pp. 3946–3961. External Links: Document, 2106.15625 Cited by: §2.5.
- Forming intracluster gas in a galaxy protocluster at a redshift of 2.16. Nature 615 (7954), pp. 809–812. External Links: Document, 2303.16226 Cited by: §1.
- Cold Flows and the First Quasars. ApJ 745 (2), pp. L29. External Links: Document, 1107.1253 Cited by: §1.
- Energy input from quasars regulates the growth and activity of black holes and their host galaxies. Nature 433 (7026), pp. 604–607. External Links: Document, astro-ph/0502199 Cited by: §1.
- Detection of stellar light from quasar host galaxies at redshifts above 6. Nature 621 (7977), pp. 51–55. External Links: Document, 2211.14329 Cited by: §1.
- Substructures in hydrodynamical cluster simulations. MNRAS 399 (2), pp. 497–514. External Links: Document, 0808.3401 Cited by: §2.1.
- Interstellar Dust Grains. ARA&A 41, pp. 241–289. External Links: Document, astro-ph/0304489 Cited by: §2.5.
- Chronicling the Reionization History at 6 z 7 with Emergent Quasar Damping Wings. ApJ 969 (2), pp. 162. External Links: Document, 2401.10328 Cited by: §1.
- BEES: Quasar Lifetime Measurements from Extended Rest-optical Emission Line Nebulae at z 6. ApJ 1003 (1), pp. 17. External Links: Document, 2510.09753 Cited by: §1, §1, Figure 13, §3.4.2, §3.4.2, §4.2, §4.4.2.
- Quasar Lifetime Measurements from Extended Ly Nebulae at z 6. ApJ 990 (2), pp. 174. External Links: Document, 2505.00080 Cited by: §4.2.
- High-redshift quasars in the Cold Dark Matter cosmogony. MNRAS 230, pp. 5p–11p. External Links: Document Cited by: §1.
- Detecting and Characterizing Young Quasars. II. Four Quasars at z 6 with Lifetimes < 104 Yr. ApJ 917 (1), pp. 38. External Links: Document, 2106.04586 Cited by: §1.
- First Spectroscopic Study of a Young Quasar. ApJ 867 (1), pp. 30. External Links: Document, 1806.05691 Cited by: §1.
- Detecting and Characterizing Young Quasars. I. Systemic Redshifts and Proximity Zone Measurements. ApJ 900 (1), pp. 37. External Links: Document, 2002.01811 Cited by: §1.
- EIGER. VI. The Correlation Function, Host Halo Mass, and Duty Cycle of Luminous Quasars at z 6. ApJ 974 (2), pp. 275. External Links: Document, 2403.07986 Cited by: §1, §1.
- Euclid preparation. V. Predicted yield of redshift 7 < z < 9 quasars from the wide survey. A&A 631, pp. A85. External Links: Document, 1908.04310 Cited by: §1.
- Euclid preparation. I. The Euclid Wide Survey. AA 662, pp. A112. External Links: Document, 2108.01201 Cited by: §1.
- First Sagittarius A* Event Horizon Telescope Results. I. The Shadow of the Supermassive Black Hole in the Center of the Milky Way. ApJ 930 (2), pp. L12. External Links: Document Cited by: §1.
- First M87 Event Horizon Telescope Results. I. The Shadow of the Supermassive Black Hole. ApJ 875 (1), pp. L1. External Links: Document, 1906.11238 Cited by: §1.
- The obscured growth of massive black holes. MNRAS 308 (4), pp. L39–L43. External Links: Document, astro-ph/9908064 Cited by: §4.4.2.
- Observational Evidence of Active Galactic Nuclei Feedback. ARAA 50, pp. 455–489. External Links: Document, 1204.4114 Cited by: §1, §1.
- Quasars and the Intergalactic Medium at Cosmic Dawn. ARAA 61, pp. 373–426. External Links: Document, 2212.06907 Cited by: §1.
- The X-shooter/ALMA Sample of Quasars in the Epoch of Reionization. II. Black Hole Masses, Eddington Ratios, and the Formation of the First Quasars. ApJ 941 (2), pp. 106. External Links: Document, 2207.05113 Cited by: §1.
- A stellar feedback origin for neutral hydrogen in high-redshift quasar-mass haloes. MNRAS 461 (1), pp. L32–L36. External Links: Document, 1601.07188 Cited by: §2.2.
- Neutral hydrogen in galaxy haloes at the peak of the cosmic star formation history. MNRAS 449 (1), pp. 987–1003. External Links: Document, 1409.1919 Cited by: §2.2.
- A New Calculation of the Ionizing Background Spectrum and the Effects of He II Reionization. ApJ 703 (2), pp. 1416–1443. External Links: Document, 0901.4554 Cited by: Appendix A, Appendix A.
- Key Physical Processes in the Circumgalactic Medium. ARAA 61, pp. 131–195. External Links: Document, 2301.10253 Cited by: §1.
- A cosmic UV/X-ray background model update. MNRAS 493 (2), pp. 1614–1632. External Links: Document, 1903.08657 Cited by: Appendix A.
- Cosmological simulations of galaxies. In Encyclopedia of Astrophysics, Vol. 4, pp. 576–599. External Links: Document Cited by: §1.
- The Structure of Multiphase Galactic Winds. ApJ 924 (2), pp. 82. External Links: Document, 2108.05355 Cited by: §3.3.
- AGN wind scaling relations and the co-evolution of black holes and galaxies. A&A 601, pp. A143. External Links: Document, 1702.04507 Cited by: §1.
- MUSE Analysis of Gas around Galaxies (MAGG) - V. Linking ionized gas traced by C IV and Si IV absorbers to Ly emitting galaxies at z 3.0-4.5. MNRAS 524 (3), pp. 3474–3501. External Links: Document, 2302.00021 Cited by: §1.
- The James Webb Space Telescope Mission. PASP 135 (1048), pp. 068001. External Links: Document, 2304.04869 Cited by: §1.
- The James Webb Space Telescope. SSR 123 (4), pp. 485–606. External Links: Document, astro-ph/0606175 Cited by: §1.
- Neutral hydrogen in and around galaxies during the Epoch of Reionization. submitted to A&A, pp. arXiv:2510.01315. External Links: Document, 2510.01315 Cited by: footnote 5.
- Introducing the Illustris project: the evolution of galaxy populations across cosmic time. MNRAS 445 (1), pp. 175–200. External Links: Document, 1405.3749 Cited by: §2.1.
- Stellar dynamics in the Galactic Centre: proper motions and anisotropy. MNRAS 317 (2), pp. 348–374. External Links: Document, astro-ph/0001428 Cited by: §1.
- The accelerations of stars orbiting the Milky Way’s central black hole. Nature 407 (6802), pp. 349–351. External Links: Document, astro-ph/0009339 Cited by: §1.
- Supermassive black holes at high redshift are expected to be obscured by their massive host galaxies’ interstellar medium. A&A 666, pp. A17. External Links: Document, 2206.03508 Cited by: §1.
- HEALPix: A Framework for High-Resolution Discretization and Fast Analysis of Data Distributed on the Sphere. ApJ 622 (2), pp. 759–771. External Links: Document, astro-ph/0409513 Cited by: §2.3, §3.2.
- Mass distribution in the Galactic Center based on interferometric astrometry of multiple stellar orbits. A&A 657, pp. L12. External Links: Document, 2112.07478 Cited by: §1.
- Intermediate-Mass Black Holes. ARAA 58, pp. 257–312. External Links: Document, 1911.09678 Cited by: §1.
- Simulations of multi-phase gas in and around galaxies. Living Reviews in Computational Astrophysics 12 (1), pp. 2. External Links: Document, 2601.16566 Cited by: §3.3.
- The growth and entrainment of cold gas in a hot wind. MNRAS 480 (1), pp. L111–L115. External Links: Document, 1806.02728 Cited by: §3.3.
- Radiative Transfer in a Clumpy Universe. II. The Ultraviolet Extragalactic Background. ApJ 461, pp. 20. External Links: Document, astro-ph/9509093 Cited by: Appendix A.
- Radiative Transfer in a Clumpy Universe. IV. New Synthesis Models of the Cosmic UV/X-Ray Background. ApJ 746 (2), pp. 125. External Links: Document Cited by: Appendix A.
- Supermassive black holes in cosmological simulations I: MBH - M⋆ relation and black hole mass function. MNRAS 503 (2), pp. 1940–1975. External Links: Document, 2006.10094 Cited by: §1.
- Co-evolution of massive black holes and their host galaxies at high redshift: discrepancies from six cosmological simulations and the key role of JWST. MNRAS 511 (3), pp. 3751–3767. External Links: Document, 2201.09892 Cited by: §1.
- Supermassive black holes in cosmological simulations - II: the AGN population and predictions for upcoming X-ray missions. MNRAS 509 (2), pp. 3015–3042. External Links: Document, 2111.01802 Cited by: §1.
- High-redshift galaxies, their active nuclei and central black holes. MNRAS 300 (3), pp. 817–827. External Links: Document, astro-ph/9712259 Cited by: §1, §1.
- What Is the Highest Plausible Redshift of Luminous Quasars?. ApJ 552 (2), pp. 459–463. External Links: Document, astro-ph/0011529 Cited by: §1.
- Spectroscopy of Spatially Extended Material around High-Redshift Radio-loud Quasars. ApJ 381, pp. 373. External Links: Document Cited by: §4.2.
- The FABLE simulations: a feedback model for galaxies, groups, and clusters. MNRAS 479 (4), pp. 5385–5412. External Links: Document, 1804.05064 Cited by: §1, §2.1, §2.1, §2.1.
- Obscured Active Galactic Nuclei. ARAA 56, pp. 625–671. External Links: Document, 1806.04680 Cited by: §1, §2.4.
- A Cosmological Framework for the Co-Evolution of Quasars, Supermassive Black Holes, and Elliptical Galaxies. I. Galaxy Mergers and Quasar Activity. ApJS 175 (2), pp. 356–389. External Links: Document, 0706.1243 Cited by: §1.
- A Physical Model for the Origin of Quasar Lifetimes. ApJ 625 (2), pp. L71–L74. External Links: Document, astro-ph/0502241 Cited by: §1.
- Long-term Evolution of Supercritical Black Hole Accretion with Outflows: A Subgrid Feedback Model for Cosmological Simulations. ApJ 934 (2), pp. 132. External Links: Document, 2203.14994 Cited by: §1.
- Equation of state of the photoionized intergalactic medium. MNRAS 292 (1), pp. 27–42. External Links: Document, astro-ph/9612232 Cited by: Appendix A, Appendix A, §2.3.
- The Impact of Enhanced Halo Resolution on the Simulated Circumgalactic Medium. ApJ 882 (2), pp. 156. External Links: Document, 1811.12410 Cited by: §4.4.3.
- The effects of super-Eddington accretion and feedback on the growth of early supermassive black holes and galaxies. MNRAS 537 (3), pp. 2559–2578. External Links: Document, 2410.09450 Cited by: §1.
- Weakness of x-rays and variability in high-redshift active galactic nuclei with super-eddington accretion. Publications of the Astronomical Society of Japan, pp. psaf050. External Links: ISSN 2053-051X, Document, Link, https://academic.oup.com/pasj/advance-article-pdf/doi/10.1093/pasj/psaf050/63462905/psaf050.pdf Cited by: §1, §4.1.
- Extremely Dense Gas around Little Red Dots and High-redshift Active Galactic Nuclei: A Nonstellar Origin of the Balmer Break and Absorption Features. ApJl 980 (2), pp. L27. External Links: Document, 2409.07805 Cited by: §1.
- The Assembly of the First Massive Black Holes. ARAA 58, pp. 27–97. External Links: Document, 1911.05791 Cited by: §1, §1, §1.
- AGN feedback: galactic-scale outflows driven by radiation pressure on dust. MNRAS 451 (1), pp. 93–102. External Links: Document, 1504.07393 Cited by: §4.4.2.
- Shattering and growth of cold clouds in galaxy clusters: the role of radiative cooling, magnetic fields, and thermal conduction. MNRAS 518 (4), pp. 5215–5235. External Links: Document, 2211.09183 Cited by: §3.3.
- JADES: comprehensive census of broad-line AGN from Reionization to Cosmic Noon revealed by JWST. MNRAS. External Links: Document, 2504.03551 Cited by: §1.
- Introducing the THESAN project: radiation-magnetohydrodynamic simulations of the epoch of reionization. MNRAS 511 (3), pp. 4005–4030. External Links: Document, 2110.00584 Cited by: §4.4.4.
- Introducing the THESAN-ZOOM project: radiation-hydrodynamic simulations of high-redshift galaxies with a multi-phase interstellar medium. The Open Journal of Astrophysics 8, pp. 153. External Links: Document, 2502.20437 Cited by: §4.4.4.
- EIGER. I. A Large Sample of [O III]-emitting Galaxies at 5.3 < z < 6.9 and Direct Evidence for Local Reionization by Galaxies. ApJ 950 (1), pp. 66. External Links: Document, 2211.08254 Cited by: §1.
- Cosmological Simulations with TreeSPH. ApJs 105, pp. 19. External Links: Document, astro-ph/9509107 Cited by: Appendix A, footnote 7.
- New synthesis models of consistent extragalactic background light over cosmic time. MNRAS 484 (3), pp. 4174–4199. External Links: Document, 1801.09693 Cited by: Appendix A.
- Powerful Outflows and Feedback from Active Galactic Nuclei. ARAA 53, pp. 115–154. External Links: Document, 1503.05206 Cited by: §1, §1.
- Black Holes, Galaxy Formation, and the MBH- Relation. ApJl 596 (1), pp. L27–L29. External Links: Document, astro-ph/0308342 Cited by: §1.
- UNCOVER: A NIRSpec Identification of a Broad-line AGN at z = 8.50. ApJ 957 (1), pp. L7. External Links: Document, 2308.11610 Cited by: §1.
- Coevolution (Or Not) of Supermassive Black Holes and Host Galaxies. ARAA 51 (1), pp. 511–653. External Links: Document, 1304.7762 Cited by: §1.
- A little FABLE: exploring AGN feedback in dwarf galaxies with cosmological simulations. MNRAS 503 (3), pp. 3568–3591. External Links: Document, 2007.10342 Cited by: §3.4.1.
- A physical model of the broad-band continuum of agn and its implications for the uv/x relation and optical variability. Monthly Notices of the Royal Astronomical Society 480 (1), pp. 1247–1262 (en). External Links: ISSN 0035-8711, 1365-2966, Document Cited by: §2.4, §3.4.2.
- Modelling the spectral energy distribution of super-eddington quasars. Monthly Notices of the Royal Astronomical Society 489 (1), pp. 524–533. Note: arXiv:1905.02920 [astro-ph] External Links: ISSN 0035-8711, 1365-2966, Document Cited by: footnote 2.
- A CEERS Discovery of an Accreting Supermassive Black Hole 570 Myr after the Big Bang: Identifying a Progenitor of Massive z > 6 Quasars. ApJl 953 (2), pp. L29. External Links: Document, 2303.08918 Cited by: §1.
- Formation of Supermassive Black Hole Seeds. Publ. Astron. Soc. Australia 33, pp. e051. External Links: Document, 1605.07391 Cited by: §1.
- The hydrodynamical response of cold circumgalactic clouds to quasar radiation. submitted to A&A, pp. arXiv:2604.16294. External Links: 2604.16294 Cited by: §2.3, §4.4.4.
- The MIRI Early Obscured-AGN Wide Survey (MEOW): A Population of Hidden AGN at Revealed by JWST/MIRI Imaging. submitted to ApJ, pp. arXiv:2607.02666. External Links: Document, 2607.02666 Cited by: §1.
- Formation of z~6 Quasars from Hierarchical Galaxy Mergers. ApJ 665 (1), pp. 187–208. External Links: Document, astro-ph/0608190 Cited by: §1.
- Observations of feedback from radio-quiet quasars - I. Extents and morphologies of ionized gas nebulae. MNRAS 430 (3), pp. 2327–2345. External Links: Document, 1301.1677 Cited by: §4.2.
- A JWST/NIRSpec Integral Field Unit Survey of Luminous Quasars at z ~5-6 (Q-IFU): Rest-frame Optical Nuclear Properties and Extended Nebulae. submitted to ApJ, pp. arXiv:2511.06085. External Links: Document, 2511.06085 Cited by: §1, §4.2.
- Extreme galaxy-scale outflows are frequent among luminous early quasars. Nature 653 (8114), pp. 368–372. External Links: Document, 2509.08793 Cited by: §1.
- Synthesizer: a Software Package for Synthetic Astronomical Observables. The Open Journal of Astrophysics 8. External Links: Document Cited by: Appendix B.
- ENhanced Galactic Atmospheres With Arepo: Resolving the CGM at 200 pc with the ENGAWA Simulations. submitted to ApJ, pp. arXiv:2603.05584. External Links: Document, 2603.05584 Cited by: §4.4.3.
- Sustained super-Eddington accretion in high-redshift quasars. A&A 686, pp. A256. External Links: Document, 2312.08422 Cited by: §4.4.1.
- High-redshift quasars and their host galaxies - I. Kinematical and dynamical properties and their tracers. MNRAS 488 (3), pp. 4004–4022. External Links: Document, 1901.02464 Cited by: §1, §4.4.1, §4.4.4.
- High-redshift quasars and their host galaxies - II. Multiphase gas and stellar kinematics. MNRAS 510 (4), pp. 5760–5779. External Links: Document, 2109.01679 Cited by: §4.4.1.
- Galactic Nuclei as Collapsed Old Quasars. Nature 223 (5207), pp. 690–694. External Links: Document Cited by: §1.
- Super-critical Growth of Massive Black Holes from Stellar-mass Seeds. ApJl 784 (2), pp. L38. External Links: Document, 1402.6995 Cited by: §1.
- X-Ray Weak Active Galactic Nuclei from Super-Eddington Accretion onto Infant Black Holes. ApJ 976 (2), pp. L24. External Links: Document, 2410.00417 Cited by: §1, §4.1.
- Chasing the light: Shadowing, collimation, and the super-Eddington growth of infant black holes in JWST broad-line AGNs. A&A 708, pp. A116. External Links: Document, 2501.09854 Cited by: §1.
- The Demography of Massive Dark Objects in Galaxy Centers. AJ 115 (6), pp. 2285–2305. External Links: Document, astro-ph/9708072 Cited by: §1.
- Evidence of strong quasar feedback in the early Universe. MNRAS 425 (1), pp. L66–L70. External Links: Document, 1204.2904 Cited by: §1.
- JADES: The diverse population of infant black holes at 4 < z < 11: Merging, tiny, poor, but mighty. AA 691, pp. A145. External Links: Document, 2308.01230 Cited by: §1.
- A small and vigorous black hole in the early Universe. Nature 627 (8002), pp. 59–63. External Links: Document, 2305.12492 Cited by: §1, §1.
- GA-NIFS: Black hole and host galaxy properties of two z ≃ 6.8 quasars from the NIRSpec IFU. A&A 678, pp. A191. External Links: Document, 2302.04795 Cited by: §1, §1.
- Physical Properties of 15 Quasars at z 6.5. ApJ 849 (2), pp. 91. External Links: Document, 1710.01251 Cited by: §1.
- XQR-30: Black hole masses and accretion rates of 42 z 6 quasars. A&A 676, pp. A71. External Links: Document, 2306.16474 Cited by: §1.
- Revisiting the Scaling Relations of Black Hole Masses and Host Galaxy Properties. ApJ 764 (2), pp. 184. External Links: Document, 1211.2816 Cited by: §1.
- Simulating the dust content of galaxies: successes and failures. MNRAS 468 (2), pp. 1505–1521. External Links: Document, 1606.02714 Cited by: §4.4.2.
- C 2-ray: A new method for photon-conserving transport of ionizing radiation. New Astron. 11 (5), pp. 374–395. External Links: Document, astro-ph/0508416 Cited by: §2.3, §2.3.
- New constraints on quasar evolution: broad-line velocity shifts over 1.5 z 7.5. MNRAS 487 (3), pp. 3305–3323. External Links: Document, 1902.04558 Cited by: §1.
- Constraining Galaxy Overdensities around Three z 6.5 Quasars with ALMA and MUSE. ApJ 927 (2), pp. 141. External Links: Document, 2201.09720 Cited by: §1.
- Estimating the Effective Lifetime of the z 6 Quasar Population from the Composite Proximity Zone Profile. ApJ 921 (1), pp. 88. External Links: Document, 2108.10907 Cited by: §1.
- Verifying the identity of high-redshift massive galaxies through the clustering of lower mass galaxies around them. MNRAS 385 (4), pp. 2175–2180. External Links: Document, 0711.0467 Cited by: §1.
- On the Maximum Luminosity of Galaxies and Their Central Black Holes: Feedback from Momentum-driven Winds. ApJ 618 (2), pp. 569–585. External Links: Document, astro-ph/0406070 Cited by: §4.4.2.
- The Hot and Energetic Universe: A White Paper presenting the science theme motivating the Athena+ mission. ESA White Papers, pp. arXiv:1306.2307. External Links: Document, 1306.2307 Cited by: §1.
- QSO obscuration at high redshift (z 7): predictions from the BLUETIDES simulation. MNRAS 495 (2), pp. 2135–2151. External Links: Document, 1912.03780 Cited by: §1.
- No Evidence for [C II] Halos or High-velocity Outflows in z 6 Quasar Host Galaxies. ApJ 904 (2), pp. 131. External Links: Document, 2010.14875 Cited by: §1.
- Mildly Super-Eddington Accretion onto Slowly Spinning Black Holes Explains the X-Ray Weakness of the Little Red Dots. ApJ 976 (1), pp. 96. External Links: Document, 2407.15915 Cited by: §1, §4.1.
- Improving the convergence properties of the moving-mesh code AREPO. MNRAS 455 (1), pp. 1134–1143. External Links: Document, 1503.00562 Cited by: §2.1.
- A survey of high-z galaxies: SERRA simulations. MNRAS 513 (4), pp. 5621–5641. External Links: Document, 2201.02636 Cited by: §4.4.4.
- Total and effective radiative recombination coefficients.. A&A 251, pp. 680–688. Cited by: §2.2.
- Central Masses and Broad-Line Region Sizes of Active Galactic Nuclei. II. A Homogeneous Analysis of a Large Reverberation-Mapping Database. ApJ 613 (2), pp. 682–699. External Links: Document, astro-ph/0407299 Cited by: §1.
- Simulating galaxy formation with the IllustrisTNG model. MNRAS 473 (3), pp. 4077–4106. External Links: Document, 1703.02970 Cited by: §4.4.4.
- Consistent modelling of the meta-galactic UV background and the thermal/ionization history of the intergalactic medium. MNRAS 485 (1), pp. 47–68. External Links: Document, 1801.04931 Cited by: Figure 14, Appendix A, §2.2.
- Super-Eddington accretion in high-redshift quasar hosts: Black-hole-driven outflows, galaxy quenching, and the nature of little red dots. A&A 704, pp. A248. External Links: Document, 2505.05556 Cited by: §1, §4.4.1, §4.4.4.
- On the evolution of the H I column density distribution in cosmological simulations. MNRAS 430 (3), pp. 2427–2445. External Links: Document, 1210.7808 Cited by: Figure 14, Appendix A, Appendix A, Appendix A, Appendix A, Appendix A, §2.2.
- The distribution of neutral hydrogen around high-redshift galaxies and quasars in the EAGLE simulation. MNRAS 452 (2), pp. 2034–2056. External Links: Document, 1503.05553 Cited by: §2.2.
- Zooming in on the circumgalactic medium with GIBLE: Cloud-scale simulations with cosmological initial conditions. submitted to PASA, pp. arXiv:2602.23416. External Links: Document, 2602.23416 Cited by: §4.4.3.
- Zooming in on the circumgalactic medium with GIBLE: Resolving small-scale gas structure in cosmological simulations. MNRAS 528 (2), pp. 3320–3339. External Links: Document, 2307.11143 Cited by: §4.4.3.
- Nuclear obscuration in active galactic nuclei. Nature Astronomy 1, pp. 679–689. External Links: Document, 1709.00019 Cited by: §1.
- Black Hole Models for Active Galactic Nuclei. ARAA 22, pp. 471–506. External Links: Document Cited by: §1, §2.1.
- Relations between Central Black Hole Mass and Total Galaxy Stellar Mass in the Local Universe. ApJ 813 (2), pp. 82. External Links: Document, 1508.06274 Cited by: §1.
- CALIMA: On-the-fly dust and PAH evolution for radiation-hydrodynamics galaxy formation simulations. to be submitted, pp. arXiv:2602.21790. External Links: Document, 2602.21790 Cited by: §4.4.2.
- Synthesizer: synthetic observables for modern astronomy. Journal of Open Source Software 11 (119), pp. 9436. External Links: Document Cited by: Appendix B.
- RAMSES-RT: radiation hydrodynamics in the cosmological context. MNRAS 436 (3), pp. 2188–2231. External Links: Document, 1304.7126 Cited by: §2.4.
- HYPERION: Broad-band X-ray-to-near-infrared emission of quasars in the first billion years of the Universe. AAP 693, pp. A157. External Links: Document, 2411.02105 Cited by: §1.
- Accretion of Interstellar Matter by Massive Objects.. ApJ 140, pp. 796–800. External Links: Document Cited by: §1.
- On the rapid growth of SMBHs in high-z galaxies: the aftermath of Population III.1 stars. MNRAS 544 (4), pp. 4317–4335. External Links: Document, 2507.02058 Cited by: §4.4.1, §4.4.4.
- The need for obscured supermassive black hole growth to explain quasar proximity zones in the epoch of reionization. MNRAS 521 (2), pp. 3108–3126. External Links: Document, 2209.08103 Cited by: §1, §4.2.
- The X-SHOOTER/ALMA Sample of Quasars in the Epoch of Reionization. I. NIR Spectral Modeling, Iron Enrichment, and Broad Emission Line Properties. ApJ 905 (1), pp. 51. External Links: Document, 2010.06902 Cited by: §1, §1.
- 3C 273 : A Star-Like Object with Large Red-Shift. Nature 197 (4872), pp. 1040. External Links: Document Cited by: §1.
- Supermassive black hole demography: the match between the local and accreted mass functions. MNRAS 354 (4), pp. 1020–1030. External Links: Document, astro-ph/0405585 Cited by: §2.1.
- The bolometric quasar luminosity function at z = 0-7. MNRAS 495 (3), pp. 3252–3275. External Links: Document, 2001.02696 Cited by: §2.4.
- The Lumina Project: The Demographics of Active Galactic Nuclei from Quasars to Little Red Dots at . to be submitted, pp. arXiv:2605.24112. External Links: Document, 2605.24112 Cited by: §4.4.4.
- A unified model for AGN feedback in cosmological simulations of structure formation. MNRAS 380 (3), pp. 877–900. External Links: Document, 0705.2238 Cited by: §1, §1, §2.1.
- Growing the first bright quasars in cosmological simulations of structure formation. MNRAS 400 (1), pp. 100–122. External Links: Document, 0905.1689 Cited by: §1, §1, §1, §1, §2.1.
- The Illustris simulation: the evolving population of black holes across cosmic time. MNRAS 452 (1), pp. 575–596. External Links: Document, 1408.6842 Cited by: §2.1.
- Quasars and galaxy formation. AA 331, pp. L1–L4. External Links: Document, astro-ph/9801013 Cited by: §1, §1.
- Radiation Hydrodynamical Simulations of the First Quasars. ApJ 865 (2), pp. 126. External Links: Document, 1703.00449 Cited by: §1.
- The physics of Lyman- escape from disc-like galaxies. MNRAS 517 (1), pp. 1–27. External Links: Document, 2111.13721 Cited by: §4.4.4.
- Masses of quasars.. MNRAS 200, pp. 115–122. External Links: Document Cited by: §2.1.
- Three-Year Wilkinson Microwave Anisotropy Probe (WMAP) Observations: Implications for Cosmology. ApJS 170 (2), pp. 377–408. External Links: Document, astro-ph/0603449 Cited by: §2.1.
- Direct Evidence for Active Galactic Nuclei Feedback from Fast Molecular Outflows in Reionization-era Quasars. ApJ 982 (2), pp. 72. External Links: Document, 2502.05283 Cited by: §1.
- Simulations of the formation, evolution and clustering of galaxies and quasars. Nature 435 (7042), pp. 629–636. External Links: Document, astro-ph/0504097 Cited by: §2.1, §5.
- Modelling feedback from stars and black holes in galaxy mergers. MNRAS 361 (3), pp. 776–794. External Links: Document, astro-ph/0411108 Cited by: §2.1, §2.1.
- Cosmological smoothed particle hydrodynamics simulations: a hybrid multiphase model for star formation. MNRAS 339 (2), pp. 289–311. External Links: Document, astro-ph/0206393 Cited by: §2.2, §4.4.1, §4.4.4.
- Populating a cluster of galaxies - I. Results at z=0. MNRAS 328 (3), pp. 726–750. External Links: Document, astro-ph/0012055 Cited by: §2.1.
- E pur si muove: Galilean-invariant cosmological hydrodynamical simulations on a moving mesh. MNRAS 401 (2), pp. 791–851. External Links: Document, 0901.4107 Cited by: §2.1.
- A spectral stacking analysis to search for faint outflow signatures in z 6 quasars. A&A 631, pp. A78. External Links: Document, 1908.11395 Cited by: §1.
- Modeling the Spectral Energy Distribution of Active Galactic Nuclei: Implications for Cosmological Simulations of Galaxy Formation. ApJ 999 (2), pp. 258. External Links: Document, 2501.10793 Cited by: §2.4.
- A super-Eddington-accreting black hole ~1.5 Gyr after the Big Bang observed with JWST. Nature Astronomy 9, pp. 271–279. External Links: Document, 2405.05333 Cited by: §1.
- Small-Scale Fluctuations of Relic Radiation. ApSS 7 (1), pp. 3–19. External Links: Document Cited by: §1.
- The Observations of Relic Radiation as a Test of the Nature of X-Ray Radiation from the Clusters of Galaxies. Comments on Astrophysics and Space Physics 4, pp. 173. Cited by: §1.
- The velocity of clusters of galaxies relative to the microwave background - The possibility of its measurement.. MNRAS 190, pp. 413–420. External Links: Document Cited by: §1.
- Modelling type 1 quasar colours in the era of Rubin and Euclid. MNRAS 508 (1), pp. 737–754. External Links: Document, 2109.04472 Cited by: §2.4.
- Dynamics of dusty radiation-pressure-driven shells and clouds: fast outflows from galaxies, star clusters, massive stars, and AGN. MNRAS 449 (1), pp. 147–161. External Links: Document, 1406.5206 Cited by: §4.4.2.
- The Large-scale Bias of Dark Matter Halos: Numerical Calibration and Model Tests. ApJ 724 (2), pp. 878–886. External Links: Document, 1001.3162 Cited by: §1.
- A model for cosmological simulations of galaxy formation physics: multi-epoch validation. MNRAS 438 (3), pp. 1985–2004. External Links: Document, 1305.4931 Cited by: §2.1.
- The H I covering fraction of Lyman Limit Systems in FIRE haloes. MNRAS 532 (4), pp. 3847–3864. External Links: Document, 2311.18000 Cited by: §2.2, footnote 5.
- HYPERION. Shedding light on the first luminous quasars: A correlation between UV disc winds and X-ray continuum. AAP 691, pp. A235. External Links: Document, 2410.12786 Cited by: §1.
- The OBELISK simulation: Galaxies contribute more than AGN to H I reionization of protoclusters. A&A 653, pp. A154. External Links: Document, 2002.04045 Cited by: §4.4.1.
- Black hole obscuration and duty-cycles mediated by AGN feedback in high-redshift galaxies. MNRAS 487 (1), pp. 819–831. External Links: Document, 1901.01261 Cited by: §1.
- You can’t see me: Super-Eddington growth hindering X-ray detection in high-z broad-line active galactic nuclei. A&A 710, pp. A289. External Links: Document Cited by: §4.1.
- Accurate Dust Temperature and Star Formation Rate in the Most Luminous z > 6 Quasar in the Hyperluminous Quasars at the Epoch of Reionization (HYPERION) Sample. ApJ 946 (2), pp. L45. External Links: Document, 2303.11961 Cited by: §1.
- The Circumgalactic Medium. ARAA 55 (1), pp. 389–432. External Links: Document, 1709.09180 Cited by: §1.
- Quasars and Galaxy Formation. I. The Z > 4 Objects. AJ 101, pp. 5. External Links: Document Cited by: §1.
- Host galaxies of high-redshift quasars: SMBH growth and feedback. MNRAS 507 (1), pp. 1–26. External Links: Document, 2107.05638 Cited by: §1, §1.
- Extended [CII] gas emission in and around a massive quiescent galaxy at z=7.3. submitted to A&A, pp. arXiv:2606.21361. External Links: Document, 2606.21361 Cited by: §1.
- Cosmological simulations of the circumgalactic medium with 1 kpc resolution: enhanced H I column densities. MNRAS 482 (1), pp. L85–L89. External Links: Document, 1808.04369 Cited by: §4.4.3.
- Cosmic wallflowers: the circumgalactic origins of isolated ultra-compact star clusters at z > 7. MNRAS 548 (4), pp. stag792. External Links: Document, 2601.05333 Cited by: §4.3.
- Atomic Data for Astrophysics. II. New Analytic Fits for Photoionization Cross Sections of Atoms and Ions. ApJ 465, pp. 487. External Links: Document, astro-ph/9601009 Cited by: §2.4.
- Mass Functions of the Active Black Holes in Distant Quasars from the Large Bright Quasar Survey, the Bright Quasar Survey, and the Color-selected Sample of the SDSS Fall Equatorial Stripe. ApJ 699 (1), pp. 800–816. External Links: Document, 0904.3348 Cited by: §1.
- Determining Central Black Hole Masses in Distant Active Galaxies and Quasars. II. Improved Optical and UV Scaling Relationships. ApJ 641 (2), pp. 689–709. External Links: Document, astro-ph/0601303 Cited by: §1.
- High-redshift AGN in the Chandra Deep Fields: the obscured fraction and space density of the sub-L∗ population. MNRAS 473 (2), pp. 2378–2406. External Links: Document, 1709.07892 Cited by: §1.
- Feedback effect on the observable properties of z > 6 AGN. MNRAS 514 (2), pp. 1672–1688. External Links: Document, 2205.09181 Cited by: §2.5.
- A model for cosmological simulations of galaxy formation physics. MNRAS 436 (4), pp. 3031–3067. External Links: Document, 1305.2913 Cited by: §2.1, §2.1.
- Introducing the Illustris Project: simulating the coevolution of dark and visible matter in the Universe. MNRAS 444 (2), pp. 1518–1547. External Links: Document, 1405.2921 Cited by: §2.1.
- The origins of massive black holes. Nature Reviews Physics 3 (11), pp. 732–743. External Links: Document, 2110.10175 Cited by: §1.
- Rapid Growth of High-Redshift Black Holes. ApJ 633 (2), pp. 624–629. External Links: Document, astro-ph/0506040 Cited by: §1.
- Quasars at z=6: The Survival of the Fittest. ApJ 650 (2), pp. 669–678. External Links: Document, astro-ph/0607093 Cited by: §1.
- Inferences on the Relations Between Central Black Hole Mass and Total Galaxy Stellar Mass in the High-redshift Universe. ApJ 820 (1), pp. L6. External Links: Document, 1602.05711 Cited by: §1.
- The Case for Supercritical Accretion onto Massive Black Holes at High Redshift. ApJ 804 (2), pp. 148. External Links: Document, 1401.3513 Cited by: §1.
- Driving Outflows with Relativistic Jets and the Dependence of Active Galactic Nucleus Feedback Efficiency on Interstellar Medium Inhomogeneity. ApJ 757 (2), pp. 136. External Links: Document, 1205.0542 Cited by: §4.4.1.
- Ultrafast Outflows: Galaxy-scale Active Galactic Nucleus Feedback. ApJ 763 (1), pp. L18. External Links: Document, 1211.5851 Cited by: §4.4.1.
- A Luminous Quasar at Redshift 7.642. ApJ 907 (1), pp. L1. External Links: Document, 2101.03179 Cited by: §1, §1, §1.
- A SPectroscopic Survey of Biased Halos in the Reionization Era (ASPIRE): JWST Reveals a Filamentary Structure around a z = 6.61 Quasar. ApJ 951 (1), pp. L4. External Links: Document, 2304.09894 Cited by: §1.
- AGN-driven outflows in clumpy media: multiphase structure and scaling relations. MNRAS 533 (2), pp. 1733–1755. External Links: Document, 2407.17593 Cited by: §1, §3.3, §3.3.
- Mixing between AGN winds and ISM clouds produces luminous X-ray emission. MNRAS. External Links: Document, 2511.14834 Cited by: §3.3.
- Modelling multiphase gases in cosmological simulations using compressible multifluid hydrodynamics. MNRAS 519 (2), pp. 3011–3026. External Links: Document, 2204.05316 Cited by: §4.4.4.
- Simulating galaxy formation with black hole driven thermal and kinetic feedback. MNRAS 465 (3), pp. 3291–3308. External Links: Document, 1607.03486 Cited by: §4.4.4.
- The AREPO Public Code Release. ApJS 248 (2), pp. 32. External Links: Document, 1909.04667 Cited by: §2.1.
- First Light and Reionization Epoch Simulations (FLARES) – XVIII: the ionising emissivities and hydrogen recombination line properties of early AGN. to be submitted to OJA, pp. arXiv:2505.05257. External Links: Document, 2505.05257 Cited by: Appendix B.
- Shedding the envelope: JWST reveals a kiloparsec-scale [O III]-weak Balmer shell around a z = 7.64 quasar. A&A 707, pp. A299. External Links: Document, 2512.15881 Cited by: §1, §4.2.
- An ultraluminous quasar with a twelve-billion-solar-mass black hole at redshift 6.30. Nature 518 (7540), pp. 512–515. External Links: Document, 1502.07418 Cited by: §1.
- Euclid: Discovery of 31 new quasars at 6.6 < z < 7.8. A&A 711, pp. A104. External Links: Document, 2607.03432 Cited by: §1, §5.
- CEERS Key Paper. VI. JWST/MIRI Uncovers a Large Population of Obscured AGN at High Redshifts. ApJ 950 (1), pp. L5. External Links: Document, 2303.11736 Cited by: §1.
- Probing Early Supermassive Black Hole Growth and Quasar Evolution with Near-infrared Spectroscopy of 37 Reionization-era Quasars at 6.3 < z 7.64. ApJ 923 (2), pp. 262. External Links: Document, 2109.13942 Cited by: §1.
- A SPectroscopic Survey of Biased Halos in the Reionization Era (ASPIRE): A First Look at the Rest-frame Optical Spectra of z > 6.5 Quasars Using JWST. ApJ 951 (1), pp. L5. External Links: Document, 2304.09888 Cited by: §1, §1.
- Observational constraints on growth of massive black holes. MNRAS 335 (4), pp. 965–976. External Links: Document, astro-ph/0203082 Cited by: §2.1.
- The formation of the first quasars: the black hole seeds, accretion, and feedback models. MNRAS 514 (4), pp. 5583–5606. External Links: Document, 2012.01458 Cited by: §1, §1.
- Introducing the Lumina project: large-volume radiation-hydrodynamic simulations of the epochs of hydrogen and helium reionization. submitted to MNRAS, pp. arXiv:2605.15310. External Links: Document, 2605.15310 Cited by: §4.4.4.
Appendix A The neutral fraction of hydrogen in ionization equilibrium

In this Section, we describe how the ionization state of hydrogen is determined for every gas cell in the simulation. We assume gas to be in ionization equilibrium with a meta-galactic UVB, and derive the hydrogen neutral fraction from the internal energy per unit mass (specific internal energy) and density of the gas extracted from the simulations (in a manner analogous to Rahmati et al., 2013, see their Appendix A2).
We neglect the contribution from helium in this computation, which is a common simplification adopted in the literature (e.g., Faucher-Giguère et al., 2009; Altay et al., 2011; Rahmati et al., 2013) that also suits our approach for evolving the ionization state of hydrogen in post-processing777We have verified that using a more complex network including helium (e.g., Katz et al., 1996) does not change our results.. In equilibrium, the hydrogen ionization fraction is obtained by equating the rate of recombinations with the total ionization rate (see equation (7)):
| (15) |
where and are the neutral hydrogen, ionized hydrogen and free electron number density, respectively; is the recombination rate; is the photoionization rate; and is collisional ionization coefficient.
Let us define the hydrogen neutral fraction such that . Since Helium has been excluded, . We can then recast equation (15) into:
| (16) |
Equation (16) can be rearranged to give an exact expression for , provided we assume an explicit form for the photoionization, collisional ionization and recombination rates.
In the absence of quasar radiation, photoionization is modelled via a homogeneous, redshift-dependent meta-galactic UVB that may be attenuated due to self-shielding. We use the fitting function provided by Rahmati et al. (2013):
| (17) |
The various parameters and respectively characterise the density at which self-shielding occurs and the shape of the photoionization curve, and they are fitted as a function of redshift, which was found to reproduce the photoionization rate distribution from radiative transfer simulations (Rahmati et al., 2013; Chardin et al., 2018); and is the photoionization rate due to the UV background at a given redshift. There exists a plurality of UV background models in the literature (e.g., Haardt and Madau, 1996, 2012; Faucher-Giguère et al., 2009; Khaire and Srianand, 2019; Puchwein et al., 2019; Faucher-Giguère, 2020) with varying redshift evolution calibrated on different observations. In this study, we use the ‘equivalent-equilibrium’ photoionization rates (see Puchwein et al., 2019, Appendix D2), which are intended for use in cosmological hydrodynamical simulations that assume ionization equilibrium.
The chosen recombination rate is the case B rate , with , provided by the fitting function found in Hui and Gnedin (1997):
| (18) |
Collisional ionization is parametrised through , where is given in Hui and Gnedin (1997):
| (19) |
By combining equations (17), (18), and (19), we obtain the following closed-form expression for the equilibrium neutral hydrogen fraction (Rahmati et al., 2013):
| (20) |
where , and . This expression is explicitly dependent on the hydrogen number density and temperature of every gas cell (through the recombination and collisional ionization rates, and through the self-shielding from photoionization), and redshift (through its dependence in ), such that .
There are two additional subtleties in this computation which relate to the temperature dependence of . As highlighted in Section 2, we manually set such that for star-forming gas. There is also a practical issue with the computation: the simulations do not explicitly track the temperature but instead record the internal energy and mean molecular weight of every gas cell, from which the temperature can be computed. The method introduced above computes the neutral hydrogen fraction using , and the electron abundance will be modified accordingly. As such, we obtain a modified value of the mean molecular weight which can be used to compute a modified temperature . This modified temperature may be different from that used to initially estimate the neutral hydrogen fraction (i.e., ). To avoid this circularity argument, we iteratively solve the equation. Effectively, we start with fully-ionized gas (i.e., ) and stop when the values of in two successive iterations differ by less than 10-5 per cent (see also Katz et al., 1996). For every gas cell, the initial fraction of neutral hydrogen is obtained via equation (20), whose explicit dependence on the hydrogen number density and temperature at is shown in Fig. 14.
Appendix B The ionizing photon rate of neutral hydrogen of AGN
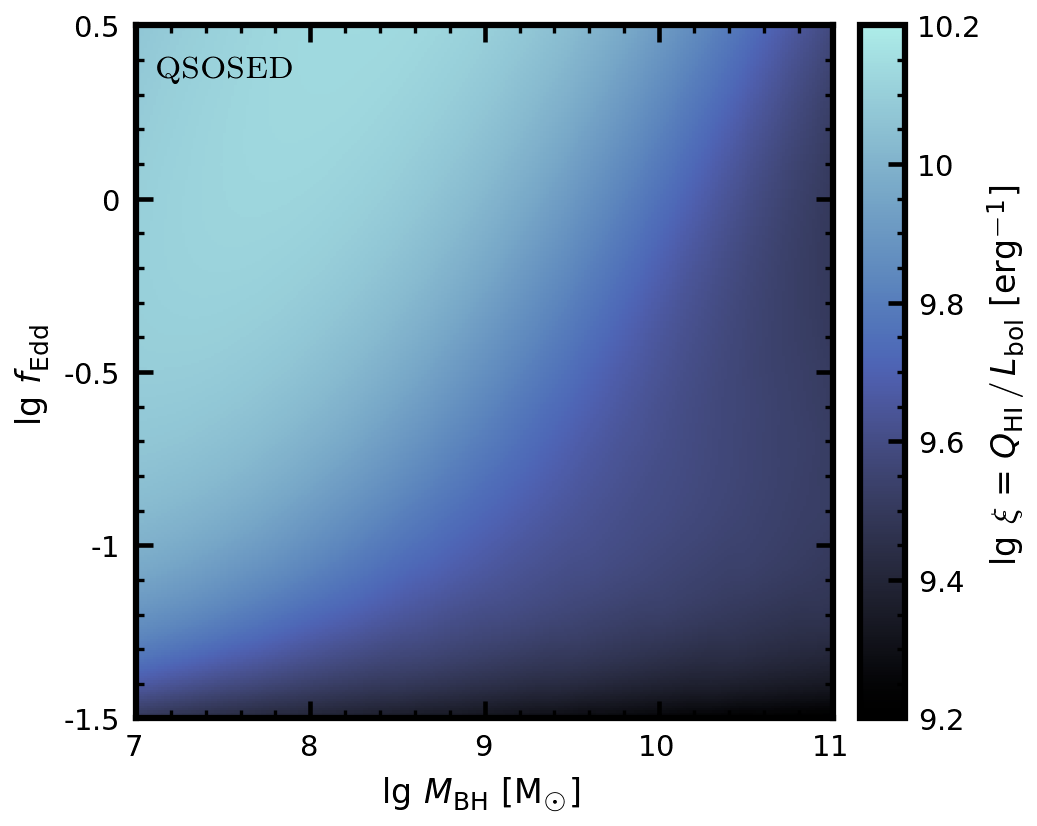
In principle, to obtain the ionizing photon rate at any time, we need to produce the SED corresponding to the black hole mass and accretion rate at the time, and integrate it as in equation (8). Performing this operation for every time-step of the simulation is computationally expensive. Instead, in this work, we follow an approach similar to Wilkins et al. (2025) using the synthesizer framework (Lovell et al., 2025; Roper et al., 2026), wherein we pre-compute bolometric correction grids such that:
| (21) |
Specifically, we compute the ionizing photon rate from the SED of accreting SMBHs for varying black hole mass (51 log-spaced bins for ) and accretion rate (21 log-spaced bins for )888This range is suitable for our simulations, given that the central SMBH does not spend a significant portion of time at (Bennett et al., 2024) and, by construction, ., normalised by bolometric luminosity (i.e., we perform the integral in equation (8) to obtain ). We then obtain a grid of values for , which we interpolate to have a smooth bolometric correction from to as a function of time. The grid for the qsosed model is shown in Fig. 15, highlighting that the ionizing photon rate can vary by depending on the accretion rate and black hole mass (independently of the bolometric luminosity of the quasar).