Chemodynamical evidence of the HR 1614 moving group
as a bar resonance
††thanks: This paper includes data gathered with the 6.5 m Magellan Telescopes located at Las Campanas
Observatory, Chile.
Moving groups (MGs) are ensembles of disk stars that clump in velocity and action space. A multitude of explanations as to their origin has been attempted, from dissolved star clusters, to resonances with the Galactic bar, or other non-axisymmetric perturbations. The object of this work, the old HR 1614 group, has in the past already been shown to not be a disrupted cluster in terms of its broad age and metallicity distribution. Thus its stars have more likely been trapped by the Milky Way bar at corotation. Here, we present a new study that aims to chemically and dynamically characterize this group in the context of such a resonance. To this end, we used MIKE/Magellan high-resolution, high signal-to-noise spectra of six member stars of the HR 1614 MG to determine the chemical abundance ratios for 24 elements, several for the first time in those stars. The Fe-abundances of our sample range from +0.13 to 0.38 dex and the majority of abundance ratios is fully in line with those of metal-rich Milky Way disk stars, with few exceptions. In particular, the group’s eponym, HR 1614, is enhanced in essentially all abundances and coincides with the higher-[X/Fe] trends of the Milky Way’s thick disk. All elements (but S and Ca) show significant intrinsic abundance scatter that argue against this MG having formed in a contained environment such as a dissolved cluster. Isochrone ages, tailored to the measured metallicities support earlier findings of a broad age mix in this group, ranging from 1 Gyr to as old as 8 Gyr. We performed an orbital frequency analysis in a Galactic potential that includes a rotating bar. Indeed, our sample stars fall onto thin resonances on corotation. Hence, our results support the idea that the HR 1614 MG is a resonantly perturbed disk feature, mustering a mélange of stars from different parent populations in the inner Galaxy.
Key Words.:
Stars: abundances — Stars: kinematics and dynamics — Galaxy: disks — Galaxy: kinematics and dynamics — open clusters and associations: individual: HR 16141 Introduction
Via lactea est omnis divisa in partes tres. – this dictum, loosely adapted from G.I. Caesar (58 B.C.), obviously purveys a hopelessly antiquated concept of a three-component (disk/bulge/halo) Milky Way (MW) and its siblings (e.g., Kordopatis et al., 2013). Evidence has been emerging that each of these is subdivided into thin/thick disks of various metallicities (e.g., Gilmore and Reid, 1983; Kordopatis et al., 2013; Bensby et al., 2014), inner/outer halos displaying abundance gradients (e.g., Carollo et al., 2007; Koch et al., 2008), and a complicated bulge plus bar structure (e.g., Blitz and Spergel, 1991; Stanek et al., 1997; McWilliam and Zoccali, 2010; Wegg and Gerhard, 2013; Kunder et al., 2020). Separating all these is not straightforward and further complicated by dynamical effects, dislocating stars and clusters from their birth radii and redistributing angular momentum. This can lead to overlapping stellar populations (e.g., Koch et al., 2018; Gran et al., 2021) and various mixing effects, such as radial migration, blurring, or churning, all of which are essentially resonant effects due to non-axisymmetric perturbations (e.g., Sellwood and Binney, 2002; Haywood, 2008; Frankel et al., 2020). One class of objects attesting to the dynamic (co-)evolution of these substructures are moving groups (MGs), i.e., ensembles of stars that are distinct in velocity and action space (Eggen, 1958, 1965; Trick et al., 2021).
The HR 1614 MG was initially characterized as an old (2 Gyr), comoving system in the survey of some 400 stars by Eggen (1971), who later noted the supersolar metallicities of the closest member (HR 1614Hip 23311) and 25 bright associates (Eggen, 1978). Later, the group’s age was revised upwards to as high as 5 Gyr (Eggen, 1992). Feltzing and Holmberg (2000) re-examined the HR 1614 group and its origin using various available data sets and broadly sampling phase space. In total, 44 stars were identified as possible members of the MG, with 60% being more metal rich than the Sun, at a mean of 0.2 dex and an age back to Eggen’s original assessment of 2 Gyr. Kushniruk et al. (2020) revisited the group from a legion of surveys resulting in a much larger sample of member candidates. Their ensuing isochrone fits revealed the presence of multiple stellar populations within the MG with ages between 2 and 8 Gyr and with a large spread in metallicity. In consequence, the origin of the HR 1614 MG as a dissolved (open) star cluster was discarded (cf. Gagné et al., 2021).
Dynamically, its members stand out in velocity (U,V)-space at (0, 60) km s-1 and within V10 km s-1 of the reference star HR 1614. Given their propinquity and the tilt in (U,V)-space (see also Ramos et al. 2018), the HR 1614 MG has been identified as being part of the Hercules stream, which, in turn, constitutes a corotation (CR) or outer Lindblad resonance (OLR) with the Galactic bar (Dehnen, 2000; Hunt and Bovy, 2018; D’Onghia and L. Aguerri, 2020; Chiba et al., 2021; Li et al., 2025a, b).
As to a detailed chemical inventory, De Silva et al. (2007) conducted the first high-resolution spectroscopic study on 18 of the members of the group. Their results confirmed that the HR 1614 MG is a 2 Gyr old, metal-rich system with [Fe/H] 0.25 dex. Additionally, chemical homogeneity due to the small scatter of only about 0.01 dex for several elements coupled with the purported contemporaneous formation of the member stars led to their conclusion that this MG originated from a dispersed star forming event (see also Antoja et al., 2008). However, the main objective of the work of De Silva et al. (2007) was to perform a differential abundance study relative to the reference star HR 1614 in order to gauge the abundance scatter with respect to the measurement errors. Accordingly, only a brief discussion of the ages and kinematics of the stars was given, and the group’s overall abundance patterns were also not placed in the broader picture of the underlying MW components. Similarly, while Kushniruk et al. (2020) identified a large number of member candidates with this MG, no detailed chemo-dynamic interpretation was carried out for those stars. In the present work, we aim to fill in this gap and to provide a detailed chemical abundance, age, and orbital analysis of a number of the HR 1614 MG’s member stars in order to connect it with the underlying MW components and to clarify its dynamic origin by resonant bar trapping.
This paper is organized as follows: in Sect. 2 we introduce the spectroscopic data. The abundance analysis is described in Sect. 3 and its results presented in Sect. 4. We derive stellar ages in Sect. 5, and in Sect. 6, the investigation of the group’s dynamics is performed before concluding with a discussion in Sect. 7.
2 Observations and data reduction
Six stars that are believed to be part of the HR 1614 MG were selected from the sample of De Silva et al. (2007). Our choice of those stars was simply based on their brightness and observability. Our sample was observed with the Magellan Inamori Kyocera Echelle (MIKE) spectrograph at the 6.5 m Magellan 2 Clay telescope at the Las Campanas Observatory in Chile during the night of October 16, 2016. Each star was observed over four to five individual exposures with exposure times of 30 to 300 s each to facilitate cosmic ray removal. The seeing was overall unstable, varying between 2.0 and 3.2. We chose the slit width of 0.5, yielding a resolving power of around 40000. The full wavelength range of the red arm of the spectrograph that we employ here is 4900–9500 Å. The signal-to-noise ratio for the bright targets ranges from 150 per pixel at shorter wavelengths to 300 per pixel in the red. The data reduction process followed standard procedures (Kelson et al., 2000; Kelson, 2003), including bias correction, flat fielding, scattered light removal, spectral extraction, radial velocity correction (see Sect. 6), and continuum normalization (see Koch-Hansen et al. 2021 for a data set procured in the same night and processed in the identical manner).
3 Abundance analysis
We performed a standard abundance analysis that is based on both equivalent width (EW) measurements and spectral synthesis, where appropriate. For the major part, we restricted the EW determinations to the wavelength range between 5000 and 6600 Å; redwards of 6600 Å, telluric absorption began hampering the measurements, whereas lines below 5000 Å become progressively blended, complicating the proper continuum placement in our metal-rich stars. We utilized the line list of Ruchti et al. (2013), which was constructed for stars of solar metallicity, and fitted Gaussian line profiles to the unsaturated lines with IRAF’s splot task.
| EP | EW [mÅ] | ||||||||
|---|---|---|---|---|---|---|---|---|---|
| Species | [Å] | [eV] | log | Hip 11575 | Hip 22336 | Hip 22940 | Hip 23311 | Hip 26834 | Hip 9353 |
| 26.0 | 5001.86 | 3.88 | 0.010 | 97 | 100 | 130 | 106 | 134 | 90 |
| 26.0 | 5044.21 | 2.85 | 2.038 | 81 | 76 | 93 | 144 | 88 | 75 |
We accounted for hyperfine splitting (chiefly for the Fe-peak elements), except for the weakest lines, using data from Johnson et al. (2006); Den Hartog et al. (2011); Mashonkina and Christlieb (2014); Lawler et al. (2015, 2019); Shi et al. (2018). A portion of our line list is given in Table 1.
Our study has 55 lines in common222Unfortunately, De Silva et al. (2007) do not list any EWs for their other stars, but only one object – HR 1614, which constitutes the reference star for their differential analysis. with the analysis of De Silva et al. (2007) of Hip 23311. From these, we find an excellent agreement in our EW measurements with a mean deviation of a mere (0.81.3) mÅ with a 1-scatter of 9.8 mÅ. The corresponding fractional error is as low as (22)% and the two largest outliers, by 30 mÅ (or 30–40%), are a Ni and a Mg line.
The actual abundance derivation was carried out following the overall methods used in, e.g., Koch and McWilliam (2014), with the MOOG abundance code (Sneden 1973; 2019 version), building on the 72-layer, one-dimensional, plane-parallel grid of ATLAS atmospheres with Solar-scaled opactiy distributions, ODFNEW (Castelli and Kurucz, 2003), under the assumption of Local Thermodynamic Equilibrium (LTE) for all species.
3.1 Stellar parameters
Initial values for the stellar effective temperature, Teff, were obtained from the and Geneva photometry of Paunzen (2022), where we used the reddening maps and extinction law of Schlafly and Finkbeiner (2011); Green et al. (2019) and applied the color-Teff-calibration of Ramírez and Meléndez (2005). One exception is Hip 23311, for which we resorted to the early photometry of Eggen (1977). For the surface gravity, log , we commenced with the canonical stellar relation from the stars’ temperature, dereddened magnitude, distance (in turn based on Gaia parallax, Bailer-Jones et al. 2018), and mass. The microturbulent velocity, , was initially set to 1.5 km s-1, an initial mass of 0.8 M⊙ was adopted (see also De Silva et al. 2007), and we started from Solar metallicities.
As the next step, Teff was refined by using about 100 iron lines and balancing out the abundance with respect to the excitation potential. Simultaneously, was adapted until the iron abundance showed no trend with the reduced width RW. The stellar surface gravities were then derived by imposing ionization equilibrium between Fe i and Fe ii lines. All parameters were thus iterated towards convergence, where we used the last derived iron abundance from the neutral lines as input to the next iteration’s metallicity. In all this, too strong and very weak lines with RWs above 4.5 and below 5.5 were culled from the analysis. The final stellar parameters used for the remainder of this study are listed in Table 2.
| ID | Teff(spec) | Teff() | vmic | [Fe/H] | ||||
|---|---|---|---|---|---|---|---|---|
| Nr. | (Hip) | V0 | [K] | [K] | log | [km s-1] | dex | |
| 1 | 11575 | 7.93 | 0.395 | 5900 | 5733 | 3.70 | 1.15 | 0.20 |
| 2 | 9353 | 5.81 | 0.349 | 6100 | 6279 | 3.95 | 1.10 | 0.32 |
| 3 | 22336 | 5.37 | 0.373 | 5900 | 6468 | 3.90 | 0.80 | 0.30 |
| 4 | 22940 | 8.29 | 0.524 | 5300 | 5188 | 4.33 | 0.40 | 0.17 |
| 5 | 23311 | 6.01 | … | 4850 | … | 4.23 | 0.90 | 0.13 |
| 6 | 26834 | 7.15 | 0.477 | 5575 | 5876 | 4.20 | 0.60 | 0.38 |
3.2 Differential analysis
A differential analysis relative to a reference star of similar parameters often proves useful to alleviate systematics in abundance determinations, mainly in terms of uncertain values and the adopted parameter scales (Fulbright et al., 2006; Koch and McWilliam, 2008). We investigated this option for our study with a line-by-line differential analysis relative to the Sun, exemplified for star Hip 22336, with its parameters closest to the Sun. To this end, we employed the Solar line list from Fulbright et al. (2006) and measured the same lines in the target star. Solar parameters were adopted from Fulbright et al. (2006), namely (Teff, log , v = (5770 K, 4.44 dex, 0.93 km s-1). In order to recover excitation and RW balances of the line-by-line differences , the “absolute” parameters for this star (see above and Table 2) had to be altered, albeit to within their uncertainties. The resulting differential parameters for Hip 22336 are thus (Teff, log , v = (5930 K, 4.12 dex, 1.10 km s. Likewise, we find a differential Fe-abundance slightly lower, at 0.230.01 dex, for both neutral and ionized species. Given the broad mix of parameters across the sample and since the results are in broad agreement, we will not pursue this method any further.
3.3 Error analysis
An order of magnitude for the statistical 1-error on Teff and vmic was estimated by adjusting these parameters until the slopes of the Fe-abundance were still within the 1-scatter in the excitation potential and RW-diagrams, respectively. This yields formal uncertainties of 30 K and 0.1 km s-1. Moreover, we note that the mean deviation between the spectroscopic and photometric temperatures is 33115 K, which alters the abundance results only marginally. While agreeing very well on average, the 1-scatter in the comparison with the Teff-scale of De Silva et al. (2007) is larger, at 160 K. In the following, we will adopt a representative temperature uncertainty of 100 K on our measurements. Likewise, the star-by-star comparison with the literature values reveals a fair agreement between the gravities with the literature values being higher by 0.25 dex at a 1-scatter of 0.14 dex. Finally, the microturbulent velocities are broadly in agreement with those of De Silva et al. (2007), with a spread of 0.19 km s-1.
The main sources for statistical abundance errors are from the measurements of EWs per continuum placement and the number of used lines, . Therefore, we state on our following results the statistical errors via the standard deviation of the abundance values and the number of used lines.
Systematic errors, in turn, were derived by varying every stellar parameter about its uncertainty (estimated above) individually, computing new abundances and noting the difference to the unperturbed values. Furthermore, an additional analysis with -enhanced model atmospheres (AODFNEW) was performed, thereby mimicking a halo-like [/Fe] ratio of 0.4 dex, which reflects our ab initio ignorance of the stars’ -abundances. The final systematic error is calculated from the squared sum of those differences. However, this should be considered as an upper limit, since cross-terms between stellar parameters were not taken into account (McWilliam et al., 1995). The results are given in Table A.1 in the appendix, for the example of target star Hip 11575.
4 Abundance results
The results of the chemical abundance analysis for the entire sample are presented in Table A.2 in the appendix, where abundances from ionized species are given relative to ionized iron, and neutral species relative to Fe i. Throughout, we adopted the Solar abundances from Asplund et al. (2009). In the following, our measurements are placed in context with the Galactic thin and thick disks, with the literature data indicated in the respective captions (Figs. 1–7). We also note that all literature abundances are reported in LTE unless noted otherwise.
4.1 Iron
All in all, the iron abundance is supersolar for all stars with a mean of 0.25 dex and a 1-scatter of 0.09 dex. This lies well above the typical spread in a given cluster or formerly coherent and now defunct structure, which tend to have intrinsic spreads well below 0.02 dex for most elements (Sinha et al., 2024), and again argues against the HR1614 MG being a dissolved star cluster (Kushniruk et al., 2020; Li et al., 2025a). For our stars, the values are in excellent agreement to within 0.10 dex with those of De Silva et al. (2007), differing only by 0.14 dex for the eponymous HR 1614 (Hip 23311). The latter star had been analysed by Antipova and Boyarchuk (2016), who found it to be rather “anomalous” in the sense of its stellar parameters strongly differing between photometry and spectroscopy, also noting several apparent abundance anomalies. This finding led those authors to conclude that Hip 23311 is a red dwarf with strong, solar-like atmospheric activity. We also note that, per construction, ionization balance is fulfilled in the stars, with a mean [Fe i/ii] ratio of 0.000.01 dex.
4.2 Light elements: C, O, Na, Al, K
We determined the carbon abundance in all six stars from the two atomic lines at 5380 and 6587 Å. Corrections for Non-LTE (NLTE) were interpolated from Amarsi et al. (2019) and are typically less than 0.1 dex. Our stars lie, within the uncertainties, on the roughly flat trend delineated by similar MW field stars at Solar to supersolar metallicities. Here, and in many other elements discussed below, Hip 23311 is an outlier with a carbon-enhancement of 0.3 dex.
Oxygen abundances are based on the triplet lines around 7774 Å. Contrary to carbon, the [O/Fe] ratios are prone to large NLTE corrections. In Fig. 1, we show our results together with the uncorrected (left panels) disk star sample of Amarsi et al. (2019, and references therein) and their sample after applying their 3D-NLTE corrections (right panel; see also Sitnova et al. 2013; Steffen et al. 2015). In either case, the HR 1614 MG stars are fully consistent with the thin disk trend, even tighter in the corrected case, with the exception of Hip 23311, which shows an enhancement of [O/Fe]0.2 dex. This value is in agreement with the higher- sequence that is populated by thick disk stars (e.g., Franchini et al., 2021). We note that, despite this star’s still relatively high metallicity of 0.1 dex, it is the most “metal-poor” object in our sample.


Fig. 2 shows the abundance ratios of the remaining light elements with literature data for MW disk stars as indicated in the caption. Na abundances were derived from the line pairs at 5682 and 6154 Å.

Most stars follow the disk trends for metal-rich stars, even more so after adjusting the abundances by 0.1 dex for each star to account for the NLTE corrections implied by Lind et al. (2011). We determined the aluminium abundances of our stars from the moderately strong 6696, 6698, and 7835 Å lines, and determined small NLTE corrections (Nordlander and Lind, 2017). For potassium, only one line at 7698 Å was useable, which was not hampered by the overlapping telluric A-band. Also for K, our sample is fully in line with disk stars from the literature (Takeda et al., 2002). The latter work’s NLTE corrections lower the [K/Fe] ratios to the Solar level over a broad range in metallicity; similar results are achieved when using the corrections of Reggiani et al. (2019). In all these elements but K, Hip 23311 stands out in that it has enhanced abundance ratios.
4.3 -elements: Mg, Si, S, Ca, Ti
The abundance results for the -elements are chiefly based on standard line lists and procedures as in our previous works. The element sulfur, less studied, was analyzed by synthesizing the M6 and M8 multiplets, using line data from Caffau et al. (2005). Fig. 3 shows our abundance ratios on the trends for MW thin and thick disk stars, with reference data from Caffau et al. (2005) and Bensby et al. (2014).

For completeness, we investigate the effects of NLTE on all elements in this group using line-by-line data for Mg (Bergemann et al., 2017), Si (Bergemann et al., 2013), Ca (Mashonkina et al., 2007), and Ti (Bergemann, 2011). The corrections for sulfur are small in Solar type stars (Amarsi et al., 2025), but also strongly hinge on the treatment of the cross section of hydrogen collisions (Koch and Caffau, 2011). All NLTE-corrected values are indicated as open red circles in Fig. 3 and the following figures.
One point to note are the error bars for Mg (top panel of Fig. 3). Magnesium lines are typically very strong, especially the ones near 5528 Å and 5711 Å. In order to assess the risk of possible saturation, we synthesized those two lines, noting the effect that varying abundances had on the line fit. The poorest result was thus obtained for the most metal-rich star in our sample, Hip 26834. Overall, the [/Fe] ratios agree well with the underlying disk trends, again with the exception of Hip 23311. Similarly, the largest scatter over the metallicity range covered by our small sample is seen for Ti (bottom panel of Fig. 3). We note, however, that this is again driven by the two most metal-poor stars in our sample that show [Ti/Fe] ratios enhanced to 0.3 and 0.2 dex above the, otherwise, Solar ratios in our stars.
In order to emphasize the contrast in our data, we show in Fig. 4 the straight average over the four main -elements Mg, Si, Ca, and Ti, disregarding differences in their nucleosynthetic formation details due to their hydrostatic or explosive nature (Woosley and Weaver, 1995; Venn et al., 2004).

All but one star match the literature values for metal-rich thin disk stars. As before, it is Hip 23311 (and, to a lesser extent, Hip 26384) that deviates from the Solar (averaged) abundance ratios and rather follows the rising trend of the higher- stars in the thick disk. Thus our chemical evidence so far shows that there is a mixed origin of the HR 1614 MG of both thin and thick disk stars. Indeed, large local samples show chemically thick disk stars among the kinematically thin disk population, and vice versa (e.g., Bensby et al. 2014; McWilliam 2016; and Sect. 6.2). In this regard, Hip 23311 and Hip 26384 are not unusual. However, the iron abundance for Hip 23311 in our work is lower by 0.2 dex compared to the value reported by De Silva et al. (2007).
4.4 Fe-peak elements: Sc, V, Cr, Mn, Co, Ni, Cu
In Figs. 5 and 6 we show our results for the Fe-peak results in comparison with literature data as indicated.

None of Sc, V, and Ni were corrected for departures from LTE (Nissen et al., 2024). The elements Sc, V, and Cr exhibit trends that are in line with the underlying MW distribution. Here, the [Sc/Fe]-ratios are very close to typical MW stars for their [Fe/H]. While Type Ia Supernovae (SNe Ia; including those at sub-Chandrasekhar mass) tend to under-produce Sc in the thick disk, the [Sc/Fe] ratios are enhanced, often in lockstep with the elevated -levels found in systems with enhanced SNe II ejecta (e.g., Prochaska et al., 2000). Thus, the solar-like [Sc/Fe] ratios in the HR 1614 MG stars suggest a similar SNe II/Ia ratio as in the Solar neighborhood. The same trend is visible for [V/Fe], albeit noisier, which is mainly driven by Hip 23311, but a similar scatter is seen in the values reported for disk stars in the literature.
For Cr, we applied NLTE corrections for those lines with available data (Bergemann and Cescutti, 2010). However, those corrections largely average out amongst the used lines for our targets, and the only discernible result is a slightly increased line-to-line scatter for each star.

At their supersolar metallicities, the [Mn/Fe] ratios of our stars start turning over from the Galactic trend of increasing Mn-abundance with increasing [Fe/H] (Mishenina et al., 2015) towards mostly sub-Solar ratios (top panel of Fig. 6). Here, we also show NLTE-corrected values from the line-by-line prescriptions of Bergemann and Gehren (2008), which lower the Mn abundance ratio by 0.05 dex.
In the plot for [Co/Fe], one sees the same behavior as for the other Fe-peak elements in comparison with Galactic stars. As for other elements, Hip 23311 stands out with its elevated abundance, while Hip 9353 also displays an enhancement, albeit with a larger error bar due to the use of only two lines with significantly differing EWs. For all measurements, we have applied the NLTE corrections from Bergemann et al. (2010), on the order of 0.05–0.1 dex, with the corrected values indicated in Fig. 6.
It is noticeable that the Mn/Fe, Co/Fe (and possibly Zr/Fe and V/Fe) ratios show downward trends with increasing [Fe/H], even if Hip 23311 was removed from the reasoning. This is unlikely a measurement artifact, since proper treatment of the hyperfine splitting was applied, and, despite Cu i also suffering strongly from that effect, [Cu/Fe] is reasonably well behaved in our sample. This would suggest that this trend in our sample of metal-rich stars cannot be due to different dilutions of SNe ejecta with different amounts of pure hydrogen. It rather indicates changing average yields with increasing metallicity in a chemically evolving system.
Our work provides the first measurements of Cu in stars of this MG. To this end, three useful lines (at 5105, 5700, and 5782 Å) were present in the spectra, with EWs typically on the order of 100 Å. To determine the [Cu/Fe] ratio, we resorted to synthesizing those lines. Their NLTE corrections are small (Caliskan et al., 2025) and barely discernible in Fig. 6. At their slightly supersolar values, all stars (but one, Hip 22336) nicely follow the trend outlined by Galactic disk stars (Mishenina et al., 2011; Delgado Mena et al., 2017). We note that the lower-Cu star Hip 22336 also shows the lowest [Mn/Fe] and [Co/Fe] ratios in our sample. As McWilliam et al. (2003) and McWilliam and Smecker-Hane (2005) showed, Cu-depletions are followed by deficiencies in [Mn/Fe] as well, which can be explained by low-metallicity SNe Ia and metallicity dependent (SNe Ia and SNe II) yields. However, those studies focused on the Sagittarius (Sgr) dwarf galaxy and neither our Cu- and Mn-depletions are as pronounced as in the lower-metallicity Sgr-stars.
Finally, Ni invariably traces iron as is expected given their lockstep production in regular Chandrasekhar-mass SNe Ia (e.g., Woosley and Weaver, 1995; Kobayashi et al., 2020). Li et al. (2025a) used abundances from the APOGEE and GALAH surveys to argue for a “low alpha thin disc” HR 1614 subgroup to be enhanced in Na, Al, V, and Ni, while the enhancements we find here are mainly pertaining to those stars with a more likely thick disk origin.
4.5 Heavy elements: Y, Zr, Ba, La, Eu
In Fig. 7 we show the neutron-capture elements we measured in our stars.

The [Y/Fe] ratio of our stars, derived from spectral synthesis, is perfectly in line with the distribution in the disk, showcasing its origin in a standard, slow (-) neutron capture process (e.g., Busso et al., 1999; Tautvaišienė et al., 2021). The usual contender for an outlying abundance is Hip 23311 with an overabundance of 0.4 dex. This is also observed for Zr, where we find, however, that the three most metal-rich stars are depleted with respect to the remainder of metal-rich disk stars. We assessed NLTE-corrections on Zr by comparison with Zhao et al. (2016) and estimate departures of 0.1 dex only for the three warmer stars in our sample, with null corrections otherwise.
The Ba-abundances in our stars are in very good agreement with the Ba-determination of De Silva et al. (2007) and with those in metal-rich disk stars. Also the EWs for star Hip 23311 agree excellently with their measurements with a mean deviation of mÅ for the three lines in common. For reference, we indicate in Fig. 7 Ba-values corrected for NLTE by using the line-by-line departures given by Gallagher et al. (2020), albeit for the Sun. In turn, a broad range in [La/Fe] ratios is found from rather weak lines in our stars, with values lying above the disk trend by 0.4 dex.
Finally, the Eu abundances align very well with the results from De Silva et al. (2007), despite being based on only one line at 6645 Å. NLTE-corrections are very small in the parameter space of Teff and [Fe/H] of our stars (Zhao et al., 2016) and we do not show them any further in Fig. 7. In particular, five of our six stars are fully consistent with the MW disk, while Hip 22336 is depleted by dex. This is particularly noteworthy, as this star was already shown to have systematically lower abundances of Mn, Co, and Cu compared to the remainder of our sample.
Our results indicate a high -ratio in excess of 0.8 dex (taken here as the average of Ba and La relative to Y and Zr; listed in Table A.2), which normally is indicative for -processing in metal-poor Asymptotic Giant Branch (AGB) stars (e.g., Busso et al., 1999), due to the larger ratio of neutrons per Fe-seed nucleus driving the synthesized elements to high mass numbers. However, in our sample we see high -ratios at high metallicity, contrary to this expectation. This may be due to a higher, total neutron exposure in the polluting AGB stars. The usual deviant from this trend is Hip 23311 with a -ratio well below zero.
4.6 Intrinsic abundance spreads
Smith (1983) used DDO photometry for 19 of the originally confirmed (26) metal-rich member stars of the HR 1614 MG and discovered anomalies in the sense of a large number of CN-rich stars. On the one hand, this finding cemented the original proposition of Eggen (1978) of the physical association of the purported group’s stars. However, Smith (1983) argued from the then-available kinematics that those stars cover a broad range of orbits, with peri- and apocenter radii of 6.5–10.4 kpc, and therefore must have formed in a region of larger extent than a typical (open) cluster. Reasoning from their CN-enhancements within the framework of a Galactic abundance gradient in the old disk, they stated that spatial and temporal heterogeneities are likely to occur in the region within the disk where those stars have formed.
In order to quantify the intrinsic abundance spread for each element, we follow the probabilistic approach of Piatti and Koch (2018, in turn based on ). The resulting scatter , which also accounts for the measurement errors, is listed in the last column of Table A.2 in the appendix. Here, the scatter in Fe-abundance amounts to 0.09 dex alone, which is significant at the 3-level. The highest spread of 0.32 dex is found for Ti ii, while it is lower for neutral Ti and thus could indicate a systematic effect in the measurements or NLTE effects. Similarly large spreads of 0.25 dex are seen for Zr and C. The lowest value, in turn, is only found for the -elements S and Ca, which, at a mere 0.020.02 dex each are consistent with a homogeneous origin.
In conclusion, 21 out of the 27 abundances we measured show intrinsic spreads that are significantly above zero at least at the 2 level. This is in contrast to De Silva et al. (2007) who found a very low scatter in most elements from their sample of 18 group members. They stated an intrinsic scatter around 0.01–0.03 dex (at the 80% C.L.) for most of the studied elements. Coupled with the coetaneous ages of the group stated by De Silva et al. (2007), this chemical homogeneity was taken as evidence for the MG originating in an unperturbed, dispersed star-formation event. Our finding of significant intrinsic abundance spreads also bolsters previous results that the HR 1614 MG is not a dissolved open cluster (Kushniruk et al., 2020): in their sample of 26 open clusters, Sinha et al. (2024) determined very low spreads below 0.02 dex (at the 3-level) for most of the (20) measured elements from their APOGEE cluster sample, even though a different metric from ours was used. Exceptions to this lack of a dispersion were mainly found for the weak-lined neutron-capture elements, resulting in larger spreads of 0.2 dex.
The large abundance spreads seen in our analysis rather argue in favour of dynamical mixing events bringing in together stars from various environments, in particular, as MW stars tend towards chemical homogeneity to within 0.02 dex at a given Galactocentric radius (Ness et al., 2022). As we will also reason in Sect. 6, at least part of our sample has a thick disk origin.
5 Ages
While Feltzing and Holmberg (2000) obtained a single age of 2 Gyr with the possibility of some spread for the HR 1614 MG as an ensemble, Kushniruk et al. (2020) derived ages from an unprecedentedly large number of stars using Gaia photometry and photometric metallicities from the SkyMapper survey (Keller et al., 2007), but no comments on individual stars were made. Albeit our smaller sample size, we are in the fortunate situation of having precise and accurate abundance measurements that we use as an input for fitting isochrones in an effort to derive individual stellar ages of our targeted group members.
In practice, we estimated ages via fitting the suite of Dartmouth isochrones333These do not account for stellar rotation as our stars, at M1.3 M⊙ (De Silva et al., 2007), are likely not strongly affected by this effect. Switching to the PARSEC isochrones that include rotation above 1 M⊙ (Nguyen et al., 2022) has little impact on the ages derived here. (Dotter et al., 2008), tailored to each star’s individual metallicity, to the targets’ location in a color-magnitude diagram from Gaia photometry (Gaia Collaboration et al., 2023, see Fig. 8). To this end, we employed distances and extinctions from Bailer-Jones et al. (2018) and Queiroz et al. (2018), and the extinction law of Yang et al. (2023).

As Fig. 8 indicates, three stars of our sample lie below the age-sensitive main-sequence turn-off and the isochrone fits merely return the oldest age used in the grid. For the other MG member stars, we obtain ages of 3.00.8 Gyr (Hip 11575), 2.80.4 Gyr (Hip 9353), and 4.40.7 Gyr (Hip 22336), respectively. The stated age errors were based on the photometric and parallax errors provided by the Gaia Collaboration et al. (2023), and by accounting for a metallicity uncertainty of 0.1 dex. This leads to relative age errors on the order of 15–30% for the three reliable measurements.444We also employed the [Y/Mg] ratio as a a chemical clock, using the calibration of Casali et al. (2020) to estimate ages of 1.40.8 dex for Hip 11575, 9353, and 22336, and 2.41.0 Gyr for Hip 26384, while for the other two, no physically meaningful values could be determined.
The range of possible ages of the HR 1614 MG we find emphasizes the possibility that members of this group can indeed be older and diverse stars, which is in fact in line with Hufnagel and Smith (1994), who found from chromospheric activity indicators that their analysed stars in this MG are older than 3 Gyr. Previous estimates from canonical isochrone fitting, as we have employed here, have placed the age of this moving group at a slightly younger age of around 2 Gyr (Feltzing and Holmberg, 2000), although Kushniruk et al. (2020) assert that a broad age range with prominent peaks around 2 and 8 Gyr indicate stars of a multifarious disk origin within the MG.
We therefore summon up the same exercise as above for the bona fide sample from Feltzing and Holmberg (2000), bearing in mind that their metallicity scale from Strömgren photometry and, for a handful stars, [Fe/H] from spectroscopic measurements from the literature, will be different from ours, which poses a possible cause for systematic offsets. As before, we obtained those stars’ photometry and parallaxes from the Gaia Collaboration et al. (2023). The resulting age distribution is shown in Fig. 9.

As a considerable fraction of the stars lie below the respective turn-offs on the rather age-insensitive main sequence, we also constructed the same histogram for stars brighter than the (arbitrary) limit of M mag. It becomes immediately obvious, as also implied by the color-magnitude distribution of the sample, that the stars in this group span a large range of ages. The strong peak at the youngest ages (most strongly visible in the full distribution shown in gray in Fig. 9) can be attributed to the limit of our fitted isochrone grid and therefore represents an artifact. Nonetheless, each distribution shown in Fig. 9 displays clear maxima of up to 2 and at 3.5 Gyr. Further peaks at 5 Gyr and above 6.5 Gyr are also discernible, though less pronounced.
Most likely is a coincidence of this dynamical group with the interaction with the Galactic bar, which we explore in greater detail in the next Section 6. The bar can have already formed early on with a steep cessation in star formation as, e.g., found from studies of its supermetal-rich populations (Nepal et al. 2024; see also Sanders et al. 2024). A too young age of the bar itself is dynamically not feasible or likely (e.g., Debattista et al., 2019; Anderson et al., 2024).
6 Dynamics
Radial velocities were derived using a cross-correlation of the spectra against a synthetic spectrum using IRAF’s fxcor task (Tonry and Davis, 1979), where we restricted our measurements to the less-blended wavelength region of 5700–6400 Å. The resulting velocity uncertainties are on the order of 0.1 km s-1. Our derived velocities are in good agreement with those from the literature (De Silva et al. 2007; Feltzing and Holmberg 2000, and references therein), with an average difference of km s-1. Slightly larger deviations are only found for Hip 23311 and Hip 26834, for both of which Feltzing and Holmberg (2000) reported velocities larger by 6–7 km s-1 than our and De Silva’s (2007) values. Furthermore, proper motions were taken from the third data release of Gaia (Gaia Collaboration et al., 2023), along with distances, extinctions and reddening corrections from Bailer-Jones et al. (2018) and Queiroz et al. (2018). The observed and derived properties of our sample are detailed in Table B.1 in the appendix.
6.1 Orbit integration
With a bar resonance being a strong contender for having stirred up stars into their dynamical coherence, particular care has to be applied to the potential of that particular MW component.
Thus, we used the AGAMA package (Vasiliev, 2019) together with the MW potential model of Hunter et al. (2024). This model provides a self-consistent non-axisymmetric description of the inner Galaxy. The potential includes the central black hole, the nuclear star cluster, the nuclear stellar disk, and the dark halo in an axisymmetric multipole component, while the bar, thin and thick stellar disks, and the gas disks are represented by a triaxial CylSpline555Here, CylSpline refers to AGAMA’s cylindrical-spline representation of the potential, in which the radial and vertical dependence is tabulated on a cylindrical grid and the azimuthal structure is represented by Fourier harmonics. component.
The bar rotates clockwise in the Galactocentric plane, i.e. in the same sense as Galactic disk rotation in the adopted AGAMA convention; throughout this work we quote the absolute value of the pattern speed, with a pattern speed of and is oriented at an angle of with respect to the Sun–Galactic-centre line.
For the analysis presented here we used the rotating version of the model without spiral arms. For comparison, we also tested the corresponding rotating model including spiral arms. The optional spiral component in the Hunter et al. model is implemented as a separate, more slowly rotating CylSpline perturbation. It is constructed from two phase-shifted logarithmic spiral sets and represented with azimuthal harmonics up to . For the six stars, the inclusion of the spiral component only has an insignificant impact on the derived parameters: the pericentres change by at most kpc, apocentres by kpc, eccentricities by , and by kpc. These correspond to relative changes below for the orbital radii and less than for .
For each star, the observed phase-space coordinates were transformed into a Galactocentric frame assuming kpc, pc, and a solar velocity of . The resulting Cartesian coordinates and velocities were then rotated into the bar frame before orbit integration. Orbits were integrated for 5 Gyr using the rotating Hunter et al. potential and sampled with trajectory points. From the resulting trajectories we derived pericentres, apocentres, eccentricities, maximum vertical excursions, angular momenta, and energies. In addition, we computed the fundamental orbital frequencies in both the inertial and the bar-rotating frame.
Uncertainties in the derived orbital parameters were quantified with a Monte Carlo sampling procedure. For each star, we constructed a covariance matrix from the measured radial velocity, distance, and proper motions (, ), including the variances of the individual quantities and the covariance between the two proper-motion components. We then drew 1000 Monte Carlo realisations per star. For each realisation, the full coordinate transformation, rotation into the bar frame, orbit integration, and frequency determination were repeated. The reported orbital quantities are the median values of the Monte Carlo realisations, while the 16th and 84th percentiles are used as a robust uncertainty interval.
6.2 Orbital parameters
The estimated orbital parameters of our stars and their uncertainties are listed in Table B.1, and illustrations of the orbits in the restframe of the bar are shown in Fig. B.1, each in the appendix.
All six orbits remain confined close to the Galactic mid-plane in the rotating potential. The maximum vertical excursions span – kpc. Hip 22336 reaches the largest height above the plane, kpc, whereas Hip 22940 and Hip 23311 remain very close to the plane, with and kpc, respectively.
The overall structure of the orbits is remarkably homogeneous. Apocentres cluster tightly around kpc, with a full range of only kpc, while pericentres are found around kpc, spanning kpc. This yields eccentricities in the narrow interval – for all six stars. The most eccentric orbit is that of Hip 22336, with , which is also the star with the smallest pericentre, kpc. The orbital periods about the Z-axis are also nearly identical, at – Gyr. We note that this coincides with the period of the bar for our assumed pattern speed of , so that in the rotating frame of the bar the Jacobi integral (, also listed in Tab. B.1) is approximately conserved and all six stars occupy a very narrow range in .
The angular momenta and present-day azimuthal velocities are also very similar across the sample. In the sign convention of the present integration, the prograde orbits have positive angular momenta, with – kpc km s-1. Hip 22336 is the kinematically warmest object in the sample, with the lowest , the lowest , the largest vertical excursion, and the largest eccentricity.
In the local velocity plane (Fig. 10), the MG members also form a compact, though tilted sequence at km s-1 that follows and slightly extends the group as selected by Feltzing and Holmberg (2000).

The Toomre diagram (Fig. 11) reinforces the formation picture of the HR 1614 MG. For each star this shows its Galactic rotational component () against the vertical and radial deviations thereof, i.e., . Five of our target stars lie in the thin–disk locus with modest and mildly lagging . Hip 22336 is a clear kinematic outlier, placing it on the transition band toward the thick disk. This behavior is consistent with its larger , lower , and higher . Overall, the distribution of our analyzed stars overlaps the locus of literature HR 1614 MG members from Feltzing and Holmberg (2000), yet Hip~22336 sits near the upper edge of that cloud together with a subgroup of another dozen of stars with rather thick disk kinematics.

Thus, about two thirds of the MG stars considered here are compatible with thin-disk stars, while the remainder, and markedly Hip 22336, is found at a higher deviation from the circular VLSR-component (i.e., high ), and located toward thick-disk stars. We thus ascertain a dynamical admixture from the thick disk during the resonant formation of this MG, as also indicated by the advanced age of those stars. Additionally, the elevated Zmax and eccentricity of such stars, in particular Hip 22336, are an indicator of a fraction of the HR 1614-group stars coming from the thick disk. The star with the strongest thick-disk like chemical evidence, however, is kinematically closer to the thin disk. This is in line with the existence of kinematically thick disk stars among the chemically thin disk population, and vice versa. As argued from the chemical analysis above (Sect. 4.3) this makes star Hip 22336 (with thin-disk abundances and thick-disk dynamics) a common representative of the chemodynamic crucible of this MG (see also McWilliam 2016; their Fig. 2). Finally, we note that the inclusion of the bar in the potential on top of a regular, axisymmetric potential (e.g., McMillan, 2017) results in a decrease of the mean Galactocentric radii of the stars (as detailed in Appendix B and Table B.2), highlighting the importance of the bar for inducing significant orbital changes.
6.3 Orbital resonances
Figure 12 shows a frequency map for our MG stars against a large comparison sample of 4.6 disk stars from GALAH DR4 (Buder et al., 2025). We computed the three fundamental orbital frequencies, , , and , which characterize the radial epicycle, the mean azimuthal rotation, and the vertical oscillation of an orbit (e.g. Binney and Tremaine, 2008). In the inertial frame our adopted MW mass model is time dependent, whereas in the frame corotating with the bar at constant pattern speed it is time independent (i.e., steady). In either case, resonant lines appear as straight loci in the plane (Valluri et al., 2010, 2016; Bovy, 2026). Frequencies were measured from the integrated phase–space time series with the naif Python package, which implements the Numerical Analysis of Fundamental Frequencies (NAFF) algorithm (Laskar, 1993; Valluri and Merritt, 1998; Beraldo e Silva et al., 2023). This spectral approach robustly recovers the dominant quasi–periodic components and is well suited to highlight bar resonances as straight loci in frequency–ratio space (Monari et al., 2019).

We integrated the orbits in our adopted MW potential and determined the inertial-frame frequencies . For a rotating bar with pattern speed , we transformed these to the bar-frame by subtracting the pattern rotation from the azimuthal angle and the corresponding velocity field, which then allowed us to re-measure the bar-frame frequencies . As a consistency check we verified that to within numerical tolerance. In Fig. 12, we show the dimensionless ratios and , which compactly encode in–plane and vertical frequency information (Binney and Tremaine, 2008; Monari et al., 2019). For the six stars analysed in this work, the plotted quantities are based on the same Monte Carlo realisations used for the orbital parameters.
In a rotating non-axisymmetric potential the general resonance condition is , with integers . For a bisymmetric bar , , in–plane resonances appear at corotation () and as the ILR and OLR, respectively (). Vertical families , in turn, map to straight lines and generate the fan of thin slanted ridges in the background distribution of Fig. 12, where the vertical oscillation frequency is commensurable with the combination of radial and azimuthal motion. In our fully three-dimensional non-axisymmetric MW potential several low-order families overlap in frequency space, so individual ridges are blends rather than pure resonances; we therefore only refer to them generically as vertical families.
The concentration of points along the CR line and the clarity of the ILR/OLR bands are a direct consequence of using a dynamically consistent potential and a pattern speed matched to it: with a mismatched , the same stars would shear vertically (changing ) and the resonant ridges would blur (Dehnen, 2000; Monari et al., 2019). That the resonant structure emerges cleanly is therefore a useful validation of our choice of both potential and frequency-extraction method.
For context, we overplot in Fig. 12 a literature comparison set drawn from GALAH DR4 (Buder et al., 2025) following the best-practice recommendations of DR4 with and supplemented by conservative cuts (vsini, e_rv_comp_1).
Our six MG stars and all but three of the literature stars from Feltzing and Holmberg (2000) occupy a compact region in frequency space. They span approximately and lie very close to the CR line, with . We therefore interpret them as stars on CR rather than as members of other, distinct resonant families. The spread in reflects the different vertical orbital structure of the stars, consistent with the small but measurable differences in and eccentricity discussed above. We also note the the small values of the stars’ frequency drift666, where the three frequencies are evaluated in two separate parts (, ) over the orbits (Valluri et al., 2010)., at CR (see also Table B. 1), which indicates no significant chaotic behavior in their orbits.
In contrast, three Feltzing and Holmberg (2000) candidates below the CR line are offset to . In the same calculation they have larger absolute angular momenta, – kpc km s-1, and larger present-day azimuthal velocities, – km s-1, than the remainder of the sample. We regard them as a higher-angular-momentum extension of the original literature selection rather than as part of the very compact CR clump traced by our sample. Finally, we note that the above CR coordinate changes by less than upon including the spiral-arm potential, so our identification of the CR resonance remains unaffected.
The broad distribution of disk stars outlines well-known resonant ridges associated with the Galactic bar. Similar structures have been linked to the Hercules stream and other local MGs in both models and data (Dehnen and Binney, 1998; Dehnen, 2000; Monari et al., 2017, 2019). The alignment of our stars with the CR ridge then supports the interpretation that they belong to a resonantly influenced disk population.
7 Discussion and conclusions
Even though the entire HR 1614 MG contains a large number of candidates (Kushniruk et al., 2020), the six members studied here at high resolution and in great chemical detail offer a valuable insight into the origin of those stars. In particular, by accounting for a realistic potential of the rotating bar and from the ensuing frequency analysis, we established that the stars’ common motion originated from a CR resonance with the MW bar. Overall, our results are in very good agreement with the chemical abundance study of De Silva et al. (2007). Notably, Hip 23311 is chemically in line with a thick disk heritage, while Hip 22336, and possibly Hip 26834, are more closely kinematic members of the thick disk than the thin disk.
Numerous mechanisms can perturb any pre-existing population such as the MW disk(s). For instance, Minchev et al. (2009) investigated a merging dwarf galaxy, which can induce stream-like perturbations in the form of a “ringing” disk. The ensuing phase-space waves by such mergers rather constitute dispersed star formation events that would lead to chemical element spreads, leaving a chemical signature dissimilar from disrupted clusters (e.g., Kushniruk and Bensby, 2019). Crossings through the transient spiral arms also play a role in the formation of stream-like structures (Quillen et al., 2018a, b), although this interpretation is ruled out by the older HR 1614 MG.
The Galactic bar is responsible for the formation of many observed, coherent dynamical features (e.g., Dehnen, 2000; Trick et al., 2021; Wheeler et al., 2022). In particular, the bar is able to trap stars of any ages, so that any dynamical influence is not restricted to stars younger than the bar. Li et al. (2025b, a) performed a chemodynamical study from archival APOGEE and GALAH data of the Hercules stream, of which the HR 1614 MG is a purported subgroup, adding further insight into the complex effects of resonant disk-stirring.
The six stars studied here can only graze the surface of understanding the origin of the large dynamical groups. Therefore it is imperative to also exploit the ongoing or upcoming large spectroscopic surveys to sample their grand abundance space, such as offered by the 4MOST, MOONS, WEAVE, or SDSS-V Skymapper campaigns (Cirasuolo et al., 2011; de Jong et al., 2012; Kollmeier et al., 2017; Bensby et al., 2019; Gonzalez et al., 2020).
Acknowledgements.
We are grateful to J. Bovy, E. Caffau, W. Dehnen, and S. Reffert for helpful discussions. This research made use of atomic data from the INSPECT database (www.inspect-stars.com).References
- The solar sulphur abundance in view of large-scale atomic structure calculations and 3D non-LTE models. A&A 703, pp. A35. External Links: Document, 2509.05225, ADS entry Cited by: §4.3.
- Carbon, oxygen, and iron abundances in disk and halo stars. Implications of 3D non-LTE spectral line formation. A&A 630, pp. A104. External Links: Document, 1908.10319, ADS entry Cited by: Figure 1, §4.2, §4.2.
- The interplay between accretion, downsizing, and the formation of box/peanut bulges in TNG50. MNRAS 527 (2), pp. 2919–2939. External Links: Document, 2302.12788, ADS entry Cited by: §5.
- Elemental abundances in atmospheres of cool dwarfs with solar-like activity. Astronomy Reports 60 (1), pp. 145–162. External Links: Document, ADS entry Cited by: §4.1.
- Origin and evolution of moving groups. I. Characterization in the observational kinematic-age-metallicity space. A&A 490 (1), pp. 135–150. External Links: Document, 0809.0511, ADS entry Cited by: §1.
- The Chemical Composition of the Sun. ARA&A 47, pp. 481–522. External Links: 0909.0948, Document, ADS entry Cited by: §4.
- Estimating Distance from Parallaxes. IV. Distances to 1.33 Billion Stars in Gaia Data Release 2. AJ 156 (2), pp. 58. External Links: Document, 1804.10121, ADS entry Cited by: §3.1, §5, §6.
- The origin and evolution of the odd-Z iron-peak elements Sc, V, Mn, and Co in the Milky Way stellar disk. A&A 577, pp. A9. External Links: 1502.01152, Document, ADS entry Cited by: Figure 5, Figure 6.
- 4MOST Consortium Survey 4: Milky Way Disc and Bulge High-Resolution Survey (4MIDABLE-HR). The Messenger 175, pp. 35–38. External Links: Document, 1903.02470, ADS entry Cited by: §7.
- Elemental abundance trends in the Galactic thin and thick disks as traced by nearby F and G dwarf stars. A&A 410, pp. 527–551. External Links: Document, ADS entry Cited by: Figure 11.
- Exploring the Milky Way stellar disk. A detailed elemental abundance study of 714 F and G dwarf stars in the solar neighbourhood. A&A 562, pp. A71. External Links: 1309.2631, Document, ADS entry Cited by: §1, Figure 2, Figure 3, Figure 4, Figure 5, Figure 6, Figure 7, §4.3, §4.3.
- Orbital Support and Evolution of Flat Profiles of Bars (Shoulders). ApJ 955 (1), pp. 38. External Links: Document, 2303.04828, ADS entry Cited by: §6.3.
- Chromium: NLTE abundances in metal-poor stars and nucleosynthesis in the Galaxy. A&A 522, pp. A9. External Links: 1006.0243, Document, ADS entry Cited by: §4.4.
- NLTE abundances of Mn in a sample of metal-poor stars. A&A 492 (3), pp. 823–831. External Links: Document, 0811.0681, ADS entry Cited by: Figure 6, §4.4.
- NLTE analysis of CoI/CoII lines in spectra of cool stars with new laboratory hyperfine splitting constants. MNRAS 401, pp. 1334–1346. External Links: 0909.2178, Document, ADS entry Cited by: Figure 6, §4.4.
- Non-local Thermodynamic Equilibrium Stellar Spectroscopy with 1D and ¡3D¿ Models. I. Methods and Application to Magnesium Abundances in Standard Stars. ApJ 847 (1), pp. 15. External Links: Document, 1612.07355, ADS entry Cited by: §4.3.
- Red Supergiant Stars as Cosmic Abundance Probes. II. NLTE Effects in J-band Silicon Lines. ApJ 764 (2), pp. 115. External Links: Document, 1212.2649, ADS entry Cited by: §4.3.
- Ionization balance of Ti in the photospheres of the Sun and four late-type stars. MNRAS 413 (3), pp. 2184–2198. External Links: Document, 1101.0828, ADS entry Cited by: §4.3.
- Galactic Dynamics: Second Edition. Princeton University Press. External Links: ADS entry Cited by: §6.3, §6.3.
- Direct Evidence for a Bar at the Galactic Center. ApJ 379, pp. 631. External Links: Document, ADS entry Cited by: §1.
- Dynamics and astrophysics of galaxies. Princeton University Press; in press, Princeton, NJ. Cited by: §6.3.
- The GALAH survey: Data release 4. PASA 42, pp. e051. External Links: Document, 2409.19858, ADS entry Cited by: §6.3, §6.3.
- Nucleosynthesis in Asymptotic Giant Branch Stars: Relevance for Galactic Enrichment and Solar System Formation. ARA&A 37, pp. 239–309. External Links: Document, ADS entry Cited by: §4.5, §4.5.
- Sulphur abundance in Galactic stars. A&A 441 (2), pp. 533–548. External Links: Document, astro-ph/0507030, ADS entry Cited by: Figure 3, §4.3.
- Revisiting inelastic Cu + H collisions and the non-LTE Galactic evolution of copper. A&A 696, pp. A210. External Links: Document, 2503.22566, ADS entry Cited by: Figure 6, §4.4.
- Two stellar components in the halo of the Milky Way. Nature 450, pp. 1020–1025. External Links: 0706.3005, Document, ADS entry Cited by: §1.
- The Gaia-ESO survey: the non-universality of the age-chemical-clocks-metallicity relations in the Galactic disc. A&A 639, pp. A127. External Links: Document, 2006.05763, ADS entry Cited by: footnote 4.
- New Grids of ATLAS9 Model Atmospheres. In Modelling of Stellar Atmospheres, N. Piskunov, W. W. Weiss, and D. F. Gray (Eds.), IAU Symposium, Vol. 210, pp. A20. External Links: astro-ph/0405087, ADS entry Cited by: §3.
- Resonance sweeping by a decelerating Galactic bar. MNRAS 500 (4), pp. 4710–4729. External Links: Document, 1912.04304, ADS entry Cited by: §1.
- MOONS: The Multi-Object Optical and Near-infrared Spectrograph. The Messenger 145, pp. 11–13. External Links: ADS entry Cited by: §7.
- Trojans in the Solar Neighborhood. ApJ 890 (2), pp. 117. External Links: Document, 1907.08484, ADS entry Cited by: §1.
- 4MOST: 4-metre multi-object spectroscopic telescope. In Ground-based and Airborne Instrumentation for Astronomy IV, Proc. SPIE, Vol. 8446, pp. 84460T. External Links: 1206.6885, Document, ADS entry Cited by: §7.
- Chemically Tagging the HR 1614 Moving Group. AJ 133 (2), pp. 694–704. External Links: Document, astro-ph/0610041, ADS entry Cited by: §1, §2, §3.1, §3.3, §3, §4.1, §4.3, §4.5, §4.5, §4.6, §6, §7, footnote 2, footnote 3.
- Formation, vertex deviation, and age of the Milky Way’s bulge: input from a cosmological simulation with a late-forming bar. MNRAS 485 (4), pp. 5073–5085. External Links: Document, 1805.12199, ADS entry Cited by: §5.
- Mass models of the Milky Way. MNRAS 294, pp. 429. External Links: astro-ph/9612059, Document, ADS entry Cited by: §6.3.
- The Effect of the Outer Lindblad Resonance of the Galactic Bar on the Local Stellar Velocity Distribution. AJ 119 (2), pp. 800–812. External Links: Document, astro-ph/9911161, ADS entry Cited by: §1, §6.3, §6.3, §7.
- Chemical abundances of 1111 FGK stars from the HARPS GTO planet search program. II. Cu, Zn, Sr, Y, Zr, Ba, Ce, Nd, and Eu. A&A 606, pp. A94. External Links: Document, 1705.04349, ADS entry Cited by: Figure 2, Figure 6, Figure 7, §4.4.
- Improved log(gf ) Values of Selected Lines in Mn I and Mn II for Abundance Determinations in FGK Dwarfs and Giants. ApJS 194 (2), pp. 35. External Links: Document, ADS entry Cited by: §3.
- The Dartmouth Stellar Evolution Database. ApJS 178, pp. 89–101. External Links: 0804.4473, Document, ADS entry Cited by: Figure 8, §5.
- Stellar groups. I. The Hyades and Sirius groups. MNRAS 118, pp. 65. External Links: Document, ADS entry Cited by: §1.
- Luminosities, Temperatures, and Kinematics of K-Type Dwarfs. ApJS 22, pp. 389. External Links: Document, ADS entry Cited by: §1.
- Intermediate-band photometry of late-type stars III. The Geneva Observatory (GO) photometric system.. PASP 89, pp. 706–715. External Links: Document, ADS entry Cited by: §3.1.
- Intermediate-band photometry of late-type stars. VII. The HR 1614 group of overabundant stars.. ApJ 222, pp. 203–208. External Links: Document, ADS entry Cited by: §1, §4.6.
- HR 1614 and the Dissolution of a Supercluster. AJ 104, pp. 1906. External Links: Document, ADS entry Cited by: §1.
- Moving Groups of Stars. In Galactic structure. Edited by Adriaan Blaauw and Maarten Schmidt. Published by the University of Chicago Press, A. Blaauw and M. Schmidt (Eds.), pp. 111. External Links: ADS entry Cited by: §1.
- The reality of old moving groups - the case of HR 1614. Age, metallicity, and a new extended sample. A&A 357, pp. 153–163. External Links: ADS entry Cited by: §1, Figure 8, Figure 9, §5, §5, §5, Figure 10, Figure 11, Figure 12, §6.2, §6.2, §6.3, §6.3, §6.
- The Gaia-ESO Survey: Oxygen Abundance in the Galactic Thin and Thick Disks. AJ 161 (1), pp. 9. External Links: Document, 2011.11473, ADS entry Cited by: §4.2.
- Keeping It Cool: Much Orbit Migration, yet Little Heating, in the Galactic Disk. ApJ 896 (1), pp. 15. External Links: Document, 2002.04622, ADS entry Cited by: §1.
- Abundances of Baade’s Window Giants from Keck HIRES Spectra. I. Stellar Parameters and [Fe/H] Values. ApJ 636 (2), pp. 821–841. External Links: Document, astro-ph/0510408, ADS entry Cited by: §3.2.
- A Number of nearby Moving Groups May Be Fragments of Dissolving Open Clusters. ApJ 915 (2), pp. L29. External Links: Document, 2106.11873, ADS entry Cited by: §1.
- Gaia Data Release 3. Summary of the content and survey properties. A&A 674, pp. A1. External Links: Document, 2208.00211, ADS entry Cited by: §5, §5, §5, §6.
- Observational constraints on the origin of the elements. II. 3D non-LTE formation of Ba II lines in the solar atmosphere. A&A 634, pp. A55. External Links: Document, 1910.03898, ADS entry Cited by: §4.5.
- New light on faint stars - III. Galactic structure towards the South Pole and the Galactic thick disc.. MNRAS 202, pp. 1025–1047. External Links: Document, ADS entry Cited by: §1.
- MOONS Surveys of the Milky Way and its Satellites. The Messenger 180, pp. 18–23. External Links: Document, 2009.00635, ADS entry Cited by: §7.
- APOGEE view of the globular cluster NGC 6544. MNRAS 504 (3), pp. 3494–3508. External Links: Document, 2104.05865, ADS entry Cited by: §1.
- A 3D Dust Map Based on Gaia, Pan-STARRS 1, and 2MASS. ApJ 887 (1), pp. 93. External Links: Document, 1905.02734, ADS entry Cited by: §3.1.
- Radial mixing and the transition between the thick and thin Galactic discs. MNRAS 388 (3), pp. 1175–1184. External Links: Document, 0805.1822, ADS entry Cited by: §1.
- MG II Chromospheric-Emission Dating of HR 1614 Moving-Group Stars. PASP 106, pp. 1068. External Links: Document, ADS entry Cited by: §5.
- The 4:1 outer Lindblad resonance of a long-slow bar as an explanation for the Hercules stream. MNRAS 477 (3), pp. 3945–3953. External Links: Document, 1803.02358, ADS entry Cited by: §1.
- Testing kinematic distances under a realistic Galactic potential: Investigating systematic errors in the kinematic distance method arising from a non-axisymmetric potential. A&A 692, pp. A216. External Links: Document, 2403.18000, ADS entry Cited by: Appendix B, Appendix B, §6.1.
- Chemical Compositions of Red Giant Stars in Old Large Magellanic Cloud Globular Clusters. ApJ 640 (2), pp. 801–822. External Links: Document, astro-ph/0512132, ADS entry Cited by: §3.
- The SkyMapper Telescope and The Southern Sky Survey. PASA 24 (1), pp. 1–12. External Links: Document, astro-ph/0702511, ADS entry Cited by: §5.
- The Evolution of Early-Type Galaxies in Distant Clusters. II. Internal Kinematics of 55 Galaxies in the z=0.33 Cluster CL 1358+62. ApJ 531, pp. 159–183. External Links: astro-ph/9908257, Document, ADS entry Cited by: §2.
- Optimal Techniques in Two-dimensional Spectroscopy: Background Subtraction for the 21st Century. PASP 115, pp. 688–699. External Links: astro-ph/0303507, Document, ADS entry Cited by: §2.
- The Origin of Elements from Carbon to Uranium. ApJ 900 (2), pp. 179. External Links: Document, 2008.04660, ADS entry Cited by: §4.4.
- Sulphur in the metal poor globular cluster NGC 6397. A&A 534, pp. A52. External Links: Document, 1108.6054, ADS entry Cited by: §4.3.
- Europium abundances in F and G disk dwarfs. A&A 381, pp. 500–506. External Links: astro-ph/0111119, Document, ADS entry Cited by: Figure 7.
- Detailed chemical abundance analysis of the thick disk star cluster Gaia 1. A&A 609, pp. A13. External Links: 1709.04022, Document, ADS entry Cited by: §1.
- A New Abundance Scale for the Globular Cluster 47 Tuc. AJ 135, pp. 1551–1566. External Links: 0802.2103, Document, ADS entry Cited by: §3.2.
- The chemical composition of a regular halo globular cluster: NGC 5897. A&A 565, pp. A23. External Links: 1403.1262, Document, ADS entry Cited by: §3.
- Kinematic and Chemical Constraints on the Formation of M31’s Inner and Outer Halo. ApJ 689, pp. 958–982. External Links: Document, ADS entry Cited by: §1.
- NGC 1261: An r-process enhanced globular cluster from the Gaia-Enceladus event. A&A 653, pp. A2. External Links: Document, 2104.11243, ADS entry Cited by: §2.
- SDSS-V: Pioneering Panoptic Spectroscopy. arXiv:1711.03234. External Links: 1711.03234, ADS entry Cited by: §7.
- In the thick of it: metal-poor disc stars in RAVE. MNRAS 436 (4), pp. 3231–3246. External Links: Document, 1310.1919, ADS entry Cited by: §1.
- The Bulge Radial Velocity Assay for RR Lyrae Stars (BRAVA-RR) DR2: A Bimodal Bulge?. AJ 159 (6), pp. 270. External Links: Document, 2004.11382, ADS entry Cited by: §1.
- The HR 1614 moving group is not a dissolving cluster. A&A 638, pp. A154. External Links: Document, 2005.05054, ADS entry Cited by: §1, §1, §4.1, §4.6, §5, §5, §7.
- Disentangling the Arcturus stream. A&A 631, pp. A47. External Links: Document, 1909.04949, ADS entry Cited by: §7.
- Frequency Analysis of a Dynamical System. Celestial Mechanics and Dynamical Astronomy 56 (1-2), pp. 191–196. External Links: Document, ADS entry Cited by: §6.3.
- Transition Probabilities of Sc I and Sc II and Scandium Abundances in the Sun, Arcturus, and HD 84937. ApJS 241 (2), pp. 21. External Links: Document, ADS entry Cited by: §3.
- Improved Co I log(gf) Values and Abundance Determinations in the Photospheres of the Sun and Metal-poor Star HD 84937. ApJS 220 (1), pp. 13. External Links: Document, ADS entry Cited by: §3.
- mw_plot: milky way plotting package. Note: https://milkyway-plot.readthedocs.io/en/stable/Accessed 2025-11-11 Cited by: Figure B.1.
- On the origin of the Hercules group - I. Chemical signatures indicating the outer bar origin. MNRAS 538 (3), pp. 1963–1979. External Links: Document, 2411.19085, ADS entry Cited by: §1, §4.1, §4.4, §7.
- On the origin of the Hercules group: II. The Trojan quasi-periodic identity on the orbital level. MNRAS 539 (2), pp. 1595–1612. External Links: Document, 2411.19097, ADS entry Cited by: §1, §7.
- Non-LTE calculations for neutral Na in late-type stars using improved atomic data. A&A 528, pp. A103. External Links: 1102.2160, Document, ADS entry Cited by: Figure 2, §4.2.
- The Hamburg/ESO R-process Enhanced Star survey (HERES). IX. Constraining pure r-process Ba/Eu abundance ratio from observations of r-II stars. A&A 565, pp. A123. External Links: Document, 1404.0511, ADS entry Cited by: §3.
- A non-LTE study of neutral and singly-ionized calcium in late-type stars. A&A 461 (1), pp. 261–275. External Links: Document, astro-ph/0609527, ADS entry Cited by: §4.3.
- The mass distribution and gravitational potential of the Milky Way. MNRAS 465 (1), pp. 76–94. External Links: Document, 1608.00971, ADS entry Cited by: Appendix B, Appendix B, §6.2.
- The Chemical Composition of the Galactic Bulge and Implications for its Evolution. PASA 33, pp. e040. External Links: 1607.05299, Document, ADS entry Cited by: §4.3, §6.2.
- Spectroscopic Analysis of 33 of the Most Metal Poor Stars. II.. AJ 109, pp. 2757. External Links: Document, ADS entry Cited by: §3.3.
- Constraints on the Origin of Manganese from the Composition of the Sagittarius Dwarf Spheroidal Galaxy and the Galactic Bulge. ApJ 592 (1), pp. L21–L24. External Links: Document, ADS entry Cited by: §4.4.
- The Unusual Abundance of Copper in the Sagittarius Dwarf Spheroidal Galaxy and Implications for the Origin of Centauri. ApJ 622 (1), pp. L29–L32. External Links: Document, ADS entry Cited by: §4.4.
- Two Red Clumps and the X-shaped Milky Way Bulge. ApJ 724 (2), pp. 1491–1502. External Links: Document, 1008.0519, ADS entry Cited by: §1.
- Is the Milky Way ringing? The hunt for high-velocity streams. MNRAS 396 (1), pp. L56–L60. External Links: Document, 0902.1531, ADS entry Cited by: §7.
- New insights on Ba overabundance in open clusters. Evidence for the intermediate neutron-capture process at play?. MNRAS 446, pp. 3651–3668. External Links: 1411.1422, Document, ADS entry Cited by: Figure 6, §4.4.
- The copper and zinc abundances in stars of galactic sub-structures. Astronomy Reports 55 (8), pp. 689–703. External Links: Document, ADS entry Cited by: §4.4.
- Signatures of the resonances of a large Galactic bar in local velocity space. A&A 626, pp. A41. External Links: Document, 1812.04151, ADS entry Cited by: §6.3, §6.3, §6.3, §6.3.
- Tracing the Hercules stream with Gaia and LAMOST: new evidence for a fast bar in the Milky Way. MNRAS 466 (1), pp. L113–L117. External Links: Document, 1610.05342, ADS entry Cited by: §6.3.
- Insights from super-metal-rich stars: Is the Milky Way bar young?. A&A 681, pp. L8. External Links: Document, 2311.16993, ADS entry Cited by: §5.
- The Homogeneity of the Star-forming Environment of the Milky Way Disk over Time. ApJ 926 (2), pp. 144. External Links: Document, 2109.05722, ADS entry Cited by: §4.6.
- PARSEC V2.0: Stellar tracks and isochrones of low- and intermediate-mass stars with rotation. A&A 665, pp. A126. External Links: Document, 2207.08642, ADS entry Cited by: Figure 8, footnote 3.
- Abundances of iron-peak elements in accreted and in situ born Galactic halo stars. A&A 682, pp. A116. External Links: Document, 2312.07768, ADS entry Cited by: §4.4.
- Non-LTE aluminium abundances in late-type stars. A&A 607, pp. A75. External Links: Document, 1708.01949, ADS entry Cited by: Figure 2, §4.2.
- Catalogue of stars measured in the Geneva seven-colour photometric system. A&A 661, pp. A89. External Links: Document, 2111.04810, ADS entry Cited by: §3.1.
- Search for an Intrinsic Metallicity Spread in Old Globular Clusters of the Large Magellanic Cloud. ApJ 867, pp. 8. External Links: 1809.01709, Document, ADS entry Cited by: §4.6.
- The Galactic Thick Disk Stellar Abundances. AJ 120 (5), pp. 2513–2549. External Links: Document, astro-ph/0008075, ADS entry Cited by: §4.4.
- StarHorse: a Bayesian tool for determining stellar masses, ages, distances, and extinctions for field stars. MNRAS 476 (2), pp. 2556–2583. External Links: Document, 1710.09970, ADS entry Cited by: §5, §6.
- Spiral arm crossings inferred from ridges in Gaia stellar velocity distributions. MNRAS 480 (3), pp. 3132–3139. External Links: Document, 1805.10236, ADS entry Cited by: §7.
- The GALAH survey: stellar streams and how stellar velocity distributions vary with Galactic longitude, hemisphere, and metallicity. MNRAS 478 (1), pp. 228–254. External Links: Document, 1802.02924, ADS entry Cited by: §7.
- The Effective Temperature Scale of FGK Stars. II. Teff:Color:[Fe/H] Calibrations. ApJ 626, pp. 465–485. External Links: astro-ph/0503110, Document, ADS entry Cited by: §3.1.
- Riding the kinematic waves in the Milky Way disk with Gaia. A&A 619, pp. A72. External Links: Document, 1805.09790, ADS entry Cited by: §1.
- Non-LTE analysis of K I in late-type stars. A&A 627, pp. A177. External Links: Document, 1906.08281, ADS entry Cited by: §4.2.
- Unveiling systematic biases in the 1D LTE excitation-ionization balance of Fe for FGK stars: a novel approach to determination of stellar parameters. MNRAS 429 (1), pp. 126–134. External Links: Document, 1210.7998, ADS entry Cited by: §3.
- The epoch of the Milky Way’s bar formation: dynamical modelling of Mira variables in the nuclear stellar disc. MNRAS 530 (3), pp. 2972–2993. External Links: Document, 2311.00035, ADS entry Cited by: §5.
- Measuring Reddening with Sloan Digital Sky Survey Stellar Spectra and Recalibrating SFD. ApJ 737, pp. 103. External Links: 1012.4804, Document, ADS entry Cited by: §3.1.
- Radial mixing in galactic discs. MNRAS 336 (3), pp. 785–796. External Links: Document, astro-ph/0203510, ADS entry Cited by: §1.
- NLTE Analysis of Copper Lines in Different Stellar Populations. ApJ 862 (1), pp. 71. External Links: Document, 1806.02225, ADS entry Cited by: §3.
- A Comprehensive Study of Open Cluster Chemical Homogeneity Using APOGEE and Milky Way Mapper Abundances. ApJ 975 (1), pp. 89. External Links: Document, 2409.02360, ADS entry Cited by: §4.1, §4.6.
- Influence of departures from LTE on oxygen abundance determination in the atmospheres of A-K stars. Astronomy Letters 39 (2), pp. 126–140. External Links: Document, ADS entry Cited by: §4.2.
- The HR 1614 moving group : evidence from DDO photometry that it contains cyanogen-rich stars.. AJ 88, pp. 1775–1783. External Links: Document, ADS entry Cited by: §4.6.
- Carbon and Nitrogen Abundances in Metal-Poor Stars.. Ph.D. Thesis, The University of Texas at Austin.. External Links: ADS entry Cited by: §3.
- Modeling the Galactic Bar Using Red Clump Giants. ApJ 477 (1), pp. 163–175. External Links: Document, astro-ph/9605162, ADS entry Cited by: §1.
- The photospheric solar oxygen project. IV. 3D-NLTE investigation of the 777 nm triplet lines. A&A 583, pp. A57. External Links: Document, 1508.03487, ADS entry Cited by: §4.2.
- On the Abundance of Potassium in Metal-Poor Stars. PASJ 54, pp. 275–284. External Links: Document, astro-ph/0110165, ADS entry Cited by: Figure 2, §4.2.
- Abundances of neutron-capture elements in thin- and thick-disc stars in the solar neighbourhood. A&A 649, pp. A126. External Links: Document, 2103.09778, ADS entry Cited by: §4.5.
- A survey of galaxy redshifts. I. Data reduction techniques.. AJ 84, pp. 1511–1525. External Links: Document, ADS entry Cited by: §6.
- Identifying resonances of the Galactic bar in Gaia DR2: I. Clues from action space. MNRAS 500 (2), pp. 2645–2665. External Links: Document, 1906.04786, ADS entry Cited by: §1, §7.
- The orbital evolution induced by baryonic condensation in triaxial haloes. MNRAS 403 (1), pp. 525–544. External Links: Document, 0906.4784, ADS entry Cited by: §6.3, footnote 6.
- Regular and Chaotic Dynamics of Triaxial Stellar Systems. ApJ 506 (2), pp. 686–711. External Links: Document, astro-ph/9801041, ADS entry Cited by: §6.3.
- A Unified Framework for the Orbital Structure of Bars and Triaxial Ellipsoids. ApJ 818 (2), pp. 141. External Links: Document, 1512.03467, ADS entry Cited by: §6.3.
- AGAMA: action-based galaxy modelling architecture. MNRAS 482 (2), pp. 1525–1544. External Links: Document, 1802.08239, ADS entry Cited by: §6.1.
- Stellar Chemical Signatures and Hierarchical Galaxy Formation. AJ 128, pp. 1177–1195. External Links: astro-ph/0406120, Document, ADS entry Cited by: §4.3.
- Internal Kinematics of the Fornax Dwarf Spheroidal Galaxy. AJ 131, pp. 2114–2139. External Links: astro-ph/0511465, Document, ADS entry Cited by: §4.6.
- Mapping the three-dimensional density of the Galactic bulge with VVV red clump stars. MNRAS 435 (3), pp. 1874–1887. External Links: Document, 1308.0593, ADS entry Cited by: §1.
- Chemodynamical Signatures of Bar Resonances in the Galactic Disk: Current Data and Future Prospects. ApJ 935 (1), pp. 28. External Links: Document, 2105.05263, ADS entry Cited by: §7.
- The Evolution and Explosion of Massive Stars. II. Explosive Hydrodynamics and Nucleosynthesis. ApJS 101, pp. 181. External Links: Document, ADS entry Cited by: §4.3, §4.4.
- The Spectacular Tidal Tails of Globular Cluster M3 (NGC 5272). ApJ 953 (2), pp. 130. External Links: Document, 2306.08883, ADS entry Cited by: §5.
- Systematic Non-LTE Study of the -.6 [Fe/H] 0.2 F and G Dwarfs in the Solar Neighborhood. II. Abundance Patterns from Li to Eu. ApJ 833 (2), pp. 225. External Links: Document, 1610.00193, ADS entry Cited by: §4.5, §4.5.
Appendix A Abundance errors and results
| Teff | log | [Fe/H] | vmic | |||
|---|---|---|---|---|---|---|
| Species | 100 K | 0.10 dex | 0.10 dex | 0.10 km s-1 | AODFNEW | |
| C I | 0.08 | 0.04 | 0.01 | 0.01 | 0.05 | 0.09 |
| O I | 0.11 | 0.03 | 0.01 | 0.01 | 0.10 | 0.11 |
| Na I | 0.05 | 0.02 | 0.01 | 0.01 | 0.02 | 0.05 |
| Mg I | 0.04 | 0.01 | 0.01 | 0.01 | 0.01 | 0.04 |
| Al I | 0.04 | 0.01 | 0.01 | 0.01 | 0.01 | 0.04 |
| Si I | 0.02 | 0.01 | 0.01 | 0.01 | 0.02 | 0.03 |
| K I | 0.08 | 0.04 | 0.01 | 0.03 | 0.04 | 0.09 |
| Ca I | 0.06 | 0.02 | 0.01 | 0.03 | 0.01 | 0.07 |
| Sc II | 0.01 | 0.04 | 0.02 | 0.03 | 0.11 | 0.06 |
| Ti I | 0.09 | 0.01 | 0.01 | 0.01 | 0.02 | 0.09 |
| Ti II | 0.01 | 0.04 | 0.02 | 0.05 | 0.10 | 0.07 |
| V I | 0.10 | 0.01 | 0.01 | 0.01 | 0.02 | 0.10 |
| Cr I | 0.08 | 0.01 | 0.01 | 0.03 | 0.01 | 0.08 |
| Mn I | 0.09 | 0.01 | 0.01 | 0.06 | 0.01 | 0.11 |
| Fe I | 0.07 | 0.01 | 0.01 | 0.04 | 0.01 | 0.08 |
| Fe II | 0.03 | 0.04 | 0.02 | 0.04 | 0.11 | 0.08 |
| Co I | 0.08 | 0.01 | 0.01 | 0.01 | 0.01 | 0.08 |
| Ni I | 0.07 | 0.01 | 0.01 | 0.03 | 0.01 | 0.07 |
| Cu I | 0.10 | 0.01 | 0.01 | 0.06 | 0.01 | 0.11 |
| Y II | 0.01 | 0.04 | 0.03 | 0.03 | 0.10 | 0.06 |
| Zr II | 0.01 | 0.04 | 0.03 | 0.01 | 0.09 | 0.06 |
| Ba II | 0.03 | 0.02 | 0.04 | 0.07 | 0.14 | 0.09 |
| La II | 0.02 | 0.04 | 0.03 | 0.01 | 0.10 | 0.06 |
| Ce II | 0.01 | 0.04 | 0.03 | 0.01 | 0.09 | 0.06 |
| Nd II | 0.01 | 0.04 | 0.03 | 0.04 | 0.10 | 0.07 |
| Eu II | 0.01 | 0.04 | 0.03 | 0.01 | 0.10 | 0.06 |
| Hip 11575 | Hip 9353 | Hip 22336 | Hip 22940 | ||||||||||||
|---|---|---|---|---|---|---|---|---|---|---|---|---|---|---|---|
| Species | [X/Fe] | [X/Fe] | [X/Fe] | [X/Fe] | |||||||||||
| C i | 0.04 | 0.12 | 2 | 0.20 | 0.03 | 2 | 0.19 | 0.06 | 2 | 0.02 | 0.09 | 2 | |||
| O i | 0.10 | 0.02 | 3 | 0.06 | 0.05 | 3 | 0.02 | 0.02 | 3 | 0.06 | 0.03 | 3 | |||
| Na i | 0.19 | 0.06 | 4 | 0.25 | 0.12 | 4 | 0.02 | 0.10 | 4 | 0.14 | 0.17 | 4 | |||
| Mg i | 0.04 | 0.14 | 4 | 0.01 | 0.06 | 3 | 0.03 | 0.03 | 4 | 0.05 | 0.12 | 4 | |||
| Al i | 0.03 | 0.03 | 3 | 0.04 | 0.08 | 3 | 0.05 | 0.05 | 3 | 0.12 | 0.02 | 3 | |||
| Si i | 0.02 | 0.13 | 13 | 0.00 | 0.15 | 13 | 0.04 | 0.11 | 13 | 0.01 | 0.10 | 13 | |||
| S i | 0.06 | 0.07 | 5 | 0.15 | 0.07 | 5 | 0.20 | 0.14 | 5 | 0.08 | 0.06 | 5 | |||
| K i | 0.44 | … | 1 | 0.46 | … | 1 | 0.33 | … | 1 | 0.13 | … | 1 | |||
| Ca i | 0.01 | 0.09 | 15 | 0.02 | 0.16 | 15 | 0.00 | 0.13 | 15 | 0.01 | 0.12 | 14 | |||
| Sc i | 0.05 | 0.10 | 4 | 0.06 | 0.18 | 5 | 0.07 | 0.16 | 5 | 0.19 | 0.10 | 6 | |||
| Ti i | 0.08 | 0.11 | 23 | 0.02 | 0.16 | 22 | 0.00 | 0.12 | 23 | 0.15 | 0.16 | 23 | |||
| Ti ii | 0.09 | 0.10 | 4 | 0.09 | 0.19 | 6 | 0.23 | 0.17 | 4 | 0.26 | 0.21 | 5 | |||
| V i | 0.06 | 0.02 | 4 | 0.01 | 0.09 | 4 | 0.10 | 0.06 | 4 | 0.14 | 0.20 | 4 | |||
| Cr i | 0.05 | 0.23 | 9 | 0.07 | 0.13 | 7 | 0.01 | 0.17 | 8 | 0.02 | 0.06 | 8 | |||
| Mn i | 0.08 | 0.09 | 6 | 0.06 | 0.07 | 6 | 0.17 | 0.10 | 6 | 0.02 | 0.17 | 4 | |||
| Fe i | 0.20 | 0.12 | 111 | 0.32 | 0.10 | 112 | 0.30 | 0.12 | 113 | 0.17 | 0.13 | 102 | |||
| Fe ii | 0.20 | 0.11 | 16 | 0.31 | 0.12 | 16 | 0.30 | 0.11 | 15 | 0.17 | 0.10 | 14 | |||
| Co i | 0.06 | 0.14 | 11 | 0.06 | 0.19 | 11 | 0.07 | 0.12 | 11 | 0.14 | 0.31 | 11 | |||
| Ni i | 0.02 | 0.18 | 26 | 0.01 | 0.12 | 26 | 0.03 | 0.11 | 26 | 0.08 | 0.16 | 25 | |||
| Cu i | 0.05 | 0.10 | 3 | 0.17 | 0.10 | 3 | 0.11 | 0.09 | 3 | 0.07 | 0.23 | 3 | |||
| Y ii | 0.12 | 0.23 | 3 | 0.16 | 0.10 | 3 | 0.18 | 0.02 | 3 | 0.04 | 0.17 | 3 | |||
| Zr ii | 0.12 | … | 1 | 0.35 | … | 1 | 0.31 | … | 1 | 0.14 | … | 1 | |||
| Ba ii | 0.19 | 0.04 | 3 | 0.07 | 0.08 | 3 | 0.03 | 0.06 | 3 | 0.08 | 0.13 | 3 | |||
| La ii | 0.02 | 0.01 | 2 | 0.13 | 0.04 | 2 | 0.20 | 0.01 | 2 | 0.37 | 0.18 | 2 | |||
| Ce ii | 0.01 | … | 1 | 0.20 | … | 1 | 0.02 | … | 1 | 0.24 | … | 1 | |||
| Eu ii | 0.10 | … | 1 | 0.10 | … | 1 | 0.32 | … | 1 | 0.01 | … | 1 | |||
| aaaaBa,La/Y,Zr | 0.27 | … | … | 0.82 | … | … | 0.99 | … | … | 0.86 | … | … | |||
| Hip 23311 | Hip 26834 | Intrinscic Scatter | |||||||||||||
| Species | [X/Fe] | [X/Fe] | |||||||||||||
| C i | 0.28 | 0.09 | 2 | 0.18 | 0.05 | 2 | 0.250.07 | ||||||||
| O i | 0.20 | 0.16 | 3 | 0.08 | 0.05 | 3 | 0.060.02 | ||||||||
| Na i | 0.39 | 0.23 | 4 | 0.15 | 0.13 | 4 | 0.070.04 | ||||||||
| Mg i | 0.18 | 0.06 | 4 | 0.24 | 0.36 | 5 | 0.080.03 | ||||||||
| Al i | 0.19 | 0.16 | 3 | 0.11 | 0.05 | 3 | 0.070.03 | ||||||||
| Si i | 0.15 | 0.14 | 13 | 0.03 | 0.12 | 13 | 0.050.02 | ||||||||
| S i | 0.24 | 0.25 | 3 | 0.13 | 0.04 | 4 | 0.020.02 | ||||||||
| K i | 0.17 | … | 1 | 0.16 | … | 1 | 0.140.04 | ||||||||
| Ca i | 0.09 | 0.06 | 4 | 0.01 | 0.14 | 13 | 0.020.02 | ||||||||
| Sc i | 0.10 | 0.20 | 5 | 0.10 | 0.12 | 5 | 0.060.03 | ||||||||
| Ti i | 0.30 | 0.13 | 22 | 0.04 | 0.11 | 22 | 0.120.04 | ||||||||
| Ti ii | 0.11 | 0.13 | 6 | 0.27 | 0.17 | 4 | 0.320.16 | ||||||||
| V i | 0.32 | 0.17 | 4 | 0.02 | 0.15 | 4 | 0.120.05 | ||||||||
| Cr i | 0.07 | 0.07 | 7 | 0.00 | 0.15 | 8 | 0.170.09 | ||||||||
| Mn i | 0.10 | 0.17 | 6 | 0.03 | 0.15 | 6 | 0.050.03 | ||||||||
| Fe i | 0.13 | 0.17 | 115 | 0.38 | 0.13 | 108 | 0.090.03 | ||||||||
| Fe ii | 0.14 | 0.15 | 13 | 0.38 | 0.16 | 16 | 0.080.03 | ||||||||
| Co i | 0.18 | 0.17 | 10 | 0.01 | 0.16 | 9 | 0.070.03 | ||||||||
| Ni i | 0.06 | 0.20 | 25 | 0.06 | 0.15 | 27 | 0.030.02 | ||||||||
| Cu i | 0.11 | 0.23 | 2 | 0.04 | 0.18 | 3 | 0.080.04 | ||||||||
| Y ii | 0.41 | … | 1 | 0.09 | 0.16 | 3 | 0.210.06 | ||||||||
| Zr ii | 0.39 | … | 1 | 0.31 | … | 1 | 0.250.07 | ||||||||
| Ba ii | 0.18 | 0.19 | 3 | 0.04 | 0.09 | 3 | 0.080.03 | ||||||||
| La ii | 0.25 | … | 1 | 0.32 | 0.07 | 2 | 0.120.04 | ||||||||
| Ce ii | 0.24 | … | 1 | 0.01 | … | 1 | 0.160.04 | ||||||||
| Eu ii | 0.01 | … | 1 | 0.05 | … | 1 | 0.140.04 | ||||||||
| aaaaBa,La/Y,Zr | 0.40 | … | … | 0.97 | … | … | |||||||||
| Parameter | Hip 11575 | Hip 9353 | Hip 22336 | Hip 22940 | Hip 23311 | Hip 26834 |
|---|---|---|---|---|---|---|
| Distance [pc] | ||||||
| vHC [km s-1] | ||||||
| X | ||||||
| Y | ||||||
| Z | ||||||
| E | ||||||
| [Gyr-1] | ||||||
| [Gyr-1] | ||||||
| [Gyr-1] | ||||||
| [Gyr-1] | ||||||
| [Gyr-1] | ||||||
| [Gyr-1] | ||||||


Appendix B Time evolution of Galactocentric radii
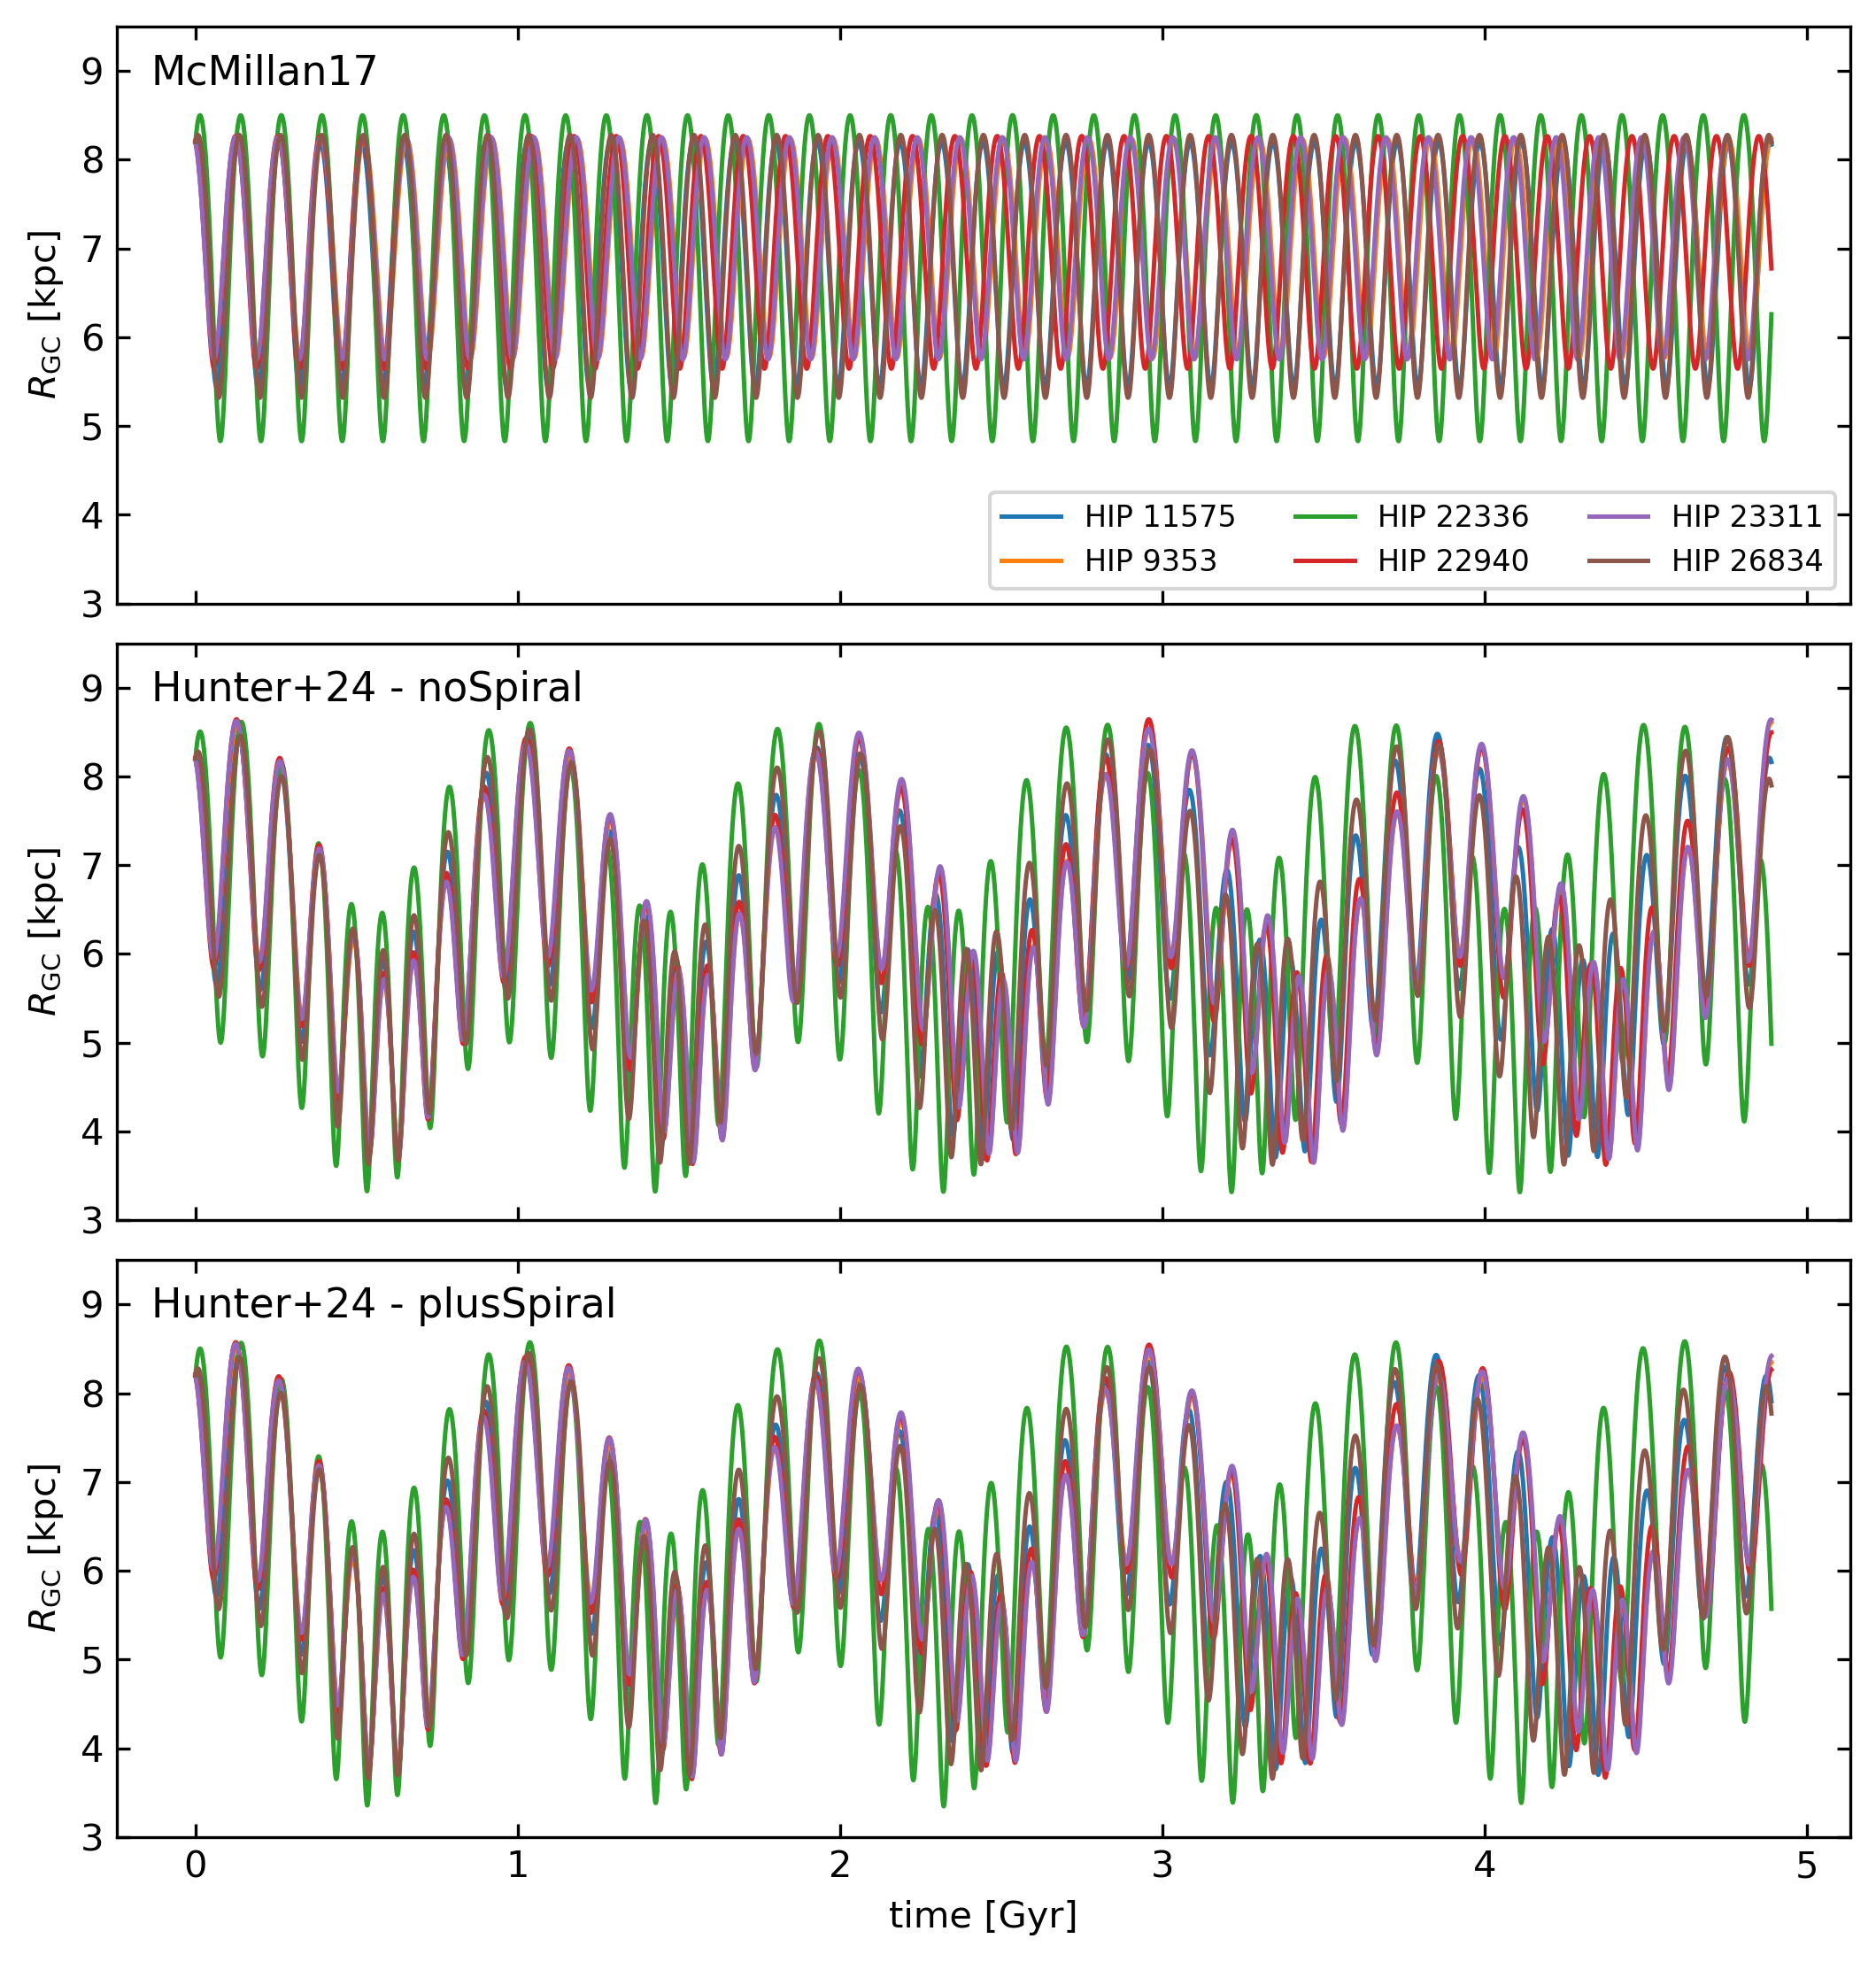
To quantify the radial extent of the orbits and their dependence on details in the potentials, we illustrate here the time evolution of the Galactocentric radius, , for the six stars in the three different considered Galactic potentials: the axisymmetric potential of McMillan (2017), the nonaxisymmetric potential of Hunter et al. (2024) (labeled “H24” in Table B.2) without spiral arms, and the latter, but including spiral arms. The resulting curves are shown in Fig. B.2, while the corresponding mean, median, minimum, and maximum radii are listed in Table B.2.
In the axisymmetric potential (McMillan 2017), the stars remain on regular radial oscillations around the solar radius. The mean Galactocentric radii lie in a narrow range from to , with an average over the six stars of . The corresponding median radii are slightly larger, with an average value of . The radial excursions are moderate, reaching minimum radii between and and maximum radii between and .
The inclusion of the Galactic bar substantially changes the radial behaviour. In the potential of Hunter et al. (2024) without spiral arms, the mean radii decrease to , while the median radii decrease to . This corresponds to a reduction of about in the mean radius and about in the median radius compared to the axisymmetric case. At the same time, the minimum radii become significantly smaller, reaching –. The maximum radii remain close to, or slightly larger than, those in the axisymmetric model, with values around –. Thus, the lower mean and median radii in the barred model are primarily driven by repeated inward radial excursions rather than by a uniform shift of the entire orbit to smaller radii.
Adding spiral arms to the barred potential has only a minor effect on these results. The mean and median radii in the barred model with spiral arms are nearly identical to those obtained without spiral arms, with average values of and , respectively. For individual stars, the differences in the mean radii between the barred models with and without spiral arms are only at the level of . The time evolution in Fig. B.2 likewise shows that the spiral arms do not qualitatively alter the radial oscillation pattern over the integration time considered here.
Overall, this comparison shows that the non-axisymmetric bar potential has a significant impact on the inferred radial extent of the stellar orbits. Compared to the axisymmetric case, the barred potentials produce smaller mean and median Galactocentric radii and allow the stars to reach substantially smaller pericentric radii. However, the curves remain strongly oscillatory rather than showing a monotonic radial drift.
| Potential | Hip | [kpc] | |||
|---|---|---|---|---|---|
| McMillan17 | 11575 | 6.938 | 7.054 | 5.441 | 8.193 |
| McMillan17 | 9353 | 7.096 | 7.186 | 5.772 | 8.236 |
| McMillan17 | 22336 | 6.880 | 7.080 | 4.829 | 8.502 |
| McMillan17 | 22940 | 7.066 | 7.174 | 5.646 | 8.266 |
| McMillan17 | 23311 | 7.098 | 7.192 | 5.750 | 8.253 |
| McMillan17 | 26834 | 6.941 | 7.077 | 5.317 | 8.279 |
| H24 noSpiral | 11575 | 6.196 | 6.102 | 3.694 | 8.480 |
| H24 noSpiral | 9353 | 6.209 | 6.130 | 3.665 | 8.612 |
| H24 noSpiral | 22336 | 6.184 | 6.244 | 3.316 | 8.614 |
| H24 noSpiral | 22940 | 6.218 | 6.124 | 3.625 | 8.644 |
| H24 noSpiral | 23311 | 6.218 | 6.134 | 3.647 | 8.641 |
| H24 noSpiral | 26834 | 6.196 | 6.115 | 3.626 | 8.528 |
| H24 plusSpiral | 11575 | 6.184 | 6.089 | 3.700 | 8.431 |
| H24 plusSpiral | 9353 | 6.195 | 6.136 | 3.723 | 8.513 |
| H24 plusSpiral | 22336 | 6.182 | 6.232 | 3.345 | 8.593 |
| H24 plusSpiral | 22940 | 6.208 | 6.123 | 3.652 | 8.574 |
| H24 plusSpiral | 23311 | 6.206 | 6.144 | 3.682 | 8.557 |
| H24 plusSpiral | 26834 | 6.183 | 6.108 | 3.657 | 8.453 |