Manifold Constrained Tabular Deep Neural Networks
Abstract.
Tabular classification is often governed by local, condition-triggered rules rather than smooth global patterns. However, tabular deep neural networks (DNNs) are typically built upon Euclidean representations that favor smooth variations and semantic locality. This potential geometric mismatch can make it challenging for tabular DNNs to efficiently represent the discrete, rule-partitioned structures often underlying tabular classification. To address this issue, we propose HDE-Net, a manifold-constrained DNN that enables hierarchical decision modeling in hyperbolic space. We first abstract heterogeneous features into unified Latent Decision Nodes (LDNs) and embed them in the Poincaré ball, forming a continuous representation that resembles tree-structured reasoning. For numerical features, we introduce a Soft Decision Routing mechanism that approximates range-based local rules in a differentiable manner, bringing their LDN semantics closer to those of categorical features. An entropy-aware capacity allocation algorithm further adapts the number of LDNs per numerical feature to balance expressiveness and complexity. On the TALENT-tiny-core classification benchmark (30 datasets), HDE-Net achieves the best average rank, outperforming both industrial GBDTs and recent tabular DNNs while maintaining high efficiency.
1. Introduction
Despite the success of Deep Neural Networks (DNNs) in perceptual domains, tabular data remains central to many high-stakes real-world applications, such as financial risk assessment and healthcare diagnostics (guo2017deepfm, ; buczak2015survey, ; hyland2020early, ; liu2025talent, ). Unlike perceptual data (e.g., images and text), which often exhibit homogeneous semantic units and spatial or sequential invariances, tabular data is typically heterogeneous and may be governed by discrete, condition-triggered rules. Recent large-scale tabular benchmarks (liu2025talent, ) show that Gradient-Boosted Decision Trees (GBDTs), such as XGBoost (chen2016xgboost, ) and CatBoost (prokhorenkova2018catboost, ), remain strong baselines across diverse feature compositions, while tabular DNNs often display dataset-specific performance variations.
One possible explanation is that GBDTs align well with rule-oriented structures commonly observed in tabular tasks. They perform task-driven space partitioning, recursively decomposing the feature space into a hierarchy of symbolic decision rules (e.g., or ). In contrast, many tabular DNNs operate under Euclidean assumptions of smoothness and continuous manifolds. From this perspective, a form of geometric mismatch may arise: the flat geometry of Euclidean space can be less suitable for representing the exponential branching patterns induced by hierarchical decision rules. As a result, neural models may rely on deeper or more complex architectures to approximate relatively simple rule-based relationships (cheng2016wide, ; guo2017deepfm, ; wang2017deep, ; arik2021tabnet, ).
| Models | Overall | Num-Only | Num-Heavy | Cat-Heavy | |
| Tree Models | XGBoost | 7.4 | 10.5 (+3.1) | 5.9 (-1.5) | 3.0 (-4.3) |
| LightGBM | 8.4 | 11.0 (+2.6) | 6.5 (-1.9) | 5.5 (-2.8) | |
| CatBoost | 8.6 | 12.3 (+3.7) | 6.4 (-2.2) | 3.9 (-4.7) | |
| Ad-hoc Fusion | RealMLP | 8.9 | 6.4 (-2.5) | 9.7 (+0.8) | 12.9 (+4.0) |
| MLP | 14.9 | 10.1 (-4.8) | 17.8 (+2.8) | 21.0 (+6.1) | |
| Pseudo Alignment | FT-Transformer | 11.6 | 12.3 (+0.6) | 11.3 (-0.3) | 10.7 (-0.9) |
| ExcelFormer | 13.9 | 14.7 (+0.8) | 13.3 (-0.6) | 13.2 (-0.7) | |
To mitigate this issue, recent studies have focused on improving heterogeneous feature representations to better capture hierarchical structures while reducing model complexity. However, benchmark results suggest that many existing approaches still exhibit noticeable performance variations across datasets (Table 1). 1). Ad-hoc fusion methods (gorishniy2022embeddings, ; holzmuller2025realmlp, ) typically apply separate processing pipelines for numerical and categorical features without a unified semantic representation. While effective on numerical-dominant datasets, their performance can degrade in categorical-heavy scenarios. 2). Pseudo-alignment methods (song2019autoint, ; gorishniy2021revisiting, ; chen2023excelformer, ; wang2021dcn, ) project all features into a shared embedding space. However, this alignment is largely dimensional rather than semantic: Categorical features are represented by value-level embeddings, whereas numerical features are typically restricted to feature-level linear transformations. Without mechanisms for local range-based partitioning, numerical features may struggle to achieve non-linear ability and comparable semantic granularity. Consequently, these models often rely on heavy backbones to compensate for representational limitations, leading to moderate performance and increased computational cost.
Revisiting the geometric perspective, hyperbolic geometry provides a potentially suitable mathematical foundation for modeling hierarchical structures. The Poincaré ball exhibits negative curvature and exponential volume growth, and has been widely used as a continuous analogue of tree-like structures (nickel2017poincare, ). Hyperbolic neural networks have shown promising results in graph learning by embedding explicit hierarchies (peng2021hyperbolic, ). However, their application to general tabular modeling remains limited. A key challenge is that tabular data typically lacks explicit topology, which requires first unifying the modeling units (i.e., feature conditions) before constructing hyperbolic representations. This leads to the second issue, which we term representation granularity mismatch: categorical values and numerical ranges are often modeled at different semantic granularities.
In this work, we propose HDE-Net, a manifold-constrained framework that bridges tree-structured decision rules and neural representations through a geometric formulation. To this end, we introduce the concept of Latent Decision Nodes (LDNs), a unified modeling unit that abstracts heterogeneous feature conditions into discrete logical atoms. For numerical features, we design Soft Decision Routing to decompose continuous values into multiple LDNs, mimicking the range-based split logic of decision trees in a differentiable manner. These unified LDNs are then embedded into the Poincaré ball to form Hyperbolic Decision Embeddings (HDEs), where the negative curvature naturally induces a hierarchical organization. Finally, we introduce an Entropy-aware Capacity Allocation algorithm that adaptively assigns the number of LDNs to each numerical feature based on its information density, balancing model complexity and expressiveness.
Our main contributions are summarized as follows:
-
•
A Unified Decision-Centric Framework. We introduce Latent Decision Nodes (LDNs) as a fundamental modeling unit, aligning categorical values and numerical ranges within a shared semantic space. For numerical features, we propose Soft Decision Routing for differentiable range discretization and an Entropy-aware Capacity Allocation algorithm to balance granularity and complexity.
-
•
Manifold-Constrained Tabular Paradigm. We propose Hyperbolic Decision Embedding (HDE), which represents LDNs in the Poincaré ball as a continuous analogue of tree-structured reasoning. By coupling HDE with a lightweight MLP predictor, we develop HDE-Net, a manifold-constrained tabular DNN that encourages hierarchical decision structures within neural representations.
-
•
State-of-the-Art Performance. Extensive experiments on the TALENT-tiny-core classification benchmark (30 datasets) show that HDE-Net achieves the best average rank, outperforming both industrial GBDT models and recent tabular DNNs while maintaining high efficiency.
-
•
Geometric Visualization and Empirical Validation. We design visualization analyses that reveal the geometric alignment between HDE-Net and decision tree structures, providing empirical support for the proposed geometric perspective.
The rest of this paper is organized as follows. Section 2 reviews related work of current tabular DNNs and Hyperbolic DNNs. Section 3 provides preliminaries on hyperbolic geometry and key operators. Section 4 details the HDE-Net. Section 5 presents experimental results and analysis, followed by conclusions in Section 6.
2. Related Work
2.1. Euclidean-based Deep Tabular Paradigms
Existing deep tabular learning methods typically map heterogeneous features into Euclidean representations, often assuming relatively smooth manifolds. We group these approaches based on how they handle feature heterogeneity.
Hybrid and Fusion Architectures. Methods such as Wide&Deep (cheng2016wide, ), TabNet (arik2021tabnet, ), TabTransformer (huang2020tabtransformer, ), MLP-PLR (gorishniy2022embeddings, ), and RealMLP (holzmuller2025realmlp, ) explicitly acknowledge feature differences by applying separate processing pipelines (e.g., raw inputs or periodic embeddings for numerical features and embeddings for categorical features) before fusion. These designs can be effective for specific feature types, but the final fusion typically occurs through linear concatenation in Euclidean space, without an explicitly unified semantic representation across feature types.
Tokenization and Pseudo-Alignment. Inspired by token-based modeling in NLP, methods such as AutoInt (song2019autoint, ), FT-Transformer (gorishniy2021revisiting, ), DCNv2 (wang2021dcn, ), Excelformer (chen2023excelformer, ), and TabM (gorishniy2024tabm, ) project all features into a shared Euclidean embedding space. This dimensional alignment enables the use of Transformer-style backbones. However, categorical features are typically represented by value-level embeddings, while numerical features are often processed through feature-level linear projections (). Such representations may not explicitly model the range-based partitioning commonly used in decision-tree-style reasoning, and therefore often rely on deeper or more expressive backbones to capture complex feature interactions.
Retrieval and Prior-based Methods. To enhance the expressive power of parametric models, approaches such as TabR (gorishniy2023tabr, ) and ModernNCA (ye2024revisiting, ) augment input representations by retrieving similar samples, while TabPFN (hollmann2022tabpfn, ) leverages priors learned from synthetic datasets. These methods can achieve strong empirical performance, but typically depend on external memory, retrieval procedures, or large-scale pre-training, which may introduce additional computational costs or sensitivity to distribution shifts.
2.2. Hyperbolic Geometry and Tree Alignment
Hyperbolic Representation Learning. Hyperbolic space exhibits negative curvature and exponential volume growth with respect to radius, and is widely used as a continuous analogue of tree-like structures (nickel2017poincare, ). This property has motivated a range of representation learning methods in domains with explicit hierarchies, including graph learning (chami2019hyperbolic, ; dai2021hyperbolic, ), computer vision (lensink2022fully, ), and multimodal learning (desai2023hyperbolic, ). However, tabular data typically lacks explicit topology, making it less straightforward to directly apply hyperbolic representations. In such settings, hierarchical structures must be induced implicitly from data-driven methods.
Geometric Tabular Models. Recent studies have explored extending classical machine learning methods to non-Euclidean geometries. HyperDT (chlenski2023fast, ) generalizes decision trees to hyperbolic space, while PXGBoost (suganthan2025euclidean, ) extends gradient boosting to the Poincaré ball. These works demonstrate that hyperbolic geometry can be compatible with tree-based splitting mechanisms. However, they primarily follow traditional model designs and do not focus on end-to-end representation learning or deep feature interaction modeling.
Bridging the Gap. In contrast, HDE-Net aims to combine the flexibility of deep tabular models with the hierarchical inductive bias of hyperbolic geometry. Instead of directly applying hyperbolic classifiers, our approach first abstracts heterogeneous features into unified Latent Decision Nodes (LDNs), and then learns their hierarchical organization within the Poincaré ball in a fully differentiable, end-to-end manner.

3. Preliminaries
Problem Formulation. We consider a supervised tabular classification task with a dataset . Each input instance consists of heterogeneous features, including numerical features and categorical features , where refers to the -th numerical feature and denotes the domain of the -th categorical feature. Our goal is to learn a function that predicts the target . Motivated by the structural differences between numerical and categorical features, we aim to unify their representations into a common set of feature conditions, facilitating alignment with rule-based reasoning structures.
Poincaré Ball Model. Hyperbolic geometry is a non-Euclidean geometry with negative curvature hyperparameter . We adopt the -dimensional Poincaré ball model , defined as the manifold , where controls the curvature. The induced distance between two points is:
| (1) |
where denotes Möbius addition (ungar2008analytic, ). A key property of the Poincaré ball is that its volume grows exponentially with respect to the radius. This characteristic is often viewed as analogous to the exponential branching behavior of tree-like structures, making hyperbolic space a suitable continuous analogue for hierarchical representations (nickel2017poincare, ).
Hyperbolic Embedding: Poincaré vs. Lorentz. Both the Poincaré and Lorentz models are commonly used in hyperbolic representation learning. While the Lorentz model is sometimes preferred for numerical stability in graph neural networks (yang2022hyperbolic, ), our architecture avoids complex manifold operations (e.g., repeated inter-node additions) and frequent projections between Euclidean and hyperbolic spaces. We therefore adopt the Poincaré ball model for its conformal property with respect to Euclidean space (angle-preserving) (ganea2018hyperbolic, ). In this geometry, the norm of an embedding is related to its radial depth, while angular relationships capture relative similarity, which can be interpreted as reflecting aspects of hierarchical structure.
Tangent Space Projection. To integrate hyperbolic embeddings with Euclidean neural components (e.g., an MLP backbone), we employ the logarithmic map at the origin, , to project points from the manifold onto the Euclidean tangent space :
| (2) |
In HDE-Net, embeddings are initialized directly on the manifold and mapped to the tangent space before being fed into the Euclidean predictor, facilitating efficient downstream computation while preserving the underlying geometric structure.
4. Methodology
The HDE-Net (Fig 1) consists of three key stages: (1) Symbolic Unification, where heterogeneous features are mapped to a standardized set of Latent Decision Nodes (LDNs) representing discrete logical atoms inspired by tree-based feature conditions; (2) Hyperbolic Decision Embedding (HDE), where LDN representations are initialized and optimized on the Poincaré ball to introduce an implicit hierarchical inductive bias; (3) Tangent Projection & Prediction, where embeddings are projected to the Euclidean tangent space for efficient aggregation and classification. Within the Symbolic Unification stage, we introduce two mechanisms specifically for numerical features: Entropy-Aware Capacity Allocation to determine the number of LDNs, and Soft Decision Routing to approximate the task-driven partitioning behavior of GBDTs.
4.1. Entropy-Aware Capacity Allocation
Tabular data often exhibits heterogeneous feature complexity, which may benefit from non-uniform capacity allocation. Assigning a fixed number () of LDNs to every numerical feature can result in inefficient capacity usage. Simple features may suffer from over-parameterization, while complex ones face under-parameterization. To address this, we propose the Entropy-aware Capacity Allocation algorithm, heuristically inspired by information-theoretic intuition. We dynamically determine for each numerical feature based on Shannon entropy and effective sample size (number of non-missing values). Each entropy is estimated via histogram-based discretization of the specific numerical feature. The term can be interpreted as the effective number of distinguishable states, which serves as a heuristic indicator of feature complexity. Meanwhile, provides a sample-size-aware upper bound on the allowable capacity. This heuristic design aims to allocate more modeling capacity to features with higher estimated information content, analogous to how decision trees tend to grow deeper along informative features. The detailed procedure is outlined in Algorithm 1.
4.2. Soft Decision Routing
To approximate the space-partitioning behavior of GBDTs on numerical features, we introduce Soft Decision Routing, which provides a differentiable approximation of range-based splitting. Given a numerical feature input , let denotes its batch-wise Z-normalized value (using batch statistics). We employ a learnable linear transformation to compute routing weights associated with the corresponding LDNs:
| (3) |
where are learnable parameters. Taking Figure 1 as an example, and are computed for the “Age” feature.
Instead of producing a single projection per feature, this mechanism generates multiple value-dependent weights, enabling soft interactions with multiple LDNs. No softmax normalization is applied, allowing the routing weights to preserve magnitude information. Empirically, we find this formulation stable under standard normalization and easier to converge. As the input varies, intersections and zero-crossings among the weight trajectories may alter the relative contributions of different LDNs, thereby introducing non-linear interactions among LDN components. This behavior resembles the formation of soft decision thresholds, enabling the model to approximate tree-like range partitioning within a continuous framework (see Fig. 5).
For categorical features , the routing is deterministic, selecting the unique LDN corresponding to the category value. In this way, categorical and numerical features are treated at a comparable value-level (also can be treated as feature conditions) granularity.
4.3. LDNs in Hyperbolic Space
After unifying heterogeneous features into LDNs, we embed them into the Poincaré ball to construct Hyperbolic Decision Embeddings (HDEs) . Embedding LDNs in this space introduces an inductive bias that is consistent with hierarchical organization. Empirically, embeddings with more broadly contributing LDNs are often observed closer to the origin, while more specialized partitions tend to reside toward the boundary. Such radial arrangements can be interpreted as reflecting varying levels of generality, analogous to different depths in a tree structure. In this way, HDE-Net incorporates a geometry-aware inductive bias that encourages hierarchical structuring of feature conditions within a differentiable optimization framework.
4.4. Tangent Projection and Feature Aggregation
To enable efficient inference and compatibility with standard neural layers, we decouple the geometric embeddings from subsequent computations by projecting them onto the Euclidean tangent space. For each categorical feature, whose input value deterministically selects a single LDN, the corresponding embedding is projected as . For each numerical feature, we aggregate the associated HDEs using the routing weights from Section 4.2. To avoid repeated Möbius operations on the manifold, we first project all involved HDEs onto and then perform weighted aggregation. This strategy reduces computational overhead while preserving the local geometric structure induced by the manifold. Let . Its Euclidean representation is :
| (4) |
The scaling factor serves as a simple normalization to stabilize feature magnitude across varying capacities.
4.5. HDE-Net and its Hybrid Optimization Strategy
To construct HDE-Net, the feature embeddings are concatenated and fed into a lightweight MLP predictor. To train the model, we adopt a Hybrid Optimization Strategy that separates manifold and Euclidean parameters. The HDEs and curvature parameter are optimized using Riemannian Adam (becigneul2018riemannian, ), which performs gradient updates via retraction and vector transport to keep embeddings on the manifold throughout training. All remaining parameters (, and the MLP) are optimized using standard AdamW in Euclidean space. This hybrid optimization scheme respects the geometric constraints of hyperbolic embeddings while retaining the computational simplicity of Euclidean neural components.
| HDE-Net | |||||||||||
| Datasets | Precision | Recall | F1 | AUC | Accuracy | Datasets | Precision | Recall | F1 | AUC | Accuracy |
| ada | 80.90% | 80.12% | 80.47% | 89.44% | 85.60% | law-school-admission | 100.00% | 100.00% | 100.00% | 100.00% | 100.00% |
| airlines | 63.92% | 63.26% | 63.21% | 65.05% | 64.30% | microaggregation2 | 57.55% | 39.19% | 41.22% | 82.00% | 63.83% |
| allbp | 83.81% | 64.80% | 71.42% | 94.95% | 97.58% | national-longitudinal | 99.81% | 99.80% | 99.81% | 99.99% | 99.82% |
| ASP-POTASSCO | 37.71% | 35.77% | 36.03% | 80.66% | 42.59% | okcupid_stem | 67.98% | 51.01% | 52.81% | 80.55% | 75.35% |
| autoUniv-au7-1100 | 42.35% | 40.82% | 40.16% | 69.24% | 41.95% | online_shoppers | 83.46% | 77.78% | 80.18% | 91.79% | 90.49% |
| company_bankruptcy | 85.15% | 69.17% | 74.33% | 95.99% | 97.52% | ozone_level | 49.11% | 49.90% | 49.50% | 68.64% | 98.03% |
| eucalyptus | 73.34% | 70.64% | 71.42% | 93.50% | 73.92% | pc4 | 82.58% | 69.05% | 73.08% | 93.08% | 90.72% |
| Gender_Gap | 53.54% | 42.88% | 43.90% | 65.37% | 60.17% | PhishingWebsites | 97.91% | 97.74% | 97.82% | 99.71% | 97.85% |
| hill-valley | 73.33% | 72.81% | 72.65% | 77.48% | 72.80% | rice_cammeo_&_osmancik | 93.11% | 92.33% | 92.65% | 97.62% | 92.86% |
| house_16H | 88.40% | 88.39% | 88.39% | 94.69% | 88.39% | shill-bidding | 64.99% | 56.06% | 56.99% | 71.46% | 90.24% |
| ibm-employee-performance | 100.00% | 100.00% | 100.00% | 100.00% | 100.00% | Shipping | 75.97% | 73.07% | 68.75% | 73.77% | 69.05% |
| INNHotelsGroup | 87.26% | 86.21% | 86.69% | 94.49% | 88.43% | statlog | 68.87% | 67.75% | 68.20% | 73.80% | 74.05% |
| internet_firewall | 93.22% | 77.66% | 81.90% | 98.85% | 93.09% | thyroid | 96.34% | 97.60% | 96.92% | 99.88% | 99.40% |
| jasmine | 82.10% | 79.37% | 78.90% | 84.06% | 79.35% | waveform_version_1 | 87.10% | 87.09% | 87.06% | 96.85% | 87.12% |
| jungle_chess_2pcs | 97.67% | 97.68% | 97.66% | 99.88% | 98.20% | wine-quality-red | 39.23% | 33.01% | 33.67% | 75.98% | 62.97% |

5. Experiments
5.1. Setups
Datasets. We evaluate HDE-Net on the TALENT-tiny core classification benchmark (liu2025talent, ), which comprises 30 datasets (see Appendix A for details). Unlike traditional benchmarks that are often biased toward numerical-dominant data, TALENT-tiny core provides a balanced and fair representation of various feature compositions (Numerical-only, Numerical-dominant, and Categorical-dominant). This diversity ensures that our evaluation fairly tests the model’s ability to induce consistent symbolic structures across heterogeneous feature spaces. Detailed statistical information for each dataset is provided in Appendix A.
Baselines. We include a comprehensive pool of 31 baselines whose results are officially disclosed on the TALENT leaderboard. These include 10 Traditional Models (e.g., CatBoost (prokhorenkova2018catboost, ), XGBoost (chen2016xgboost, ), LightGBM (ke2017lightgbm, )) and 21 Deep Learning Models (e.g., ModernNCA (ye2024revisiting, ), RealMLP (holzmuller2024better, ), FT-Transformer (gorishniy2021revisiting, )). A full list of these baselines is provided in Appendix B.
Hyperparameter Settings. For HDE-Net, the dimension of HDE is fixed at 12 across all datasets. The number of LDNs for each numerical feature is adaptively assigned via the Entropy-Aware Capacity Allocation algorithm (Sec. 4.1) with and . To ensure a fair comparison, the hyperparameters for the MLP backbone are retrieved from the TALENT repository111https://github.com/LAMDA-Tabular/TALENT for each specific dataset. For datasets without pre-tuned settings, we adopt the default configuration: two hidden layers of size 384 with a dropout of 0.1, trained with a learning rate of and weight decay of . For the Riemannian Adam, its learning rate and weight decay are consistent with the standard AdamW optimizer used for Euclidean parameters.
Evaluation Metrics and Ranking. Our model was evaluated on all datasets with 10 repeated runs, and mean accuracy was recorded. We report the average rank computed using the Wilcoxon–Holm test (demvsar2006statistical, ) over all datasets’ results at a significance level of 0.05.
Note regarding Rank Consistency: As ranking is a relative metric, the absolute rank of a model (e.g., HDE-Net) depends entirely on the specific model and dataset pool included in the comparison. Consequently, the ranks reported in the Performance Comparison (Sec. 5.2), Robustness across Feature Scenarios (Sec. 5.3) and the Mechanism Analysis and Ablation Study (Sec. 5.4) may differ due to the varying sets of HDE-Net variants involved.
5.2. Performance Comparison
The overall performance of HDE-Net and 31 baseline models on the TALENT-tiny-core classification benchmark is summarized in Table 2, with the corresponding ranking diagram shown in Figure 2. HDE-Net achieves the lowest average rank of 4.1667, placing 1st among all compared methods. In particular, it outperforms strong recent baselines such as the retrieval-based model ModernNCA (Rank 7.63) and the widely used GBDT implementation XGBoost (Rank 7.98). These results are consistent with our design hypothesis: by organizing feature representations into condition-aware LDNs and constraining them in a hyperbolic space (HDEs), the model can better capture the discrete, rule-partitioned structure commonly observed in tabular data, while retaining the benefits of differentiable neural training.
5.3. Robustness across Feature Scenarios
To examine the adaptability of HDE-Net under different feature compositions, we analyze the average rankings across three scenarios: Num-only (datasets containing only numerical features), Num-Heavy (numerical-dominant datasets), and Cat-Heavy (categorical-dominant datasets). Since the benchmark includes only one categorical-only dataset, it is merged into the Cat-Heavy group. We compare representative models from different paradigms: XGBoost (tree-based), RealMLP (ad-hoc fusion), FT-Transformer (pseudo-alignment), and ModernNCA (retrieval-based). The results are shown in Figure 3.

-
•
Numerical-dominant scenarios. In the Num-only setting, HDE-Net achieves an average rank of 4.64, compared with 7.04 for RealMLP and 13.25 for FT-Transformer. This gap suggests that the Soft Decision Routing accompany with HDEs may better capture local numerical variations than rigid linear projections or periodic embeddings.
-
•
Heterogeneous feature scenarios. Ad-hoc fusion methods exhibit noticeable performance variation across scenarios. For example, RealMLP performs relatively well on numerical-dominant datasets but drops to Rank 13.86 in the Cat-Heavy setting. In contrast, HDE-Net maintains relatively stable rankings across all scenarios, tying with the tree-based baseline XGBoost (Rank 3.43) in the categorical-dominant case. This behavior is consistent with the idea that abstracting heterogeneous features into unified LDNs may help reduce the representation gap between numerical and categorical features.
5.4. Mechanism Analysis and Ablation Study
We conduct an ablation study to quantify the contributions of HDE-Net’s core components and to evaluate its sensitivity to the LDN capacity . Note on rankings: The ranks reported here differ from those in Sec. 5.2, as the comparison pool includes additional HDE variants.
Impact of Core Mechanisms. To disentangle the contributions of different design choices, we evaluate: (1) HDE-noRouter, which replaces the soft routing mechanism with a single hyperbolic linear mapping (shimizu2020hyperbolic, ); (2) HDE-noHyp, which retains the routing mechanism but places the embeddings back into Euclidean space. These variants are compared with several strong baselines in Table 3.
| Variant | Avg Rank () | Baseline | Avg Rank () |
| HDE-Net | 4.93 | ModernNCA | 8.70 |
| HDE-noHyp | 7.10 | TabR | 9.48 |
| HDE-noRouter | 13.45 | RealMLP | 10.82 |
| FT-Transformer | 13.93 |
-
•
Effect of Soft Decision Routing. Even without the hyperbolic manifold, HDE-noHyp (Rank 7.10) outperforms ModernNCA (8.70). This observation suggests that shifting from coarse feature-level projections to condition-aware decision nodes may contribute substantially to performance.
-
•
Role of Hyperbolic Geometry. Introducing the hyperbolic manifold further improves the ranking from 7.10 to 4.93. This gain indicates that hyperbolic space may provide a more suitable inductive bias for modeling hierarchical decision structures.
-
•
Capacity under Low Dimensionality. Even in the most constrained variant, HDE-noRouter (Rank 13.45) remains competitive with FT-Transformer (13.93), despite using a 12-dimensional embedding and a shallow MLP. This suggests that the representation can remain effective even at relatively low dimensionality.

Efficacy of Entropy-aware Allocation We analyze the parameter sensitivity of the number of LDNs (). We compare HDE-Net (Adaptive ) against variants with fixed (Fig 4). Fixed- variants exhibit a clear inverted U-shape ranking trend. This highlights the non-uniform complexity of tabular features: Models with low capacity () fail to capture complex splitting rules, while introduces noise. Meanwhile, HDE-Net (Rank 5.73) significantly outperforms the best fixed variant (, Rank 7.92). This trend proves that no single fixed capacity is optimal for all features, validating the necessity of breaking the rigid allocation paradigm.
5.5. Efficiency Analysis: Complexity and Cost
To evaluate the computational efficiency of HDE-Net, we analyze its theoretical complexity and compare it against leading baselines.
Theoretical Complexity. Let be the number of features. Models like FT-Transformer suffer from the quadratic bottleneck of self-attention over features, leading to complexity per sample. Here is the number of layers. Retrieval-based methods like ModernNCA must perform a nearest-neighbor search from the training set (), resulting in complexity during inference. In contrast, HDE-Net maintains a linear complexity. For numerical features, the Soft Decision Routing performs parallel linear operations and a weighted aggregation of -dimensional HDEs. The total complexity is . Crucially, HDE-Net’s computation is: 1). independent of training set size; 2). linear with respect to the feature count. HDE-Net achieves superior representation power through geometric alignment while benefiting from lightweight backbone execution.
Quantitative Comparison. We selected the INNHotelsGroup dataset from the TALENT benchmark, which contains a balanced composition of categorical (6) and numerical (11) features with 29,020 samples, providing a representative playground for different types of methods. Inference time was measured on an NVIDIA RTX A4000 GPU with a batch size of 10,240 to maximize throughput and minimize I/O overhead. We compared HDE-Net against top-performing DNN baselines: FT-Transformer (Pseudo-alignment), ModernNCA (Retrieval-based), and RealMLP (Ad-hoc Fusion), using their optimal hyperparameter configurations as provided by the benchmark. As detailed in Table 4, HDE-Net achieves a remarkable balance between efficiency and performance:
| Model | Params (M) | Infer. Time (s) | Avg. Rank() |
| FT-Transformer | 0.91 | 0.0440 | 12.55 |
| RealMLP | 0.15 | 0.1293† | 9.68 |
| ModernNCA | 0.06 | 0.0552 | 7.63 |
| HDE-Net (Ours) | 0.63 | 0.0077 | 4.17 |
| † Note: High latency likely due to implementation issue in the benchmark codebase. | |||
-
•
Vs. Pseudo-alignment (FT-Transformer): While HDE-Net has a comparable parameter count to FT-Transformer (0.63M vs. 0.91M), it is approximately 5.7 faster (0.0077s vs. 0.0440s). This empirically confirms that shifting complexity from the backbone (Transformer layers) to the embedding layer (HDE) significantly reduces computational latency without sacrificing accuracy.
-
•
Vs. Retrieval-based (ModernNCA): Although ModernNCA has fewer parameters due to its non-parametric nature, its inference latency is significantly higher (0.0552s, 7.1 slower than HDE-Net). This highlights the inherent drawback of retrieval-based inference at scale, whereas HDE-Net provides a purely parametric alternative that captures structural logic more efficiently.
-
•
Vs. Ad-hoc Fusion (RealMLP): Theoretically, RealMLP should be efficient due to its simple architecture. However, we observed anomalously high latency (0.1293s) in the testing. We attribute this to engineering issue in the TALENT codebase rather than inherent algorithmic complexity. Even disregarding this anomaly, HDE-Net significantly outperforms RealMLP in ranking (4.17 vs. 9.68), justifying the overhead of the HDE layer.
In summary, HDE-Net dominates the trade-off landscape, delivering the fastest inference speed among competitive baselines while maintaining the best overall ranking.
5.6. Qualitative Analysis: Geometric Correspondence
To provide qualitative evidence for the structural correspondence between HDE-Net and decision-tree reasoning, we visualize both the learned split logic and the induced hierarchical organization.
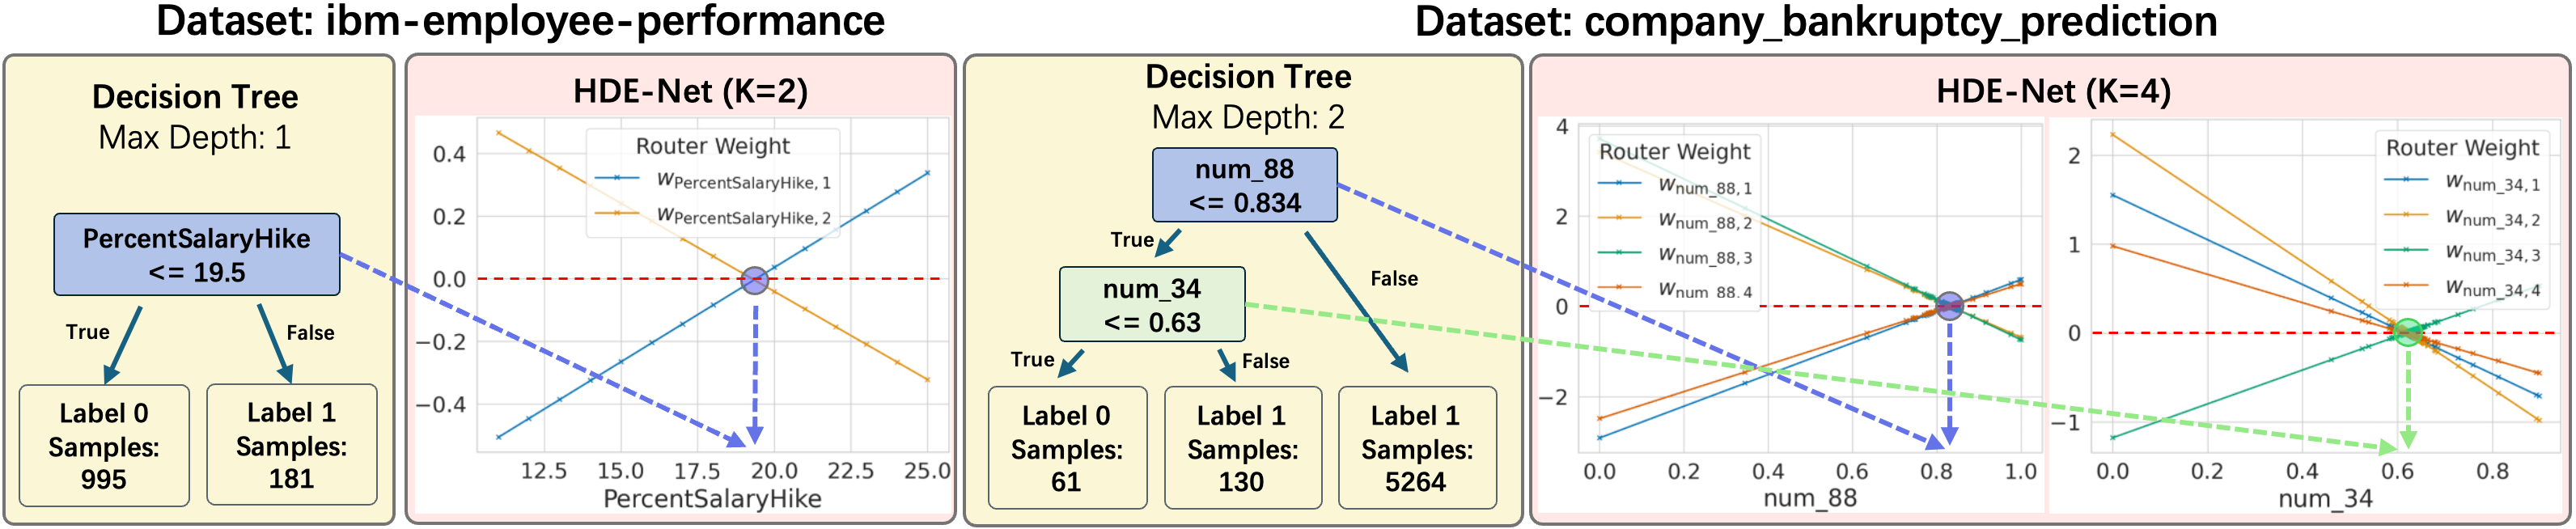
Split Logic Alignment via Router Weights. We examine whether the Soft Decision Router recovers patterns similar to the space partitioning logic of decision trees (Fig. 5). For a specific numerical feature , we visualize all related routing weights (from Eq. 3) across its value range. The x-axis represents sorted feature input values, and each colored line corresponds to one weight within .
On the ibm-employee-performance () and company-bankruptcy () datasets, the intersection points (where one LDN’s influence surpasses another) and zero-crossing points of these weight lines appear near the hard split thresholds learned by a standard decision tree (via scikit-learn222https://scikit-learn.org/). These transition points behave similarly to soft decision boundaries, suggesting that the routing mechanism may approximate the range-based splitting behavior of trees while remaining differentiable.
Hierarchical Structure in Poincaré Space. We further visualize the distribution of categorical HDEs to inspect their spatial organization (Fig. 6). We first compute the pairwise manifold distance matrix for all categorical HDEs using the Poincaré distance defined in Eq. 1. We then apply Multidimensional Scaling (MDS) to project these points into a 2D Euclidean space.
Each LDN is colored according to its Feature Importance (Cover Rate) from a pre-trained XGBoost model, serving as a proxy for its relative position in a tree hierarchy. Since the Soft Decision Router is not strictly equivalent to the range splits of GBDTs, this visualization focuses on categorical HDEs. We therefore select two categorical-dominant datasets, ozone_level333Although this dataset’s source reports many numerical features, the TALENT codebase treats them as categorical, probably due to their strongly non-linear relationships with the target. (36 categorical features) and allbp (23 categorical features). Two qualitative observations can be made:

-
•
Emergent branching patterns. Starting from random initialization (Epoch 0), the HDEs gradually organize into clustered, branching structures over training. The resulting patterns resemble tree-like topologies in the projected space.
-
•
Importance-aware radial distribution. LDNs with higher feature importance (darker red, higher cover rate) tend to appear closer to the center of the space, while less important ones (lighter yellow) are more frequently located near the boundary. This radial arrangement is consistent with the hierarchical geometry of the Poincaré ball, where central regions correspond to more general nodes and boundary regions correspond to more specific ones.
Overall, these visualizations provide qualitative evidence that the learned representations exhibit tree-like structural properties in both routing behavior and embedding geometry.
6. Conclusion
In this paper, we presented HDE-Net, a manifold-constrained framework motivated by a geometric perspective on tabular learning. We revisit tabular classification as a process often governed by discrete, rule-partitioned structures, and observe a potential mismatch between such structures and the smooth Euclidean representations commonly used in tabular DNNs. To address this, HDE-Net shifts the representational space to the hyperbolic Poincaré ball, which provides a continuous analogue of tree-like hierarchies within a differentiable neural architecture.
Our approach is built upon Latent Decision Nodes (LDNs), which abstract heterogeneous feature conditions into unified modeling units. Soft Decision Routing enables differentiable range-based partitioning for numerical features, helping align their semantics with categorical features, while the entropy-aware allocation strategy adaptively balances model complexity across datasets.
Extensive experiments on the TALENT-tiny-core classification benchmark show that HDE-Net achieves the best average rank among competitive baselines, outperforming both industrial GBDT models and recent tabular DNNs while maintaining high efficiency. These results suggest that incorporating geometry-aware inductive biases may provide a promising direction for future tabular learning research.
References
- [1] Huifeng Guo, Ruiming Tang, Yunming Ye, Zhenguo Li, and Xiuqiang He. Deepfm: a factorization-machine based neural network for ctr prediction. In Proceedings of the 26th International Joint Conference on Artificial Intelligence, IJCAI’17, page 1725–1731. AAAI Press, 2017.
- [2] Anna L Buczak and Erhan Guven. A survey of data mining and machine learning methods for cyber security intrusion detection. IEEE Communications surveys & tutorials, 18(2):1153–1176, 2015.
- [3] Stephanie L Hyland, Martin Faltys, Matthias Hüser, Xinrui Lyu, Thomas Gumbsch, Cristóbal Esteban, Christian Bock, Max Horn, Michael Moor, Bastian Rieck, et al. Early prediction of circulatory failure in the intensive care unit using machine learning. Nature medicine, 26(3):364–373, 2020.
- [4] Si-Yang Liu, Hao-Run Cai, Qi-Le Zhou, Huai-Hong Yin, Tao Zhou, Jun-Peng Jiang, and Han-Jia Ye. Talent: A tabular analytics and learning toolbox. Journal of Machine Learning Research, 26(226):1–16, 2025.
- [5] Tianqi Chen. Xgboost: A scalable tree boosting system. Cornell University, 2016.
- [6] Liudmila Prokhorenkova, Gleb Gusev, Aleksandr Vorobev, Anna Veronika Dorogush, and Andrey Gulin. Catboost: unbiased boosting with categorical features. Advances in neural information processing systems, 31, 2018.
- [7] Heng-Tze Cheng, Levent Koc, Jeremiah Harmsen, Tal Shaked, Tushar Chandra, Hrishi Aradhye, Glen Anderson, Greg Corrado, Wei Chai, Mustafa Ispir, et al. Wide & deep learning for recommender systems. In Proceedings of the 1st workshop on deep learning for recommender systems, pages 7–10, 2016.
- [8] Ruoxi Wang, Bin Fu, Gang Fu, and Mingliang Wang. Deep & cross network for ad click predictions. In Proceedings of the ADKDD’17, pages 1–7. 2017.
- [9] Sercan Ö Arik and Tomas Pfister. Tabnet: Attentive interpretable tabular learning. In Proceedings of the AAAI conference on artificial intelligence, volume 35, pages 6679–6687, 2021.
- [10] Yury Gorishniy, Ivan Rubachev, and Artem Babenko. On embeddings for numerical features in tabular deep learning. Advances in Neural Information Processing Systems, 35:24991–25004, 2022.
- [11] David Holzmüller, Leo Grinsztajn, and Ingo Steinwart. Realmlp: Advancing mlps and default parameters for tabular data. In ELLIS workshop on Representation Learning and Generative Models for Structured Data, 2025.
- [12] Weiping Song, Chence Shi, Zhiping Xiao, Zhijian Duan, Yewen Xu, Ming Zhang, and Jian Tang. Autoint: Automatic feature interaction learning via self-attentive neural networks. In Proceedings of the 28th ACM international conference on information and knowledge management, pages 1161–1170, 2019.
- [13] Yury Gorishniy, Ivan Rubachev, Valentin Khrulkov, and Artem Babenko. Revisiting deep learning models for tabular data. Advances in neural information processing systems, 34:18932–18943, 2021.
- [14] Jintai Chen, Jiahuan Yan, Qiyuan Chen, Danny Ziyi Chen, Jian Wu, and Jimeng Sun. Excelformer: A neural network surpassing gbdts on tabular data. arXiv preprint arXiv:2301.02819, 2023.
- [15] Ruoxi Wang, Rakesh Shivanna, Derek Cheng, Sagar Jain, Dong Lin, Lichan Hong, and Ed Chi. Dcn v2: Improved deep & cross network and practical lessons for web-scale learning to rank systems. In Proceedings of the web conference 2021, pages 1785–1797, 2021.
- [16] Maximillian Nickel and Douwe Kiela. Poincaré embeddings for learning hierarchical representations. Advances in neural information processing systems, 30, 2017.
- [17] Wei Peng, Tuomas Varanka, Abdelrahman Mostafa, Henglin Shi, and Guoying Zhao. Hyperbolic deep neural networks: A survey. IEEE Transactions on pattern analysis and machine intelligence, 44(12):10023–10044, 2021.
- [18] Xin Huang, Ashish Khetan, Milan Cvitkovic, and Zohar Karnin. Tabtransformer: Tabular data modeling using contextual embeddings. arXiv preprint arXiv:2012.06678, 2020.
- [19] Yury Gorishniy, Akim Kotelnikov, and Artem Babenko. Tabm: Advancing tabular deep learning with parameter-efficient ensembling. In The Thirteenth International Conference on Learning Representations, 2025.
- [20] Yury Gorishniy, Ivan Rubachev, Nikolay Kartashev, Daniil Shlenskii, Akim Kotelnikov, and Artem Babenko. Tabr: Tabular deep learning meets nearest neighbors. In The Twelfth International Conference on Learning Representations, 2024.
- [21] Han-Jia Ye, Huai-Hong Yin, De-Chuan Zhan, and Wei-Lun Chao. Revisiting nearest neighbor for tabular data: A deep tabular baseline two decades later. In The Thirteenth International Conference on Learning Representations, 2025.
- [22] Noah Hollmann, Samuel Müller, Katharina Eggensperger, and Frank Hutter. TabPFN: A transformer that solves small tabular classification problems in a second. In NeurIPS 2022 First Table Representation Workshop, 2022.
- [23] Ines Chami, Zhitao Ying, Christopher Ré, and Jure Leskovec. Hyperbolic graph convolutional neural networks. Advances in neural information processing systems, 32, 2019.
- [24] Jindou Dai, Yuwei Wu, Zhi Gao, and Yunde Jia. A hyperbolic-to-hyperbolic graph convolutional network. In Proceedings of the IEEE/CVF conference on computer vision and pattern recognition, pages 154–163, 2021.
- [25] Keegan Lensink, Bas Peters, and Eldad Haber. Fully hyperbolic convolutional neural networks. Research in the Mathematical Sciences, 9(4):60, 2022.
- [26] Karan Desai, Maximilian Nickel, Tanmay Rajpurohit, Justin Johnson, and Shanmukha Ramakrishna Vedantam. Hyperbolic image-text representations. In International Conference on Machine Learning, pages 7694–7731. PMLR, 2023.
- [27] Philippe Chlenski, Ethan Turok, Antonio Khalil Moretti, and Itsik Pe’er. Fast hyperboloid decision tree algorithms. In The Twelfth International Conference on Learning Representations, 2024.
- [28] Ponnuthurai Nagaratnam Suganthan, Lingping Kong, Václav Snášel, Varun Ojha, and Hussein Ahmed Hussein Zaky Aly. Euclidean and poincare space ensemble xgboost. Information Fusion, 115:102746, 2025.
- [29] Abraham Albert Ungar. Analytic hyperbolic geometry and Albert Einstein’s special theory of relativity. World Scientific, 2008.
- [30] Min Zhou, Menglin Yang, Bo Xiong, Hui Xiong, and Irwin King. Hyperbolic graph neural networks: A tutorial on methods and applications. In Proceedings of the 29th ACM SIGKDD Conference on Knowledge Discovery and Data Mining, KDD ’23, page 5843–5844, New York, NY, USA, 2023. Association for Computing Machinery.
- [31] Octavian Ganea, Gary Bécigneul, and Thomas Hofmann. Hyperbolic neural networks. Advances in neural information processing systems, 31, 2018.
- [32] Gary Becigneul and Octavian-Eugen Ganea. Riemannian adaptive optimization methods. In International Conference on Learning Representations, 2019.
- [33] Guolin Ke, Qi Meng, Thomas Finley, Taifeng Wang, Wei Chen, Weidong Ma, Qiwei Ye, and Tie-Yan Liu. Lightgbm: A highly efficient gradient boosting decision tree. Advances in neural information processing systems, 30, 2017.
- [34] David Holzmüller, Léo Grinsztajn, and Ingo Steinwart. Better by default: Strong pre-tuned mlps and boosted trees on tabular data. Advances in Neural Information Processing Systems, 37:26577–26658, 2024.
- [35] Janez Demšar. Statistical comparisons of classifiers over multiple data sets. Journal of Machine learning research, 7(Jan):1–30, 2006.
- [36] Ryohei Shimizu, YUSUKE Mukuta, and Tatsuya Harada. Hyperbolic neural networks++. In International Conference on Learning Representations, 2021.
Appendix A Statistics of the Datasets
Table 5 presents detailed statistics of the datasets in the TALENT-tiny-core classification benchmark. Class denotes the number of target classes, Cat the number of categorical features, Num the number of numerical features, and Size the dataset size. All statistics are obtained from the official TALENT GitHub repository. Some details may differ from the original source of the dataset because the TALENT project has processed the dataset.
| name | Class | Cat | Num | Size |
| ada | 2 | 0 | 48 | 3317 |
| airlines | 2 | 4 | 3 | 1600 |
| allbp | 3 | 23 | 6 | 3017 |
| ASP-POTASSCO | 11 | 1 | 140 | 1035 |
| autoUniv-au7-1100 | 5 | 4 | 8 | 880 |
| company_bankruptcy | 2 | 2 | 93 | 5455 |
| eucalyptus | 5 | 5 | 14 | 588 |
| Gender_Gap_in_Spanish | 3 | 0 | 13 | 3796 |
| hill-valley | 2 | 0 | 100 | 969 |
| house_16H | 2 | 0 | 16 | 10790 |
| ibm-employee-performance | 2 | 7 | 23 | 1176 |
| INNHotelsGroup | 2 | 6 | 11 | 29020 |
| internet_firewall | 4 | 0 | 7 | 52425 |
| jasmine | 2 | 136 | 8 | 2387 |
| jungle_chess_2pcs | 3 | 0 | 6 | 35855 |
| law-school-admission | 2 | 4 | 7 | 16640 |
| microaggregation2 | 5 | 0 | 20 | 16000 |
| national-longitudinal | 2 | 7 | 9 | 3926 |
| okcupid_stem | 3 | 11 | 2 | 21341 |
| online_shoppers | 2 | 9 | 5 | 9864 |
| ozone_level | 2 | 36 | 0 | 2028 |
| pc4 | 2 | 0 | 37 | 1166 |
| PhishingWebsites | 2 | 0 | 30 | 8844 |
| rice_cammeo_&_osmancik | 2 | 0 | 7 | 3048 |
| shill-bidding | 2 | 0 | 3 | 5056 |
| Shipping | 2 | 4 | 5 | 8799 |
| statlog | 2 | 13 | 7 | 800 |
| thyroid | 3 | 0 | 21 | 5760 |
| waveform | 3 | 0 | 21 | 4000 |
| wine-quality-red | 6 | 0 | 4 | 1279 |
Appendix B Models for Comparison
Table 6 lists all models included in the ranking, with results provided by the official TALENT project. Note that some recent models, such as TabM and TabPFN v2, are excluded because their official benchmark results on TALENT have not yet been released, although their code has been integrated into the framework. We report full dataset-level results for HDE-Net to facilitate future comparisons.
|
|
|||||||
|
|