Environmental Drivers of Respiratory Disease: A District Level Analysis
Abstract
Sri Lanka has experienced a decade of progressive forest degradation and rising atmospheric pollution, yet district-level respiratory admissions have paradoxically declined, pointing to the confounding role of healthcare access. This study addresses that gap by constructing an 11-year (2014- 2024) panel dataset across all 25 administrative districts, integrating satellite-derived vegetation indices, fire radiative power, pollutant concentrations (particulate matter (PM2.5), nitrogen dioxide (NO2), sulfur dioxide (SO2)), carbon flux metrics and population- normalized respiratory admission rates. Two temporally validated XGBoost models were created for annual district-level respiratory rate () and monthly PM2.5 concentration. () with generalization validated in 21 out of 25 districts (Mean Absolute Percentage Error (MAPE )). Shapley Additive Explanations (SHAP) analysis identified cumulative air quality burden as the strongest predictor of respiratory rate variance in the model (80.1% of the aggregate environmental SHAP signal), ahead of forest degradation (15.6%) and fire activity (4.3%). The Forest-Air-Health (FAH) Risk Index used these SHAP-derived weights to find the districts with the highest risk: Colombo (FAH ), Gampaha (0.708), and Kalutara (0.682). These findings present the inaugural evidence-based, district-level framework correlating environmental degradation with respiratory health in Sri Lanka, establishing a quantitative basis for focused public health and environmental policy.
I Introduction
Sri Lanka lost about 230,000 hectares of tree cover [3] from 2001 to 2024. This was due to biomass burning, agricultural fires, and urbanization [13] in the North Western, North Central, and Northern provinces. Long-term exposure to PM2.5, NO2, and SO2 is linked to bronchitis, asthma, Chronic Obstructive Pulmonary Disease (COPD), and respiratory mortality [16, 10]. However, the environmental factors that affect respiratory admissions in Sri Lanka’s 25 districts have not yet been measured at the district level [5].
Previous research reveals three significant deficiencies: remote sensing analyses conclude at land cover classification without establishing connections to health outcomes [14]; air quality forecasting has been limited to Colombo [12]; and epidemiological studies focus on individual pollutants over short time frames [10]. This study fills these gaps by creating an 11-year harmonized panel dataset that includes forest, fire, atmospheric, and health variables for all 25 districts. It also trains temporal XGBoost models [1] to predict district-level respiratory rates and monthly PM2.5; uses SHAP-based interpretation to measure environmental drivers; and creates the Forest-Air-Health (FAH) Risk Index to rank all 25 districts by environmental health risk using weights informed by SHAP importance. ![[Uncaptioned image]](2607.04416v2/images/huggingface.png) Data and
Data and ![[Uncaptioned image]](2607.04416v2/images/github.png) code for this work are publicly available.
code for this work are publicly available.
II Related Work
Hansen et al. [3] offer the fundamental 30 m global forest cover change product that supports analyses of tropical deforestation. The Northern Province of Sri Lanka experienced the most significant tree cover loss compared to 2010 levels [17, 11]. Additionally, Vijitharan et al. [14] illustrated canopy fragmentation in Vavuniya utilizing Google Earth Engine; however, neither study established a connection between the findings and health outcomes. NASA MERRA-2 [8] and CAMS EAC4 [4] reanalysis products provide monthly PM2.5, SO2, and NO2 at a coarse spatial resolution. XGBoost has become the leading algorithm for air quality regression due to its ability to capture non-linear feature interactions [1]. Rathnayaka et al. [12] attained commendable Air Quality Index (AQI) forecasting accuracy in Colombo, albeit limited to a single district, while Priyankara et al. [10] discerned short-term PM2.5 correlations with respiratory admissions in Kandy. World Health Organization (WHO) data substantiate significant pollution-related Disability-Adjusted Life Years (DALYs) at the national level [16, 15]; however, no previous study has concurrently evaluated various pollutants, deforestation, and respiratory disease burden across all 25 districts of Sri Lanka.
III Methodology
III-A Data Sources and Panel Construction
The panel dataset covers the years 2014 to 2024, with 3,300 observations (25 districts 12 months 11 years). We made district composites by putting point measurements (active fire locations from SUOMI VIIRS C2) and raster measurements (MERRA-2 atmospheric variables, VIIRS 8-day vegetation indices) on top of HDX district boundary polygons. Daily and 8-day satellite data were averaged to make monthly composites. Annual health records were spread out evenly over the months of the year. After fire-NaN imputation, the final dataset had 3,300 observations and 115 feature-engineered variables that looked at deforestation, fire activity, air pollution, vegetation indices, demographics and health outcomes.
| Domain | Source | Key Variables |
| Forest Cover & Carbon | GFW (threshold 30%) [17], Hansen GFC [3] | tc_loss_ha, ExtentIn2010, carbon stocks, emissions, net flux |
| Vegetation | VIIRS 8-day via GLAM [7] | VIM, VIM anomaly, VIM climatology, VIM range |
| Fire Activity | NASA FIRMS, SUOMI VIIRS C2 [6] | Fire Radiative Power (FRP) mean/total, brightness, fire type |
| PM2.5, SO2 | MERRA-2 via Giovanni [8] | PM2.5 g/m3, SO2 g/m3 |
| NO2 | CAMS EAC4 reanalysis [4] | NO2 g/m3 |
| Health | MoH Annual Health Bulletin [5] | Bronchitis/COPD (J40-J44), Asthma (J45-J46) admissions, deaths, Case Fatality Rate (CFR) |
| Population | DCS, Sri Lanka [2] | Total, male, female mid-year population (1k) |
| Boundaries | HDX Admin Level 2 [9] | District polygons |
III-B Spatial Processing of Atmospheric Data
District-level PM2.5 and SO2 concentrations were derived from MERRA-2 M2TMNXAER v5.12.4 [8] gridded data ( resolution) using spatial area-weighted aggregation. Each grid cell centroid was converted to a rectangular polygon using its half-widths ( latitude, longitude) and intersected with Sri Lanka’s district boundaries. The area-weighted concentration for district is:
| (1) |
where is the amount of grid cell and is the area where grid cell and district overlap. This area-weighting method gets rid of spatial sampling bias that can happen when you use point-based or nearest-neighbor assignments across uneven administrative boundaries. To change kg m-3 to g m-3, you had to multiply by . We got the NO2 concentrations from the CAMS EAC4 monthly reanalysis [4] (1000 hPa level) and changed them from mass mixing ratios (kg kg-1) to g m-3 by multiplying by air density (1.225 kg m-3) and . Using the same area-weighted overlay in GeoPandas (EPSG:32644, UTM Zone 44N), we got district-level values. This made sure that the method used for PM2.5 and SO2 processing was the same.
III-C Data Preprocessing
There were six preprocessing steps: (i) normalizing column names to get rid of whitespace and BOM characters; (ii) filling in missing values for fire data by setting FRP to 0 and fire type to ”No fire” for district-months with no hot-spots found by SUOMI VIIRS C2; (iii) aligning the data over time by spreading annual health records evenly across 12 months, which was a necessary simplification that the yearly respiratory model took care of; (iv) labeling and cyclic encoding of province, district, fire type, and month variables; (v) feature engineering produced 75 new variables across demographic, health, forest, fire, vegetation, and composite domains, including temporal lags (one-month and three-month), rolling three-month averages, and year-over-year differences for seven key variables (PM2.5, SO2, NO2, respiratory rate, VIM, FRP and tree cover loss) computed in district-ordered fashion to avoid data leakage; and (vi) quality validation confirming 3,300 complete records with no missing values outside lag-derived features.
III-D Exploratory Data Analysis Pipeline
The Exploratory Data Analysis (EDA) pipeline consisted of four stages: (i) distribution histograms with Kernel Density Estimation (KDE) overlays to evaluate marginal distributions and skewness for 14 key variables; (ii) Pearson and Spearman cross-correlation matrices and heatmaps to detect inter-domain dependencies among pollution, vegetation, fires, and health, including a cumulative pollution index that integrates scaled PM2.5, SO2, and NO2; (iii) year-on-year national aggregations with linear slope coefficients to analyze temporal trends; and (iv) Principal Component Analysis (PCA) for dimensionality reduction and -means clustering, with the number of clusters determined through the elbow method to identify district archetypes.
III-E Machine Learning Pipeline
Two temporal XGBoost regressors were developed using a strict chronological protocol: training years 2015–2020, testing years 2021–2024, and 2014 excluded due to insufficient lagged features. There were no separate calendar validation years; instead, validation for model selection was performed via time-series cross-validation folds drawn entirely from within the 2015–2020 training window, so the 2021–2024 test years were never used for fitting or tuning.
Model 1: Yearly Respiratory Rate (Primary). This model works at an annual resolution to avoid artifacts that come from spreading out annual health records over months. The dataset consisted of 250 district-year observations (25 districts 10 years), divided into 150 training observations and 100 test observations. The 49-variable feature vector comprised 42 numerical environmental variables, along with categorical variables for calendar year, district, and province. It also included cross-year auto regressive health lags (previous year, two years prior, two-year mean, and year-over-year change) to capture temporal dependencies without data leakage.
Model 2: Monthly PM2.5 Forecasting. This model works with monthly data and has a 43-variable feature vector that includes vegetation indices and anomalies, forest cover, biomass, FRP, brightness, smoke proxy, co-pollutant lags and rolling averages, population density, cyclic month encoding, and district and season as categorical variables.
Both models were tuned by randomized search over ensemble size, learning rate, maximum depth, sub-sampling ratios, and L1/L2 regularization, with time-series cross-validation (3 folds for the yearly model; 4 folds for the monthly model). The search ranges, final selected values, and the fixed random seed are reported in Table II for reproducibility. A temporal rather than random split was used to test whether environmental covariates generalize to future unseen years. SHAP TreeExplainer was used to decompose predictions into feature-level contributions, aggregated across three environmental domains (Forest, Fire, and Air Quality) to obtain the SHAP-informed weights used in the FAH Risk Index.
| Hyperparameter | Search Range | Yearly | Monthly |
| n_estimators | {300,500,700,900} | 300 | 900 |
| learning_rate | {0.01,0.03,0.05,0.08} | 0.05 | 0.08 |
| max_depth | {3,4,5,6} | 3 | 3 |
| subsample | {0.7,0.8,0.9,1.0} | 0.7 | 1.0 |
| colsample_bytree | {0.7,0.8,0.9,1.0} | 0.9 | 0.7 |
| min_child_weight | {1,3,5} | 5 | 1 |
| reg_alpha (L1) | {0,0.1,0.3} | 0 | 0.1 |
| reg_lambda (L2) | {1,1.5,2} | 1 | 1.5 |
| Random seed 42, fixed across all stochastic components. | |||
IV Results and Discussion
IV-A Descriptive Statistics of the Dataset
The dataset contains 3,300 observations from 25 districts in 9 provinces over 11 years (2014-2024) at a rate of 300 records per year, with 115 engineered features covering forest degradation, fire activity, air quality, vegetation health and respiratory health outcomes.
Air quality. The mean concentration of PM2.5 was 16.51 g/m3 (SD ) and above the WHO guideline of 5 g/m3 for all observations. The Northern (20.02), North Western (17.93) and Western (17.11 g/m3) provinces recorded the highest pollution levels. Concentrations peaked between May and July due to biomass burning and were lowest in October (13.47 g/m3). Average SO2 and NO2 were 1.77 and 7.64 g/m3, respectively.
Degradation of forests. Mean tree cover loss was 473 ha (SD ) with the highest losses in the North Western (970 ha) and North Central (847 ha) provinces. Although the carbon emissions were high (193,358 units), the net carbon flux was still negative (mean = -437,704), meaning the country was still a net carbon sink during the study period.
Fire activity. Active fires were recorded in 70% of observations (), with peak fire activity in August, when 89.7% of district-months reported fire. Fire radiative power was highly right-skewed (mean , median ) consistent with short, intense burning episodes.
Respiratory health. The total respiratory rate was between 0.007 and 21.45 per 1,000 (mean = 9.17), with asthma (7.39 per 1,000) more common than bronchitis (1.78 per 1,000). District populations ranged from 95,000 to 2,480,000.
IV-B Findings From Exploratory Data Analysis
1) Cross-Domain Relationships: The negative correlation of vegetation cover (VIM) with PM2.5 () confirms the vegetative filtering effect. The strong positive correlation between NO2 and SO2 () suggests common emission sources. The composite pollution index is paradoxically positively correlated with both forest cover () and tree cover loss (), implying that biomass burning in forested areas compensates for vegetative filtration. Forest cover and gross carbon emissions are strongly correlated ().
2) Temporal Trends: At the national level, NO2 and PM2.5 have risen (slopes of and g/m3/year, respectively), whereas tree cover loss (slope ha/year), respiratory hospital admissions (slope per 1,000/year), and carbon emissions (27,198 Mg CO2e/year) have declined. The fall in admissions is more likely attributable to improvements in healthcare access than to reduced pollution exposure, and lower carbon emissions are consistent with reduced deforestation intensity in recent years.
3) Deforestation and Respiratory Burden: At the district level, deforestation alone is a poor predictor of respiratory outcomes. Jaffna and Colombo share nearly identical tree cover loss rates (0.8% and 0.7%) yet differ substantially in respiratory rates (13 vs. 6.2 per 1,000), a disparity likely attributable to Colombo’s stronger healthcare infrastructure. Hambantota’s elevated respiratory rates (13 per 1,000) despite moderate deforestation further confirm that multiple exposure pathways, not deforestation alone, are associated with respiratory outcomes.

4.) Principal Component Analysis: PCA showed six components accounting for 95.0% of the total variance (Fig. 2). PC1 (27.9%) was involved in pollution intensity and carbon sink effectiveness. PC2 (21.7%) was involved in forest health and vegetation status. Districts in the Northern Province clustered towards high PC1 and low PC2, indicating higher degradation and pollution, while the other provinces clustered towards low PC1 and high PC2, indicating comparatively healthy environmental conditions.

5) District Clustering: The -means clustering () grouped districts into four archetypes (Fig. 3): (i) high urbanization and pollution (Western Province); (ii) moderate pollution with high fire activity (North Central and North Western provinces); (iii) high forest cover with low pollution (Sabaragamuwa and Central provinces); and (iv) post-conflict Northern districts with high deforestation and mixed health outcomes.

IV-C Model Performance
Table III summarizes the evaluation metrics for both XGBoost models.
| Model | Level | Test | MAE | CV |
| Respiratory Rate | Yearly | 0.937 | 0.776 | 0.797 |
| PM2.5 (g/m3) | Monthly | 0.976 | 0.520 | 0.943 |
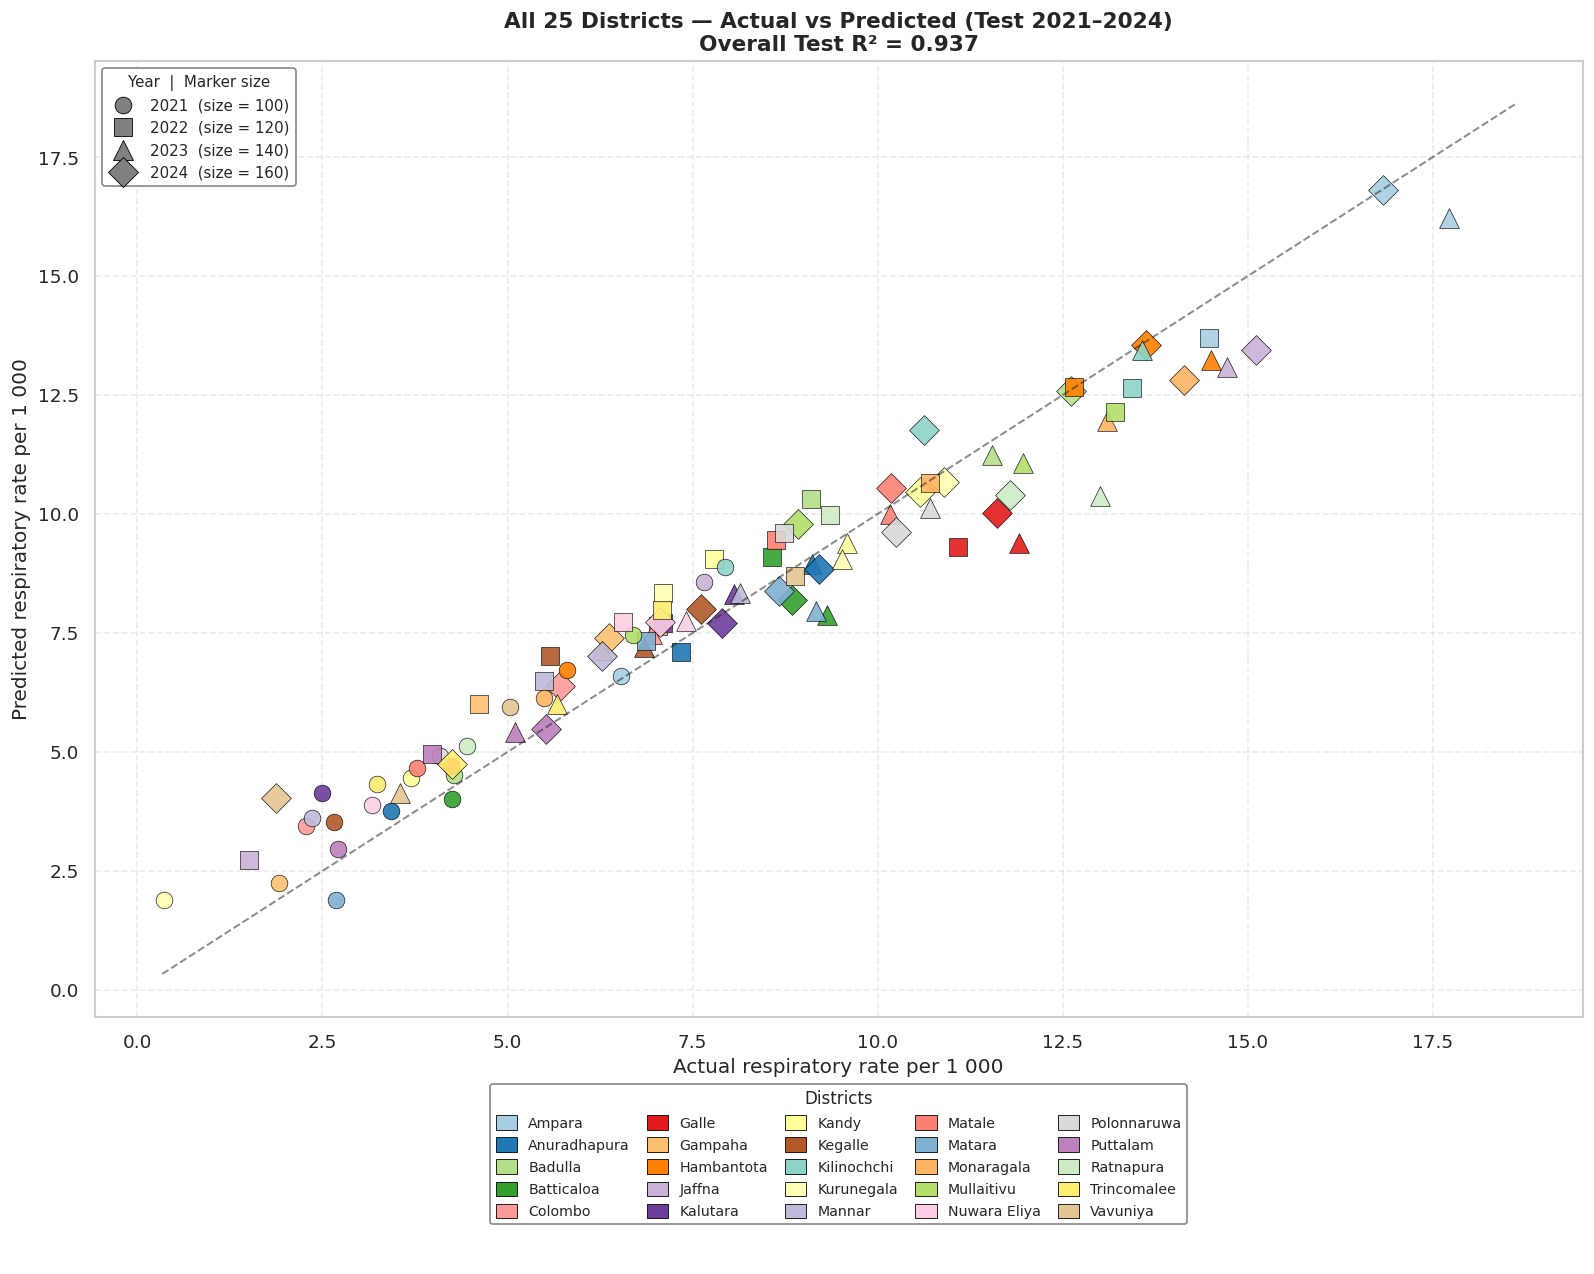
1) Yearly Respiratory Rate Model (Main): The model achieved a test (cross-validation (CV): ) with a Mean Absolute Error (MAE) = cases per 1,000 population. Figure 4 shows the strong overlap along the diagonal for all 25 districts over the 2021-2024 test period. Table IV shows the per-district validation, confirming that 21 out of 25 districts satisfy MAPE . The model trained on pre-pandemic data (2015-2020) could not explain the anomalous MAPE of 114.7% in Kurunegala due to COVID-19 pandemic reporting disruptions in 2020-2021. This is treated as a data quality artifact and not a failure of the model. The gap between the cross-validation score () and the test score () warrants caution: with only 150 training observations and 49 features, the higher test value partly reflects comparatively stable environmental and reporting conditions during 2021–2024 rather than a uniform gain in generalization. Because every lagged and rolling feature is computed in district-ordered fashion and the split is purely temporal, look-ahead leakage is precluded as an explanation for the high scores.
| District | MAE | MAPE (%) | Quality |
| Ampara | 0.592 | 3.8 | Good |
| Anuradhapura | 0.276 | 4.7 | Good |
| Badulla | 0.445 | 5.4 | Good |
| Hambantota | 0.576 | 6.4 | Good |
| Kilinochchi | 0.754 | 7.4 | Good |
| Kandy | 0.581 | 10.0 | Good |
| Colombo | 0.751 | 19.9 | Good |
| Kalutara | 0.677 | 20.0 | Good |
| Mannar | 0.795 | 21.3 | OK |
| Jaffna | 1.359 | 28.6 | OK |
| Vavuniya | 0.962 | 38.1 | Poor |
| Kurunegala | 0.867 | 114.7 | Poor |
| Good: MAPE ; OK: 20%–35%; Poor: . | |||
| 12 of 25 districts shown; remaining 13 all “Good”. | |||
2) Model of monthly PM2.5: The model achieved a test of 0.976 (CV: 0.943), MAE of g/m3, and RMSE of g/m3, which is a significant improvement over a baseline model (), defined as an XGBoost model trained on the pre-feature-engineering dataset—using only raw co-pollutant and meteorological inputs, without the engineered temporal lags, rolling averages, cross-domain interactions, or cyclic month encoding. The performance improvement is attributable to the incorporation of pollutant lags, rolling averages, cross-domain interactions, and cyclic month encoding.
IV-D SHAP Feature Importance Analysis
We calculated SHAP TreeExplainer values for the yearly respiratory model on 100 test observations (25 districts 4 years), and we found four main results.
1) Consolidated Global Feature Importance: pollution_health_burden is the most important predictor (mean , 49.5% of total SHAP contribution), followed by SO2 (5.9%), the yr_roll2 respiratory lag features (5.1%), the pollution index (4.7%), and vim_max (4.6%), as shown in Fig. 5.

2) Environmental SHAP Decomposition: Grouping SHAP scores by environmental category reveals that Air Quality Risk attributes account for 80.1% of the aggregate environmental SHAP signal, far exceeding Forest Risk (15.6%) and Fire Risk (4.3%). This decomposition contradicts naive equal-weight allocation of one third per domain and provides the empirical basis for the unequal FAH Risk Index weights.
3) SHAP Beeswarm Analysis: The beeswarm plot (Fig. 6) confirms opposing directional effects: high values of pollution_health_burden increase predicted respiratory burden, whereas high values of vim_max, indicative of healthy vegetation, exert a net protective effect, consistent with the inverse correlation observed in the EDA.

4) District-Level SHAP Decomposition: Figure 7 presents the mean SHAP contribution of each FAH component by district. Western Province districts (Colombo, Gampaha, and Kalutara) exhibit the highest positive SHAP scores, with respiratory risk attributed predominantly to the Air Quality Risk component. Conversely, Eastern Province districts (Batticaloa and Trincomalee) show the most negative SHAP scores, reflecting a net protective effect against respiratory burden.

IV-E Forest-Air-Health (FAH) Risk Index
Using SHAP-derived weights (Forest: 15.6%, Fire: 4.3%, Air Quality: 80.1%), each domain is represented by district-level mean sub-indicators individually normalized to using min-max normalization. Sub-indicators where higher values indicate lower risk (vegetation index median, VIM anomaly, and forest cover percentage) are inverted as to ensure directional consistency. Normalized sub-indicators are averaged to produce a domain score, with five sub-indicators for the Forest and Fire domains and four for Air Quality (PM2.5, NO2, SO2, and composite pollution index). The final FAH score is computed as:
| (2) |
where , , and . We stress that the FAH Risk Index is a heuristic composite rather than a direct model output: its weights are informed by the SHAP importance decomposition of the respiratory model, but the index itself is computed from normalized environmental sub-indicators, not from model predictions. It should therefore be interpreted as a transparent, SHAP-weighted environmental-risk score rather than a direct estimate of respiratory burden. Table V presents the top-5 and bottom-5 districts. Colombo (0.802), Gampaha (0.708), and Kalutara (0.682) are the highest-risk districts, driven by elevated air quality scores. Kegalle (0.528), Ratnapura (0.470), Kurunegala (0.437), and Nuwara Eliya (0.425) fall in the moderate-risk tier, while the remaining 18 districts fall below the low-risk threshold ().
| Rank | District | FAH | Forest | Fire | Air |
| 1 | Colombo | 0.802 | 0.595 | 0.018 | 0.884 |
| 2 | Gampaha | 0.708 | 0.448 | 0.286 | 0.781 |
| 3 | Kalutara | 0.682 | 0.523 | 0.143 | 0.742 |
| 4 | Kegalle | 0.528 | 0.400 | 0.102 | 0.576 |
| 5 | Ratnapura | 0.470 | 0.209 | 0.425 | 0.523 |
| 21 | Polonnaruwa | 0.274 | 0.233 | 0.565 | 0.266 |
| 22 | Vavuniya | 0.265 | 0.427 | 0.549 | 0.218 |
| 23 | Ampara | 0.254 | 0.325 | 0.686 | 0.217 |
| 24 | Trincomalee | 0.231 | 0.367 | 0.519 | 0.190 |
| 25 | Batticaloa | 0.208 | 0.345 | 0.508 | 0.165 |

IV-F Study Limitations
Several limitations should be noted. Most importantly, this study characterizes associations rather than causal effects, and the models do not include healthcare access, which our own results identify as a key confounder: districts with comparable environmental exposure but stronger healthcare infrastructure (e.g., Colombo vs. Jaffna) report markedly different respiratory rates. District-level proxies for healthcare access (e.g., hospital beds or physicians per capita), together with demographic, smoking-prevalence, urbanization, and socioeconomic covariates, were unavailable in harmonized 11-year form and are left to future work; their omission means the reported SHAP rankings should be read as the strongest predictors within the available environmental feature set rather than as the dominant determinants of respiratory burden overall. Second, health data were annualized uniformly across months, which discards within-year seasonality (e.g., monsoon-linked spikes) and weakens temporal alignment between predictors and outcomes; the yearly respiratory model was adopted specifically to limit this effect, and monthly modeling is therefore restricted to PM2.5. Third, the coarse resolution of MERRA-2 () and CAMS grids may conceal sub-district pollution sources, and the PM2.5 model lacks an explicit trans-boundary transport indicator (e.g., wind direction, Indian AQI, or neighboring-region biomass-burning indices), even though the MERRA-2 inputs implicitly capture some cross-border smog from Indian agricultural burning; the residual PM2.5 variance (2.4%) likely reflects these omissions alongside microclimate and household-cooking emissions. Finally, accuracy is weakest in a few districts (Vavuniya, Jaffna, and especially Kurunegala, MAPE ), where COVID-19 reporting disruptions (2020–2021) distorted admission records; these are treated as data-quality artifacts rather than model failures.
V Conclusion and Future Work
This is the first nationwide district-level study in Sri Lanka to examine the relationships between forest degradation, atmospheric pollution, and respiratory health over the period 2014-2024. Five principal findings were established: (1) forest degradation is associated with reduced natural particulate filtration capacity of vegetation ( between vegetation index and PM2.5); (2) air quality is the strongest predictor of respiratory rate in the model, comprising 80.1% of the aggregate environmental SHAP signal, ahead of forest degradation (15.6%) and fire activity (4.3%), though this attribution reflects predictive importance rather than established causation; (3) temporally cross-validated XGBoost models achieved high predictive accuracy for yearly respiratory rate () and monthly PM2.5 (); (4) the FAH Risk Index identifies Colombo, Gampaha, and Kalutara as the highest-risk districts; and (5) PCA and -means clustering revealed six environmental risk axes and four distinct district archetypes. Future work will focus on incorporating monthly health records and vehicle emission data, developing Auto-regressive Integrated Moving Average (ARIMA) and Long Short-Term Memory (LSTM) forecasting models to project district-level PM2.5 concentrations to 2030, and operationalizing the FAH Risk Index as a deployable early-warning system for public health agencies.
References
- [1] (2016) Xgboost: A scalable tree boosting system. In Proceedings of the 22nd acm sigkdd international conference on knowledge discovery and data mining, pp. 785–794. Cited by: §I, §II.
- [2] (2024) Mid-year population by district and sex, 2014–2024. Government of Sri Lanka. Cited by: TABLE I.
- [3] (2013) High-resolution global maps of 21st-century forest cover change. science 342 (6160), pp. 850–853. Cited by: §I, §II, TABLE I.
- [4] (2024) The CAMS reanalysis of atmospheric composition. Atmospheric Chemistry and Physics 19 (6), pp. 3515–3556. Cited by: §II, §III-B, TABLE I.
- [5] (2022) Annual health bulletin: Hospitalizations, hospital deaths and case fatality rates of selected non-communicable diseases by RDHS division. Government of Sri Lanka. Cited by: §I, TABLE I.
- [6] (2024) SUOMI VIIRS C2 active fire and thermal anomaly data. NASA. Cited by: TABLE I.
- [7] (2024) VIIRS 8-day vegetation index. NASA. Cited by: TABLE I.
- [8] (2024) Giovanni: MERRA-2 M2TMNXAER v5.12.4 monthly PM2.5 and SO2 surface mass concentration (). Cited by: §II, §III-B, TABLE I.
- [9] (2025) Sri Lanka subnational administrative boundaries (admin level 2). Humanitarian Data Exchange. Cited by: TABLE I.
- [10] (2021) Ambient PM2.5 and PM10 Exposure and Respiratory Disease Hospitalization in Kandy, Sri Lanka. International Journal of Environmental Research and Public Health 18 (18), pp. 9617. Cited by: §I, §I, §II.
- [11] (2024) Deforestation in Sri Lanka (2001–2024): Trends, Drivers, and Policy Implications. Note: The Island, Colombo Cited by: §II.
- [12] (2024) Development of a Machine Learning Model for Air Quality Forecasting: Leveraging Long-term Meteorological Data Analysis to Predict Air Quality Index in Colombo District. University of Kelaniya, Sri Lanka. Cited by: §I, §II.
- [13] (2023-07) It’s time to act on sri lanka’s air quality. Cited by: §I.
- [14] (2022) Assessment of Forest Cover Changes in Vavuniya District, Sri Lanka: Implications for the Establishment of Subnational Forest Reference Emission Level. Land 11 (7), pp. 1061. Cited by: §I, §II.
- [15] (2022) Ambient air quality database, 2022 update. Cited by: §II.
- [16] (2024) Global Health Observatory: Air pollution indicators: Sri Lanka. Cited by: §I, §II.
- [17] (2024) Global Forest Watch, Sri Lanka deforestation rates & statistics (threshold 30%, subnational 1). Cited by: §II, TABLE I.