Galaxy Clusters Selected via the Sunyaev-Zel’dovich Effect in 5 year data from the SPT-3G Main Survey⋆E-mail:lbleem@anl.gov
L. E. Bleem
Alternate Affiliation: High-Energy Physics Division, Argonne National Laboratory, 9700 South Cass Avenue, Lemont, IL, 60439, USA
M. Klein
Alternate Affiliation: Kavli Institute for Cosmological Physics, University of Chicago, 5640 South Ellis Avenue, Chicago, IL, 60637, USA
K. Kornoelje
Alternate Affiliation: Department of Astronomy and Astrophysics, University of Chicago, 5640 South Ellis Avenue, Chicago, IL, 60637, USA
S. Bocquet
Alternate Affiliation: University Observatory, Faculty of Physics, LMU Munich, Scheinerstr. 1, 81679 Munich, Germany
J. A. Sobrin
Alternate Affiliation: Department of Physics, Villanova University, 800 E Lancaster Ave, Villanova, PA 19085, USA
M. Aguena
Alternate Affiliation: Fermi National Accelerator Laboratory, MS209, P.O. Box 500, Batavia, IL, 60510, USA
E. Anderes
Alternate Affiliation: Laboratório Interinstitucional de e-Astronomia - LIneA, Rua Gal. José Cristino 77, Rio de Janeiro, RJ - 20921-400, Brazil
A. J. Anderson
Alternate Affiliation: INAF-Osservatorio Astronomico di Trieste, via G. B. Tiepolo 11, I-34143 Trieste, Italy
F. Andrade-Oliveira
Alternate Affiliation: Department of Statistics, University of California, One Shields Avenue, Davis, CA 95616, USA
B. Ansarinejad
Alternate Affiliation: Physik-Institut, University of Zürich, Winterthurerstrasse 190, CH-8057 Zürich, Switzerland
M. Archipley
Alternate Affiliation: School of Physics, University of Melbourne, Parkville, VIC 3010, Australia
L. Balkenhol
Alternate Affiliation: Sorbonne Université, CNRS, UMR 7095, Institut d’Astrophysique de Paris, 98 bis bd Arago, 75014 Paris, France
D. R. Barron
Alternate Affiliation: Department of Physics and Astronomy, University of New Mexico, Albuquerque, NM, 87131, USA
P. S. Barry
Alternate Affiliation: School of Physics and Astronomy, Cardiff University, Cardiff CF24 3YB, United Kingdom
M. Bayliss
Alternate Affiliation: Department of Physics,University of Cincinnati, Cincinnati,OH 45221, USA
K. Benabed
Alternate Affiliation: Kavli Institute for Particle Astrophysics and Cosmology, Stanford University, 452 Lomita Mall, Stanford, CA, 94305, USA
A. N. Bender
Alternate Affiliation: Department of Physics, Stanford University, 382 Via Pueblo Mall, Stanford, CA, 94305, USA
B. A. Benson
Alternate Affiliation: SLAC National Accelerator Laboratory, 2575 Sand Hill Road, Menlo Park, CA, 94025, USA
F. Bianchini
Alternate Affiliation: Department of Physics & Astronomy, University College London, Gower Street, London, WC1E 6BT, UK
F. R. Bouchet
Alternate Affiliation: Center for Astrophysics | Harvard & Smithsonian, 60 Garden Street, Cambridge, MA, 02138, USA
D. Brooks
Alternate Affiliation: School of Mathematics and Physics, University of Queensland, Brisbane, QLD 4072, Australia
D. L. Burke
Alternate Affiliation: Enrico Fermi Institute, University of Chicago, 5640 South Ellis Avenue, Chicago, IL, 60637, USA
M. Calzadilla
Alternate Affiliation: Department of Physics, University of Chicago, 5640 South Ellis Avenue, Chicago, IL, 60637, USA
R. Camilleri
Alternate Affiliation: Instituto de Astrofisica de Canarias, E-38205 La Laguna, Tenerife, Spain
E. Camphuis
Alternate Affiliation: Universidad de La Laguna, Dpto. Astrofísica, E-38206 La Laguna, Tenerife, Spain
M. G. Campitiello
Alternate Affiliation: Institut de Física d’Altes Energies (IFAE), The Barcelona Institute of Science and Technology, Campus UAB, 08193 Bellaterra (Barcelona) Spain
J. E. Carlstrom
Alternate Affiliation: Istituto ricerche solari Aldo e Cele Daccò (IRSOL), Faculty of Informatics, Università della Svizzera italiana, 6605 Locarno, Switzerland
A. Carnero Rosell
Alternate Affiliation: Université de Genève, Département de Physique Théorique, 24 Quai Ansermet, CH-1211 Genève 4, Switzerland
J. Carretero
Alternate Affiliation: National Taiwan University, No. 1, Sec. 4, Roosevelt Road, Taipei 106319, Taiwan
J. Carron
Alternate Affiliation: Department of Physics, University of California, Berkeley, CA, 94720, USA
C. L. Chang
Alternate Affiliation: Astronomy Unit, Department of Physics, University of Trieste, via Tiepolo 11, I-34131 Trieste, Italy
P. M. Chichura
Alternate Affiliation: Institute for Fundamental Physics of the Universe, Via Beirut 2, 34014 Trieste, Italy
A. Chokshi
Alternate Affiliation: Université Paris-Saclay, Université Paris Cité, CEA, CNRS, AIM, 91191, Gif-sur-Yvette, France
T.-L. Chou
Alternate Affiliation: Department of Astronomy, University of Illinois Urbana-Champaign, 1002 West Green Street, Urbana, IL, 61801, USA
A. Coerver
Alternate Affiliation: High Energy Accelerator Research Organization (KEK), Tsukuba, Ibaraki 305-0801, Japan
M. Costanzi
Alternate Affiliation: Centro de Investigaciones Energéticas, Medioambientales y Tecnológicas (CIEMAT), Madrid, Spain
T. M. Crawford
Alternate Affiliation: Department of Physics, IIT Hyderabad, Kandi, Telangana 502285, India
L. N. da Costa
Alternate Affiliation: Department of Physics and McGill Space Institute, McGill University, 3600 Rue University, Montreal, Quebec H3A 2T8, Canada
C. Daley
Alternate Affiliation: Canadian Institute for Advanced Research, CIFAR Program in Gravity and the Extreme Universe, Toronto, ON, M5G 1Z8, Canada
T. M. Davis
Alternate Affiliation: Joseph Henry Laboratories of Physics, Jadwin Hall, Princeton University, Princeton, NJ 08544, USA
T. de Haan
Alternate Affiliation: California Institute of Technology, 1200 East California Boulevard., Pasadena, CA, 91125, USA
J. De Vicente
Alternate Affiliation: Department of Physics, University of Michigan, 450 Church Street, Ann Arbor, MI, 48109, USA
S. Desai
Alternate Affiliation: Department of Astronomy, University of Michigan, Ann Arbor, MI 48109, USA
K. R. Dibert
Alternate Affiliation: Leinweber Center for Theoretical Physics, University of Michigan, Ann Arbor, MI 48109, USA
H. T. Diehl
Alternate Affiliation: Department of Astronomy, University of Science and Technology of China, Hefei 230026, China
M. A. Dobbs
Alternate Affiliation: School of Astronomy and Space Science, University of Science and Technology of China, Hefei 230026
M. Doohan
Alternate Affiliation: Department of Physics, University of Illinois Urbana-Champaign, 1110 West Green Street, Urbana, IL, 61801, USA
D. Dutcher
Alternate Affiliation: Department of Physics and Astronomy, University of California, Los Angeles, CA, 90095, USA
S. Everett
Alternate Affiliation: Department of Physics and Astronomy, Michigan State University, East Lansing, MI 48824, USA
G. Evrard
Alternate Affiliation: Institute of Cosmology and Gravitation, University of Portsmouth, Portsmouth, PO1 3FX, UK
C. Feng
Alternate Affiliation: Department of Physics, Massachusetts Institute of Technology, 77 Massachusetts Avenue, Cambridge, MA 02139, USA
K. R. Ferguson
Alternate Affiliation: Instituto de Fisica Teorica UAM/CSIC, Universidad Autonoma de Madrid, 28049 Madrid, Spain
N. C. Ferree
Alternate Affiliation: Department of Physics & Astronomy, University of California, One Shields Avenue, Davis, CA 95616, USA
K. Fichman
Alternate Affiliation: Universität Innsbruck, Institut für Astro- und Teilchenphysik, Technikerstr. 25/8, 6020 Innsbruck, Austria
B. Flaugher
Alternate Affiliation: CASA, Department of Astrophysical and Planetary Sciences, University of Colorado, Boulder, CO, 80309, USA
B. Floyd
Alternate Affiliation: Department of Physics, University of Colorado, Boulder, CO, 80309, USA
K. Fosdick
Alternate Affiliation: Santa Cruz Institute for Particle Physics, Santa Cruz, CA 95064, USA
A. Foster
Alternate Affiliation: Department of Astronomy & the DiRAC Institute, University of Washington, Physics-Astronomy Building, Box 351580, Seattle, WA 98195-1700, USA
S. Galli
Alternate Affiliation: eScience Institute, University of Washington, Physics-Astronomy Building, Box 351580, Seattle, WA 98195-1700, USA
A. E. Gambrel
Alternate Affiliation: Australian Astronomical Optics, Macquarie University, North Ryde, NSW 2113, Australia
A. K. Gao
Alternate Affiliation: Lowell Observatory, 1400 Mars Hill Rd, Flagstaff, AZ 86001, USA
J. García-Bellido
Alternate Affiliation: Department of Physics & Astronomy, Box 41051, Texas Tech University, Lubbock TX 79409-1051, USA
F. Ge
Alternate Affiliation: STAR Institute, Quartier Agora - Allée du six Août, 19c B-4000 Liége, Belgium
M. D. Gladders
Alternate Affiliation: George P. and Cynthia Woods Mitchell Institute for Fundamental Physics and Astronomy, and Department of Physics and Astronomy, Texas A&M University, College Station, TX 77843, USA
S. Grandis
Alternate Affiliation: Aix Marseille Univ, CNRS/IN2P3, CPPM, Marseille, France
F. Guidi
Alternate Affiliation: LPSC Grenoble - 53, Avenue des Martyrs 38026 Grenoble, France
S. Guns
Alternate Affiliation: Center for AstroPhysical Surveys, National Center for Supercomputing Applications, Urbana, IL, 61801, USA
G. Gutierrez
Alternate Affiliation: Institució Catalana de Recerca i Estudis Avançats, E-08010 Barcelona, Spain
N. W. Halverson
Alternate Affiliation: Department of Astrophysical Sciences, Princeton University, Peyton Hall, Princeton, NJ 08544, USA
S. R. Hinton
Alternate Affiliation: Department of Physics, University of Surrey, Guildford GU2 7XH, United Kingdom
E. Hivon
Alternate Affiliation: Materials Sciences Division, Argonne National Laboratory, 9700 South Cass Avenue, Lemont, IL, 60439, USA
G. P. Holder
Alternate Affiliation: Institute of Multidisciplinary Research for Advanced Materials, Tohoku University, Sendai, 980-8577, Japan
D. L. Hollowood
Alternate Affiliation: Observatório Nacional, Rua Gal. José Cristino 77, Rio de Janeiro, RJ - 20921-400, Brazil
W. L. Holzapfel
Alternate Affiliation: NSF-Simons AI Institute for the Sky (SkAI), 172 E. Chestnut St., Chicago, IL 60611, USA
J. C. Hood
Alternate Affiliation: Ruhr University Bochum, Faculty of Physics and Astronomy, Astronomical Institute, German Centre for Cosmological Lensing, 44780 Bochum, Germany
A. Hryciuk
Alternate Affiliation: University of Copenhagen, Dark Cosmology Centre, Juliane Maries Vej 30, 2100 Copenhagen O, Denmark
N. Huang
Alternate Affiliation: Department of Physics and Astronomy, Pevensey Building, University of Sussex, Brighton, BN1 9QH, UK
T. Jhaveri
Alternate Affiliation: Department of Physics, Case Western Reserve University, Cleveland, OH, 44106, USA
S. Kent
Alternate Affiliation: Department of Physics, Faculty of Science, Chulalongkorn University, 254 Phayathai Road, Pathumwan, Bangkok 10330, Thailand
F. Kéruzoré
Alternate Affiliation: Computer Science and Mathematics Division, Oak Ridge National Laboratory, Oak Ridge, TN 37831
A. R. Khalife
Alternate Affiliation: CERCA/ISO, Department of Physics, Case Western Reserve University, Cleveland, OH 44106, USA
G. Khullar
Alternate Affiliation: Central University of Kerala, Kasaragod, Kerala, India 671325
L. Knox
Alternate Affiliation: Berkeley Center for Cosmological Physics, Department of Physics, University of California, Berkeley, CA 94720, US
K. Kuehn
Alternate Affiliation: Physics Division, Lawrence Berkeley National Laboratory, Berkeley, CA, 94720, USA
C.-L. Kuo
Alternate Affiliation: Max-Planck-Institut für extraterrestrische Physik,Giessenbachstr, 85748 Garching, Germany
O. Lahav
K. Levy
Y. Li
A. E. Lowitz
C. Lu
G. P. Lynch
T. J. Maccarone
G. Mahler
A. S. Maniyar
J. L. Marshall
E. S. Martsen
M. McDonald
J. Mena-Fernández
F. Menanteau
M. Millea
R. Miquel
J. J. Mohr
J. Montgomery
J. Myles
Y. Nakato
T. Natoli
R. C. Nichol
V. Novosad
R. L. C. Ogando
Y. Omori
A. Ouellette
Z. Pan
K. A. Phadke
A. A. Plazas Malagón
A. W. Pollak
A. Porredon
K. Prabhu
J. Prat
W. Quan
S. Raghunathan
M. Rahimi
A. Rahlin
C. L. Reichardt
A. K. Romer
M. Rouble
J. E. Ruhl
E. Sanchez
D. Sanchez Cid
T. Schrabback
I. Sevilla-Noarbe
A. C. Silva Oliveira
A. Simpson
T. Somboonpanyakul
A. A. Stark
E. Suchyta
M. E. C. Swanson
C. Tandoi
C. To
C. Trendafilova
J. D. Vieira
A. G. Vieregg
V. Vikram
A. Vitrier
Y. Wan
N. Weaverdyck
J. Weller
N. Whitehorn
W. L. K. Wu
M. R. Young
J. A. Zebrowski
and
J. Zhan
Abstract
We report a new galaxy cluster catalog, selected using the thermal Sunyaev-Zel’dovich (SZ) effect, from 5 years of observations of the SPT-3G Main field.
Drawn from arcminute-resolution data with white noise levels of 3.2, 2.5, and 8.9 -arcmin at 95, 150, and 220 GHz, respectively,
the sample consists of 8,892 cluster candidates detected above significance , with an expected purity of (4,480 at with expected purity ).
Using optical and infrared (IR) data we have confirmed 7,190 candidates as clusters. The sample spans a mass range with a median mass of = , and a redshift range of with a median redshift of = 0.726;
1,780 clusters are at and 271 at .
Compared to previous SZ cluster samples from South Pole Telescope and Atacama Cosmology Telescope data, the SPT-3G sample presented here is highly consistent in mass and redshift but is significantly deeper, with per-cluster detection signal-to-noise 2-4 times higher and a cluster density approaching that traditionally associated with optical samples (4.5 confirmed clusters per square degree).
We cross match the SPT-3G catalog with eRASS1 cluster and point source catalogs, finding 1,279 and 1,319 matches, respectively. The SPT and eROSITA cluster mass estimates are in relatively good agreement, and the large number of eROSITA point source matches will provide promising avenues to study both X-ray cluster active galactic nuclei and the eROSITA cluster selection function at high .
A representative set of wide-field optical/IR cluster samples recover 50-78% of the SPT-3G confirmed clusters with generally good redshift consistency but varying levels of optical observable-SZ mass scatter.
A number of clusters are flagged as candidate strong gravitational lenses of distant optical and/or dusty star-forming galaxies.
We also perform a series of validation checks using both internal data splits and comparisons to external samples.
These tests show increasing correlated (dusty) emission with redshift, with a larger 220 GHz temperature increment for clusters at than ,
but only weak evidence for correlated synchrotron emission. Previous analyses have shown the SPT-3G selection to be robust to this level of dust contamination.
Further joint sample characterizations as well as constraints on the astrophysical and cosmological properties of this new SPT-3G sample will be the focus of upcoming works.
keywords
Large-Scale Structure of the Universe, Galaxy Clusters
FERMILAB-PUB-26-0364-V
DES-2026-0968
Galaxy Clusters Discovered in the SPT-3G Main Survey
1 Introduction
The past decade has seen a transformative expansion of wide-area astronomical surveys.
Data from these surveys have enabled stringent tests of models governing the formation and evolution of the Universe both through probes of the early Universe—via millimeter-wavelength observations of the cosmic microwave background (144; 6; 115; 31, CMB;)—and of the late-time Universe via photometric and spectroscopic galaxy and supernova surveys at optical, infrared, and X-ray wavelengths (2; 4; 44; 70).
These studies have shown strong preference for a model in which the current energy density of the Universe is dominated by a “dark energy” () component with significant contributions from cold dark matter (CDM).
Comparisons of late- and early-time probes provide particularly powerful tests of the CDM model, as they trace eras when the energy content and degree of structure formation in the Universe are markedly different.
Thus far, such comparisons have shown remarkable agreement and support for a concordance cosmological model (2; 193).
However, thanks to the high statistical constraining power of these survey data, subtle tensions have been uncovered at moderate (4; 146, e.g. evolving dark energy;) to high significance (notably the discrepancy in between primary CMB and some low redshift expansion measures; e.g., 158, though see e.g., 95 for an alternative perspective) between the cosmological models preferred by probes drawn from the distinct eras.
As cosmology has now firmly entered an era in which inferences from many probes are dominated by systematic errors (as opposed to statistical uncertainties), it is critical to explore these tensions with a diverse set of observables, ideally subject to very different sources of error.
Clusters of galaxies—the largest gravitationally collapsed systems in the Universe—are a natural probe to target, as their abundance is extraordinarily sensitive to physics that governs the growth of structure.
Indeed, clusters of galaxies could be the most constraining probe of Dark Energy, if systematic errors can be controlled (53).
This promise has led clusters to be identified as a key pillar in dark energy science by the eROSITA, Euclid, and LSST Dark Energy Science collaborations (150; 61; 180).
An important step towards achieving this potential is the construction of large cluster samples with well-understood selection functions (9).
Cluster samples selected via intracluster-medium-derived observables—in particular those selected through the cluster thermal bremsstrahlung signature in X-ray surveys (164) or the thermal Sunyaev-Zel’dovich (178, SZ;) effect in mm-wave observations—offer particularly significant advances in this regard.
Progress in SZ-selected clusters in recent years has been rapid with the release of samples from the Planck Collaboration (143), the South Pole Telescope (SPT) collaboration—including large catalogs from the SPT-SZ and SPTpol experiments (23; 96; 21; 22; 104) and the first deep field catalogs from the SPT-3G experiment (108; 11)—as well as large cluster samples from the Atacama Cosmology Telescope (ACT) collaboration (89; 90), including the notable recent release in 5 of 10,040 clusters drawn from 16,293 square degrees of ACT DR6 data.
The X-ray cluster field has been transformed as well by the first release by eROSITA collaboration of over 20,000 clusters found in data from the SRG/eROSITA All-Sky Survey (114; 29; 13, eRASS;).
New hydrodynamical simulations (54; 67; 86, e.g.,) and large volume gravity-only simulations post-processed with sophisticated “baryon-painting” techniques (121; 101; 111, e.g.,)
have also become available to enable robust interpretation of these complex datasets.
The recent cosmological constraints produced using the eROSITA and SPT cluster samples have demonstrated some of the tightest constraints from growth-of-structure probes (26; 70; 27—though also see the combined optical cluster, weak lensing, and galaxy clustering analysis of 3) and provide valuable points of comparison to cosmological results obtained using geometric probes such as supernovae and baryon acoustic oscillations (146; 4).
In this work we introduce an SZ cluster catalog produced through the analysis of 5 years of survey data from the SPT-3G Main field.
This sample of over 7,190 clusters detected at a significance in 1600 deg2 of sky has a median mass of and a median redshift of , with detections extending to .
With its high spatial density and broad mass range and redshift reach, the SPT-3G cluster sample will enable powerful cosmological tests and astrophysical studies in its own right, and will also be highly complementary to the wider-field eROSITA and ACT samples.
Our report on this new SPT-3G cluster sample is organized as follows:
•
Section 2 provides an overview of the observations and mapmaking procedure used in this work.
•
Section 3 discusses the process by which cluster candidates are identified in SPT-3G data, the measurement of our reported Compton- based observable, and our estimation of the intrinsic purity of the SZ sample.
•
Section 4 details the confirmation process and redshift estimation for cluster candidates using optical and infrared data.
•
Section 5 describes our modeling of the SZ and optical-richness mass observable relations. Masses in this work are estimated via abundance matching with a fixed cosmology.
•
Section 6 combines the results of the previous sections to provide a high level summary of the sample properties as well as an estimate of completeness of the sample as a function of mass and redshift.
•
Section 7 highlights candidate strong gravitational lenses in the SPT-3G sample, both through a literature search and our own dedicated screening.
•
Section 8 summarizes high level comparisons to intracluster medium (ICM)-selected catalogs from recent SZ and X-ray surveys. Additional comparisons to X-ray source catalogs from eROSITA are provided in Appendix 17.
•
Section 9 examines the relative completeness, redshift consistency, and scatter with SZ mass for several optical- and infrared-selected cluster samples, with a more detailed comparison to the DES redMaPPer Y3 sample (3) in Appendix B.
•
Section 10 explores consistency of the SZ properties of the cluster sample as measured using subsets of the SPT-3G bands to test for contamination from correlated dusty and synchrotron sources.
Finally, in Section 11 we conclude.
Data products associated with this paper are available online111
Data products: https://pole.uchicago.edu/public/data/spt3g-clusters and we provide in the Appendix C a description of the catalog table entries.
Conventions: Where applicable, we assume a fiducial CDM cosmology with , , , , , and eV.
This adopted fiducial cosmology enables direct comparisons across generations of catalogs from the SPT since 23.
Cluster masses are reported in terms of , which is defined as the mass enclosed within a radius, , at which the average enclosed density is 500 the critical density at the cluster redshift.
2 Observations and Mapmaking
The cluster sample described in this work results from an analysis of data taken with the SPT-3G receiver between 2019 and 2023.
As detailed in 171, SPT-3G is the third-generation receiver installed on the SPT—a 10-meter, submillimeter-quality telescope located at the Amundsen-Scott South Pole Station (32).
SPT-3G is designed for intensity and polarization measurements at 95, 150, and 220 GHz, and the large telescope aperture results in angular resolutions of 1\farcm6, 1\farcm2, and 1\farcm05 for the three bands, respectively.
In addition to surveys for galaxy clusters, the SPT is built for sensitive, high-resolution observations of primary (69; 37; 31; 151) and secondary (35; 152) CMB anisotropies and populations of mm-wave emissive point sources (62; 11), which include active galactic nuclei (94), dusty star-forming galaxies (187; 157), and transient, variable, and moving sources (80; 36; 93; 179; 190).
SPT-3G has been used to survey approximately 10,000 square degrees of the southern sky (149).
The cluster sample reported in this work is derived from an analysis of 1,604 deg2 of data from the SPT-3G “Main” field, upon which the majority of observation time of SPT-3G has been focused.
The nominal boundaries of the SPT-3G Main field are 20h40m and 3h20m in right ascension (R.A.) and and in declination (Dec.), as depicted in Fig. 1, with borders coordinated to overlap with observations from the BICEP Array (128) for inflationary B-mode analyses (19).
The field also has extensive sky coverage from the Dark Energy Survey (1, DES;), eROSITA (125), and, in the near future, will benefit from observations by the Euclid mission (61), 4MOST (46), the Vera C. Rubin Observatory’s Legacy Survey of Space and Time (97, LSST;), and MeerKAT (99).
Figure 1: Footprint of the SPT-3G survey plotted with those of several other multi-wavelength surveys discussed in this work. The footprints are overlaid on a dust map from 141. The full SPT-3G 10,000 deg2 survey is shown in pale blue, the boundaries of the SPT-Euclid Deep field South (11) and SPT 100d Deep field (108) are white-dashed, and the SPT-3G Main field—the focus of this work—is plotted in bold blue.
2.1 Observation Strategy
The SPT-3G Main field is not observed as a single field, but rather is constructed from combined observations of four subfields, split along the declination axis, of ∘ in height.
These subfields are centered at Dec. ∘, ∘, ∘, and (151, see Fig. 2,).
To survey a subfield, the telescope is scanned in a back-and-forth pattern across the full azimuth extent of the field at /sec in azimuth at constant elevation, followed by a step in elevation.
This motion repeats until the entire subfield has been observed, which typically takes 2 hours.
Owing to the telescope’s location at the geographic South Pole, this observation strategy results in scan data aligned with constant lines in declination which simplifies certain aspects of our analysis as discussed below.
2.2 Data Processing
The procedure for translating time-ordered data (TOD) from individual SPT-3G detectors into calibrated temperature maps closely follows that described in detail in recent SPT analyses (60; 11; 151).
Certain mapmaking choices are made to yield final maps with high sensitivity to arcminute-scale features (such as those deriving from galaxy clusters).
We briefly summarize and highlight those choices here.
The first step in data processing involves flagging and removing data from detectors that exhibit certain well-established pathologies during survey scans.
Next, data from locations corresponding to bright ( mJy at GHz), emissive sources is removed and interpolated over in the TOD to avoid introducing strong artifacts in the maps from the following filtering steps.
We next apply several filters to reduce contamination from instrumental noise and atmospheric signals.
To reduce the impact of low-frequency instrumental and atmospheric noise, we apply three types of filters: First, we apply a common-mode filter that groups detectors within the same detector module and observing band together, averages their TOD, and then subtracts that averaged signal from each detector’s TOD.
Next we project out a low-order polynomial from the TOD of each detector.
Finally, we Fourier-transform the TOD of each detector and apply a Fourier high-pass filter with a cutoff corresponding to in the scan direction.
In this last step, we also apply a low-pass filter with a cutoff corresponding to in the scan direction, to reduce the effect of aliasing when we bin the TOD into map pixels.
Following 11, corrections are then applied to the TOD to account for detector time constants (i.e., the finite temporal responsivity of the detectors) and timing offsets between detectors and telescope pointing data.
After the TOD have been filtered, data from each detector are weighted based on the inverse noise variance in the 1–4 Hz range.
Using the telescope pointing model, the weighted TOD are then binned in 0\farcm25 pixels in a Lambert azimuthal equal-area map (30, ZEA;) projection and averaged.
This process results in the creation of a weighted temperature map for every observation at each observing band.
Following quality checks on individual observation maps, weighted maps from each subfield are then summed and deweighted to produce final coadded subfield maps.
Absolute calibration of each subfield map to CMB temperature units is set through comparisons to Planck (151) and, once calibrated, the coadded subfield maps are combined into a full field map.
The final coadded temperature maps analyzed in this work have white-noise levels of 3.2, 2.5, and 8.9 -arcmin at 95, 150, and 220 GHz, respectively.
An example of the signal quality achieved in the final maps is shown in Fig. 2.
Figure 2: (Left) Cutout of of SPT-3G Main field survey data (approximately 1.2% of the Main field survey area). The rgb image is constructed using the 95 (red), 150 GHz (green), and 220 (blue) GHz data with peak-to-peak fluctuations in each channel of . This figure illustrates the main constituents of the SPT-3G temperature maps. As the maps are calibrated in units, CMB fluctuations have equal intensity in all channels and thus appear gray in this image. Falling-spectrum sources (e.g., AGN) appear red, and dusty sources appear light blue. Galaxy clusters, with a strong deficit of flux in the channels appear deep blue in this color scaling. (Right) Cluster detection map for a matched filter with for the same region. In colored boxes of increasing size we denote the locations of cluster candidates detected over all filter scales. We mark candidates with (purple), (blue), (green), (yellow), (orange), (red, in this image SPT-CL J23444243, the “Phoenix” Cluster). The color scaling from black to white on this image varies between in detection significance.
The SPT-3G Main field cluster sample has a high cluster density, with over 5.5 (4.5) candidates (confirmed clusters, see Sec. 6) per square degree.
2.3 Choice of Map Projection
Analysis of small regions of sky using a flat-sky approximation can offer significant advantages in terms of analysis ease and computational complexity (e.g., allowing for two-dimensional Fourier transforms in place of spherical harmonic transforms, simplified filtering characterization, etc).
However, analysis of curved-sky data assuming flat-sky geometry necessitates sacrifices in shape or spatial fidelity.
The baseline ZEA projection adopted for many SPT-3G analyses has excellent distance- and shape-preserving properties.
However, the SPT filtering and transfer function
varies in position across the survey field in this projection, owing to changes in the angle of the telescope’s scan direction relative to pixel rows in the maps (165).
This byproduct complicates the application of an optimal matched filter for cluster detection (Sec. 3) in this map projection.
For cluster analyses, where shape preservation is less important than transfer-function fidelity (since the extended shape of clusters is not measured well by the limited resolution of the SPT), we follow previous SPT analyses and choose to work in the Sanson-Flamsteed projection (30).
In this projection, pixel rows directly correspond to right ascension and the scan direction of the telescope, thereby guaranteeing a homogeneous transfer function across any given row of the map.
However, the Sanson-Flamsteed flat-sky projection results in growing spatial distortions with increasing distance from the map’s center.
To constrain these distortion effects near the map edges to an acceptable level, rather than examining the full field in its entirety, we re-project the full-field maps into 7 overlapping sub-patches in the Sanson-Flamsteed projection.
2.4 Emissive Point-Source Removal
Bright, emissive point sources are prominent and densely distributed across the coadded maps (as shown in Fig. 2).
Alongside these sources are filtering-wing artifacts introduced by the TOD-filtering described above.
The bright signals and their associated filtering wings can both hide detectable galaxy clusters and introduce spurious detections when the cluster-extraction algorithm is applied to the maps.
Therefore, before the cluster detection filtering is applied and the maps are examined for clusters, these point-source signals and filtering wings are removed using a procedure very similar to that used in recent SPT cluster analyses (22; 108).
For each observing band, a flux-normalized template of an emissive point source is constructed using thumbnail cutouts from the same map, guaranteeing the same transfer-function properties.
The templates are created using 2,000 of the brightest sources still present in the maps in each observing band after mapmaking.
Using these per-band, normalized templates, “source maps” are generated with the appropriate flat-sky map distortions and flux values at every map location originally containing an emissive source with a signal-to-noise ratio (SNR) 5 at GHz from a dedicated point source analysis of the field.
The source maps are then subtracted from the original full-depth coadded maps at each frequency, substantially reducing the point source and filtering wing features for all but the brightest sources (discussed more in the next section).
3 Cluster Identification
The SZ effect describes an inverse Compton-scattering phenomenon in which interacting CMB photons are up-scattered to higher energies by hot electrons in the ICM of a galaxy cluster (178).
The SZ signal in units of effective CMB fluctuation temperature can be expressed as:
(1)
where K is the mean CMB temperature (64),
is a function encapsulating the frequency () dependence of the interaction,
is the electron density in the gas,
the Boltzmann constant,
is temperature of the electron gas,
is the electron rest mass energy,
is the Thomson cross-section of the electron,
x is the cluster location,
is the Compton -parameter,
and the integral is taken along the line of sight.
SPT-3G’s effective band centers for a non-relativistic SZ signal are 95.69, 148.85, and 220.15 GHz for the three bands.
The frequency dependence results in a temperature decrement in SPT’s lower-frequency channels while the 220 GHz channel is effectively at the SZ null.
To identify galaxy clusters in SPT-3G maps, a spatial-spectral filter (commonly referred to as a “matched filter”) is applied to the maps (123).
The matched filter optimally weights the data in spatial and spectral space to more clearly reveal potential clusters (i.e. signals with SZ-like frequency behavior on the angular scale of clusters) while down-weighting other signals and noise in the maps.
Here again we adopt the procedure followed in previous SPT works (see most recently, 11, for more details).
Construction of the matched filter requires both a spectral profile (given in Eq. 1) and a spatial brightness profile for the target galaxy clusters.
For the latter, we assume a projected spherical -model as described in 33:
(2)
where is a normalization free parameter,
is fixed to ,
and is varied in quarter arcminute steps between and with additional filters (an expansion over previous SPT works) at , , , and .
3.1 Candidate List Construction and Cleaning
We construct our preliminary list of cluster candidates in 2 steps: a first step in which we identify the highest-significance candidates, and a second step in which candidates down to our selection threshold are identified in maps with high-significance clusters removed. This list is then cleaned of spurious detections associated with artifacts from our treatment of bright sources and massive clusters to produce the final cluster candidate sample.
Cluster detection in each step broadly proceeds as follows.
We create SZ-matched-filtered maps from the combination of the 95, 150, and 220 GHz maps for each of the 16 different filter scales, and we identify candidates as peaks in each of the filtered maps.
We record all candidates above a cutoff in our primary survey observable, , which is defined for each map location as the maximum detection significance across all filter scales.
We use a 3\arcmin radius to associate detections from peaks in the individual filtered maps to a common candidate.
In the first step, we identify high-significance cluster candidates with 20.
Next, before running the cluster finder to lower detection significance, we model and remove signals from the temperature maps for these high- detections as,
similar to the bright emissive sources discussed in Sec. 2.4, compact features in the maps associated with these candidates can induce spurious detections owing to the map filtering.
To model the cluster signals, we construct a template Compton- map by placing at the candidate locations -profiles with amplitude and core radii matching those of the detections.
We use SPT-3G’s effective frequencies for the non-relativistic SZ spectrum to convert this template into temperature units (Eq. 1), and then convolve these template maps with the SPT beams and transfer function (the latter of which encapsulates the effects of the TOD filtering during mapmaking).
These templates are then subtracted from the temperature maps before identifying candidates to lower significance.
We note that there is a well known amplitude-size degeneracy in the recovery of cluster profile parameters for experiments with arcmin-scale resolution (15; 142, see e.g., ) but—for our purposes of simply removing the small scale cluster signals to mitigate spurious candidates—we find this procedure works well with the exception of our highest-significance detections at for which extra care is required (discussed more below).
In the second step, we then apply the matched filters to the source- and cluster-subtracted maps and detect candidates down to , the selection threshold for this catalog222
We also tried a similar cluster template subtraction procedure at various thresholds to test if there was a significant change in the candidate population—e.g., if this would improve cluster recovery in a similar way that the CLEAN (92) algorithm improves point source detection—but found that our simple source association radius of 3\arcmin produced comparable results at much lower computational cost..
We merge this list with that of the higher-significance candidates to form the full preliminary candidate list.
This preliminary list is then visually inspected in both raw temperature and cluster-filtered maps.
We identify a small number of spurious detections associated with extended low-redshift galaxies (56, typically NGC galaxies;) or near the centers of
bright emissive sources detected at mJy () at 150 GHz.
To remove these artifacts we add additional masks post filtering of 4\arcmin radius around these locations333
We note this 6 mJy threshold was the same threshold adopted in previous SPT analysis, however, as our subtraction procedure has successfully accounted for the emissive source decrement wings, we are able to apply masks in postprocessing rather than prior to filtering, reducing the overall mask sizes per source from 8’ to 4’..
Finally, as noted above, the clusters detected at —particularly the “El Gordo” (124) and “Phoenix” (192) clusters—still produce spurious detections following our template subtraction procedure.
We flag and remove a small number of clearly spurious detections by hand within 8\arcmin of these clusters.
In total, including both the large masks over sources interpolated in mapmaking and the masks discussed here, we mask of the SPT-3G main footprint.
The final SPT-3G cluster sample contains 8,892 candidates detected at drawn from 1,604.8 deg2. In Fig. 3 we plot the recovered and distributions of the sample.
Figure 3: Distribution of cluster sample properties in terms of detection significance, , (top) and corresponding filter scales (bottom). In orange we show the full sample and, over-plotted in blue, the clusters confirmed by the optical analysis as discussed in Sec. 4. In the top panel we also highlight several massive well-known clusters in the SPT footprint. The distribution in of the predominately low- unconfirmed candidates—with small exceptions at high owing to optical incompleteness—matches expectations based on the noise properties of the maps, see Sec. 3.3.
3.2 Integrated Comptonization,
While the SPT selection observable, , has been shown to be an excellent low-scatter mass proxy (45; 24), it is not straightforward to directly combine with other datasets for constraining ICM properties (161, e.g.,) or in comparisons to other survey and simulation measurements.
As such, we also provide a measure of the integrated Comptonization of each cluster candidate in the SPT-3G sample.
The reported observable, , is defined as
(3)
for our adopted pressure profile models (Eq. 2), where is the peak Comptonization.
We set the integration radius of the profiles to following 163 which analyzed mock SPT observations of maps containing thermal SZ (167), astrophysical foregrounds, and realistic noise and observational effects.
The authors found this aperture to provide robust measurements of the Comptonization given SPT’s beam size and that the scatter of the SZ observable with respect to the simulated halos’ virial masses is ; this is comparable to the scatter of with mass for the same halos.
Following 155; 23 we estimate these observables for each cluster candidate using a gridded parameter search in , , and position.
We restrict the recovered locations to be within from the each candidate’s matched-filtered detection position and explore values corresponding to physical core radii, , ranging from .
For the conversion from physical to angular scales we use the cluster redshifts discussed below in Sec. 4 and adopt a redshift of for unconfirmed cluster candidates.
3.3 Purity of the SZ Candidate List
We run our cluster detection procedure on simulations to estimate expected numbers of spurious candidates and, by combining these estimates with our real detection lists, the overall purity of our sample.
Following methods established in 155; 96; 22, these simulations capture cluster signals, astrophysical and instrumental noise, as well as the effects of filtering applied to SPT-3G data.
We refer readers to 108 for the most recent updates to this process and provide a brief overview below.
3.3.1 Simulation Construction
The simulated SPT-3G maps are constructed using Gaussian realizations of the CMB, kinematic SZ (177, kSZ;), and cosmic infrared background (CIB); simulations of non-Gaussian signals from thermal SZ and radio galaxies; and instrumental noise realizations derived from the data itself.
The CMB is a realization of the power spectrum from the best-fit lensed CDM model from the Planck 2018 results of 7, and maps of the kSZ and dusty sources are constructed following results from 154.
The SZ maps are constructed using the techniques of 66 on a halo lightcone from the Outer Rim simulation (85) with maps normalized such that the SZ power spectrum amplitude is consistent with 154 at .
Radio galaxies are modeled using the flux distribution of 110 with
source maps generated at 150 GHz, and scaled to 95 GHz and 220 GHz assuming spectral indices consistent with 62.
Sources are populated up to a maximum flux of 30 mJy at 95 GHz to match the interpolation threshold of the SPT-3G maps (see Sec. 2).
Finally, instrumental noise maps are constructed directly from SPT-3G data by creating signal-free coadds of individual map observations (by multiplying random halves of the observations by -1). Due to the intrinsic variability of AGN and telescope pointing jitter, the instrumental noise maps are masked with the same point source mask used in cluster-finding, as imperfect cancellation at the locations of bright sources can cause residuals in the noise maps leading to excess spurious detections.
In total we constructed 3 independent simulations of the SPT-3G Main field.
Figure 4: Top: The expected purity (orange) and number of false detections (green) for the SPT-3G Main field cluster catalog as a function of minimum without additional optical follow-up. We find an expected purity of above , and above .
Bottom: The expected purity of the cluster sample as a function of filter core size, . Here the label “Peak Core Size” reflects that the simulated clusters were detected at a corresponding to the listed (i.e., this is not plotting the purity of the cluster finder run at a single filter scale).
3.3.2 Purity Estimation
The simulated maps are then treated with the same cluster detection procedure as the data. This includes source subtraction, two-pass cluster detection with high- cluster subtraction, and additional post-detection point source masking.
Once a candidate list is produced for each simulation realization, beginning with the highest-significance candidate, candidates are then cross-matched to known locations of massive halos from the Outer Rim simulation using a 2\arcmin association radius.
To determine the probability of random association with a cluster of a given mass, , this process is repeated for 100,000 random sight lines. The number of false associations, , above a minimum significance , is then calculated as:
(4)
where is the number of candidate associations, is the number of cluster detections for each simulated map, and is the fraction of true
associations to total candidates, defined as:
(5)
The estimated purity of the final SPT-3G catalog is then calculated by taking the difference between the total number of candidates in the catalog and , divided by the total number of candidates.
Results of the purity estimates are shown in Fig. 4.
We find an expected purity of above , and above .
While constructed from maps of similar depth to the SPT Deep field presented in 108, here the intrinsic purity is lower at (though comparable at ) owing to the inclusion of additional filter scales in this work.
In the bottom panel of Fig. 4 we break out the expected purity as a function of filter scale .
While the smallest filter scale adds sensitivity to smaller-scale (lower-mass/higher-) clusters, there are more independent filtered pixels in the field, resulting in more noise fluctuations (and thus on balance here lower purity, though we note this ratio is dependent on the number of true clusters in the map and will vary based on map depth). The lower purity of this filter scale is also reflected in the fraction of optically confirmed clusters for this filter scale plotted in the bottom panel of Fig 3.
Conversely, the decline in purity at the largest filter scales is driven by the relative decrease in true clusters with large angular extent.
As we discuss in the next section, optical cleaning will increase the overall sample purity, especially at low .
4 Redshifts
Robust redshift measurements are essential for enabling scientific studies with galaxy cluster samples.
For ICM-selected samples, optical and infrared (IR) follow-up observations are critical for providing these redshifts and additionally, for lower-significance cluster candidates, confirming the detections as bona fide galaxy clusters via the presence of significant galaxy overdensities in color/redshift space at the candidate locations (88; 173; 106; 107). This confirmation process can also be used to exert further control over the purity of the cluster sample as a function of detection threshold.
To achieve this, we make use of data from the DESI Legacy Surveys DR10 (48, LS-DR10;) in the optical, FourStar (140) imaging in the near-IR, and Spitzer/IRAC (63) and WISE (194; 122) in the IR. We use red sequence techniques (71; 162) to obtain redshifts and richnesses in optical and near-IR data. To estimate redshifts and confirm cluster candidates at high redshifts with WISE and Spitzer, we use the “1.6 µm Stellar Bump” method (139; 131; 72) that utilizes the strong color-redshift dependency of cluster galaxies in the [3.6µm] - [4.5µm] color between and .
The footprint of the SPT-3G Main Survey lies completely within the LS-DR10 and the WISE survey and is, besides local masking, fully covered by both surveys.
LS-DR10 provides a uniform processing of images and photometric catalogs from survey data acquired with the DECam imager (65) on the 4-meter NSF Víctor M. Blanco Telescope at Cerro Tololo Inter-American Observatory.
The optical data in the SPT Main field footprint was mainly acquired as part of the Dark Energy Survey (1) but also includes contributions from the DELVE (57) and DeROSITAS (197) programs in its southernmost extent.
We use the multi-component matched filter (MCMF) cluster confirmation technique (106; 103; 104) for systematic redshift estimation and confirmation using those survey data, while we use dedicated tools for the Spitzer (108, see most recently) and pointed FourStar datasets.
In the following subsections, we describe the details of the optical follow-up for each of the datasets in greater detail.
4.1 MCMF
The MCMF algorithm was created to confirm cluster candidates identified in large X-ray or SZ surveys using wide-field optical survey data. We closely follow the approach used in previous work (104; 22; 11), which consists of two separate runs of MCMF, one using optically selected galaxies and one using IR-selected galaxies. The optical and IR-based measurements are then combined based on their probabilities of being the true cluster match based on redshift and richness as well as on the separation between SZ-based center and galaxy-based center. Here, MCMF measurements from optically selected galaxies provide the majority of the cluster redshifts and confirmation with a redshift reach typically extending out to redshift , while the WISE-based IR-selected MCMF run is optimized for redshifts . The WISE-based selection typically becomes advantageous over the optically selected LS-DR10 data sets at redshift .
4.1.1 MCMF Confirmation on LS-DR10 Dataset
The MCMF pipeline using the LS-DR10 dataset is identical to that used in 105 to identify galaxy clusters in the ACT-DR5 (132) dataset. It utilizes redshift- and magnitude-dependent color filters, in , , and , to search for overdensities of red-sequence galaxies to estimate redshifts and richnesses of candidate optical clusters. In regions with additional -band data available, and -band colors are used as well.
Besides galaxy colors, MCMF also employs radial weighting using a projected Navarro–Frenk–White (134, NFW;) profile centered at the SZ-selected candidate position, as well as a specific magnitude range depending on redshift.
At a given redshift, MCMF calculates, for each cluster candidate, the color and radially weighted, background-subtracted richness, , within a radius of , derived from the SZ-based estimate of the cluster mass. The richness is measured at 300 redshifts separated by an offset of providing a richness distribution as function of redshift, , along the line of sight of the cluster candidate. Clusters are identified as characteristic peaks in the data, and are subsequently fit by “peak profiles” obtained from MCMF measurements towards known galaxy clusters with recorded spectroscopic redshifts. The usage of peak profiles allows the code to deblend individual clusters with overlapping red sequence colors, provide direct calibration to spectroscopic redshifts, and to study higher redshifts where red sequence galaxies are only weakly detected in LS-DR10.
For examples of peak profiles we refer the interested reader to previous MCMF analyses (103, e.g., Figs. 4 and A2,).
The so-found peaks with associated redshift and richness are then recorded by MCMF as potential optical counterparts.
To confirm or reject a cluster candidate as a genuine cluster, we calculate the probability that a given optical counterpart is a coincidental overlap with the SZ-based candidate. This can be done if the richness and redshift distributions of the contaminants in the SZ-selected cluster candidate list can be measured.
The MCMF approach uses random positions within the SPT-3G footprint and mock estimates of the SPT detection significance to mimic false detections within the SPT-3G candidate list. This mock catalog is then used as input to MCMF and treated the same way as the true candidate list. In a final step, close matches in position and redshift with the real catalog are excluded from the catalog. This last step ensures that the richness distribution of contaminants and not a mix of true and contaminating optical overdensities is measured. The catalog of redshifts and richnesses along random lines of sight is called the random catalog.
Using the richnesses and redshifts of the true candidate list and the random catalog, we define the quantity , where “cont” is short for contamination. To obtain a measurement of for candidate with redshift and richness , we calculate the fraction of optical overdensities from the random catalog around with richness and divide by the fraction of SPT-3G candidates above the same richness ,
(6)
The parameter is calculated for each richness peak associated with a candidate. In the case of multiple peaks for the same SPT-3G candidate, the peaks are sorted by .
A sample of confirmed galaxy clusters can then be obtained by selecting cluster candidates below a threshold value .
Here the adopted value of corresponds to the fraction of contamination remaining in the cluster sample with respect to the initial amount of contamination of the candidate list. If the initial contamination is known, the remaining contamination of the sample after imposing a cut at is then simply the product of the two values.
Our baseline catalog generally adopts a contamination fraction =0.2, except in the specific cases noted below.
In Fig. 5 we plot the redshift- distribution of the SPT cluster sample and overplot the =0.2 threshold in this plane. Beyond the intrinsic cluster sample properties, the richness-redshift dependence of depends on a number of observational factors (such as the depth of the photometric catalogs for red-sequence/IR galaxies) and astrophysical factors (such as the color-luminosity distribution of unassociated field galaxies, and evolution in the luminosity functions of clusters).
Figure 5: MCMF richness vs. redshift for the SPT-3G candidate list at . In solid lines we overplot the richness confirmation thresholds of =0.2 for the LS-DR10 and WISE datasets. In blue we plot clusters confirmed by MCMF in the sample, in black we mark clusters confirmed using other datasets (see Sec. 4.5.), and in gray SPT candidates with optical associations below our confirmation threshold. The pile-up of “Other Confirmed” candidates at is caused by the assignment of this redshift as a lower limit owing to color-redshift degeneracies in the IR data, see discussion at the end of Sec. 4.5.
.
4.1.2 MCMF on WISE
The MCMF implementation using WISE-selected galaxies and additional LS-DR10 optical photometry
is identical to that used in the previous work on ACT-selected and SPT-3G-selected clusters (105; 11).
As the input galaxy catalog we use a version of the unWISE catalog (122), which incorporates eight years of and band WISE imaging data from the NEOWISE-R phase in addition to data from the main mission (194). The WISE data cover the entire sky, enabling the matching of unWISE and LS-DR10 catalogs for optical/IR photometry of WISE sources over deg2 of extragalactic sky, fully including the SPT-3G survey area. Besides the WISE-only color (), optical-to-WISE galaxy colors (e.g., -) also exhibit a strong redshift dependence, allowing the rejection of foreground galaxies and providing cluster photometric redshift estimates at high redshifts.
Estimation of cluster richness is more complicated in the WISE+LS-DR10 dataset than in the optical dataset alone.
At high redshifts, not all IR galaxies are detected in LS-DR10. Additionally, for cluster galaxies, the data is typically shallower than leaving a significant fraction of detections without a measurement in the band. LS-DR10 and both WISE bands also do not have identical survey masks, necessitating additional corrections in combined richness estimations. To calculate the richness we therefore have to trace the coverage of the data for different combinations of datasets, in decreasing order of available photometry per galaxy: LS-DR10++ (hereafter ALL), LS-DR10 + , +, and only. Every galaxy is assigned to one of these combinations. The final richness, , is calculated as the sum of the richnesses of the different subsets of galaxies with different data coverage. It is given as
(7)
where the individual richnesses are defined in the same manner as the standard MCMF richness (106; 103, see), with the color-weights depending on the availability of the bands ( for , for , , for , and no color weight for ).
Similar to the optically based MCMF code using LS-DR10, the richness is calculated at equally spaced redshifts, but here in the redshift range . Peaks are then subsequently identified in the data in a similar way as for the standard approach using LS-DR10. The WISE-based MCMF implementation is run on all candidates as well as the same random catalog used for the MCMF run on LS-DR10 data, and measurements of are obtained. Although there is significant overlap in redshift between the LS-DR10 and WISE implementations of MCMF, we only use the WISE implementation at redshifts .
Limitations of WISE:
The large point-spread function of the WISE imaging () is one of the key limitations in the use of WISE data for cluster confirmation. The unWISE sample features improved modeling of crowded regions compared to previous work (195, such as ALLWISE,) but source blending, especially in the dense regions of clusters at high redshift still causes significant limitations.
Blending reduces richness counts and (at some level, though the background is also impacted) cluster contrast at high redshift, increasing contamination rates and impairing cluster confirmation. We leverage the limited targeted higher-resolution observations from Spitzer and FourStar data discussed below for additional cluster confirmation as well as to assess the WISE confirmation completeness at the highest redshifts.
4.1.3 Combining MCMF on LS-DR10 and WISE
The MCMF measurements using LS-DR10 and WISE are combined based on their measurements of for individual optical/IR counterparts. We use here the run on LS-DR10 as a baseline and update the best counterpart with the WISE-based measurement if the counterpart exceeds a redshift of and shows a measured below the best counterpart from LS-DR10. Further complications arise as massive clusters at low redshift () can create spurious signals in the WISE-based MCMF measurements as faint low- cluster members leak into the WISE galaxy sample. To avoid overriding the LS-DR10 MCMF measurement by a spurious high- measurement, the high- measurement is not considered as the primary counterpart if a massive low- cluster () is found or if a similar good counterpart () is found to be 0.5 arcmin closer to the SZ position than the high- counterpart.
4.2 Spitzer/IRAC
For a subset of the SPT-3G candidates there is additional deeper and higher-resolution IR data from Spitzer/IRAC (63).
These data are sourced from two separate efforts: targeted follow-up campaigns of high-redshift cluster candidates from SPT-SZ and SPTpol (23; 22) and overlap with the 94 deg2Spitzer-SPT deep field (SSDF; 12, DOI:10.26131/IRSA432.).
Redshifts from Spitzer data also are derived using the 1.6 m bump method.
We do not measure new redshifts in this work, but rather use redshifts previously measured in prior SPT catalog releases. For more details on the estimation of these redshifts, see 22 and 108.
4.3 FourStar
Figure 6: SPT-CL J2128.45658.0, a cluster at confirmed using the combination of WISE and Magellan/FourStar data. The 3\arcmin diameter rgb image is constructed from FourStar/J-band and LS-DR10 z- and r-band data; SZ detection countours are overlaid on the image.
The depth of the SPT-3G survey results in significant numbers of high-redshift clusters detected at high confidence.
As we discuss in the next subsection, a non-negligible number of these clusters are not (or only weakly) detected in LS-DR10 and WISE data, necessitating additional follow-up observations for cluster confirmation.
We used the FourStar (140) near-IR imager on the 6.5 m Magellan/Baade telescope to obtain observations of a subset of such SPT-3G cluster candidates.
The FourStar observations targeted exposure times of 900 s in -band, sufficient to detect luminous red-sequence cluster members at in bright time at better than 0\farcs7 seeing.
While weather conditions over a series of observing nights in 2021-2025 were variable, we obtained usable data for candidates (including our primary targets at typically based on preliminary-to-final versions of the SZ candidates list and lower-significance candidates also within the 10\farcm9 10\farcm9 field of view).
For data acquired prior to May 2023, we reduced the images using the PHOTPIPE pipeline (156; 68; 126) following the process detailed in 23.
For observations acquired after May 2023 we use the FourStar Reduction (FSRED) pipeline provided by Carnegie Observatories444https://instrumentation.obs.carnegiescience.edu/FourStar/SOFTWARE/reduction.html to reduce the imaging data. The pipeline performs linearity correction, flat fielding, dark subtraction, background subtraction, astrometric calibration, image resampling, and final co-addition. Individual exposures are grouped into 10-minute intervals, with background subtraction applied to each interval. A global astrometric solution is solved for by SCAMP (17) based on source positions extracted using SExtractor (16). Images are then resampled and reprojected onto a common grid using SWarp (18). Images are co-added with inverse-variance weighting by IRAF (183) using imcombine. Photometric zero points are determined by matching stars detected in the final co-added mosaic to the 2MASS point source catalog (170).
Following reduction of the images, we construct rgb images combining the J-band data with r- and z-band data from LS-DR10. Images with SZ detection contours overlaid are inspected by multiple team members for clear signatures of high- clusters. We flag clusters with pronounced over-densities of red galaxies. We then cross-match these systems against the MCMF redshift results, finding most of the FourStar flagged systems to have high-redshift counterparts in MCMF, but at contamination fractions higher than our adopted threshold of =0.2.
Following this process, we include 36 additional clusters as confirmed, and adopt the MCMF WISE-based redshifts for these systems; the clusters are tagged as being confirmed by a combination of the datasets. Beyond this additional confirmation, the FourStar data provides higher confidence in the MCMF-redshift assignment for a number of high- systems near the threshold and is being used for targeting in ongoing spectroscopic follow-up efforts.
We show in Fig. 6 an example of one of these newly-discovered high- clusters confirmed with the additional FourStar data.
4.4 Characterization of WISE High- Confirmation
While the relative depth of WISE data is variable across the SPT-3G footprint (122, see e.g., ), we provide a rough assessment of high- confirmation with WISE by comparing MCMF results using LS-DR10 and WISE to an analysis based on Spitzer confirmations at high .
For this comparison, we use a sample of 442 confirmed galaxy clusters detected in the 100 deg2 SPT Deep field with redshifts estimated using DES and the redMaPPer (162) algorithm at low and Spitzer data in the SSDF (12) at high (108).
The SPT Deep field is of comparable depth to the data used in this work and so samples the population of high-, low-mass clusters explored here.
Of the 442 confirmed SPT Deep clusters, there are matches in our SZ candidate list for 392 within 1. Of these, 366 (93%) of the clusters meet the MCMF confirmation threshold. Two of these clusters (0.5%) were flagged as having incorrect lower- counterparts assigned by MCMF. Of the 7% unconfirmed, 25/26 were at , with 17 of these at .
The remaining low- system was not confirmed by MCMF as the algorithm excluded a large fraction of the optical/IR data in the cluster’s proximity owing to potentially corrupted imaging data.555
Such corruption typically occurs near saturated sources or other artifacts in optical images resulting in local regions of problematic data, with different analysis tools having different criteria for data exclusion.
Both the MCMF and redMaPPer algorithms generate maps of such regions and we use these maps to quantify the fraction of sky with corrupt data around candidates within fixed angular apertures. We use the term optical mask fraction to describe these values, and can refer to cluster candidates whose centers fall in optically corrupted regions as optically masked.
The SPT Deep field is roughly 1/16 the area of the Main field.
Using the 26 clusters at unconfirmed by MCMF in the Deep field (5 at where the SZ sample is expected to be pure), we would expect 416 high- unconfirmed clusters at (80 at ) without additional follow-up. More closely examining the subset, our additional dedicated (N)IR analyses confirm 72 systems leaving 51 candidates to be confirmed. Of these, 20 have optical mask fractions within 1 arcmin (impeding confirmation at any redshift), leaving 31 additional high-confidence high- candidates to be confirmed. This total (72+31=103) is in agreement with our extrapolation of WISE incompleteness from the SPT-3G Deep field.
4.5 Final Redshift Assignment
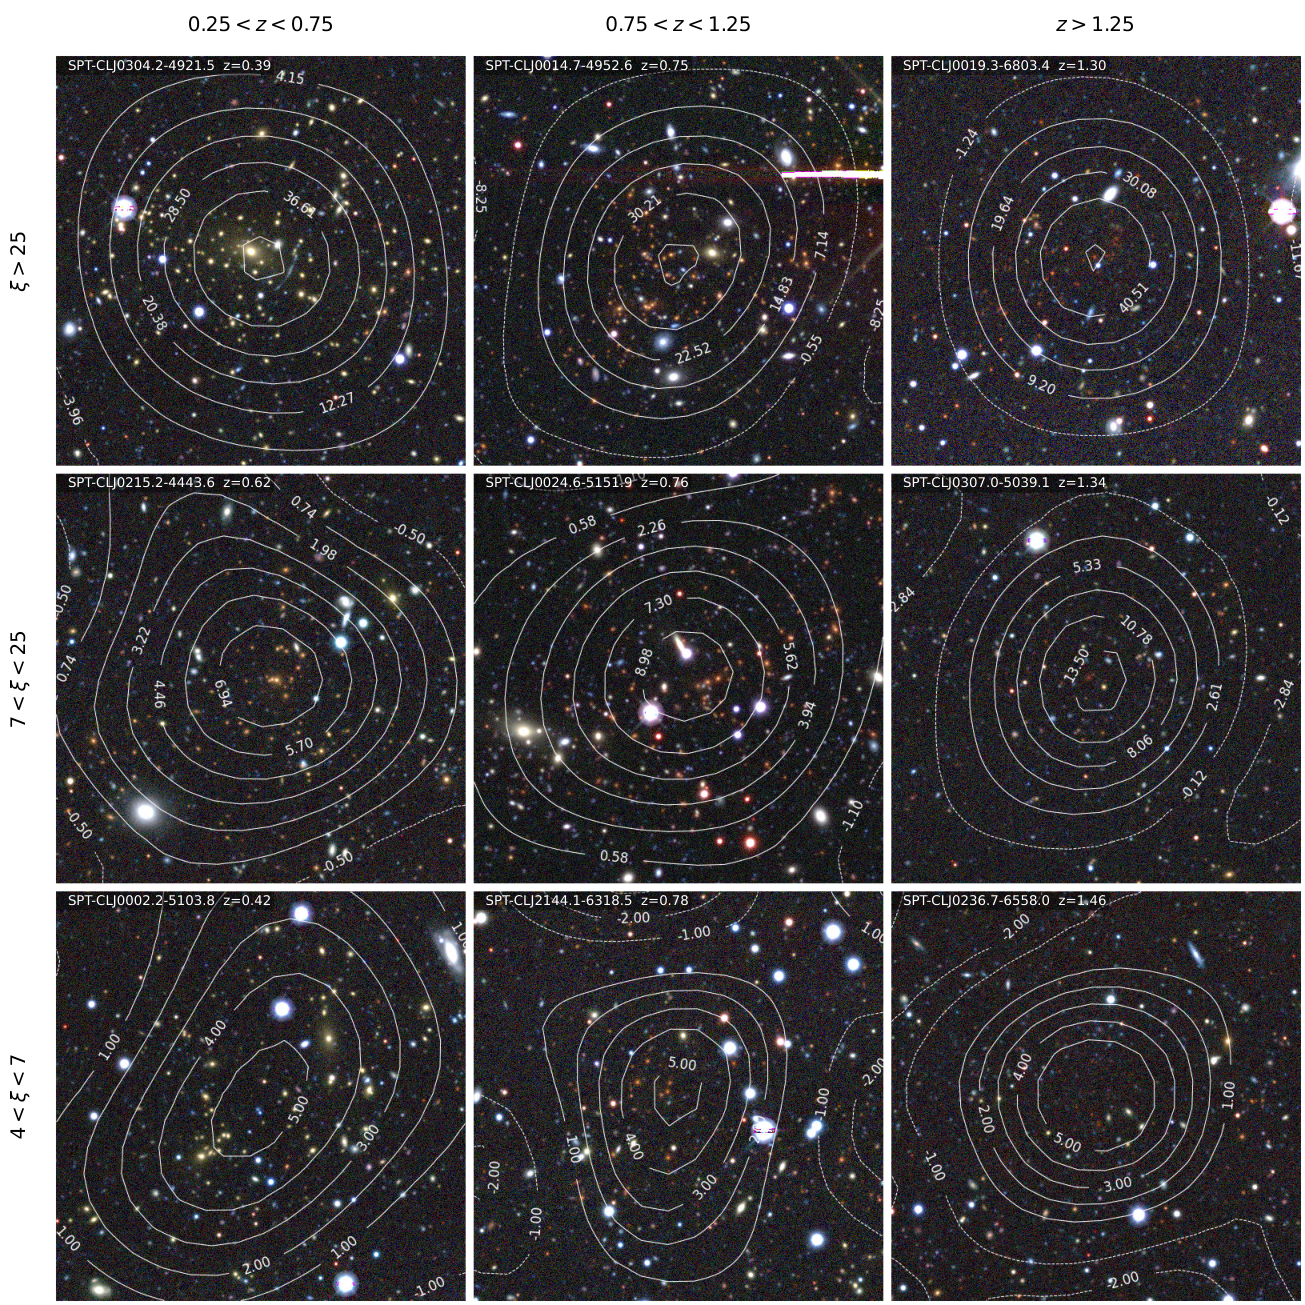
We display a panel of LS-DR10 images with SZ detection contours overlaid for clusters over the and redshift range of the sample in Figure 7 and plot the redshift distribution of the confirmed clusters in Fig. 8. An entry in the cluster catalog file (see catalog overview in the Appendix C) provides the redshift source for each cluster.
Final redshifts and cluster confirmation status are determined as follows.
Figure 7: DECam imaging of SPT-3G clusters from the LS-DR10 release (48) with SZ detection contours overlaid. The rgb images were created from band data and are 3\farcm8 in diameter. Clusters were selected to illustrate the SZ significance and redshift reach of the sample. The highest-redshift clusters were confirmed with additional observations from Spitzer, FourStar (Sec. 4.3), and WISE. Figure 8: Redshift distribution of the 7,190 confirmed clusters in the SPT-3G Main field sample confirmed using optical-IR data as discussed in Sec. 4. As noted in Sec. 4.5, owing to color degeneracies in the IR, we assign clusters with redshifts estimated at using the 1.6 m bump method to a value of in the catalog table, but we use their raw best-fit redshifts in the histogram here to illustrate the reach of the SPT-3G sample. This high- region is denoted by the gray-shaded band.
•
MCMF: Our primary confirmation and redshift assignment is based on MCMF. We begin by denoting as confirmed candidates with less than our maximum contamination threshold of 0.2 in either the LS-DR10 or LS-DR10+WISE analysis. Given the expected purity of the SZ catalog (see Sec. 3.3), this results in an expected overall sample purity of at and at .
•
Multiple Counterparts: For candidates with multiple optical/IR counterparts below the threshold, we select the primary optical counterpart based on a combination of matching criteria including the value of , the distance to the SZ center, and visual inspection of complex systems. We found that only using the lowest for this assignment leads to a bias against properly selecting some of the high- WISE counterparts. We flag systems in the catalog with multiple significant counterparts along the line-of-sight.
•
(Near) Infrared: Our next set of redshift assignments leverage the high-resolution data from FourStar and Spitzer. We cross-match SPT-3G candidates to clusters from previous SPT cluster samples (22; 108, particularly, ) within 1. For systems unconfirmed in MCMF but confirmed by Spitzer data in these prior works,666
Note, in these prior works we have adopted a lower =0.1 given the limited (i.e., SSDF) wide field area for contamination estimation, see 22 Sec 5.2. we assign the clusters the Spitzer redshift, richness, and contamination values previously computed. We also check for systems with significantly discrepant redshifts (e.g., typically low- assignment from MCMF and high- in clusters with Spitzer data). We reinspect each of these systems and assign associated properties from prior works when appropriate (see 22, Fig. 4, for an image of one such cluster misidentified by the limitations of LS-DR10+WISE data, SPT-CL J2331.6-5737.2 at ).
We note that we choose to keep MCMF+WISE-based richnesses and redshifts when redshifts are consistent to decrease the number of clusters reported with properties differing from our baseline method. In total 34 clusters have redshifts assigned in this step. Finally, as discussed above in Sec 4.3, 36 clusters were confirmed using a combination of FourStar data and MCMF.
•
Regions with Significant Masking in Optical Data:
We loosen our optical data masking criterion and also check an archival optical cluster sample with different optical masking choices around bright stars to enable confirmation of a small number of additional candidates. For this we make use of the 191 catalog (hereafter WH24 and discussed further below in Sec. 9). We match the optical clusters to SPT candidates using an association radius of 1\farcm5 and compute contamination fractions for the sample using a million random locations unmasked in DES data. We visually inspect optical images of all candidates for which (1) the MCMF masking fraction exceeds 50% within 1\arcmin or (2) the contamination estimated from MCMF exceeds 0.2 but is below this threshold in the WH24 match. We mark as confirmed and adopt either the WH24 (or MCMF where available) redshift when there is clear evidence of a rich cluster whose formal confirmation is impeded by the optical mask. The inspection process adds 24 clusters in areas masked by MCMF and 8 additional MCMF confirmations. We also include for all candidates the total fraction of area masked in LS-DR10 data in MCMF within 1 and 2 of the SZ candidate position.
•
Spectroscopic Redshifts and Additional Archival Redshifts: Next, we search the literature and tag those systems with spectroscopic redshifts, in total spectroscopic redshifts are sourced for 187 clusters.
Many of these spectroscopic redshifts come from previous dedicated follow-up observations of SZ-selected clusters (168; 160; 14; 102, e.g.,).
As an additional check on the high- confirmation, we repeat our matching and contamination estimation procedure, this time using the clusters from the Massive and Distant Clusters of WISE Survey 2 (MaDCoWS2; 182, also discussed further in Sec. 9). We inspect candidates with in MaDCoWS2 (but unconfirmed in MCMF), adopting redshifts and confirmations for 7 additional clusters.
•
Scaling Relation Cross Check: As a final check on our counterpart assignment, we examine systems that are significant outliers in our mass-richness scaling fit, discussed in the next section. Most of these clusters were determined to have low richnesses because of optical masking, but for 5 we found misassignment of a lower- counterpart to the high- detection. For 4 of these systems we could adopt a detection from MCMF, but for one (SPT-CL J0249.6-5138.7 at ) a high- counterpart was not detected in MCMF but was found in the MadCOWS2 sample.
•
IR-Color Redshift Degeneracy:
Finally, given the flattening of color-redshift relation in IR-based redshifts in the range (131, see e.g., Fig. 2 in), we choose to set redshifts as lower limits at for systems with redshifts estimated from this color combination at .
5 Observable-Mass Relations
In this section, we discuss how we relate the SPT cluster detection significance, , to the underlying halo mass.
We model the cluster sample accounting for its selection and present constraints on the –mass relation and the optical richness-to-mass relation.
For simplicity, we restrict this analysis to cluster redshifts to avoid modeling the transition from LS-DR10 to WISE at redshift when performing the optical confirmation (see Sec. 4.1).
Based on these relations, we present mass estimates for all clusters in our catalog.
5.1 SZ-Mass Relation
We establish the relationship between the detection significance and halo mass. We then construct a likelihood function for the cluster sample that, together with an assumed fiducial cosmology, allows us to constrain the parameters of the -mass relation.
Following previous SPT work (185; 22, e.g.,), we model the relationship between the detection significance and the unobserved, unbiased significance as a normal distribution
(8)
The mean of the relation (between and ) is offset by three to account for the three degrees of freedom of the maximization process during cluster detection (two positional degrees of freedom and the choice of filter scale).
Still following previous SPT work, we model the mean unbiased significance as a power law in mass and in the Hubble parameter at the cluster redshift
(9)
Note that because SPT-3G probes the cluster population down to lower masses than previous SPT generations, we lower the pivot mass from to . We assume normal scatter in of width .
We model the subset of the cluster sample with and . The Poisson likelihood of this sample of clusters is
(10)
with the survey selection function and with the astrophysical and cosmological model parameters .
The differential cluster abundance is
(11)
with halo mass function and the differential volume element within the survey footprint . For more details, we refer the reader to, e.g., Sec. VII in 25.
To remain consistent and comparable with previous SPT cluster catalog publications, we assume the fiducial cosmology described in Sec. 1, we fix , and we infer the SZ-mass scaling relation parameters , , and using the likelihood function (Eq. 10) and assuming wide uniform priors.
The recovered parameter constraints are summarized in Table 1 and shown in gold color in Fig. 9.
In previous SPT cluster analyses, for each SPT field, the amplitude was multiplied by the effective field depth such that the observable-mass relations in all fields were normalized with respect to a common reference (namely the depth of the ra5h30dec55 field from the 150 GHz-only SPT-SZ analysis of 185).
In this work, we do not apply such a correction (that is, we set ), and we recover (see Table 1). When we adopt a pivot mass as in previous works, we obtain . Comparing this number to for pre-3G surveys, we empirically determine .
This number closely matches the effective depth of the SPT-Deep field (108).
For a given cluster, the typical detection significance in the SPT-3G Main data is thus over twice as high as it was in SPTpol 500d data () and over four times as high as in full SPT-SZ data ().
Figure 9: Parameters of the SZ and richness observable-mass relations assuming a fixed reference cosmology (68% and 95% credibility). Gold contours show an analysis of the cluster counts where we model the sample selection in detection significance and redshift (we fix in this case as shown by the dashed line). Blue contours show an analysis of the cluster counts where we model the sample selection in and but where we also model the optical selection . To calibrate the parameters of the -mass relation, this analysis also includes the likelihood of the measured optical richness given the SZ significance .
Parameter
SZ only
SZ and richness
0.2
…
…
…
…
Table 1: Constraints on the parameters of the observable-mass relations defined in Eqs. (9) and (12) (mean and standard deviation).
5.2 Modeling the Optical Confirmation and the Richness-Mass Relation
In the previous section, we modeled the cluster sample as being selected based on cuts in significance and redshift .
In a more complete approach, we now also model the optical confirmation via a cut in (see Sec. 4.1).
To do so, we compute a redshift-dependent threshold in optical richness that reproduces a sample with the given (see also Fig. 5).
The survey selection function now reads .
We define a richness-mass relation
(12)
with the intrinsic (true and unobservable) richness .
We assume lognormal intrinsic scatter in of width .
The true richness is related to the observed richness via a normal distribution of width
(13)
If richness was measured independently of background galaxies, then one would expect Poisson errors . We go beyond this approximation and empirically determine by accounting for the impact of the redshift-dependent local galaxy background on the richness measurement. We establish an approximate relation based on measurements from the LS-DR10 data of:
(14)
We now expand the likelihood from Eq. (10) and the survey selection function to incorporate richness
(15)
The differential cluster abundance in two observables
(16)
is analogous to the single-observable case in Eq. (11).777
Equation (11) can be obtained from Eq. (16) via marginalization over richness
The SZ and richness observable-mass relation incorporates the mean relations (Eqs. 9 and 12), and the intrinsic scatter and .
We assume our fiducial cosmology and wide uniform parameter priors; for the scatter parameters, we additionally set a hard lower bound . We then use the likelihood (Eq. 15) to infer the SZ and richness scaling relation parameters.
Because we now consider two mass proxies, we can empirically calibrate the intrinsic scatter parameters, and we do not fix the SZ scatter as we did in the previous section.
The richness of clusters that are affected by the optical mask are likely to be mis-estimated. Therefore, we marginalize over the richness of clusters with more than 20% of the area within 1\arcmin of the SZ centroid masked.
The results are presented in Table 1 and in blue color in Fig. 9.
The mean recovered constraints on and are almost identical to the ones obtained from the more simplistic SZ-only analysis. The data-driven measurement of the SZ scatter exhibits a shift toward smaller values than the fiducial (probability to exceed , corresponding to ). Due to the degeneracy between the SZ scatter and amplitude, treating as a free parameter leads to broader constraints on than obtained in the previous section (gold contours in the figure) and also implies a shift of the amplitude ().
In summary, the overall agreement confirms that, while the cut is crucial to remove spurious cluster detections, it does not lead to a significant removal of true clusters (otherwise the two sets of results would be inconsistent).
Note that compared to the richness-mass relation of SPT-selected clusters presented in 26, we now use an updated richness measurement scheme that produces higher estimates.
With these new richness measurements, we recover a mass trend that is consistent with unity within .
We report a hint for an evolution with redshift ( at ).
Figure 10: Distribution of the () subsample of SPT-3G clusters in the space of SPT significance and optical richness. The straight line shows the mean model and contours show the expected distribution. We find 27 out of 3,005 clusters outside of the 99% contour, in line with the expectation. Clusters whose richness estimates are likely to be affected by masking are shown with gray crosses and are not used in the fit.
In Fig. 10, we show the cluster sample in significance-richness space, along with the prediction of the mean relation and of the full distribution.
In particular, we check if the number of potential outliers is consistent with the model expectation.
In a first iteration, we noticed a population of clusters with SPT significance around 7 and richness around 20 that did not seem to be well described by our model (gray points in Fig. 10). Upon closer inspection, we found issues in these clusters’ redshift and/or richness assignments owing to masking or incorrect assignment of a higher- cluster to a lower- system (see Sec. 4.5). As discussed above, we do not use these partially optically masked clusters’ richness measurements in the fit, even if including them only leads to minor shifts in the recovered parameters (mainly increasing ).
5.3 Mass Estimation
Assuming the fixed cosmology and the mean SZ scaling relation parameters we just obtained, the parameters are set and we compute the probability distribution for the mass of each cluster as
(17)
The width of the recovered distributions captures the noise due to observational and intrinsic scatter but not the systematic uncertainties in the model parameters themselves.
The latter will be assessed in the context of a mass-calibrated cosmological analysis (26, such as). In Appendix C, we present the mean recovered mass for each cluster, along with the 68% credible interval.
Figure 11: The mass-redshift distribution of the five-year SPT-3G Main field sample compared to other recent large ICM-selected cluster samples, including those from ACT (5), eROSITA (29), Planck (143), and previously published samples from the SPT-SZ, SPTpol, and SPT-3G collaborations (23; 21; 22; 104; 108; 11). As noted in Sec. 4, above there is a large degeneracy in the color-redshift relation used for IR-confirmed clusters. Here, for display purposes, we plot the confirmed clusters at at redshifts obtained from sampling a realization of the cluster mass function for our fiducial cosmology to better illustrate the expected distribution of the SPT-3G sample.
6 The SPT-3G Main Field Cluster Sample
Combining the results of the previous sections, the SPT-3G Main field cluster sample consists of 8,892 cluster candidates above a detection significance , of which 7,190 are confirmed as clusters using optical-IR data discussed in Sec. 4. The sample extends in redshift from to , and in mass from to .
The median mass of the sample is = , and the median redshift of the sample is , with 1,780 clusters () at and 271 () at .
In Fig. 11 we plot the mass-redshift distribution for the SPT-3G Main field sample as well as samples from other ICM-selected catalogs, including samples from multiple generations of experiments on the SPT (21; 22; 104; 11; 108), the X-ray selected eRASS1 cluster sample from 29, and the most recent SZ cluster releases by the ACT (5) and Planck (143) collaborations.
The SPT-3G cluster sample has a significantly lower mass threshold and higher cluster density (4.5 confirmed clusters/deg2) than the other wide-field surveys.
The increased sensitivity and the steepness of the cluster mass function also results in comparable cluster counts between this sample (7,190 confirmed clusters) and the most recent ACT sample (10,040 confirmed clusters)—including more high-redshift () clusters (1,780 in this sample vs. 1,171 in ACT) despite a factor of 10 difference in sky area.
The sample is particularly complementary to the eRASS1 selected sample, which probes similarly low-mass clusters at low redshifts, where SPT is less sensitive.
6.1 Completeness
Figure 12: Estimated completeness of the SPT-3G Main cluster sample above at several different redshifts. As discussed in Sec. 6, the sample has a declining mass threshold as a function of redshift. The sample is expected to be complete for masses at .
As noted in previous works (96, e.g., ), signal-to-noise-selected SPT cluster catalogs have an effective mass threshold that declines as a function of redshift owing to (1) the characteristics of noise in the maps—i.e., “redder” residual CMB and atmospheric signals on larger scales transitioning to lower noise at small scales results in more effective detection of (more compact) high- systems—and (2) self-similar evolution in clusters that results in hotter clusters at fixed mass at higher redshift (100).
This trend is clearly seen in the completeness of the SPT-3G sample (Fig. 12).
We model the completeness as a Heaviside function in significance, , which reflects the hard cut in SZ significance used to select cluster candidates. Using the relation, the completeness in significance is converted to completeness as a function of mass and redshift to represent the probability of a cluster of a given mass at a given redshift to be found in the SPT-3G catalog. At redshift , the sample is expected to be complete for masses and complete for . As discussed, the mass threshold drops with increasing redshift, and at the median redshift of the sample , completeness is expected for . Finally, for , the sample is complete for . We note that the completeness of the SPT-3G catalog below a threshold of becomes difficult to model owing to the filters applied during the SPT mapmaking process which remove large-scale Fourier modes, and hence large-angular-scale signals from clusters.
Additionally, this modeling does not account for biases from correlated contaminants such as radio-loud cluster AGN (discussed more in Sec. 10).
In the sections below we further explore properties of the sample, particularly focusing on strong lensing clusters in the SPT-3G sample (Sec. 7), comparisons to other ICM-selected (Sec. 8) and optically selected (Sec. 9) cluster samples, and internal systematic checks with the SPT-3G data (Sec. 10).
7 Strong Gravitational Lenses
Owing to their immense masses and high mass densities, galaxy clusters can produce some of the most spectacular strong gravitational lensing phenomena in the Universe (see e.g., 148; 40; 145 and the recent review of 133).
By cleanly identifying the most massive clusters, SZ surveys have proven highly useful to search for such systems (116; 34, e.g., ).
Over 110 clusters from previous generations of SPT samples have been identified as strong lenses, both as new discoveries (175; 88; 173; 23; 21) and through associations with lenses reported in the literature.
In this section we examine the strong lensing properties of the SPT-3G sample in two ways: first through cross-matching cluster locations with previously identified strong lenses and lens candidates from the literature, and second, through visual inspection of the confirmed SPT-3G cluster sample using DECALS and archival SPT follow-up data.
We additionally flag potential lenses in Sec. 10.1.1 based on associations with bright dusty sources detected in SPT data.
7.1 Archival Lensing Search
Over the last decade, there has been a tremendous expansion of strong lenses and strong lens candidates in the literature owing to the availability of high-quality wide-area optical survey data coupled to new crowd-sourcing- and machine-learning-based lens identification tools (e.g., 129, and many others).
Data from DECALS and the Dark Energy Survey have proven particularly valuable given the deep, relatively uniform coverage in common filter bands.
These data have enabled a wide variety of searches for lensed galaxies and quasars at galaxy (52; 159; 84; 73, e.g.,) and cluster scales (138; 130, e.g.,).
Here we leverage the lens and candidate lists provided in the Strong Lensing Database (186, SLED;) in the SPT-3G footprint augmented by our own literature compilation of cluster and galaxy lenses; in total we cross-match against lenses from 39 different publications for this search.
We conduct our cross-match within apertures of 1\arcmin (2\arcmin) to account for statistical uncertainty in the SPT position as well as astrophysical offsets between ICM centroid tracers and cluster centers of mass.
We find that 242 (285) or 3.3% (4%) of confirmed clusters have matches in the archival strong lensing compilation within 1\arcmin (2\arcmin).
There is naturally significant redundancy in lenses in this compilation: SPT clusters match 370 entries within 1\arcmin, with e.g., 3 clusters (ACO S1063, SPT-CL J2138-6007, and ACT-CL J0034.4-4551) matching reported lenses or lens candidates in 4 different publications, 20 clusters matching candidates in 3 publications, 79 clusters in 2, and 140 clusters with a single match to a reported lens or lens candidate.
7.2 Visual Inspection in Optical Follow-up Data
We next visually inspect images of confirmed clusters constructed using z-, r-, and g-band imaging data from LS-DR10 (48).
Using a new tool, Image Marker, which was developed for the efficient classification of astronomical images (189), we scored cluster images from 0-3 where 0 denotes no evidence of strong gravitational lensing and 3 records strong evidence (e.g., multiple images, arcs, etc.) of lensing.
We also examined and scored observations from earlier SPT follow-up campaigns, particularly from Magellan/PISCO (174; 21) and Hubble Space Telescope observations (PIs: Stubbs, High, Schrabback, Gladders) of SPT-SZ (23) and SPTpol (96; 22) clusters which are also in the SPT-3G sample.
In total we tag 195 clusters as having strong evidence (score=3) for gravitational lensing, newly reported here.
8 Comparison to Other ICM-selected Cluster samples
Table 2: Summary statistics from the angular association of SPT-3G Main field cluster candidates to other ICM-selected cluster samples. For this comparison we restrict to clusters in the external samples with provided redshifts and, when masses are supplied, estimated masses greater than 0. Here N is the total number of such clusters in the ICM catalogs, N is the number of clusters within the SPT-3G Main field area used in the cluster search (see Sec. 3), and the fraction matched is determined using a 3\arcmin matching radius to candidates in this footprint. Mass ratios are reported as the median of the SPT-3G catalog mass over the comparison catalog mass. More details on these matches are provided in Sec. 8. We perform additional matches to other eROSITA source catalogs in Appendix 17.
We next cross-match the SPT-3G catalog with other ICM-selected catalogs from SPT, ACT, and eROSITA.
As optical confirmation significantly improves the purity of the samples—especially near their respective selection thresholds—for each of these samples we conduct our primary comparison to clusters with provided masses and redshifts (that is, not including “unconfirmed” candidates).
Balancing the angular density (highest for the SPT-3G sample at 4.5 clusters/deg2) and the various positional uncertainties of the surveys (median 0.3\arcmin for SPT-3G), we adopt a 3\arcmin matching radius. A summary of the matches is provided in Table 2.
8.1 Comparisons to Previous SZ-Selected Samples from SPT
From SPT we compare to samples from SPT-SZ (23; 104), SPTpol 500d, (22), and the 100 deg2 SPT Deep field (108, hereafter K26); the latter sample was constructed from combined SPT-3G and SPTpol data. We find excellent agreement in both positional recovery and mass estimation for the SPT-selected samples, with the new SPT-3G sample containing a strong majority of all of the previously published clusters.
Exploring further the unmatched clusters, from SPT-SZ we have 57 clusters in the SPT-3G footprint not matched in the new sample. The median of these unmatched clusters is 4.2, with only 1 cluster detected at (the 95% purity threshold for SPT-SZ without additional optical follow-up). For the unmatched clusters, the median optical richness is low ( vs. the median of the matched sample of ) with a corresponding increase in optical contamination (median of 0.10 for the unmatched candidates vs. for the matched candidates).
At the unmatched cluster locations, we recover a median =1.6 in matched-filtered SPT-3G maps using a forced photometry approach we will use for the rest of this section when comparing to other unmatched cluster samples.
Given the SPT-3G maps are deeper for cluster detection than those from the SPT-SZ survey (Sec. 5), the combined evidence supports that noise boosted the detection significance of the unmatched clusters high in this earlier survey.
A similar conclusion holds for the SPTpol 500d sample.
Here there are 42 unmatched clusters in SPT-3G data with a median 4.3, richness 17, and contamination 0.05 compared to 5.1/39/0.008 for the respective statistics in the matched sample. Only 2 unmatched clusters had with modest richnesses (both and 9 and 21). The median force-photometered SPT-3G value for all the unmatched clusters was 2.2.
The last SPT sample we consider is from the SPT Deep field analyzed in K26.
Results from this previous sample are especially correlated with this work as Main field data from SPT-3G (without time constant corrections in mapmaking, an improvement in this work, see Sec. 2.1) provide the most constraining CMB survey data used in that analysis, though additional data from the SPTpol 100d (96), 500d (22), as well as from Herschel/SPIRE (79) was also used.
As seen in Table 2, these shared data greatly reduce the typical angular offsets between the SPT-3G Main and Deep field matches.
Cross-matching the two samples we find 68 unmatched clusters (16/68 of these from an alternative analysis in which an estimated model for correlated dust emission was removed from the filtered SPT maps, see K26 Sec. 8.2), with 2 again at . Inspection of the maps shows these 2 centroids in the Deep field on the borders of point source masked regions which differ slightly between the runs. For the remainder of the unmatched clusters, the median Deep field significance is slightly higher, , compared to 3.6 in force-photometered SPT-3G maps here.
8.2 Comparison to the ACT DR6 SZ-Selected Catalog
We next cross-match to the SZ-selected cluster catalog produced from 16,293 deg2 of ACT DR6 survey data (5).
The optically confirmed sample contains over 10,000 systems with a median mass of 2.8 and a median redshift of ; 1,171 clusters are at .
From this full sample, 1,127 clusters are in the SPT-3G Main footprint.
Cross-matching to the SPT-3G cluster sample, here again we find a high fraction (93%) of the ACT confirmed clusters in the SPT-3G sample, with good agreement in the mass and position estimates.
Matched clusters are typically detected at 2 higher signal-to-noise in the SPT-3G data.
There are 77 ACT clusters not matched to the SPT-3G catalog, with 69 (of 77) detected at ACT SNR less than 5.
The median unmatched cluster has a ACT SNR, and forced photometry of the SPT-3G maps at those locations gives a median .
Of the 8 unmatched systems detected in ACT at SNR5, 3 were in the border regions of point source masks,
and 2 of the clusters had force-photometered values above the threshold (ACT-CL J0003.35254 was detected at and ACT-CL J0057.35222 at ) but had SPT recovered centroids in the point source exclusion region and so are excluded from this catalog.
One additional higher SNR ACT cluster (ACT-CL J2249.14426, SNR=6) is 6 arcmin away from the massive cluster ACO 1063 which was detected at in the SPT-3G maps.
As noted in Sec. 3, match-filtering can cause secondary artifacts in ground-based CMB survey maps around massive clusters; visually inspecting the SPT maps at the ACT cluster location we do not see clear signs of a missed high-significance cluster.
The remaining 5 higher-significance unmatched ACT clusters had median force-photometered =3.4 in SPT-3G data, with values ranging from 2.2 to 3.8.
8.3 X-ray Selected Clusters
Our final ICM sample comparisons focus on X-ray-selected clusters from the first data release of the eROSITA survey (125, eRASS1;).
While cross-comparisons with prior SZ surveys allow validation of our selection in mm-wave survey data and mass estimation methods, comparisons with eROSITA additionally allow us to probe other systematics in cluster sample construction—particularly sources of selection bias that may strongly impact one survey’s selection observable but not the other.
While detailed comparisons and validation of the eROSITA and SPT selection functions are beyond the scope of this work (see e.g., 38, for a detailed study using earlier SPT survey data), this section and Appendix 17 briefly highlight the potential of such studies with the new SPT-3G dataset.
We first compare to the first galaxy cluster and group catalog produced from eROSITA western-hemisphere data (29).
This cluster sample, selected as sources of extended X-ray emission in 13,116 deg2 of survey data, contains 12,247 optically confirmed systems in the redshift range . We restrict our comparisons to clusters with redshifts and positive mass estimates.
Of this sample, 1,126 systems fall within the SPT cluster search region.
The SPT-3G sample matches 62% of the eRASS1 sample in this region, leaving 430 unmatched.
Of these, 161 are at where the SPT sample is expected to be more complete (see Sec. 3.3), for an overall matching percentage at of 75%.
The story is complicated, however, by the necessity of adopting a mixture model in the X-ray confirmation process to account for spurious associations with X-ray AGN and other sources (see e.g., discussion 29, Sec. 2.4).
Examining the parameter which records the probability of random X-ray associations compared to cluster candidates (and was set using a combination of richness, redshift, and X-ray count data), we see a marked difference in this statistic between our matched and unmatched population, with 92% of the matched clusters having at , but only 30% of the unmatched sample.
Figure 13: Redshift-scaled (Sec. 5) SPT detection significance, , vs. X-ray mass for clusters at in the eRASS1 cosmology sample (29). In bold we plot eRASS1 clusters that have counterparts within the SPT-3G catalog (89%), while in pale gray we plot force-photometered values for clusters without matches; note that the y-axis scaling transitions from log to linear below the SPT detection threshold of . Green circles mark eRASS1 clusters with higher probability of spurious X-ray AGN contamination and blue and orange symbols mark clusters with nearby radio sources detected in SPT and/or low-frequency ASKAP (59; 82) data. While mm-bright radio sources can bias the recovered SZ significance low, the majority of unassociated eROSITA clusters in unmasked areas in the SPT footprint do not have radio counterparts.
We move to the eRASS1 cosmology sample to increase the intrinsic purity of the X-ray catalog.
This sample has a stricter X-ray extension likelihood threshold ( compared to 3 for the full sample) and is expected to be 95% pure with no additional cleaning (compared to 86% for the full sample).
Starting from the full eRASS1 cosmological catalog, we find 586 clusters in the SPT cluster footprint, with 564 of these with provided X-ray masses (96%).
Adopting a 3\arcmin matching radius, 76% of these X-ray clusters have matches in the SPT-3G catalog and 87% of the 331 clusters at are matched.
This match rate rises slightly to 89% when considering only eRASS1 clusters which also have positive reported X-ray masses.
These association rates are comparable to the completeness of the SPT-3G catalog vs. the other SZ surveys.
We expect the SPT-3G sample to be 90% (50%) complete at () at , the median redshift of the full eRASS1 sample at .
The 35 unmatched eRASS1 clusters with positive X-ray masses above this redshift have a median mass of ; 15 of these systems fall below SPT’s 50% completeness mass.
Overall SPT matches 93% of the eRASS1 clusters with at , roughly consistent with expectations.
In Fig. 13 we plot the X-ray masses compared to the clusters’ SPT-3G values; for clusters unmatched in the SPT catalog we force-photometer at the X-ray location.
We indeed see most of the unmatched clusters are at the low-mass end of the X-ray sample; we will further examine unmatched clusters in the context of potential radio source contamination of the SZ signal below in Sec. 10.2.2.
Finally, while this section focused on cross matches to the main eRASS1 cluster sample of 29, in Appendix 17 we extend these comparisons to both X-ray clusters selected from a reanalysis of the eRASS1 point source catalog (13) as well as cross matches to the point sources (125) themselves.
9 Comparison to Optical- and Infrared-Selected Cluster Catalogs
Following the approach adopted in the 22 analysis, we next associate the SPT-3G Main field cluster catalog with a set of optical- and IR-selected cluster catalogs. Specifically, we consider the DES Y3 redMaPPer catalog (3) and the WISE/LS DR10-based cluster catalogs of 191, and MaDCoWS2 (181). These catalogs are representative of galaxy-based cluster detection techniques across optical and IR wavelengths, providing a complementary comparison to the SZ-selected SPT-3G sample.
We particularly focus on the fraction of SPT clusters detected in each external catalog, consistency of redshift estimates, and the measured scatter between SZ mass and optical/IR richness for the associated counterparts.
We detail the measurement of these quantities in the following subsections and summarize these properties in Table 3.
Catalog
Ext. vs. MCMFConfirmed
RM Y3
0.66
0.009
MaDCoWS2
0.52
0.013
WH24
0.72
0.012
Table 3: Summary statistics from the association of SPT-3G Main field cluster candidates to optical/IR cluster samples. Using a -based association (Sec. 9.1), we report the fraction of SPT-3G clusters confirmed by each catalog compared to our baseline MCMF analysis, the scatter in redshift estimates between MCMF and the external catalogs at (0.95 for RM), and a simplified estimate of the scatter between the optical/IR mass proxy and our SZ-based mass estimates for clusters with masses greater than (Sec. 9.5). We have corrected for a small bias between the MaDCoWS2 and MCMF redshifts when reporting the scatter. SPT-3G cluster recovery is primarily limited by different effects for each catalog, namely (1) the redshift reach of RM, (2) the relatively high richness selection threshold of MaDCoWS2, and (3) the large scatter between richness and SZ observable for WH24.
9.1 Matching Procedure
We adopt a more sophisticated matching procedure for associating clusters from the higher-density optical/IR catalogs with SPT-3G counterparts.
The matching strategy is identical for all the comparisons in this section and consists of two approaches. The first approach is
MCMF-like in which we estimate using a maximum cross-match radius of 2\arcmin between external and SPT positions to select potential candidates. To generate random locations, we shift the positions in the external catalog randomly by more than 0.5∘ and repeat the matching. We then follow the steps in Sec. 4.1 to find the best counterpart showing the lowest measurement of .
The second approach is a more simplistic positional matching widely used in literature. We first rank the clusters in each optical/IR catalog according to their respective mass proxies and then perform a ranked positional cross-match with the SPT-3G catalog within a maximum separation of . Each SPT-3G cluster is associated with the optical/IR counterpart of highest mass proxy found within the matching radius. To avoid duplicate associations, each optical or IR cluster can be matched only once and is removed from subsequent matching iterations.
To quantify the purity and completeness of the resulting positionally matched sample, we repeat the matching procedure for several control configurations. These include: (1) increasing the matching radius beyond , and (2) performing matches to catalogs whose positions have been artificially shifted by and deg in right ascension and declination (8 diagonal permutations). The nominal matches are used for direct catalog-to-catalog comparisons, while the enlarged and shifted configurations serve to estimate the fraction of chance associations.
Following the methodology described in 105, we model the offset distributions to separate genuine and random matches. The distribution of separations for the unshifted catalogs represents a mixture of real and chance matches, while the shifted catalogs yield purely random associations. We normalize the shifted-offset distributions to match the amplitude of the unshifted distribution at large separations (), where the contribution from real matches is negligible. The scaled distribution of shifted offsets then provides an empirical estimate of the expected number of chance coincidences as a function of separation. Integrating this function up to yields the expected number of false matches within the default radius. Subtracting the chance component from the total offset distribution isolates the contribution from true physical associations. The integral of this true-match distribution out to gives the number of genuine matches, while extending to provides a measure of all possible real associations between the two samples.
The positional matching method provides estimates of completeness and purity for a more commonly used approach, while the MCMF-like approach makes use of richness and redshift information to provide overall better counterparts.
The selection cuts used in the individual external catalogs complicate the sample purity estimate compared to a pure selection, as they miss low-richness systems that would have made the selection. We therefore use -informed counterparts for redshift and richness comparisons, while providing purity and completeness estimates from the positional matching method.
9.2 Comparison to the DES Y3 redMaPPer Catalog
The DES Y3 redMaPPer (RM) catalog was recently employed in the cosmological analysis of 3.
The sample consists of 869,000 groups and clusters detected above richness 5 in the 5,000 deg2 DES observing region. The sample covers a redshift range of and overlaps approximately 85% of the SPT-3G survey footprint.
Following 3, we first limit the catalog to 20, the 99% purity threshold of the sample (42).
Applying the angular matching procedure described above, we identify 3,129 SPT-RM matches ( of the SPT sample matched in the common sky area), of which are confirmed by MCMF ().
We find that 99% of all true associations lie within , and estimate a chance of random matches within the same radius.
Lowering the richness threshold to 10 increases the match fraction to , but doubles the fraction of chance matches.
If we instead adopt the redshift-dependent -selected RM catalog down to 5 and impose a , we find 4,003 matched clusters. The confirmation fraction of the -selected sample between reaches 92% of that of MCMF, showing very similar performance over the redshift range well probed with DECam data.
Restricting the analysis to , we find a mean scatter between the MCMF and RM redshifts of . The scatter shows a clear redshift dependence, increasing beyond and reaching at . We identify 39 systems with , corresponding to % of the sample. All but five cases have a match to the second-ranked optical counterpart. After visual inspection of all systems with discrepant redshifts, we find that the main cause of redshift mismatches are multiple structures along the line of sight.
In cases where no match with the best or second-best MCMF candidate was found, redshift mismatches were caused either by local masking or the blending of two clusters with small () redshift differences.
9.3 Comparison to the MaDCoWS2 Catalog
We next compare the SPT-3G Main catalog to the DECaLS/WISE-based MaDCoWS2 cluster catalog (181). The MaDCoWS2 sample provides a complementary view of the massive cluster population and extends to higher redshifts ( than RM.
The sample has an estimated % overlap with the SPT-3G survey footprint and
contains 133,036 galaxy clusters detected at SNR from 6,498 deg2 of imaging data.
Using the simplified angular matching procedure described above, we identify 3,032 matched systems within ( of SPT clusters in the common sky area), of which only 36 (1%) are not confirmed by MCMF; 4% of the matches within this radius are expected to occur by chance.
Turning to the -associated MaDCoWS2 catalog, we find 3,169 clusters below . Restricting to the confirmation rate reaches 64% of the MCMF value. This is well below that found for the RM catalog and likely caused by the significantly higher selection threshold of MaDCoWS2 catalog.
We find a bias between MCMF and MaDCoWS2 redshifts above , increasing to at and then being approximately constant until .
To obtain a less biased measurement of the scatter between redshifts, we correct the MaDCoWS2 redshifts using the median redshift offset of the 100 closest clusters in redshift.
We find a redshift scatter of for clusters at , increasing to for systems in the range .
Overall, 97.4% of all matched clusters agree within in redshift. Among the remaining 2.6% outliers, approximately 80% show consistency with the second-ranked optical counterpart, leaving only of the systems without agreement among the two best matches.
9.4 Comparison to the LS-DR10-Based Cluster Catalog of Wen & Han 24
As a third comparison, we match the SPT-3G main catalog to the LS-DR10-based optical/IR cluster catalog of 191. This catalog provides one of the largest homogeneous optical cluster samples to date, covering a wide redshift range () and nearly the full SPT-3G Main footprint.
The sample consists of 1.58 million clusters with richness drawn from the 24,000 deg2 LS-DR10 release.
We identify 5,931 matches within to SPT-3G clusters (78% of confirmed SPT-3G clusters in the common footprint), finding that 97% of the true SPT-WH24 associations lie within , while approximately 11% of the matches within this radius are expected to occur by chance. Among these, 5.5% have and are thus not confirmed by MCMF, implying that 94.5% of all matched systems are independently confirmed by our baseline analysis.
Using the -selected catalog, we find 5,154 clusters below .
Comparing the confirmation rate from , we reach 87% of the MCMF value, better than MaDCoWS2 but below the low-richness version of the RM catalog.
The comparison of redshift estimates shows good overall agreement. At , we measure a redshift scatter of , which increases to at . Approximately 5% of the matches deviate by more than in redshift; of these, 75% agree with the second-ranked optical counterpart, suggesting ambiguous associations or projection effects.
Figure 14: Optical richness vs. SZ-inferred mass for the subset of 1,909 clusters at found in all four (SPT-3G, redMaPPer Y3, MaDCoWS2, and WH24) cluster samples. MCMF, our baseline confirmation method (Sec. 4) shows the smallest scatter with SZ mass, followed by the redMaPPer sample. The WH24 sample, while having large scatter, is the most complete (%) of the external catalogs.
9.5 Comparing Optical Mass Proxies with SZ-based Mass
In the previous subsections we compared confirmation fractions, purity, and redshifts of three external optical/IR cluster catalogs. In this section we compare the performance of the individual optical mass proxies. For that we create a subsample containing all confirmed clusters in common between surveys. From the SPT-3G Main catalog we select all clusters with in MCMF, RM, MaDCoWS2, and WH24. We further restrict the redshift range to and redshift offsets to be from the MCMF value.
The final sample for this test contains 1,909 clusters.
We use richness as the optical mass proxy in all cases except for the MaDCoWS2 sample (where it is not provided); for that sample we use the square of the provided SNR assuming Poisson background noise as the mass proxy.
Under the assumption of Poisson noise the square of the SNR should scale with the richness.
Optical mass proxies like richness typically scale approximately linearly with cluster mass; assuming this holds for the samples considered here, one can use the scatter in the richness-to-mass ratio to evaluate the performance of different optical mass proxies.
In Fig. 14, we show richness vs. SZ-inferred mass for the optical catalogs and MCMF. The richness-to-mass ratio is well described by a lognormal distribution. From the external catalogs we find the smallest scatter of for the RM catalog, followed by MaDCoWS2 and WH24 each with .
In Fig. 14, the MaDCoWS2 and WH24 samples exhibit incompleteness at low masses due to richness selection thresholds of 25 (SNR = 5) and 20 (corresponding to ), respectively. As a result, the richness-to-mass distributions are partially truncated and the inferred scatter is underestimated. Above , the richness distribution at fixed mass is significantly less affected by these thresholds, yielding more reliable but noisier scatter estimates.
Restricting to masses above this threshold we find for RM, for WH24, and for MaDCoWS2. Overall the RM richness appears to perform significantly better than the mass proxies of the other two catalogs. For MCMF richness we find over all masses and above , outperforming RM richness, but note that the MCMF confirmations were constructed with the advantage of using SZ prior information.
In Appendix B we examine the RM Y3 mass-richness relation in more detail, using the more sophisticated modeling of Sec. 5.
10 Mm-wave Contamination
The multi-frequency data of SPT-3G allows us to conduct several systematic checks for contamination in our recovered cluster properties.
We particularly focus on consistency checks between Compton- measured from our baseline three-band combination and that estimated using subsets of these bands.
The main sources of contamination are expected to be from dust emission correlated with cluster galaxies and the cluster environment and synchrotron emission from radio-loud cluster members.
Figure 15: Internal frequency characterization of the SPT-3G Cluster sample. In all panels we plot the profile amplitudes ( or , see Eq. 2) for our matched filter with . In the top panels we compare the Compton- measured at 95 GHz to that from the full 3 band combination. In the top-left panel we show a scatter plot of these quantities, with a 1-1 line over-plotted (dashed-black). In the top-right panel we plot the distribution of measured differences with Gaussian curves reflecting the noise levels of the difference maps over-plotted centered at the median differences (traced by colored bars at top) for 3 different redshift bins. Overall the Compton- values are in good agreement, though we do see a small systematic shift in the recovered Compton- at 95 GHz with increasing redshift, reflecting a small level of dust contamination. The distributions are also highly Gaussian with scatter tracing the noise in the fields; outliers are discussed in Sec. 10.1.1, 10.2.1. To examine contamination with different spectral indices, in the bottom-left panel we plot the difference between measurements at 95 and 150 GHz. Clusters contaminated by sources with rising (e.g., dusty) flux will have positive differences, while sources with sufficiently steep negative indices (see Sec. 10.2) can lead to negative differences. Here again we see a clear increasing level of positive contamination and skewness with redshift, pointing to increased correlated dusty emission with redshift. This signal is also traced by the filtered temperature measurements at 220 GHz (bottom-right); this channel is at the SZ null so signals here arise from astrophysical emission correlated with cluster locations.
10.1 Correlated Dust Emission in the SPT-3G Main Sample
While cluster environments at low redshift and/or high mass are typically dominated by quiescent galaxies, studies have found that the typical star formation rates of cluster members significantly increase at (see the recent review of 8, and references therein).
There are strong correlations between star formation and emission at mm-wavelengths, as the dust enshrouding young stars is heated by their UV and optical photons and re-emits this energy at longer wavelengths, peaking in the sub-mm/far IR (20).
For the purposes of SZ cluster selection, such correlated emission is a contaminant that can partially fill in the SZ decrement with a signal that, in the SPT bands, rises with frequency and is brightest in the 220 GHz band.
K26 conducted a detailed study of the impact of this bias on cluster identification with SPT.
Combining data from the SPT-3G Deep field (see description in Sec. 4.4) with sub-mm data from Herschel/SPIRE (78), K26 showed a factor of increase in the fractional dust contamination of cluster SZ signals over the redshift range of , reaching up to at 150 GHz ( at 95 GHz) in their highest redshift bin of ; the average correlated emission at 220 GHz was also found to be dominated by this signal.
K26 also demonstrated the ability of multi-frequency data—particularly through inclusion of the 220 GHz channel—to mitigate this bias, resulting in robust cluster samples using the minimum-variance approach we also adopt in this work.
Here we do not repeat the detailed exercise explored in that work, but rather briefly examine this contamination in the context of the greatly enhanced sample size () of the SPT-3G Main survey.
To characterize this bias we filter each of the individual frequency maps and various multi-frequency combinations with a filter scale of =1\arcmin (close to 0\farcm81, the mean of the confirmed clusters) and extract the profile amplitudes (Eq. 2) at the locations of cluster candidates from the multi-frequency catalog.
For 95 GHz, 150 GHz, and the two- and three-band combinations, we report the amplitudes in Compton- units (converted using the SPT effective band centers for a non-relativistic SZ spectrum, Sec. 3), but leave 220 GHz in temperature units as there is expected to be negligible SZ signal in this band.
We also record the robust standard deviation (91) in each of the filtered maps, as well as from differences between the filtered map combinations. The relative noise levels illustrate the relative strength of each frequency contribution (not accounting for correlated signals) to the overall SPT detections.
In Compton- units, the noise levels for the profile amplitudes on the =1\arcmin scale are listed in Table 4.
Frequency Combination
Noise Level(Compton- units)
95 GHz
150 GHz
150+220 GHz
95+150+220 GHz
Table 4: Filtered map noise levels in Compton- units for the =1\arcmin filter. In bold we highlight the noise for the three band combination used in cluster identification at this filter scale. The 95 GHz data alone have comparable weight to the combined 150+220 GHz data and only the noise of the full combination.
In Fig. 15 we plot recovered values from this filtering in three different redshift bins: (3370 systems), (2711 systems), and (702 systems). In the histograms of Compton- differences/temperature distributions we also over-plot Gaussian curves centered on the median signal in each bin with standard deviations measured as discussed above.
We first compare 95 GHz-extracted Compton- values to those from the full multi-frequency combination.
As in K26, we find good agreement between the two, with a small suppression of the 95 GHz-only signal in the highest redshift bin. The distribution, with a small number of outliers, is also extremely Gaussian, providing evidence that there is not a large population of clusters with strong unmodeled correlated signals in the sample relative to the noise levels probed in the SPT-3G dataset.
The largest outliers are from massive clusters; the 22 clusters at with absolute differences have a median detection significance of .
Some of these clusters are in close proximity to dusty star-forming galaxies (DSFGs), including the most negative (-) outlier: SPT/ACT-CL J0102.94915.6, (176, with the cluster previously identified as strongly lensing a DSFG in) and the most positive (): SPT-CL J2332.45358.5, (185; 10, reported as a lens in).
Such outliers are expected from lensing of DSFGs, which can boost or suppress the recovered SZ signal (87).
Moving to the bottom panels of Fig. 15, we plot the differences between the Compton- measured at 95 and 150 GHz as well as the 220 GHz temperature distribution at the location of clusters. We plot the 95-150 GHz difference to more clearly highlight differential contamination caused by sources with rising (e.g., dusty) spectral indices which will lead to positive residuals, and falling spectral indices which could lead to negative differences. As the SPT 220 GHz effective frequency is approximately at the SZ null, significant deviations from a null signal here trace (generally dusty) correlated emission from the clusters.
In these panels we can clearly see evidence of the dusty emission explored in K26; the single-temperature Compton- recovered at 95 GHz is systematically higher at high redshift than that of 150 GHz, and the distribution—while still largely Gaussian—shows a clear skew in the direction of higher contamination suppressing the 150 GHz flux [or Compton-] at high redshift.
This skewness is even more pronounced in the plot of the temperature distribution at 220 GHz in which signals from dust emission are significantly brighter.
In Table 5 we report both the median filtered 220 GHz emission as well as the skew, as traced by the Fisher-Pearson coefficient, for the SPT-3G sample in several redshift bins; we also plot the redshift evolution in Fig. 16.
The typical 220 GHz emission increases by greater than from our lowest () to highest ( bin, while the median filtered Compton- drops only by 3% between the redshifts.
Our highest- unconfirmed clusters also show similar behavior to the higher redshift bins, as would be expected for clusters beyond the redshift reach of our current optical/IR confirmation data.
The distribution in all bins has a small positive skew and is generally consistent across all bins (outside of the lowest- bin; excluding the large outlier SPT-CL J2332.4-5358.5, the skew in this bin drops to ).
Fisher-Pearson coefficients, in the range measured here between 0.38 and 0.65, generally indicate that the distributions are approximately symmetric with mild to moderate skewness.
We can estimate the median suppression of the 95 and 150 GHz SZ signals from correlated dusty emission by modeling it as a modified black body and scaling the 220 GHz emission to the lower frequencies.
We assume a dust temperature of 22 K and dust emissivity index (consistent with the results of K26, see Eq. 14 and Table 2 in that work).
We find that the Compton- recovery at 95 GHz is only mildly biased low (0-5% from low to high-).
Conversely, the single band estimates of Compton- from 150 GHz can be highly biased, with a median bias rising from 2%
for clusters to for clusters. Adopting wider bins, our results are consistent with K26,
with the larger sample size in this work enabling us to more finely trace the increase in dusty contamination with redshift.
While the redshift evolution of the correlated dusty emission is striking, it is important to reemphasize the findings of K26 that
the construction of the SPT-3G sample is robust to biases from this signal.
As discussed in Sec. 3, clusters are identified using a multi-band matched filtering process designed
to maximize sensitivity to SZ signal in the presence of noise.
While the process is not explicitly tailored to remove correlated dusty signals, at small scales (most relevant for high- cluster identification)
the CIB is a significant noise contribution in the SPT-3G maps at higher frequencies.
As the CIB has a similar spectral dependence to the dusty contaminant, and one that is spectrally distinct from the SZ signal in the SPT-3G bands,
the filter optimization naturally down-weights contributions from dust-like signals; the
220 GHz channel (at the SZ null) effectively acts as a high-fidelity dust tracer enabling clean mitigation of this bias.
Additionally, as discussed above, the 95 GHz data—the most important contributor to the combined detection
significance (i.e., Table 4 and similar at other filter scales)—is
only weakly impacted by this bias at the mass scales probed by the SPT-3G sample.
Figure 16: Redshift evolution of the median correlated 220 GHz emission at SPT-3G cluster locations; this emission increases by over an order of magnitude over the redshift range probed by the SPT sample (), while the median Compton- value in each bin is comparable. As above, the region is shaded to denote higher redshift uncertainties; the plotted redshifts in each bin are the median of the best fit values in the bin.
Redshift Bin
N
T̃220 (K)
Skew
1047
2.2
2.59
1546
3.4
0.65
1473
7.3
0.60
1209
11.2
0.53
806
15.2
0.44
353
22.4
0.49
190
28.2
0.08
159
38.4
0.65
unconfirmed
1702
13.4
0.61
unconfirmed
51
29.0
0.33
Table 5: Median temperature and skew at 220 GHz for the SPT-3G sample. This filtered signal at =1\arcmin primarily traces correlated dust emission from cluster members and the cluster environment. We note that, though the number of candidates is small, the median of our highest- (high purity) unconfirmed candidates is similar to values in our higher redshift bins, as would be expected for real clusters beyond the confirmation reach of current follow-up data.
10.1.1 Cluster-Correlated DSFGs
While Sec. 10.1 primarily focuses on overall population trends in correlated dusty emission,
some of this excess emission is detectable at modest-to-high SNR in individual systems.
Re-examining the above recovered Compton- values from 95 GHz and 150 GHz alone,
we find 159 candidates (1.8%) with differences pointing to dusty contamination and 35 with differences .
Of these 159 candidates, 116 were confirmed (38 with redshifts ) and 43 were
unconfirmed (6 of these with , i.e., at high SZ purity, and thus likely true very high- clusters).
The three largest outliers in the differences between Compton- measured at 95 and 150 GHz were
all previously flagged as cluster-scale lenses: SPT-CL J2332.45358.5 (17 outlier) and
SPT-CL J0102.94915.6 (7), discussed above, and SPT-CL J2240.06117.4, an 8 outlier flagged in 22.
DSFGs—either those lensed by the cluster (as in the case of SPT-CL J2332.4-5358.5),
members of the cluster themselves (109, e.g.,), or just chance line-of-sight field projections—can also be detected individually at
high significance in SPT-3G data and can lead to positive skew in the 220 GHz temperature distributions.
We next cross-match cluster detections with 220 GHz sources from a dedicated point source analysis of the SPT-3G data.
The SPT-3G source catalog was constructed using point-source-filtered versions of the same single-band maps as we use for the cluster analysis, resulting in point source detection thresholds of roughly 1, 1, and 5 mJy at 95, 150, and 220 GHz, respectively; here we focus on sources detected at 220 GHz at a SNR with a positive spectral index as measured between 150 and 220 GHz.
A total of 225 cluster candidates have such a source within 1\arcmin (compared to 63.5 expected from random associations, a 3.5 excess).
The SPT-3G source catalog is a mixture of both dusty and AGN sources.
As the presence of the cluster could bias internal source classification with SPT data alone, we leverage low frequency radio survey data to remove potential radio contaminants from our list.
The 1.4 GHz Rapid ASKAP Continuum Survey survey (59) has a high source density (over 135,000 sources in the SPT-3G Main field footprint), with a population dominated by steeply falling radio sources that will have little remaining signal at SPT’s frequencies (47).
Flat-spectrum AGN, however, can still have appreciable signal in SPT’s bands.
Using data from 887.5 MHz (82) and 1.4 GHz to provide a crude estimate of the spectral index, , we trim the initial ASKAP catalog by requiring sources to have a detection SNR at 1.4 GHz and an estimated 95 GHz flux (scaled from 1.4 GHz, flux ) in excess of 2 mJy.
We will refer to these ASKAP sources here and in later sections (esp. Sec. 10.2 where we test for contamination from these sources) as “flat-spectrum” radio sources.
Removing SZ candidates with such flat-spectrum sources within the matching radius from our 220 GHz matched list drops the matches to 218 SZ candidates (61 expected).
Reducing the matching radius to to further reduce random association probabilities, we find 72 observed (16 expected, a 4.5 excess) or 70 (15.2 expected) for candidates without nearby flat-spectrum sources, with 14 observed (3 expected) at .
The two different ways of checking for dusty outliers have high overlap but are not identical.
The Compton- difference test probes fluctuations at a slightly larger scale than the 220 GHz point source search and at lower frequencies. For the high () differences in single-band Compton-, 26/35 have 220 GHz sources within 1\arcmin, while 4 of the 9 remaining are at , with the optical/IR data for an additional unconfirmed candidate (1/9) providing evidence of a high- cluster, but not sufficient for confirmation here.
We flag both systems with dusty sources within in the cluster sample table as well as candidates with single band Compton- differences .
10.2 Correlated Radio Emission
Unlike the correlated dust emission from cluster members probed in Sec. 10.1, stringent internal constraints on radio contamination are a challenge for SZ-selected samples from arcminute-scale observations.
For these surveys, the modest resolution prevents angular isolation of correlated radio sources and the similarity of the spectral index of AGN and SZ signals in key signal bands (95 and 150 GHz) prevents clean spectral separation.
Low-frequency (1.4 GHz) radio surveys such as ASKAP (59) can provide high-fidelity catalogs of potential contaminant sources, but source variability and varying spectral indices and break frequencies (at which these indices steepen sharply) make it challenging to connect low-frequency observations to mm-wavelength observations.
The cleanest way to constrain this bias in SZ surveys would be to characterize cluster samples with similar properties (i.e., redshift-independent samples with a low-scatter mass proxy) with arc-second scale mm observations.
These cluster sample properties are, however, a unique result of SZ selection and so contamination studies are generally biased to lower redshift (39; 113; 81; 5, e.g., X-ray samples as in ) or use optical/IR samples (75; 74; 135) the latter of which can suffer from significant impurities owing to projection effects (76, e.g.,).
While these studies have generally found that above —the lowest redshift to which we quantify our sample completeness—the impact of very bright sources is expected to be small, much remains uncertain at high redshift where there is evidence at other wavelengths for significant increases in AGN activity in clusters (127; 8; 83, amongst many others).
The increased sensitivity of the new generation of SZ surveys to lower mass systems also increases the importance of characterizing the impact of lower-brightness radio sources.
In this work we briefly look for radio contamination in the SPT-3G cluster sample in two different ways.
First, we use data from low-frequency radio surveys and our own single frequency Compton- measurements to look for signs of biased Compton- measurements in clusters detected by SPT-3G.
Second, we re-examine the detection of eRASS1 clusters (29) in SPT-3G data looking for signs of clusters missed in the SPT-3G sample owing to radio sources.
10.2.1 Tests with 1.4 GHz Radio Surveys
For the tests in this subsection we focus on the ratio of Compton- measured at 95 GHz alone compared to 150 GHz.
A synchrotron source with a falling spectral index will more strongly impact 95 GHz, but the 150 GHz data may also be impacted, and so these ratios provide lower limits to the typical fractional contamination.
We first examine the measured Compton- properties of clusters with nearby () radio sources detected at SNR in 1.4 GHz ASKAP data (58).
We adopt this conservative matching radius in this test to capture the impacts of positive synchrotron emission on our Compton- measurements and avoid spurious SZ signal boosting from the sources’ filtering wings (Sec. 2.4).
There are 1,917 confirmed clusters (27% of all confirmed systems) with such nearby sources, and we find the median ratio of (95 GHz)/(150 GHz) is close to unity at , reflecting the expected steep fall off in flux at high frequencies (184; 110) of the majority of synchrotron sources in low-frequency radio surveys.
If we instead examine clusters with candidate ASKAP flat-spectrum sources (Sec. 10.1.1) within , we find 219 candidates (210 confirmed clusters, or 3% of the confirmed sample) with 23 clusters at .
The median ratio of Compton- measured at 95 GHz compared to 150 GHz in this subsample of clusters is reflecting on average bias from sources with falling spectral indices for these clusters.
We can further isolate potentially biased systems by placing harsher cuts on the radio spectral indices and expected fluxes at high frequencies.
If we restrict the cluster sample to those with sources with estimated fluxes mJy at 95 GHz, adopting an assumed spectral index (39, approximately the median spectral index of high-frequency radio sources found in clusters,), we find 98 confirmed clusters (1.3% of the sample with 25/98 at ) with a median Compton- ratio between 95 and 150 GHz of .
These results are broadly consistent with previous characterizations of SZ-selected clusters.
Scaling low-frequency data from NVSS (41) and SUMSS (119) to SPT bands using the results of 39, 21; 22 estimated that the SZ signals were reduced % (%) by radio contamination for % (2%) of SPTpol clusters.
50; 51 used high-resolution (9\arcsec) imaging at 90 GHz from the MUSTANG 2 (49) camera on the Green Bank Telescope to characterize the high-frequency radio source population in ACT-selected clusters.
In 51, the authors observed 243 ACT DR5 clusters, finding 24 sources (in 22 clusters fields) brighter than 1 mJy within 4\arcmin of the cluster centers.
A source at this threshold could reduce the recovered SZ signal for a typical ACT cluster by 12%.
Owing to filtering of the ACT data (much like the filtering wings discussed in Sec. 2.4) these sources can both suppress (within 1\arcmin) or boost () the recovered SZ flux.
In total, 6/243 clusters (2.5%) had a source within 1\arcmin; this more direct measurement at 90 GHz indicates slightly lower contamination than estimated from low-frequency data with the SPTpol sample but is consistent within uncertainties given the sample sizes.
10.2.2 Radio Sources in eROSITA Clusters
eRASS1-SPT-CL
eRASS1-No SPT-CL
N
285
35
mm-wave source
8 (3%)
3 (8.5%)
Flat Spec. ASKAP
45 (16%)
14 (40%)
Steep Spec. ASKAP
15 (5%)
2 (5%)
9 (3%)
14 (40%)
Table 6: Summary statistics for X-ray clusters with positive masses from the eRASS1 cosmology sample at . We divide the sample into X-ray clusters with/without an SPT-3G counterpart. We list the number and fraction of clusters matching to sources within 2\arcmin from (1) an SPT-selected mm-wave sample brighter than 2 mJy at 95 GHz, (2) low-frequency radio sources from ASKAP with extrapolated 95 GHz fluxes mJy based on spectral indices measured in ASKAP data, and (3) low-frequency radio sources from ASKAP with projected 95 GHz fluxes mJy but now adopting a spectral index of which is more typical for low-frequency cluster radio sources also detected at higher frequencies (39). As X-ray AGN can bias the eRASS1 selection, we also provide the number and fraction of X-ray clusters with estimated higher AGN contamination (here ).
We next consider the correlation of radio sources with the recovery of eROSITA clusters by SPT-3G.
We focus on the higher purity eRASS1 cosmology catalog to reduce ambiguities between SPT-3G incompleteness and spurious X-ray detections.
As discussed in Sec. 8.3, SPT matches 93% of the eRASS1 clusters with at —roughly consistent with our expectations for the SPT-3G sample completeness—so a strong signal is not expected in this test.
We match the eRASS1 cosmology sample at and with positive X-ray masses with 2 different radio source catalogs: (1) mm-wave bright sources ( mJy at 95 GHz, but note this may also include a small number of the brightest DSFGs) from a dedicated source analysis of the SPT-3G maps and, as the mm-wave source selection may itself be impacted by SZ decrements from clusters, (2) the “flat-spectrum” ASKAP subsample (59) we introduced in Sec. 10.1.1.
We use a 2\arcmin matching radius for sources and keep our original 3\arcmin matching radius for matching between clusters.
In Table 6 we provide a summary table of our matching results.
With the above mass and redshift cuts on the eRASS1 sample, we have 285 eRASS1 clusters matched to an SPT-3G counterpart and 35 eRASS1 clusters without a counterpart.
Bright mm-wave sources were found nearby 8/285 (3%) of eRASS1 clusters with SZ counterparts and 3/35 (8.5%) of eRASS1 clusters without.
We find 45/285 (16%) of the SZ matched sample and 14/35 (40%) of the unmatched sample have a flat-spectrum ASKAP counterpart.
We highlight these matches in Fig. 13.
Over-plotted in orange squares are ASKAP matches and in blue diamonds are the SPT emissive source matches.
An identical fraction (14/35, 40%) of the unmatched sample are flagged as having potentially higher X-ray AGN contamination () in the unmatched eRASS1 sample; focusing solely on more secure eRASS1 systems, 11/21 eRASS1 clusters without SZ counterparts (52% with ) have nearby radio sources.
From this figure we can clearly see that for the X-ray systems not matched by SPT-3G, (1) the majority are at lower X-ray masses, (2) there are higher association rates with low-frequency radio sources than for the full sample, but also, (3) on the X-ray side, higher fractions of systems with potentially spurious AGN contamination for which we would not expect an SZ association.
From Fig. 13 we can also see that a number of the outliers in the eROSITA mass-SPT observable relation have nearby radio sources, but many clusters with similar sources fall cleanly within the typical scatter for the scaling between the two.
Our scaling of radio source power from low frequencies using ASKAP measured spectral indices is a simplistic extrapolation and the contamination is highly sensitive to the spectral index model adopted (50, e.g.,); if we instead adopt a typical spectral index of -0.7 found from an analysis of 1.4 and 30 GHz data in X-ray selected clusters (39), we find that 5% of both the SZ matched and unmatched sample have ASKAP counterparts.
This second cut with ASKAP also had a more significant impact in the internal frequency tests we conducted in Sec. 10.2.1.
The above analysis was conducted for clusters in unmasked regions in the SPT-3G footprint, now we consider clusters in the eRASS1 cosmology sample falling in regions masked in SPT-3G data owing to bright mm-wave emissive sources.
As discussed in Sec. 3, to reduce spurious detections we mask the SPT maps at the locations of bright radio sources; preferential correlation of the brightest mm-wave sources with clusters could lead to additional missed clusters over what might be expected from the lost area.
We expect this effect to be too small to be well constrained by the eRASS1 sample (21, see e.g., discussion in Sec. 3.6 in) but report statistics for completeness here.
We find 9 clusters at , 8/9 at (the one remainder, 1eRASS J013954.2-435507, at ).
Of these, 5/9 have SPT sources offset from the eRASS1 cluster (so likely unassociated), 3 (1eRASS J000557.9-562841, 1eRASS J013954.2-435507, 1eRASS J231306.7-550417) have mm- and ASKAP-bright sources within of the eRASS1 cluster, and one is an ambiguous case (1eRASS J205208.7-691105) with a 4 mJy SPT source—but no low frequency ASKAP flat-spectrum detection— away; this test suggests a small number of clusters missed at owing to very bright sources.
If we remove the redshift restriction, the number of missed clusters increases to 17 in the masked footprint.
Overall, our various explorations of the radio contamination of the SPT-3G sample—both with internal frequency checks (Sec. 10.2.1) and through cross-matching with the eRASS1 catalog—have shown that only a few percent of the SZ and X-ray samples have SZ signal strongly impacted by radio sources.
This result is consistent with the previous works discussed above (Sec. 10.2) but questions remain both at lower mass where the majority of the unmatched eRASS1 clusters reside and for higher-redshift clusters beyond the reach of the current eROSITA sample.
A more detailed exploration of radio source contamination for the SPT-3G sample will be reported in an upcoming work.
11 Conclusion and Future Outlook
In this paper we introduced a new cluster sample from an analysis of five years of observations of the SPT-3G Main field.
Here we summarize our main results and highlight several planned future studies with this sample.
•
We have identified 8,892 cluster candidates detected above in 1,604.8 deg2 of sky mapped at 95, 150, and 220 GHz. Using optical (primarily from DES) and infrared (WISE, Spitzer, and Magellan/FourStar) observations, we confirmed 7,190 of these candidates as clusters, with an expected confirmed sample purity exceeding 96%. The clusters span in redshift and in mass. The median redshift of the sample is and 25% of the sample is at ( at ). The mass-completeness threshold decreases with redshift; at redshift (the lowest redshift for which filtering is not expected to strongly impact the SZ selection), the sample is expected to be complete for masses .
•
We estimate the masses of the SZ clusters using scaling relations estimated by abundance-matching to our fiducial CDM cosmological model. In this work we introduce an optical-richness-SZ scaling relation comparison to test our SZ candidate-counterpart assignments, finding a small (five) number of clusters for which foreground low- systems were mistakenly assigned to higher-redshift clusters.
•
We flag 195 SPT clusters as strong gravitational lenses based on either visual evidence of strong lensing in optical survey data, or prior follow-up observations of a small number of bright DSFGs in close proximity to SPT cluster centers.
•
Comparisons with previous generations of SZ surveys from ACT and SPT in the Main field footprint show good agreement in SZ (mass, centroid) properties, with the SPT-3G sample detection significance typically 2-4 higher for clusters in common.
•
We perform several cross checks with clusters and point sources from eROSITA. In the SPT-3G cluster analysis footprint we cross-match 62% of the eRASS1 cluster sample from 29, rising to 87% for the subset in the eRASS1 cosmology sample at .
Examining in more detail this subset of 320 clusters (35 unmatched), we find 40% (14/35) of the unmatched X-ray clusters have potentially flat-spectrum low-frequency radio sources nearby that could bias the SZ selection, but also 40% of these clusters had higher likelihoods of X-ray AGN contamination (potentially biasing the X-ray selection).
•
We also compare to three representative optical/IR wide-field cluster catalogs in the SPT-3G footprint: the red-sequence-based DES redMaPPer year 3 sample (3) and the optical/IR-photo--based cluster samples of 191 and MadCOWS2 (182). While historically SZ catalogs have probed the high-richness end of optical/IR samples, the depth and redshift reach of the SPT-3G main sample (combined with scatter in the optical richness-to-mass relation) results in a more mixed view here, with the optical sample completeness for SPT-3G clusters ranging from . In general we find good agreement between MCMF redshifts and those from the external catalogs, with varying levels of scatter between the SZ mass and optical richness proxy.
•
Finally, internal data splits using subsets of the SPT-3G bands show a increase from redshifts 0.25 to 1.6 in the correlated 220 GHz emission at SPT cluster locations, but limited signs of correlated AGN contamination.
A detailed study on a smaller set of clusters in 108 showed that the three band SPT-3G selection is robust to the correlated dusty emission at the mass and redshift ranges probed by SPT-3G; the multi-band checks here support this conclusion.
Looking forward, work is underway to obtain cosmological constraints from this new cluster sample, both from internal mass calibration with SPT-3G data via CMB cluster lensing (153, e.g.,) and cluster clustering (112; 43; 198, e.g.,), and with optical weak lensing from DES (196) and from the Euclid mission (61).
This Main field release is the first wide-field release from SPT-3G, but the SPT-3G camera has been used to observe an additional deg2 of the southern sky (149; 188, for a total of deg2,). Cluster catalogs from these data, the Simons Observatory (169), as well as future catalogs from the planned SPT-3G+ instrument—which will reach depths of 0.7 -arcmin at 95 and 150 GHz, our most constraining SZ science bands—will continue to expand the capabilities of SZ cluster science.
\facilities
Blanco (DECAM), Hubble Space Telescope (WFC3), Magellan:Baade (FourStar), Magellan:Clay (PISCO), NSF/US Department of Energy 10m South Pole Telescope (SPT-3G), Spitzer (IRAC)
Acknowledgments
The South Pole Telescope program is supported by the National Science Foundation (NSF) through awards OPP-1852617 and OPP-2332483. Partial support is also provided by the Kavli Institute of Cosmological Physics at the University of Chicago.
Argonne National Laboratory’s work was supported by the U.S. Department of Energy, Office of High Energy Physics, under contract DE-AC02-06CH11357.
The UC Davis group acknowledges support from Michael and Ester Vaida.
Work at the Fermi National Accelerator Laboratory (Fermilab), a U.S. Department of Energy, Office of Science, Office of High Energy Physics HEP User Facility, is managed by Fermi Forward Discovery Group, LLC, acting under Contract No. 89243024CSC000002.
The Melbourne authors acknowledge support from the Australian Research Council’s Discovery Project scheme (No. DP260100705).
The Paris group has received funding from the European Research Council (ERC) under the European Union’s Horizon 2020 research and innovation program (grant agreement No 101001897), and funding from the Centre National d’Etudes Spatiales.
The SLAC group is supported in part by the Department of Energy at SLAC National Accelerator Laboratory, under contract DE-AC02-76SF00515.
The Innsbruck authors acknowledge support provided by the Austrian Research Promotion Agency (FFG) and the Federal Ministry of the
Republic of Austria for Innovation, Mobility, and Infrastructure (BMIMI) via the Austrian Space Applications Program with grant numbers 899537, 900565, 911971, and 928759, as well as the Austrian Science Fund (FWF) via project 10.55776/F101300.
This work is based in
part on observations made with the Spitzer Space Telescope (PIDs 60099, 70053, 80012 and 10101; PI Brodwin), (PIDs 11096, 12073, 14096; PI Bleem) which was operated by the Jet Propulsion Laboratory, California Institute of Technology under a contract with NASA.
This research is based on observations made with the NASA/ESA Hubble Space Telescope obtained from the Space Telescope Science Institute, which is operated by the Association of Universities for Research in Astronomy, Inc., under NASA contract NAS 5-26555. These observations are associated with GO programs 12246, 12477, 13412, 14252, 14677, 15307, and 16017.
This paper also uses data obtained with the 6.5-m Magellan Telescopes located at Las Campanas Observatory, Chile. Magellan observing time for this project was granted by the time allocation committees of the University of Chicago and the Center for Astrophysics at Harvard/Smithsonian. We would also like to express our gratitude to the staff of Las Campanas Observatory in Chile whose support was instrumental in facilitating data collection.
This work utilized data and resources provided by the Strong Lensing Database (SLED).
This research has made use of the VizieR catalogue access tool, CDS, Strasbourg Astronomical Observatory, France (DOI : 10.26093/cds/vizier). Some results in this work were obtained using services provided by the OSG Consortium (147; 166; 136; 137). which is supported by the National Science Foundation awards #2030508 and #2323298.
Funding for the DES Projects has been provided by the U.S. Department of Energy, the U.S. National Science Foundation, the Ministry of Science and Education of Spain,
the Science and Technology Facilities Council of the United Kingdom, the Higher Education Funding Council for England, the National Center for Supercomputing
Applications at the University of Illinois at Urbana-Champaign, the Kavli Institute of Cosmological Physics at the University of Chicago,
the Center for Cosmology and Astro-Particle Physics at the Ohio State University,
the Mitchell Institute for Fundamental Physics and Astronomy at Texas A&M University, Financiadora de Estudos e Projetos,
Fundação Carlos Chagas Filho de Amparo à Pesquisa do Estado do Rio de Janeiro, Conselho Nacional de Desenvolvimento Científico e Tecnológico and
the Ministério da Ciência, Tecnologia e Inovação, the Deutsche Forschungsgemeinschaft and the Collaborating Institutions in the Dark Energy Survey.
The Collaborating Institutions are Argonne National Laboratory, the University of California at Santa Cruz, the University of Cambridge, Centro de Investigaciones Energéticas,
Medioambientales y Tecnológicas-Madrid, the University of Chicago, University College London, the DES-Brazil Consortium, the University of Edinburgh,
the Eidgenössische Technische Hochschule (ETH) Zürich,
Fermi National Accelerator Laboratory, the University of Illinois at Urbana-Champaign, the Institut de Ciències de l’Espai (IEEC/CSIC),
the Institut de Física d’Altes Energies, Lawrence Berkeley National Laboratory, the Ludwig-Maximilians Universität München and the associated Excellence Cluster Universe,
the University of Michigan, NSF NOIRLab, the University of Nottingham, The Ohio State University, the University of Pennsylvania, the University of Portsmouth,
SLAC National Accelerator Laboratory, Stanford University, the University of Sussex, Texas A&M University, and the OzDES Membership Consortium.
Based in part on observations at NSF Cerro Tololo Inter-American Observatory at NSF NOIRLab (NOIRLab Prop. ID 2012B-0001; PI: J. Frieman), which is managed by the Association of Universities for Research in Astronomy (AURA) under a cooperative agreement with the National Science Foundation.
The DES data management system is supported by the National Science Foundation under Grant Numbers AST-1138766 and AST-1536171.
Data access is enabled by Jetstream2 and OSN at Indiana University through allocation PHY240006: Dark Energy Survey from the Advanced Cyberinfrastructure Coordination Ecosystem: Services and Support (ACCESS) program, which is supported by U.S. National Science Foundation grants 2138259, 2138286, 2138307, 2137603, and 2138296.
The DES participants from Spanish institutions are partially supported by MICINN under grants PID2021-123012, PID2021-128989 PID2022-141079, SEV-2016-0588, CEX2020-001058-M and CEX2020-001007-S, some of which include ERDF funds from the European Union. IFAE is partially funded by the CERCA program of the Generalitat de Catalunya.
We acknowledge support from the Brazilian Instituto Nacional de Ciência
e Tecnologia (INCT) do e-Universo (CNPq grant 465376/2014-2).
This document was prepared by the DES Collaboration using the resources of the Fermi National Accelerator Laboratory (Fermilab), a U.S. Department of Energy, Office of Science, Office of High Energy Physics HEP User Facility. Fermilab is managed by Fermi Forward Discovery Group, LLC, acting under Contract No. 89243024CSC000002.
We thank Zoe, the SPT support cat for this analysis. Inquiries about SPT support cats shall be
directed to T.C.
References
Abbott et al. (2021)T. M. C. Abbott, M. Adamów, M. Aguena, S. Allam, A. Amon, J. Annis, S. Avila, D. Bacon, M. Banerji, K. Bechtol, M. R. Becker, G. M. Bernstein, E. Bertin, S. Bhargava, S. L. Bridle, D. Brooks, D. L. Burke, A. Carnero Rosell, M. Carrasco Kind, J. Carretero, F. J. Castander, R. Cawthon, C. Chang, A. Choi, C. Conselice, M. Costanzi, M. Crocce, L. N. da Costa, T. M. Davis, J. De Vicente, J. DeRose, S. Desai, H. T. Diehl, J. P. Dietrich, A. Drlica-Wagner, K. Eckert, J. Elvin-Poole, S. Everett, A. E. Evrard, I. Ferrero, A. Ferté, B. Flaugher, P. Fosalba, D. Friedel, J. Frieman, J. García-Bellido, E. Gaztanaga, L. Gelman, D. W. Gerdes, T. Giannantonio, M. S. S. Gill, D. Gruen, R. A. Gruendl, J. Gschwend, G. Gutierrez, W. G. Hartley, S. R. Hinton, D. L. Hollowood, K. Honscheid, D. Huterer, D. J. James, T. Jeltema, M. D. Johnson, S. Kent, R. Kron, K. Kuehn, N. Kuropatkin, O. Lahav, T. S. Li, C. Lidman, H. Lin, N. MacCrann, M. A. G. Maia, T. A. Manning, J. D. Maloney, M. March, J. L. Marshall, P. Martini, P. Melchior, F. Menanteau, R. Miquel, R. Morgan, J. Myles, E. Neilsen, R. L. C. Ogando, A. Palmese, F. Paz-Chinchón, D. Petravick, A. Pieres, A. A. Plazas, C. Pond, M. Rodriguez-Monroy, A. K. Romer, A. Roodman, E. S. Rykoff, M. Sako, E. Sanchez, B. Santiago, V. Scarpine, S. Serrano, I. Sevilla-Noarbe, J. A. Smith, M. Smith, M. Soares-Santos, E. Suchyta, M. E. C. Swanson, G. Tarle, D. Thomas, C. To, P. E. Tremblay, M. A. Troxel, D. L. Tucker, D. J. Turner, T. N. Varga, A. R. Walker, R. H. Wechsler, J. Weller, W. Wester, R. D. Wilkinson, B. Yanny, Y. Zhang, R. Nikutta, M. Fitzpatrick, A. Jacques, A. Scott, K. Olsen, L. Huang, D. Herrera, S. Juneau, D. Nidever, B. A. Weaver, C. Adean, V. Correia, M. de Freitas, F. N. Freitas, C. Singulani, G. Vila-Verde, and Linea Science ServerThe Dark Energy Survey Data Release 2.
ApJS255 (2), pp. 20.
External Links: Document,
2101.05765Cited by: §2,
§4.
Abbott et al. (2022)T. M. C. Abbott, M. Aguena, A. Alarcon, S. Allam, O. Alves, A. Amon, F. Andrade-Oliveira, J. Annis, S. Avila, D. Bacon, E. Baxter, K. Bechtol, M. R. Becker, G. M. Bernstein, S. Bhargava, S. Birrer, J. Blazek, A. Brandao-Souza, S. L. Bridle, D. Brooks, E. Buckley-Geer, D. L. Burke, H. Camacho, A. Campos, A. Carnero Rosell, M. Carrasco Kind, J. Carretero, F. J. Castander, R. Cawthon, C. Chang, A. Chen, R. Chen, A. Choi, C. Conselice, J. Cordero, M. Costanzi, M. Crocce, L. N. da Costa, M. E. da Silva Pereira, C. Davis, T. M. Davis, J. De Vicente, J. DeRose, S. Desai, E. Di Valentino, H. T. Diehl, J. P. Dietrich, S. Dodelson, P. Doel, C. Doux, A. Drlica-Wagner, K. Eckert, T. F. Eifler, F. Elsner, J. Elvin-Poole, S. Everett, A. E. Evrard, X. Fang, A. Farahi, E. Fernandez, I. Ferrero, A. Ferté, P. Fosalba, O. Friedrich, J. Frieman, J. García-Bellido, M. Gatti, E. Gaztanaga, D. W. Gerdes, T. Giannantonio, G. Giannini, D. Gruen, R. A. Gruendl, J. Gschwend, G. Gutierrez, I. Harrison, W. G. Hartley, K. Herner, S. R. Hinton, D. L. Hollowood, K. Honscheid, B. Hoyle, E. M. Huff, D. Huterer, B. Jain, D. J. James, M. Jarvis, N. Jeffrey, T. Jeltema, A. Kovacs, E. Krause, R. Kron, K. Kuehn, N. Kuropatkin, O. Lahav, P. -F. Leget, P. Lemos, A. R. Liddle, C. Lidman, M. Lima, H. Lin, N. MacCrann, M. A. G. Maia, J. L. Marshall, P. Martini, J. McCullough, P. Melchior, J. Mena-Fernández, F. Menanteau, R. Miquel, J. J. Mohr, R. Morgan, J. Muir, J. Myles, S. Nadathur, A. Navarro-Alsina, R. C. Nichol, R. L. C. Ogando, Y. Omori, A. Palmese, S. Pandey, Y. Park, F. Paz-Chinchón, D. Petravick, A. Pieres, A. A. Plazas Malagón, A. Porredon, J. Prat, M. Raveri, M. Rodriguez-Monroy, R. P. Rollins, A. K. Romer, A. Roodman, R. Rosenfeld, A. J. Ross, E. S. Rykoff, S. Samuroff, C. Sánchez, E. Sanchez, J. Sanchez, D. Sanchez Cid, V. Scarpine, M. Schubnell, D. Scolnic, L. F. Secco, S. Serrano, I. Sevilla-Noarbe, E. Sheldon, T. Shin, M. Smith, M. Soares-Santos, E. Suchyta, M. E. C. Swanson, M. Tabbutt, G. Tarle, D. Thomas, C. To, A. Troja, M. A. Troxel, D. L. Tucker, I. Tutusaus, T. N. Varga, A. R. Walker, N. Weaverdyck, R. Wechsler, J. Weller, B. Yanny, B. Yin, Y. Zhang, J. Zuntz, and DES CollaborationDark Energy Survey Year 3 results: Cosmological constraints from galaxy clustering and weak lensing.
Phys. Rev. D105 (2), pp. 023520.
External Links: Document,
2105.13549Cited by: §1,
§1.
Abbott et al. (2025)T. M. C. Abbott, M. Aguena, A. Alarcon, A. Amon, D. Anbajagane, F. Andrade-Oliveira, S. Avila, S. S. Allam, D. Bacon, M. R. Becker, S. Bhargava, J. Blazek, S. Bocquet, D. Brooks, A. C. Rosell, J. Carretero, F. J. Castander, C. Chang, A. Choi, C. Conselice, M. Costanzi, M. Crocce, L. N. da Costa, M. E. S. Pereira, C. Doux, T. M. Davis, S. Desai, H. T. Diehl, S. Dodelson, P. Doel, J. Elvin-Poole, J. Esteves, S. Everett, A. Farahi, A. Ferté, B. Flaugher, J. García-Bellido, M. Gatti, G. Giannini, P. Giles, S. Grandis, D. Gruen, R. A. Gruendl, G. Gutierrez, I. Harrison, S. R. Hinton, D. L. Hollowood, K. Honscheid, N. Jeffrey, T. Jeltema, E. Krause, O. Lahav, S. Lee, C. Lidman, M. Lima, H. Lin, J. J. Mohr, J. L. Marshall, J. McCullough, J. Mena-Fern’andez, R. Miquel, J. Muir, J. Myles, R. L. C. Ogando, A. Palmese, M. Paterno, A. A. P. Malagón, A. Porredon, J. Prat, A. K. Romer, A. Roodman, E. Rozo, E. S. Rykoff, R. Rosenfeld, E. Sanchez, D. S. Cid, I. Sevilla-Noarbe, M. Smith, E. Suchyta, T. Shin, G. Tarle, D. Thomas, C. To, M. A. Troxel, V. Vikram, A. R. Walker, D. H. Weinberg, N. Weaverdyck, R. H. Wechsler, J. Weller, H.-Y. Wu, M. Yamamoto, B. Yanny, Y. Zhang, C. Zhou, and DES CollaborationDark energy survey year 3 results: Cosmological constraints from cluster abundances, weak lensing, and galaxy clustering.
Phys. Rev. D112 (8), pp. 083535.
External Links: Document,
2503.13632Cited by: 8th item,
§1,
6th item,
§9.2,
§9.2,
§9.
Abdul Karim et al. (2025)M. Abdul Karim, J. Aguilar, S. Ahlen, S. Alam, L. Allen, C. Allende Prieto, O. Alves, A. Anand, U. Andrade, E. Armengaud, A. Aviles, S. Bailey, C. Baltay, P. Bansal, A. Bault, J. Behera, S. BenZvi, D. Bianchi, C. Blake, S. Brieden, A. Brodzeller, D. Brooks, E. Buckley-Geer, E. Burtin, R. Calderon, R. Canning, A. C. Rosell, P. Carrilho, L. Casas, F. J. Castander, M. Charles, E. Chaussidon, J. Chaves-Montero, D. Chebat, X. Chen, T. Claybaugh, S. Cole, A. P. Cooper, A. Cuceu, K. S. Dawson, A. de la Macorra, A. de Mattia, N. Deiosso, J. Della Costa, R. Demina, A. Dey, B. Dey, Z. Ding, P. Doel, J. Edelstein, D. J. Eisenstein, W. Elbers, P. Fagrelius, K. Fanning, E. Fernández-García, S. Ferraro, A. Font-Ribera, J. E. Forero-Romero, C. S. Frenk, C. Garcia-Quintero, L. H. Garrison, E. Gaztañaga, H. Gil-Marín, S. Gontcho A Gontcho, D. Gonzalez, A. X. Gonzalez-Morales, C. Gordon, D. Green, G. Gutierrez, J. Guy, B. Hadzhiyska, C. Hahn, S. He, M. Herbold, H. K. Herrera-Alcantar, M.-F. Ho, K. Honscheid, C. Howlett, D. Huterer, M. Ishak, S. Juneau, N. V. Kamble, N. G. Karaçaylı, R. Kehoe, S. Kent, A. G. Kim, D. Kirkby, T. Kisner, S. E. Koposov, A. Kremin, A. Krolewski, O. Lahav, C. Lamman, M. Landriau, D. Lang, J. Lasker, J. M. Le Goff, L. Le Guillou, A. Leauthaud, M. E. Levi, Q. Li, T. S. Li, K. Lodha, M. Lokken, F. Lozano-Rodríguez, C. Magneville, M. Manera, P. Martini, W. L. Matthewson, A. Meisner, J. Mena-Fernández, A. Menegas, T. Mergulhão, R. Miquel, J. Moustakas, A. Muñoz-Gutiérrez, D. Muñoz-Santos, A. D. Myers, S. Nadathur, K. Naidoo, L. Napolitano, J. A. Newman, G. Niz, H. E. Noriega, E. Paillas, N. Palanque-Delabrouille, J. Pan, J. A. Peacock, M. Pellejero Ibanez, W. J. Percival, A. Pérez-Fernández, I. Pérez-Ràfols, M. M. Pieri, C. Poppett, F. Prada, D. Rabinowitz, A. Raichoor, C. Ramírez-Pérez, M. Rashkovetskyi, C. Ravoux, J. Rich, A. Rocher, C. Rockosi, J. Rohlf, J. O. Román-Herrera, A. J. Ross, G. Rossi, R. Ruggeri, V. Ruhlmann-Kleider, L. Samushia, E. Sanchez, N. Sanders, D. Schlegel, M. Schubnell, H. Seo, A. Shafieloo, R. Sharples, J. Silber, F. Sinigaglia, D. Sprayberry, T. Tan, G. Tarlé, P. Taylor, W. Turner, L. A. Ureña-López, R. Vaisakh, F. Valdes, G. Valogiannis, M. Vargas-Magaña, L. Verde, M. Walther, B. A. Weaver, D. H. Weinberg, M. White, M. Wolfson, C. Yèche, J. Yu, E. A. Zaborowski, P. Zarrouk, Z. Zhai, H. Zhang, C. Zhao, G. B. Zhao, R. Zhou, H. Zou, and DESI CollaborationDESI DR2 results. II. Measurements of baryon acoustic oscillations and cosmological constraints.
Phys. Rev. D112 (8), pp. 083515.
External Links: Document,
2503.14738Cited by: §1,
§1,
§1.
ACTDESHSC Collaboration et al. (2026)ACTDESHSC Collaboration, M. Aguena, S. Aiola, S. Allam, F. Andrade-Oliveira, D. Bacon, N. Bahcall, N. Battaglia, E. S. Battistelli, S. Bocquet, B. Bolliet, J. R. Bond, D. Brooks, E. Calabrese, J. Carretero, S. K. Choi, L. N. da Costa, M. Costanzi, W. Coulton, T. M. Davis, S. Desai, M. J. Devlin, S. Dicker, P. Doel, A. J. Duivenvoorden, J. Dunkley, S. Ferraro, B. Flaugher, J. Frieman, P. A. Gallardo, M. Gatti, E. Gaztanaga, A. S. Gill, J. E. Golec, D. Gruen, R. A. Gruendl, M. Halpern, M. Hasselfield, J. C. Hill, M. Hilton, A. D. Hincks, S. R. Hinton, D. L. Hollowood, K. Honscheid, J. Hubmayr, K. M. Huffenberger, J. P. Hughes, D. J. James, M. Klein, K. Knowles, B. J. Koopman, A. Kosowsky, O. Lahav, E. Lee, Y. Lin, M. Lokken, M. S. Madhavacheril, A. A. P. Malagón, J. v. Marrewijk, J. L. Marshall, J. McMahon, J. Mena-Fernández, R. Miquel, H. Miyatake, J. J. Mohr, K. Moodley, T. Mroczkowski, S. Naess, F. Nati, A. Nicola, M. D. Niemack, R. L. C. Ogando, M. Oguri, J. Orlowski-Scherer, L. A. Page, B. Partridge, M. E. da Silva Pereira, A. Porredon, F. J. Qu, D. C. Ragavan, B. R. Guachalla, A. K. Romer, A. C. Rosell, E. S. Rykoff, S. Samuroff, E. Sanchez, I. Sevilla-Noarbe, C. Sierra, C. Sifón, M. Smith, S. T. Staggs, E. Suchyta, M. E. C. Swanson, D. L. Tucker, C. Vargas, E. M. Vavagiakis, J. De Vicente, N. Weaverdyck, J. Weller, E. J. Wollack, and I. ZubeldiaThe Atacama Cosmology Telescope: DR6 Sunyaev-Zel’dovich Selected Galaxy Clusters Catalog.
The Open Journal of Astrophysics9, pp. 55863.
External Links: Document,
2507.21459Cited by: §1,
§10.2,
Figure 11,
§6,
§8.2,
Table 2.
Ade et al. (2021)P. A. R. Ade, Z. Ahmed, M. Amiri, D. Barkats, R. B. Thakur, C. A. Bischoff, D. Beck, J. J. Bock, H. Boenish, E. Bullock, V. Buza, J. R. Cheshire, J. Connors, J. Cornelison, M. Crumrine, A. Cukierman, E. V. Denison, M. Dierickx, L. Duband, M. Eiben, S. Fatigoni, J. P. Filippini, S. Fliescher, N. Goeckner-Wald, D. C. Goldfinger, J. Grayson, P. Grimes, G. Hall, G. Halal, M. Halpern, E. Hand, S. Harrison, S. Henderson, S. R. Hildebrandt, G. C. Hilton, J. Hubmayr, H. Hui, K. D. Irwin, J. Kang, K. S. Karkare, E. Karpel, S. Kefeli, S. A. Kernasovskiy, J. M. Kovac, C. L. Kuo, K. Lau, E. M. Leitch, A. Lennox, K. G. Megerian, L. Minutolo, L. Moncelsi, Y. Nakato, T. Namikawa, H. T. Nguyen, R. O’Brient, R. W. Ogburn, S. Palladino, T. Prouve, C. Pryke, B. Racine, C. D. Reintsema, S. Richter, A. Schillaci, R. Schwarz, B. L. Schmitt, C. D. Sheehy, A. Soliman, T. St. Germaine, B. Steinbach, R. V. Sudiwala, G. P. Teply, K. L. Thompson, J. E. Tolan, C. Tucker, A. D. Turner, C. Umiltà, C. Vergès, A. G. Vieregg, A. Wandui, A. C. Weber, D. V. Wiebe, J. Willmert, C. L. Wong, W. L. K. Wu, H. Yang, K. W. Yoon, E. Young, C. Yu, L. Zeng, C. Zhang, S. Zhang, and Bicep/Keck CollaborationImproved Constraints on Primordial Gravitational Waves using Planck, WMAP, and BICEP/Keck Observations through the 2018 Observing Season.
Phys. Rev. Lett.127 (15), pp. 151301.
External Links: Document,
2110.00483Cited by: §1.
Aghanim et al. (2020)N. Aghanim, Y. Akrami, M. Ashdown, J. Aumont, C. Baccigalupi, M. Ballardini, A. J. Banday, R. B. Barreiro, N. Bartolo, S. Basak, K. Benabed, J.-P. Bernard, M. Bersanelli, P. Bielewicz, J. J. Bock, J. R. Bond, J. Borrill, F. R. Bouchet, F. Boulanger, M. Bucher, C. Burigana, R. C. Butler, E. Calabrese, J.-F. Cardoso, J. Carron, B. Casaponsa, A. Challinor, H. C. Chiang, L. P. L. Colombo, C. Combet, B. P. Crill, F. Cuttaia, P. de Bernardis, A. de Rosa, G. de Zotti, J. Delabrouille, J.-M. Delouis, E. Di Valentino, J. M. Diego, O. Doré, M. Douspis, A. Ducout, X. Dupac, S. Dusini, G. Efstathiou, F. Elsner, T. A. Enßlin, H. K. Eriksen, Y. Fantaye, R. Fernandez-Cobos, F. Finelli, M. Frailis, A. A. Fraisse, E. Franceschi, A. Frolov, S. Galeotta, S. Galli, K. Ganga, R. T. Génova-Santos, M. Gerbino, T. Ghosh, Y. Giraud-Héraud, J. González-Nuevo, K. M. Górski, S. Gratton, A. Gruppuso, J. E. Gudmundsson, J. Hamann, W. Handley, F. K. Hansen, D. Herranz, E. Hivon, Z. Huang, A. H. Jaffe, W. C. Jones, E. Keihänen, R. Keskitalo, K. Kiiveri, J. Kim, T. S. Kisner, N. Krachmalnicoff, M. Kunz, H. Kurki-Suonio, G. Lagache, J.-M. Lamarre, A. Lasenby, M. Lattanzi, C. R. Lawrence, M. Le Jeune, F. Levrier, A. Lewis, M. Liguori, P. B. Lilje, M. Lilley, V. Lindholm, M. López-Caniego, P. M. Lubin, Y.-Z. Ma, J. F. Macías-Pérez, G. Maggio, D. Maino, N. Mandolesi, A. Mangilli, A. Marcos-Caballero, M. Maris, P. G. Martin, E. Martínez-González, S. Matarrese, N. Mauri, J. D. McEwen, P. R. Meinhold, A. Melchiorri, A. Mennella, M. Migliaccio, M. Millea, M.-A. Miville-Deschênes, D. Molinari, A. Moneti, L. Montier, G. Morgante, A. Moss, P. Natoli, H. U. Nørgaard-Nielsen, L. Pagano, D. Paoletti, B. Partridge, G. Patanchon, H. V. Peiris, F. Perrotta, V. Pettorino, F. Piacentini, G. Polenta, J.-L. Puget, J. P. Rachen, M. Reinecke, M. Remazeilles, A. Renzi, G. Rocha, C. Rosset, G. Roudier, J. A. Rubiño-Martín, B. Ruiz-Granados, L. Salvati, M. Sandri, M. Savelainen, D. Scott, E. P. S. Shellard, C. Sirignano, G. Sirri, L. D. Spencer, R. Sunyaev, A.-S. Suur-Uski, J. A. Tauber, D. Tavagnacco, M. Tenti, L. Toffolatti, M. Tomasi, T. Trombetti, J. Valiviita, B. Van Tent, P. Vielva, F. Villa, N. Vittorio, B. D. Wandelt, I. K. Wehus, A. Zacchei, and A. ZoncaPlanck2018 results: v. cmb power spectra and likelihoods.
Astronomy & Astrophysics641, pp. A5.
External Links: ISSN 1432-0746,
Link,
DocumentCited by: §3.3.1.
Alberts and Noble (2022)S. Alberts and A. NobleFrom Clusters to Proto-Clusters: The Infrared Perspective on Environmental Galaxy Evolution.
Universe8 (11), pp. 554.
External Links: Document,
2209.02781Cited by: §10.1,
§10.2.
Allen et al. (2011)S. W. Allen, A. E. Evrard, and A. B. MantzCosmological Parameters from Observations of Galaxy Clusters.
ARA&A49, pp. 409–470.
External Links: 1103.4829,
DocumentCited by: §1.
Andersson et al. (2011)K. Andersson, B. A. Benson, P. A. R. Ade, K. A. Aird, B. Armstrong, M. Bautz, L. E. Bleem, M. Brodwin, J. E. Carlstrom, C. L. Chang, T. M. Crawford, A. T. Crites, T. de Haan, S. Desai, M. A. Dobbs, J. P. Dudley, R. J. Foley, W. R. Forman, G. Garmire, E. M. George, M. D. Gladders, N. W. Halverson, F. W. High, G. P. Holder, W. L. Holzapfel, J. D. Hrubes, C. Jones, M. Joy, R. Keisler, L. Knox, A. T. Lee, E. M. Leitch, M. Lueker, D. P. Marrone, J. J. McMahon, J. Mehl, S. S. Meyer, J. J. Mohr, T. E. Montroy, S. S. Murray, S. Padin, T. Plagge, C. Pryke, C. L. Reichardt, A. Rest, J. Ruel, J. E. Ruhl, K. K. Schaffer, L. Shaw, E. Shirokoff, J. Song, H. G. Spieler, B. Stalder, Z. Staniszewski, A. A. Stark, C. W. Stubbs, K. Vanderlinde, J. D. Vieira, A. Vikhlinin, R. Williamson, Y. Yang, O. Zahn, and A. ZentenoX-Ray Properties of the First Sunyaev-Zel’dovich Effect Selected Galaxy Cluster Sample from the South Pole Telescope.
ApJ738, pp. 48–+.
External Links: 1006.3068,
DocumentCited by: §10.1.
Archipley et al. (2026)M. Archipley, A. Hryciuk, L. E. Bleem, K. Kornoelje, M. Klein, A. J. Anderson, B. Ansarinejad, M. Aravena, L. Balkenhol, P. S. Barry, K. Benabed, A. N. Bender, B. A. Benson, F. Bianchini, S. Bocquet, F. R. Bouchet, E. Camphuis, M. G. Campitiello, J. E. Carlstrom, J. Cathey, C. L. Chang, S. C. Chapman, P. Chaubal, P. M. Chichura, A. Chokshi, T.-L. Chou, A. Coerver, T. M. Crawford, C. Daley, T. de Haan, R. P. Deane, K. R. Dibert, M. A. Dobbs, M. Doohan, A. Doussot, D. Dutcher, W. Everett, C. Feng, K. R. Ferguson, K. Fichman, B. Floyd, A. Foster, S. Galli, A. E. Gambrel, R. W. Gardner, F. Ge, N. Goeckner-Wald, A. Gonzalez, S. Grandis, T. R. Greve, R. Gualtieri, F. Guidi, S. Guns, N. W. Halverson, R. Hill, E. Hivon, G. P. Holder, W. L. Holzapfel, J. C. Hood, N. Huang, F. Kéruzoré, A. R. Khalife, L. Knox, M. Korman, C.-L. Kuo, K. Levy, A. E. Lowitz, C. Lu, G. P. Lynch, A. Maniyar, E. S. Martsen, F. Menanteau, M. Millea, J. Montgomery, Y. Nakato, T. Natoli, G. I. Noble, Y. Omori, A. Ouellette, Z. Pan, K. A. Phadke, A. W. Pollak, K. Prabhu, W. Quan, S. Raghunathan, M. Rahimi, A. Rahlin, C. L. Reichardt, C. Reuter, M. Rouble, J. E. Ruhl, E. Schiappucci, A. Simpson, J. A. Sobrin, B. Stalder, A. A. Stark, N. Sulzenauer, C. Tandoi, B. Thorne, C. Trendafilova, C. Umilta, J. D. Vieira, A. Vitrier, D. Vizgan, Y. Wan, A. Weiß, N. Whitehorn, W. L. K. Wu, M. R. Young, J. A. Zebrowski, and D. ZhouMillimeter-wave observations of Euclid Deep Field South using the South Pole Telescope: A data release of temperature maps and catalogs.
A&A706, pp. A17.
External Links: Document,
2506.00298Cited by: §1,
Figure 1,
§2.2,
§2.2,
§2,
§3,
§4.1.2,
§4.1,
Figure 11,
§6.
Ashby et al. (2013)M. L. N. Ashby, S. A. Stanford, M. Brodwin, A. H. Gonzalez, J. Martinez-Manso, J. G. Bartlett, B. A. Benson, L. E. Bleem, T. M. Crawford, A. Dey, A. Dressler, P. R. M. Eisenhardt, A. Galametz, B. T. Jannuzi, D. P. Marrone, S. Mei, A. Muzzin, F. Pacaud, M. Pierre, D. Stern, and J. D. VieiraThe Spitzer South Pole Telescope Deep Field: Survey Design and Infrared Array Camera Catalogs.
ApJS209, pp. 22.
External Links: 1308.0201,
DocumentCited by: §4.2,
§4.4.
Balzer et al. (2025)F. Balzer, E. Bulbul, M. Kluge, A. Liu, M. Salvato, M. Fabricius, R. Seppi, E. Artis, Y. E. Bahar, R. Bender, N. Clerc, J. Comparat, V. Ghirardini, S. Grandis, S. Krippendorf, G. Lamer, N. Malavasi, A. Merloni, K. Nandra, M. E. Ramos-Ceja, J. S. Sanders, S. Zelmer, and X. ZhangThe first SRG/eROSITA All-Sky Survey: Characterization of clusters of galaxies misclassified in the eRASS1 point source catalog.
A&A701, pp. A283.
External Links: Document,
2501.17238Cited by: Figure 17,
§A.1,
§A.1,
§A.2,
§A.2,
Appendix A,
§1,
§8.3.
Bayliss et al. (2016)M. B. Bayliss, J. Ruel, C. W. Stubbs, S. W. Allen, D. E. Applegate, M. L. N. Ashby, M. Bautz, B. A. Benson, L. E. Bleem, S. Bocquet, M. Brodwin, R. Capasso, J. E. Carlstrom, C. L. Chang, I. Chiu, H.-M. Cho, A. Clocchiatti, T. M. Crawford, A. T. Crites, T. de Haan, S. Desai, J. P. Dietrich, M. A. Dobbs, A. N. Doucouliagos, R. J. Foley, W. R. Forman, G. P. Garmire, E. M. George, M. D. Gladders, A. H. Gonzalez, N. Gupta, N. W. Halverson, J. Hlavacek-Larrondo, H. Hoekstra, G. P. Holder, W. L. Holzapfel, Z. Hou, J. D. Hrubes, N. Huang, C. Jones, R. Keisler, L. Knox, A. T. Lee, E. M. Leitch, A. von der Linden, D. Luong-Van, A. Mantz, D. P. Marrone, M. McDonald, J. J. McMahon, S. S. Meyer, L. M. Mocanu, J. J. Mohr, S. S. Murray, S. Padin, C. Pryke, D. Rapetti, C. L. Reichardt, A. Rest, J. E. Ruhl, B. R. Saliwanchik, A. Saro, J. T. Sayre, K. K. Schaffer, T. Schrabback, E. Shirokoff, J. Song, H. G. Spieler, B. Stalder, S. A. Stanford, Z. Staniszewski, A. A. Stark, K. T. Story, K. Vanderlinde, J. D. Vieira, A. Vikhlinin, R. Williamson, and A. ZentenoSPT-GMOS: A Gemini/GMOS-South Spectroscopic Survey of Galaxy Clusters in the SPT-SZ Survey.
ApJS227, pp. 3.
External Links: 1609.05211,
DocumentCited by: 5th item.
Benson et al. (2004)B. A. Benson, S. E. Church, P. A. R. Ade, J. J. Bock, K. M. Ganga, C. N. Henson, and K. L. ThompsonMeasurements of Sunyaev-Zel’dovich Effect Scaling Relations for Clusters of Galaxies.
ApJ617, pp. 829–846.
External Links: DocumentCited by: §3.1.
Bertin and Arnouts (1996)E. Bertin and S. ArnoutsSExtractor: Software for source extraction..
A&AS117, pp. 393–404.
Cited by: §4.3.
Bertin (2006)E. BertinAutomatic Astrometric and Photometric Calibration with SCAMP.
In Astronomical Data Analysis Software and Systems XV, C. Gabriel, C. Arviset, D. Ponz, and S. Enrique (Eds.),
Astronomical Society of the Pacific Conference Series, Vol. 351, pp. 112–+.
Cited by: §4.3.
Bertin (2010)E. BertinSWarp: Resampling and Co-adding FITS Images Together.
In Astrophysics Source Code Library, record ascl:1010.068,
External Links: 1010.068Cited by: §4.3.
BICEP/Keck Collaboration et al. (2021)BICEP/Keck Collaboration, SPTpol Collaboration, P. A. R. Ade, Z. Ahmed, M. Amiri, A. J. Anderson, J. E. Austermann, J. S. Avva, D. Barkats, R. B. Thakur, J. A. Beall, A. N. Bender, B. A. Benson, F. Bianchini, C. A. Bischoff, L. E. Bleem, J. J. Bock, H. Boenish, E. Bullock, V. Buza, J. E. Carlstrom, C. L. Chang, J. R. Cheshire, H. C. Chiang, T. -L. Chou, R. Citron, J. Connors, C. C. Moran, J. Cornelison, T. M. Crawford, A. T. Crites, M. Crumrine, A. Cukierman, T. de Haan, M. Dierickx, M. A. Dobbs, L. Duband, W. Everett, S. Fatigoni, J. P. Filippini, S. Fliescher, J. Gallicchio, E. M. George, T. St. Germaine, N. Goeckner-Wald, D. C. Goldfinger, J. Grayson, N. Gupta, G. Hall, M. Halpern, N. W. Halverson, S. Harrison, S. Henderson, J. W. Henning, S. R. Hildebrandt, G. C. Hilton, G. P. Holder, W. L. Holzapfel, J. D. Hrubes, N. Huang, J. Hubmayr, H. Hui, K. D. Irwin, J. Kang, K. S. Karkare, E. Karpel, S. Kefeli, S. A. Kernasovskiy, L. Knox, J. M. Kovac, C. L. Kuo, K. Lau, A. T. Lee, E. M. Leitch, D. Li, A. Lowitz, A. Manzotti, J. J. McMahon, K. G. Megerian, S. S. Meyer, M. Millea, L. M. Mocanu, L. Moncelsi, J. Montgomery, A. Nadolski, T. Namikawa, T. Natoli, C. B. Netterfield, H. T. Nguyen, J. P. Nibarger, G. Noble, V. Novosad, R. O’Brient, R. W. Ogburn, Y. Omori, S. Padin, S. Palladino, S. Patil, T. Prouve, C. Pryke, B. Racine, C. L. Reichardt, C. D. Reintsema, S. Richter, J. E. Ruhl, B. R. Saliwanchik, K. K. Schaffer, A. Schillaci, B. L. Schmitt, R. Schwarz, C. D. Sheehy, C. Sievers, G. Smecher, A. Soliman, A. A. Stark, B. Steinbach, R. V. Sudiwala, G. P. Teply, K. L. Thompson, J. E. Tolan, C. Tucker, A. D. Turner, C. Umiltà, T. Veach, J. D. Vieira, A. G. Vieregg, A. Wandui, G. Wang, A. C. Weber, N. Whitehorn, D. V. Wiebe, J. Willmert, C. L. Wong, W. L. K. Wu, H. Yang, V. Yefremenko, K. W. Yoon, E. Young, C. Yu, L. Zeng, C. Zhang, Bicep/Keck, and Sptpol CollaborationsA demonstration of improved constraints on primordial gravitational waves with delensing.
Phys. Rev. D103 (2), pp. 022004.
External Links: Document,
2011.08163Cited by: §2.
Blain et al. (2002)A. W. Blain, I. Smail, R. J. Ivison, J.-P. Kneib, and D. T. FrayerSubmillimeter galaxies.
Phys. Rep.369, pp. 111–176.
External Links: arXiv:astro-ph/0202228,
DocumentCited by: §10.1.
Bleem et al. (2020)L. E. Bleem, S. Bocquet, B. Stalder, M. D. Gladders, P. A. R. Ade, S. W. Allen, A. J. Anderson, J. Annis, M. L. N. Ashby, J. E. Austermann, S. Avila, J. S. Avva, M. Bayliss, J. A. Beall, K. Bechtol, A. N. Bender, B. A. Benson, E. Bertin, F. Bianchini, C. Blake, M. Brodwin, D. Brooks, E. Buckley-Geer, D. L. Burke, J. E. Carlstrom, A. C. Rosell, M. Carrasco Kind, J. Carretero, C. L. Chang, H. C. Chiang, R. Citron, C. C. Moran, M. Costanzi, T. M. Crawford, A. T. Crites, L. N. da Costa, T. de Haan, J. De Vicente, S. Desai, H. T. Diehl, J. P. Dietrich, M. A. Dobbs, T. F. Eifler, W. Everett, B. Flaugher, B. Floyd, J. Frieman, J. Gallicchio, J. García-Bellido, E. M. George, D. W. Gerdes, A. Gilbert, D. Gruen, R. A. Gruendl, J. Gschwend, N. Gupta, G. Gutierrez, N. W. Halverson, N. Harrington, J. W. Henning, C. Heymans, G. P. Holder, D. L. Hollowood, W. L. Holzapfel, K. Honscheid, J. D. Hrubes, N. Huang, J. Hubmayr, K. D. Irwin, D. J. James, T. Jeltema, S. Joudaki, G. Khullar, M. Klein, L. Knox, N. Kuropatkin, A. T. Lee, D. Li, C. Lidman, A. Lowitz, N. MacCrann, G. Mahler, M. A. G. Maia, J. L. Marshall, M. McDonald, J. J. McMahon, P. Melchior, F. Menanteau, S. S. Meyer, R. Miquel, L. M. Mocanu, J. J. Mohr, J. Montgomery, A. Nadolski, T. Natoli, J. P. Nibarger, G. Noble, V. Novosad, S. Padin, A. Palmese, D. Parkinson, S. Patil, F. Paz-Chinchón, A. A. Plazas, C. Pryke, N. S. Ramachandra, C. L. Reichardt, J. D. Remolina González, A. K. Romer, A. Roodman, J. E. Ruhl, E. S. Rykoff, B. R. Saliwanchik, E. Sanchez, A. Saro, J. T. Sayre, K. K. Schaffer, T. Schrabback, S. Serrano, K. Sharon, C. Sievers, G. Smecher, M. Smith, M. Soares-Santos, A. A. Stark, K. T. Story, E. Suchyta, G. Tarle, C. Tucker, K. Vanderlinde, T. Veach, J. D. Vieira, G. Wang, J. Weller, N. Whitehorn, W. L. K. Wu, V. Yefremenko, and Y. ZhangThe SPTpol Extended Cluster Survey.
ApJS247 (1), pp. 25.
External Links: Document,
1910.04121Cited by: Appendix B,
Appendix B,
§1,
§10.2.1,
§10.2.2,
Figure 11,
§6,
§7.2,
§7.
Bleem et al. (2024)L. E. Bleem, M. Klein, T. M. C. Abbot, P. A. R. Ade, M. Aguena, O. Alves, A. J. Anderson, F. Andrade-Oliveira, B. Ansarinejad, M. Archipley, M. L. N. Ashby, J. E. Austermann, D. Bacon, J. A. Beall, A. N. Bender, B. A. Benson, F. Bianchini, S. Bocquet, D. Brooks, D. L. Burke, M. Calzadilla, J. E. Carlstrom, A. Carnero Rosell, J. Carretero, C. L. Chang, P. Chaubal, H. C. Chiang, T-L. Chou, R. Citron, C. Corbett Moran, M. Costanzi, M. Constanzi, T. M. Crawford, A. T. Crites, L. N. da Costa, T. de Haan, J. De Vicente, S. Desai, M. A. Dobbs, P. Doel, W. Everett, I. Ferrero, B. Flaugher, B. Floyd, D. Friedel, J. Frieman, J. Gallicchio, J. Garc’ia-Bellido, M. Gatti, E. M. George, G. Giannini, S. Grandis, D. Gruen, R. A. Gruendl, N. Gupta, G. Gutierrez, N. W. Halverson, S. R. Hinton, S. R. Hinton, G. P. Holder, D. L. Hollowood, W. L. Holzapfel, K. Honscheid, J. D. Hrubes, N. Huang, J. Hubmayr, K. D. Irwin, J. Mena-Fernández, D. J. James, F. Kéruzoré, L. Knox, K. Kuehn, O. Lahav, A. T. Lee, S. Lee, D. Li, A. Lowitz, J. L. Marshal, M. McDonald, J. J. McMahon, F. Menanteau, S. S. Meyer, R. Miquel, J. J. Mohr, J. Montgomery, J. Myles, T. Natoli, J. P. Nibarger, G. I. Noble, V. Novosad, R. L. C. Ogando, S. Padin, S. Patil, M. E. S. Pereira, A. Pieres, A. A. Plazas Malag’on, C. Pryke, C. L. Reichardt, M. Rodr’iguez-Monroy, A. K. Romer, J. E. Ruhl, B. R. Saliwanchik, L. Salvati, E. Sanchez, A. Saro, K. K. Schaffer, T. Schrabback, I. Sevilla-Noarbe, C. Sievers, G. Smecher, M. Smith, T. Somboonpanyakul, B. Stalder, A. A. Stark, E. Suchyta, M. E. C. Swanson, G. Tarle, C. To, C. Tucker, T. Veach, J. D. Vieira, M. Vincenzi, G. Wang, J. Weller, N. Whitehorn, P. Wiseman, W. L. K. Wu, V. Yefremenko, J. A. Zebrowski, and Y. ZhangGalaxy Clusters Discovered via the Thermal Sunyaev-Zel’dovich Effect in the 500-square-degree SPTpol Survey.
The Open Journal of Astrophysics7, pp. 13.
External Links: Document,
2311.07512Cited by: §1,
§10.1.1,
§10.2.1,
§2.4,
§3.3,
3rd item,
§4.1,
§4.2,
Figure 11,
§5.1,
§6,
§7.2,
§8.1,
§8.1,
Table 2,
§9,
footnote 6.
Bleem et al. (2015)L. E. Bleem, B. Stalder, T. de Haan, K. A. Aird, S. W. Allen, D. E. Applegate, M. L. N. Ashby, M. Bautz, M. Bayliss, B. A. Benson, S. Bocquet, M. Brodwin, J. E. Carlstrom, C. L. Chang, I. Chiu, H. M. Cho, A. Clocchiatti, T. M. Crawford, A. T. Crites, S. Desai, J. P. Dietrich, M. A. Dobbs, R. J. Foley, W. R. Forman, E. M. George, M. D. Gladders, A. H. Gonzalez, N. W. Halverson, C. Hennig, H. Hoekstra, G. P. Holder, W. L. Holzapfel, J. D. Hrubes, C. Jones, R. Keisler, L. Knox, A. T. Lee, E. M. Leitch, J. Liu, M. Lueker, D. Luong-Van, A. Mantz, D. P. Marrone, M. McDonald, J. J. McMahon, S. S. Meyer, L. Mocanu, J. J. Mohr, S. S. Murray, S. Padin, C. Pryke, C. L. Reichardt, A. Rest, J. Ruel, J. E. Ruhl, B. R. Saliwanchik, A. Saro, J. T. Sayre, K. K. Schaffer, T. Schrabback, E. Shirokoff, J. Song, H. G. Spieler, S. A. Stanford, Z. Staniszewski, A. A. Stark, K. T. Story, C. W. Stubbs, K. Vanderlinde, J. D. Vieira, A. Vikhlinin, R. Williamson, O. Zahn, and A. ZentenoGalaxy Clusters Discovered via the Sunyaev-Zel’dovich Effect in the 2500-Square-Degree SPT-SZ Survey.
ApJS216, pp. 27.
External Links: 1409.0850,
DocumentCited by: §1,
§1,
§3.2,
§4.2,
§4.3,
Figure 11,
§7.2,
§7,
§8.1,
Table 2.
Bocquet et al. (2019)S. Bocquet, J. P. Dietrich, T. Schrabback, L. E. Bleem, M. Klein, S. W. Allen, D. E. Applegate, M. L. N. Ashby, M. Bautz, M. Bayliss, B. A. Benson, M. Brodwin, E. Bulbul, R. E. A. Canning, R. Capasso, J. E. Carlstrom, C. L. Chang, I. Chiu, H. -M. Cho, A. Clocchiatti, T. M. Crawford, A. T. Crites, T. de Haan, S. Desai, M. A. Dobbs, R. J. Foley, W. R. Forman, G. P. Garmire, E. M. George, M. D. Gladders, A. H. Gonzalez, S. Grandis, N. Gupta, N. W. Halverson, J. Hlavacek-Larrondo, H. Hoekstra, G. P. Holder, W. L. Holzapfel, Z. Hou, J. D. Hrubes, N. Huang, C. Jones, G. Khullar, L. Knox, R. Kraft, A. T. Lee, A. von der Linden, D. Luong-Van, A. Mantz, D. P. Marrone, M. McDonald, J. J. McMahon, S. S. Meyer, L. M. Mocanu, J. J. Mohr, R. G. Morris, S. Padin, S. Patil, C. Pryke, D. Rapetti, C. L. Reichardt, A. Rest, J. E. Ruhl, B. R. Saliwanchik, A. Saro, J. T. Sayre, K. K. Schaffer, E. Shirokoff, B. Stalder, S. A. Stanford, Z. Staniszewski, A. A. Stark, K. T. Story, V. Strazzullo, C. W. Stubbs, K. Vanderlinde, J. D. Vieira, A. Vikhlinin, R. Williamson, and A. ZentenoCluster Cosmology Constraints from the 2500 deg SPT-SZ Survey: Inclusion of Weak Gravitational Lensing Data from Magellan and the Hubble Space Telescope.
ApJ878 (1), pp. 55.
External Links: Document,
1812.01679Cited by: §3.2.
Bocquet et al. (2024a)S. Bocquet, S. Grandis, L. E. Bleem, M. Klein, J. J. Mohr, M. Aguena, A. Alarcon, S. Allam, S. W. Allen, O. Alves, A. Amon, B. Ansarinejad, D. Bacon, M. Bayliss, K. Bechtol, M. R. Becker, B. A. Benson, G. M. Bernstein, M. Brodwin, D. Brooks, A. Campos, R. E. A. Canning, J. E. Carlstrom, A. Carnero Rosell, M. Carrasco Kind, J. Carretero, R. Cawthon, C. Chang, R. Chen, A. Choi, J. Cordero, M. Costanzi, L. N. da Costa, M. E. S. Pereira, C. Davis, J. DeRose, S. Desai, T. de Haan, J. De Vicente, H. T. Diehl, S. Dodelson, P. Doel, C. Doux, A. Drlica-Wagner, K. Eckert, J. Elvin-Poole, S. Everett, I. Ferrero, A. Ferté, A. M. Flores, J. Frieman, J. García-Bellido, M. Gatti, G. Giannini, M. D. Gladders, D. Gruen, R. A. Gruendl, I. Harrison, W. G. Hartley, K. Herner, S. R. Hinton, D. L. Hollowood, W. L. Holzapfel, K. Honscheid, N. Huang, E. M. Huff, D. J. James, M. Jarvis, G. Khullar, K. Kim, R. Kraft, K. Kuehn, N. Kuropatkin, F. Kéruzoré, S. Lee, P. -F. Leget, N. MacCrann, G. Mahler, A. Mantz, J. L. Marshall, J. McCullough, M. McDonald, J. Mena-Fernández, R. Miquel, J. Myles, A. Navarro-Alsina, R. L. C. Ogando, A. Palmese, S. Pandey, A. Pieres, A. A. Plazas Malagón, J. Prat, M. Raveri, C. L. Reichardt, J. Roberson, R. P. Rollins, A. K. Romer, C. Romero, A. Roodman, A. J. Ross, E. S. Rykoff, L. Salvati, C. Sánchez, E. Sanchez, D. Sanchez Cid, A. Saro, T. Schrabback, M. Schubnell, L. F. Secco, I. Sevilla-Noarbe, K. Sharon, E. Sheldon, T. Shin, M. Smith, T. Somboonpanyakul, B. Stalder, A. A. Stark, V. Strazzullo, E. Suchyta, M. E. C. Swanson, G. Tarle, C. To, M. A. Troxel, I. Tutusaus, T. N. Varga, A. von der Linden, N. Weaverdyck, J. Weller, P. Wiseman, B. Yanny, B. Yin, M. Young, Y. Zhang, J. Zuntz, (The DES, and SPT Collaborations)SPT clusters with DES and HST weak lensing. I. Cluster lensing and Bayesian population modeling of multiwavelength cluster datasets.
Phys. Rev. D110 (8), pp. 083509.
External Links: Document,
2310.12213Cited by: §5.1.
Bocquet et al. (2024b)S. Bocquet, S. Grandis, L. E. Bleem, M. Klein, J. J. Mohr, T. Schrabback, T. M. C. Abbott, P. A. R. Ade, M. Aguena, A. Alarcon, S. Allam, S. W. Allen, O. Alves, A. Amon, A. J. Anderson, J. Annis, B. Ansarinejad, J. E. Austermann, S. Avila, D. Bacon, M. Bayliss, J. A. Beall, K. Bechtol, M. R. Becker, A. N. Bender, B. A. Benson, G. M. Bernstein, S. Bhargava, F. Bianchini, M. Brodwin, D. Brooks, L. Bryant, A. Campos, R. E. A. Canning, J. E. Carlstrom, A. Carnero Rosell, M. Carrasco Kind, J. Carretero, F. J. Castander, R. Cawthon, C. L. Chang, C. Chang, P. Chaubal, R. Chen, H. C. Chiang, A. Choi, T. -L. Chou, R. Citron, C. Corbett Moran, J. Cordero, M. Costanzi, T. M. Crawford, A. T. Crites, L. N. da Costa, M. E. S. Pereira, C. Davis, T. M. Davis, J. DeRose, S. Desai, T. de Haan, H. T. Diehl, M. A. Dobbs, S. Dodelson, C. Doux, A. Drlica-Wagner, K. Eckert, J. Elvin-Poole, S. Everett, W. Everett, I. Ferrero, A. Ferté, A. M. Flores, J. Frieman, J. Gallicchio, J. García-Bellido, M. Gatti, E. M. George, G. Giannini, M. D. Gladders, D. Gruen, R. A. Gruendl, N. Gupta, G. Gutierrez, N. W. Halverson, I. Harrison, W. G. Hartley, K. Herner, S. R. Hinton, G. P. Holder, D. L. Hollowood, W. L. Holzapfel, K. Honscheid, J. D. Hrubes, N. Huang, J. Hubmayr, E. M. Huff, D. Huterer, K. D. Irwin, D. J. James, M. Jarvis, G. Khullar, K. Kim, L. Knox, R. Kraft, E. Krause, K. Kuehn, N. Kuropatkin, F. Kéruzoré, O. Lahav, A. T. Lee, P. -F. Leget, D. Li, H. Lin, A. Lowitz, N. MacCrann, G. Mahler, A. Mantz, J. L. Marshall, J. McCullough, M. McDonald, J. J. McMahon, J. Mena-Fernández, F. Menanteau, S. S. Meyer, R. Miquel, J. Montgomery, J. Myles, T. Natoli, A. Navarro-Alsina, J. P. Nibarger, G. I. Noble, V. Novosad, R. L. C. Ogando, Y. Omori, S. Padin, S. Pandey, P. Paschos, S. Patil, A. Pieres, A. A. Plazas Malagón, A. Porredon, J. Prat, C. Pryke, M. Raveri, C. L. Reichardt, J. Roberson, R. P. Rollins, C. Romero, A. Roodman, J. E. Ruhl, E. S. Rykoff, B. R. Saliwanchik, L. Salvati, C. Sánchez, E. Sanchez, D. Sanchez Cid, A. Saro, K. K. Schaffer, L. F. Secco, I. Sevilla-Noarbe, K. Sharon, E. Sheldon, T. Shin, C. Sievers, G. Smecher, M. Smith, T. Somboonpanyakul, M. Sommer, B. Stalder, A. A. Stark, J. Stephen, V. Strazzullo, E. Suchyta, G. Tarle, C. To, M. A. Troxel, C. Tucker, I. Tutusaus, T. N. Varga, T. Veach, J. D. Vieira, A. Vikhlinin, A. von der Linden, G. Wang, N. Weaverdyck, J. Weller, N. Whitehorn, W. L. K. Wu, B. Yanny, V. Yefremenko, B. Yin, M. Young, J. A. Zebrowski, Y. Zhang, H. Zohren, J. Zuntz, (SPT, and DES Collaborations)SPT clusters with DES and HST weak lensing. II. Cosmological constraints from the abundance of massive halos.
Phys. Rev. D110 (8), pp. 083510.
External Links: Document,
2401.02075Cited by: §1,
§5.2,
§5.3.
Bocquet et al. (2025)S. Bocquet, S. Grandis, E. Krause, C. To, L. E. Bleem, M. Klein, J. J. Mohr, T. Schrabback, A. Alarcon, O. Alves, A. Amon, F. Andrade-Oliveira, E. J. Baxter, K. Bechtol, M. R. Becker, G. M. Bernstein, J. Blazek, H. Camacho, A. Campos, A. Carnero Rosell, M. Carrasco Kind, R. Cawthon, C. Chang, R. Chen, A. Choi, J. Cordero, M. Crocce, C. Davis, J. DeRose, H. T. Diehl, S. Dodelson, C. Doux, A. Drlica-Wagner, K. Eckert, T. F. Eifler, F. Elsner, J. Elvin-Poole, S. Everett, X. Fang, A. Ferté, P. Fosalba, O. Friedrich, J. Frieman, M. Gatti, G. Giannini, D. Gruen, R. A. Gruendl, I. Harrison, W. G. Hartley, K. Herner, H. Huang, E. M. Huff, D. Huterer, M. Jarvis, N. Kuropatkin, P. -F. Leget, P. Lemos, A. R. Liddle, N. MacCrann, J. McCullough, J. Muir, J. Myles, A. Navarro-Alsina, S. Pandey, Y. Park, A. Porredon, J. Prat, M. Raveri, R. P. Rollins, A. Roodman, R. Rosenfeld, E. S. Rykoff, C. Sánchez, J. Sanchez, L. F. Secco, I. Sevilla-Noarbe, E. Sheldon, T. Shin, M. A. Troxel, I. Tutusaus, T. N. Varga, N. Weaverdyck, R. H. Wechsler, H. -Y. Wu, B. Yanny, B. Yin, Y. Zhang, J. Zuntz, T. M. C. Abbott, P. A. R. Ade, M. Aguena, S. Allam, S. W. Allen, A. J. Anderson, B. Ansarinejad, J. E. Austermann, M. Bayliss, J. A. Beall, A. N. Bender, B. A. Benson, F. Bianchini, M. Brodwin, D. Brooks, L. Bryant, D. L. Burke, R. E. A. Canning, J. E. Carlstrom, J. Carretero, F. J. Castander, C. L. Chang, P. Chaubal, H. C. Chiang, T. -L. Chou, R. Citron, C. Corbett Moran, M. Costanzi, T. M. Crawford, A. T. Crites, L. N. da Costa, M. E. S. Pereira, T. M. Davis, T. de Haan, M. A. Dobbs, P. Doel, W. Everett, A. Farahi, B. Flaugher, A. M. Flores, B. Floyd, J. Gallicchio, E. Gaztanaga, E. M. George, M. D. Gladders, N. Gupta, G. Gutierrez, N. W. Halverson, S. R. Hinton, J. Hlavacek-Larrondo, G. P. Holder, D. L. Hollowood, W. L. Holzapfel, J. D. Hrubes, N. Huang, J. Hubmayr, K. D. Irwin, D. J. James, F. Kéruzoré, G. Khullar, K. Kim, L. Knox, R. Kraft, K. Kuehn, O. Lahav, A. T. Lee, S. Lee, D. Li, C. Lidman, M. Lima, A. Lowitz, G. Mahler, A. Mantz, J. L. Marshall, M. McDonald, J. J. McMahon, J. Mena-Fernández, S. S. Meyer, R. Miquel, J. Montgomery, T. Natoli, J. P. Nibarger, G. I. Noble, V. Novosad, R. L. C. Ogando, S. Padin, P. Paschos, S. Patil, A. A. Plazas Malagón, C. Pryke, C. L. Reichardt, J. Roberson, A. K. Romer, C. Romero, J. E. Ruhl, B. R. Saliwanchik, L. Salvati, S. Samuroff, E. Sanchez, B. Santiago, A. Sarkar, A. Saro, K. K. Schaffer, K. Sharon, C. Sievers, G. Smecher, M. Smith, T. Somboonpanyakul, M. Sommer, B. Stalder, A. A. Stark, and J. StephenMultiprobe cosmology from the abundance of SPT clusters and DES galaxy clustering and weak lensing.
Phys. Rev. D111 (6), pp. 063533.
External Links: Document,
2412.07765Cited by: §1.
Bufanda et al. (2017)E. Bufanda, D. Hollowood, T. E. Jeltema, E. S. Rykoff, E. Rozo, P. Martini, T. M. C. Abbott, F. B. Abdalla, S. Allam, M. Banerji, A. Benoit-Lévy, E. Bertin, D. Brooks, A. Carnero Rosell, M. Carrasco Kind, J. Carretero, C. E. Cunha, L. N. da Costa, S. Desai, H. T. Diehl, J. P. Dietrich, A. E. Evrard, A. Fausti Neto, B. Flaugher, J. Frieman, D. W. Gerdes, D. A. Goldstein, D. Gruen, R. A. Gruendl, G. Gutierrez, K. Honscheid, D. J. James, K. Kuehn, N. Kuropatkin, M. Lima, M. A. G. Maia, J. L. Marshall, P. Melchior, R. Miquel, J. J. Mohr, R. Ogando, A. A. Plazas, A. K. Romer, P. Rooney, E. Sanchez, B. Santiago, V. Scarpine, I. Sevilla-Noarbe, R. C. Smith, M. Soares-Santos, F. Sobreira, E. Suchyta, G. Tarle, D. Thomas, D. L. Tucker, A. R. Walker, and DES CollaborationThe evolution of active galactic nuclei in clusters of galaxies from the Dark Energy Survey.
MNRAS465 (3), pp. 2531–2539.
External Links: Document,
1606.06775Cited by: §A.2.
Bulbul et al. (2024)E. Bulbul, A. Liu, M. Kluge, X. Zhang, J. S. Sanders, Y. E. Bahar, V. Ghirardini, E. Artis, R. Seppi, C. Garrel, M. E. Ramos-Ceja, J. Comparat, F. Balzer, K. Böckmann, M. Brüggen, N. Clerc, K. Dennerl, K. Dolag, M. Freyberg, S. Grandis, D. Gruen, F. Kleinebreil, S. Krippendorf, G. Lamer, A. Merloni, K. Migkas, K. Nandra, F. Pacaud, P. Predehl, T. H. Reiprich, T. Schrabback, A. Veronica, J. Weller, and S. ZelmerThe SRG/eROSITA All-Sky Survey. The first catalog of galaxy clusters and groups in the Western Galactic Hemisphere.
A&A685, pp. A106.
External Links: Document,
2402.08452Cited by: Figure 17,
§A.2,
§A.2,
Appendix A,
§1,
§10.2,
5th item,
Figure 11,
§6,
Figure 13,
§8.3,
§8.3,
Table 2,
Table 2.
Calabretta and Greisen (2002)M. R. Calabretta and E. W. GreisenRepresentations of celestial coordinates in FITS.
A&A395, pp. 1077–1122.
External Links: arXiv:astro-ph/0207413,
DocumentCited by: §2.2,
§2.3.
Camphuis et al. (2026)E. Camphuis, W. Quan, L. Balkenhol, A. R. Khalife, F. Ge, F. Guidi, N. Huang, G. P. Lynch, Y. Omori, C. Trendafilova, A. J. Anderson, B. Ansarinejad, M. Archipley, P. S. Barry, K. Benabed, A. N. Bender, B. A. Benson, F. Bianchini, L. E. Bleem, F. R. Bouchet, L. Bryant, M. G. Campitiello, J. E. Carlstrom, C. L. Chang, P. Chaubal, P. M. Chichura, A. Chokshi, T.-L. Chou, A. Coerver, T. M. Crawford, C. Daley, T. de Haan, K. R. Dibert, M. A. Dobbs, M. Doohan, A. Doussot, D. Dutcher, W. Everett, C. Feng, K. R. Ferguson, K. Fichman, A. Foster, S. Galli, A. E. Gambrel, R. W. Gardner, N. Goeckner-Wald, R. Gualtieri, S. Guns, N. W. Halverson, E. Hivon, G. P. Holder, W. L. Holzapfel, J. C. Hood, A. Hryciuk, F. Kéruzoré, L. Knox, M. Korman, K. Kornoelje, C.-L. Kuo, K. Levy, A. E. Lowitz, C. Lu, A. Maniyar, E. S. Martsen, F. Menanteau, M. Millea, J. Montgomery, Y. Nakato, T. Natoli, G. I. Noble, A. Ouellette, Z. Pan, P. Paschos, K. A. Phadke, A. W. Pollak, K. Prabhu, S. Raghunathan, M. Rahimi, A. Rahlin, C. L. Reichardt, M. Rouble, J. E. Ruhl, E. Schiappucci, A. Simpson, J. A. Sobrin, A. A. Stark, J. Stephen, C. Tandoi, B. Thorne, C. Umilta, J. D. Vieira, A. Vitrier, Y. Wan, N. Whitehorn, W. L. K. Wu, M. R. Young, J. A. Zebrowski, and SPT-3G CollaborationSPT-3G D1: CMB temperature and polarization power spectra and cosmology from 2019 and 2020 observations of the SPT-3G main field.
Phys. Rev. D113 (8), pp. 083504.
External Links: Document,
2506.20707Cited by: §1,
§2.
Carlstrom et al. (2011)J. E. Carlstrom, P. A. R. Ade, K. A. Aird, B. A. Benson, L. E. Bleem, S. Busetti, C. L. Chang, E. Chauvin, H.-M. Cho, T. M. Crawford, A. T. Crites, M. A. Dobbs, N. W. Halverson, S. Heimsath, W. L. Holzapfel, J. D. Hrubes, M. Joy, R. Keisler, T. M. Lanting, A. T. Lee, E. M. Leitch, J. Leong, W. Lu, M. Lueker, D. Luong-van, J. J. McMahon, J. Mehl, S. S. Meyer, J. J. Mohr, T. E. Montroy, S. Padin, T. Plagge, C. Pryke, J. E. Ruhl, K. K. Schaffer, D. Schwan, E. Shirokoff, H. G. Spieler, Z. Staniszewski, A. A. Stark, C. Tucker, K. Vanderlinde, J. D. Vieira, and R. WilliamsonThe 10 Meter South Pole Telescope.
PASP123, pp. 568–581.
External Links: 0907.4445,
DocumentCited by: §2.
Cavaliere and Fusco-Femiano (1976)A. Cavaliere and R. Fusco-FemianoX-rays from hot plasma in clusters of galaxies.
A&A49, pp. 137.
Cited by: §3.
Cerny et al. (2026)C. Cerny, G. Mahler, K. Sharon, M. Jauzac, G. Khullar, B. Beauchesne, J. M. Diego, D. J. Lagattuta, M. Limousin, N. R. Patel, J. Richard, C. Cornil-Baïotto, M. D. Gladders, S. V. Werner, J. E. Doppel, B. Floyd, A. H. Gonzalez, R. J. Massey, M. Montes, M. B. Bayliss, L. E. Bleem, R. E. A. Canning, A. C. Edge, M. McDonald, P. Natarajan, A. A. Stark, and R. GassisStrong LensIng and Cluster Evolution (SLICE) with JWST: Early Results, Lens Models, and High-redshift Detections.
ApJ1001 (1), pp. 60.
External Links: Document,
2503.17498Cited by: §7.
Chaubal et al. (2026)P. Chaubal, N. Huang, C. L. Reichardt, A. J. Anderson, B. Ansarinejad, M. Archipley, L. Balkenhol, D. R. Barron, K. Benabed, A. N. Bender, B. A. Benson, F. Bianchini, L. E. Bleem, S. Bocquet, F. R. Bouchet, L. Bryant, E. Camphuis, M. G. Campitiello, J. E. Carlstrom, J. Carron, C. L. Chang, P. M. Chichura, A. Chokshi, T.-L. Chou, A. Coerver, T. M. Crawford, C. Daley, T. de Haan, K. R. Dibert, M. A. Dobbs, M. Doohan, A. Doussot, D. Dutcher, W. Everett, C. Feng, K. R. Ferguson, N. C. Ferree, K. Fichman, A. Foster, S. Galli, A. E. Gambrel, A. K. Gao, R. W. Gardner, F. Ge, N. Goeckner-Wald, R. Gualtieri, F. Guidi, S. Guns, N. W. Halverson, E. Hivon, A. Y. Q. Ho, G. P. Holder, W. L. Holzapfel, J. C. Hood, A. Hryciuk, T. Jhaveri, F. Kéruzoré, A. R. Khalife, L. Knox, M. Korman, K. Kornoelje, C.-L. Kuo, K. Levy, Y. Li, A. E. Lowitz, C. Lu, G. P. Lynch, T. J. Maccarone, A. S. Maniyar, E. S. Martsen, F. Menanteau, M. Millea, J. Montgomery, Y. Nakato, T. Natoli, G. I. Noble, Y. Omori, A. Ouellette, Z. Pan, P. Paschos, K. A. Phadke, A. W. Pollak, K. Prabhu, W. Quan, S. Raghunathan, M. Rahimi, A. Rahlin, M. Rouble, J. E. Ruhl, E. Schiappucci, A. C. Silva Oliveira, A. Simpson, J. A. Sobrin, A. A. Stark, J. Stephen, C. Tandoi, B. Thorne, C. Trendafilova, C. Umilta, J. D. Vieira, A. G. Vieregg, A. Vitrier, Y. Wan, N. Whitehorn, W. L. K. Wu, M. R. Young, and J. A. ZebrowskiSPT-3G D1: A Measurement of Secondary Cosmic Microwave Background Anisotropy Power.
arXiv e-prints, pp. arXiv:2601.20551.
External Links: Document,
2601.20551Cited by: §2.
Chichura et al. (2022)P. M. Chichura, A. Foster, C. Patel, N. Ossa-Jaen, P. A. R. Ade, Z. Ahmed, A. J. Anderson, M. Archipley, J. E. Austermann, J. S. Avva, L. Balkenhol, P. S. Barry, R. B. Thakur, J. A. Beall, K. Benabed, A. N. Bender, B. A. Benson, F. Bianchini, L. E. Bleem, F. R. Bouchet, L. Bryant, K. Byrum, J. E. Carlstrom, F. W. Carter, T. W. Cecil, C. L. Chang, P. Chaubal, G. Chen, H. C. Chiang, H.-M. Cho, T-L. Chou, R. Citron, J.-F. Cliche, T. M. Crawford, A. T. Crites, A. Cukierman, C. M. Daley, E. V. Denison, K. Dibert, J. Ding, M. A. Dobbs, D. Dutcher, W. Everett, C. Feng, K. R. Ferguson, J. Fu, S. Galli, J. Gallicchio, A. E. Gambrel, R. W. Gardner, E. M. George, N. Goeckner-Wald, R. Gualtieri, S. Guns, N. Gupta, R. Guyser, T. de Haan, N. W. Halverson, A. H. Harke-Hosemann, N. L. Harrington, J. W. Henning, G. C. Hilton, E. Hivon, G. P. Holder, W. L. Holzapfel, J. C. Hood, D. Howe, J. D. Hrubes, N. Huang, J. Hubmayr, K. D. Irwin, O. B. Jeong, M. Jonas, A. Jones, T. S. Khaire, L. Knox, A. M. Kofman, M. Korman, D. L. Kubik, S. Kuhlmann, C.-L. Kuo, A. T. Lee, E. M. Leitch, D. Li, A. Lowitz, C. Lu, D. P. Marrone, J. J. McMahon, S. S. Meyer, D. Michalik, M. Millea, L. M. Mocanu, J. Montgomery, C. C. Moran, A. Nadolski, T. Natoli, H. Nguyen, J. P. Nibarger, G. Noble, V. Novosad, Y. Omori, S. Padin, Z. Pan, P. Paschos, S. Patil, J. Pearson, K. A. Phadke, C. M. Posada, K. Prabhu, C. Pryke, W. Quan, A. Rahlin, C. L. Reichardt, D. Riebel, B. Riedel, M. Rouble, J. E. Ruhl, B. R. Saliwanchik, J. T. Sayre, K. K. Schaffer, E. Schiappucci, E. Shirokoff, C. Sievers, G. Smecher, J. A. Sobrin, A. Springmann, A. A. Stark, J. Stephen, K. T. Story, A. Suzuki, C. Tandoi, K. L. Thompson, B. Thorne, C. Tucker, C. Umilta, L. R. Vale, T. Veach, J. D. Vieira, G. Wang, N. Whitehorn, W. L. K. Wu, V. Yefremenko, K. W. Yoon, and M. R. YoungAsteroid measurements at millimeter wavelengths with the south pole telescope.
The Astrophysical Journal936 (2), pp. 173.
External Links: Document,
LinkCited by: §2.
Chou et al. (2025)T.-L. Chou, P. A. R. Ade, A. J. Anderson, J. E. Austermann, L. Balkenhol, J. A. Beall, A. N. Bender, B. A. Benson, F. Bianchini, L. E. Bleem, J. E. Carlstrom, C. L. Chang, P. Chaubal, H. C. Chiang, R. Citron, C. Corbett Moran, T. M. Crawford, A. T. Crites, T. de Haan, M. A. Dobbs, D. Dutcher, W. Everett, J. Gallicchio, E. M. George, N. Gupta, N. W. Halverson, G. P. Holder, W. L. Holzapfel, J. D. Hrubes, N. Huang, J. Hubmayr, K. D. Irwin, L. Knox, A. T. Lee, D. Li, A. Lowitz, J. J. McMahon, J. Montgomery, T. Natoli, J. P. Nibarger, G. I. Noble, V. Novosad, Y. Omori, S. Padin, S. Patil, C. Pryke, W. Quan, C. L. Reichardt, J. E. Ruhl, B. R. Saliwanchik, K. K. Schaffer, C. Sievers, G. Smecher, A. A. Stark, C. Tucker, T. Veach, J. D. Vieira, G. Wang, N. Whitehorn, W. L. K. Wu, V. Yefremenko, J. A. Zebrowski, and SPTpol CollaborationMeasurements of the temperature and E-mode polarization of the cosmic microwave background from the full 500-square-degree SPTpol dataset.
Phys. Rev. D111 (12), pp. 123513.
External Links: Document,
2501.06890Cited by: §2.
Clerc et al. (2024)N. Clerc, J. Comparat, R. Seppi, E. Artis, Y. E. Bahar, F. Balzer, E. Bulbul, T. Dauser, C. Garrel, V. Ghirardini, S. Grandis, C. Kirsch, M. Kluge, A. Liu, F. Pacaud, M. E. Ramos-Ceja, T. H. Reiprich, J. Sanders, J. Wilms, and X. ZhangThe SRG/eROSITA All-Sky Survey. X-ray selection function models for the eRASS1 galaxy cluster cosmology.
A&A687, pp. A238.
External Links: Document,
2402.08457Cited by: §8.3.
Coble et al. (2007)K. Coble, M. Bonamente, J. E. Carlstrom, K. Dawson, N. Hasler, W. Holzapfel, M. Joy, S. La Roque, D. P. Marrone, and E. D. ReeseRadio Sources toward Galaxy Clusters at 30 GHz.
AJ134, pp. 897–+.
External Links: arXiv:astro-ph/0608274,
DocumentCited by: §10.2.1,
§10.2.1,
§10.2.2,
§10.2,
Table 6.
Coe et al. (2019)D. Coe, B. Salmon, M. Bradač, L. D. Bradley, K. Sharon, A. Zitrin, A. Acebron, C. Cerny, N. Cibirka, V. Strait, R. Paterno-Mahler, G. Mahler, R. J. Avila, S. Ogaz, K. Huang, D. Pelliccia, D. P. Stark, R. Mainali, P. A. Oesch, M. Trenti, D. Carrasco, W. A. Dawson, S. A. Rodney, L. Strolger, A. G. Riess, C. Jones, B. L. Frye, N. G. Czakon, K. Umetsu, B. Vulcani, O. Graur, S. W. Jha, M. L. Graham, A. Molino, M. Nonino, J. Hjorth, J. Selsing, L. Christensen, S. Kikuchihara, M. Ouchi, M. Oguri, B. Welch, B. C. Lemaux, F. Andrade-Santos, A. T. Hoag, T. L. Johnson, A. Peterson, M. Past, C. Fox, I. Agulli, R. Livermore, R. E. Ryan, D. Lam, I. Sendra-Server, S. Toft, L. Lovisari, and Y. SuRELICS: Reionization Lensing Cluster Survey.
ApJ884 (1), pp. 85.
External Links: Document,
1903.02002Cited by: §7.
Condon et al. (1998)J. J. Condon, W. D. Cotton, E. W. Greisen, Q. F. Yin, R. A. Perley, G. B. Taylor, and J. J. BroderickThe NRAO VLA Sky Survey.
AJ115, pp. 1693–1716.
External Links: DocumentCited by: §10.2.1.
Costanzi et al. (2019)M. Costanzi, E. Rozo, M. Simet, Y. Zhang, A. E. Evrard, A. Mantz, E. S. Rykoff, T. Jeltema, D. Gruen, S. Allen, T. McClintock, A. K. Romer, A. von der Linden, A. Farahi, J. DeRose, T. N. Varga, J. Weller, P. Giles, D. L. Hollowood, S. Bhargava, A. Bermeo-Hernandez, X. Chen, T. M. C. Abbott, F. B. Abdalla, S. Avila, K. Bechtol, D. Brooks, E. Buckley-Geer, D. L. Burke, A. C. Rosell, M. C. Kind, J. Carretero, M. Crocce, C. E. Cunha, L. N. da Costa, C. Davis, J. De Vicente, H. T. Diehl, J. P. Dietrich, P. Doel, T. F. Eifler, J. Estrada, B. Flaugher, P. Fosalba, J. Frieman, J. García-Bellido, E. Gaztanaga, D. W. Gerdes, T. Giannantonio, R. A. Gruendl, J. Gschwend, G. Gutierrez, W. G. Hartley, K. Honscheid, B. Hoyle, D. J. James, E. Krause, K. Kuehn, N. Kuropatkin, M. Lima, H. Lin, M. A. G. Maia, M. March, J. L. Marshall, P. Martini, F. Menanteau, C. J. Miller, R. Miquel, J. J. Mohr, R. L. C. Ogando, A. A. Plazas, A. Roodman, E. Sanchez, V. Scarpine, R. Schindler, M. Schubnell, S. Serrano, I. Sevilla-Noarbe, E. Sheldon, M. Smith, M. Soares-Santos, F. Sobreira, E. Suchyta, M. E. C. Swanson, G. Tarle, D. Thomas, and R. H. WechslerMethods for cluster cosmology and application to the SDSS in preparation for DES Year 1 release.
MNRAS488 (4), pp. 4779–4800.
External Links: Document,
1810.09456Cited by: §9.2.
Cromer et al. (2019)D. Cromer, N. Battaglia, and M. S. MadhavacherilImproving constraints on fundamental physics parameters with the clustering of Sunyaev-Zeldovich selected galaxy clusters.
Phys. Rev. D100 (6), pp. 063529.
External Links: Document,
1903.00976Cited by: §11.
Dalal et al. (2023)R. Dalal, X. Li, A. Nicola, J. Zuntz, M. A. Strauss, S. Sugiyama, T. Zhang, M. M. Rau, R. Mandelbaum, M. Takada, S. More, H. Miyatake, A. Kannawadi, M. Shirasaki, T. Taniguchi, R. Takahashi, K. Osato, T. Hamana, M. Oguri, A. J. Nishizawa, A. A. P. Malagón, T. Sunayama, D. Alonso, A. Slosar, W. Luo, R. Armstrong, J. Bosch, B. Hsieh, Y. Komiyama, R. H. Lupton, N. B. Lust, L. A. MacArthur, S. Miyazaki, H. Murayama, T. Nishimichi, Y. Okura, P. A. Price, P. J. Tait, M. Tanaka, and S. WangHyper Suprime-Cam Year 3 results: Cosmology from cosmic shear power spectra.
Phys. Rev. D108 (12), pp. 123519.
External Links: Document,
2304.00701Cited by: §1.
de Haan et al. (2016)T. de Haan, B. A. Benson, L. E. Bleem, S. W. Allen, D. E. Applegate, M. L. N. Ashby, M. Bautz, M. Bayliss, S. Bocquet, M. Brodwin, J. E. Carlstrom, C. L. Chang, I. Chiu, H.-M. Cho, A. Clocchiatti, T. M. Crawford, A. T. Crites, S. Desai, J. P. Dietrich, M. A. Dobbs, A. N. Doucouliagos, R. J. Foley, W. R. Forman, G. P. Garmire, E. M. George, M. D. Gladders, A. H. Gonzalez, N. Gupta, N. W. Halverson, J. Hlavacek-Larrondo, H. Hoekstra, G. P. Holder, W. L. Holzapfel, Z. Hou, J. D. Hrubes, N. Huang, C. Jones, R. Keisler, L. Knox, A. T. Lee, E. M. Leitch, A. von der Linden, D. Luong-Van, A. Mantz, D. P. Marrone, M. McDonald, J. J. McMahon, S. S. Meyer, L. M. Mocanu, J. J. Mohr, S. S. Murray, S. Padin, C. Pryke, D. Rapetti, C. L. Reichardt, A. Rest, J. Ruel, J. E. Ruhl, B. R. Saliwanchik, A. Saro, J. T. Sayre, K. K. Schaffer, T. Schrabback, E. Shirokoff, J. Song, H. G. Spieler, B. Stalder, S. A. Stanford, Z. Staniszewski, A. A. Stark, K. T. Story, C. W. Stubbs, K. Vanderlinde, J. D. Vieira, A. Vikhlinin, R. Williamson, and A. ZentenoCosmological Constraints from Galaxy Clusters in the 2500 Square-degree SPT-SZ Survey.
ApJ832, pp. 95.
External Links: 1603.06522,
DocumentCited by: §3.2.
de Jong et al. (2019)R. S. de Jong, O. Agertz, A. A. Berbel, J. Aird, D. A. Alexander, A. Amarsi, F. Anders, R. Andrae, B. Ansarinejad, W. Ansorge, P. Antilogus, H. Anwand-Heerwart, A. Arentsen, A. Arnadottir, M. Asplund, M. Auger, N. Azais, D. Baade, G. Baker, S. Baker, E. Balbinot, I. K. Baldry, M. Banerji, S. Barden, P. Barklem, E. Barthélémy-Mazot, C. Battistini, S. Bauer, C. P. M. Bell, O. Bellido-Tirado, S. Bellstedt, V. Belokurov, T. Bensby, M. Bergemann, J. M. Bestenlehner, R. Bielby, M. Bilicki, C. Blake, J. Bland-Hawthorn, C. Boeche, W. Boland, T. Boller, S. Bongard, A. Bongiorno, P. Bonifacio, D. Boudon, D. Brooks, M. J. I. Brown, R. Brown, M. Brüggen, J. Brynnel, J. Brzeski, T. Buchert, P. Buschkamp, E. Caffau, P. Caillier, J. Carrick, L. Casagrande, S. Case, A. Casey, I. Cesarini, G. Cescutti, D. Chapuis, C. Chiappini, M. Childress, N. Christlieb, R. Church, M.-R. L. Cioni, M. Cluver, M. Colless, T. Collett, J. Comparat, A. Cooper, W. Couch, F. Courbin, S. Croom, D. Croton, E. Daguisé, G. Dalton, L. J. M. Davies, T. Davis, P. de Laverny, A. Deason, F. Dionies, K. Disseau, P. Doel, D. Döscher, S. P. Driver, T. Dwelly, D. Eckert, A. Edge, B. Edvardsson, D. E. Youssoufi, A. Elhaddad, H. Enke, G. Erfanianfar, T. Farrell, T. Fechner, C. Feiz, S. Feltzing, I. Ferreras, D. Feuerstein, D. Feuillet, A. Finoguenov, D. Ford, S. Fotopoulou, M. Fouesneau, C. Frenk, S. Frey, W. Gaessler, S. Geier, N. Gentile Fusillo, O. Gerhard, T. Giannantonio, D. Giannone, B. Gibson, P. Gillingham, C. González-Fernández, E. Gonzalez-Solares, S. Gottloeber, A. Gould, E. K. Grebel, A. Gueguen, G. Guiglion, M. Haehnelt, T. Hahn, C. J. Hansen, H. Hartman, K. Hauptner, K. Hawkins, D. Haynes, R. Haynes, U. Heiter, A. Helmi, C. H. Aguayo, P. Hewett, S. Hinton, D. Hobbs, S. Hoenig, D. Hofman, I. Hook, J. Hopgood, A. Hopkins, A. Hourihane, L. Howes, C. Howlett, T. Huet, M. Irwin, O. Iwert, P. Jablonka, T. Jahn, K. Jahnke, A. Jarno, S. Jin, P. Jofre, D. Johl, D. Jones, H. Jönsson, C. Jordan, I. Karovicova, A. Khalatyan, A. Kelz, R. Kennicutt, D. King, F. Kitaura, J. Klar, U. Klauser, J.-P. Kneib, A. Koch, S. Koposov, G. Kordopatis, A. Korn, J. Kosmalski, R. Kotak, M. Kovalev, K. Kreckel, Y. Kripak, M. Krumpe, K. Kuijken, A. Kunder, I. Kushniruk, M. I. Lam, G. Lamer, F. Laurent, J. Lawrence, M. Lehmitz, B. Lemasle, J. Lewis, B. Li, C. Lidman, K. Lind, J. Liske, J.-L. Lizon, J. Loveday, H.-G. Ludwig, R. M. McDermid, K. Maguire, V. Mainieri, S. Mali, and H. Mandel4MOST: Project overview and information for the First Call for Proposals.
The Messenger175, pp. 3–11.
External Links: Document,
1903.02464Cited by: §2.
De Zotti et al. (2010)G. De Zotti, M. Massardi, M. Negrello, and J. WallRadio and millimeter continuum surveys and their astrophysical implications.
A&A Rev.18, pp. 1–65.
External Links: 0908.1896,
DocumentCited by: §10.1.1.
Dey et al. (2019)A. Dey, D. J. Schlegel, D. Lang, R. Blum, K. Burleigh, X. Fan, J. R. Findlay, D. Finkbeiner, D. Herrera, S. Juneau, M. Landriau, M. Levi, I. McGreer, A. Meisner, A. D. Myers, J. Moustakas, P. Nugent, A. Patej, E. F. Schlafly, A. R. Walker, F. Valdes, B. A. Weaver, C. Yèche, H. Zou, X. Zhou, B. Abareshi, T. M. C. Abbott, B. Abolfathi, C. Aguilera, S. Alam, L. Allen, A. Alvarez, J. Annis, B. Ansarinejad, M. Aubert, J. Beechert, E. F. Bell, S. Y. BenZvi, F. Beutler, R. M. Bielby, A. S. Bolton, C. Briceño, E. J. Buckley-Geer, K. Butler, A. Calamida, R. G. Carlberg, P. Carter, R. Casas, F. J. Castander, Y. Choi, J. Comparat, E. Cukanovaite, T. Delubac, K. DeVries, S. Dey, G. Dhungana, M. Dickinson, Z. Ding, J. B. Donaldson, Y. Duan, C. J. Duckworth, S. Eftekharzadeh, D. J. Eisenstein, T. Etourneau, P. A. Fagrelius, J. Farihi, M. Fitzpatrick, A. Font-Ribera, L. Fulmer, B. T. Gänsicke, E. Gaztanaga, K. George, D. W. Gerdes, S. G. A. Gontcho, C. Gorgoni, G. Green, J. Guy, D. Harmer, M. Hernandez, K. Honscheid, L. W. Huang, D. J. James, B. T. Jannuzi, L. Jiang, R. Joyce, A. Karcher, S. Karkar, R. Kehoe, J. Kneib, A. Kueter-Young, T. Lan, T. R. Lauer, L. Le Guillou, A. Le Van Suu, J. H. Lee, M. Lesser, L. Perreault Levasseur, T. S. Li, J. L. Mann, R. Marshall, C. E. Martínez-Vázquez, P. Martini, H. du Mas des Bourboux, S. McManus, T. G. Meier, B. Ménard, N. Metcalfe, A. Muñoz-Gutiérrez, J. Najita, K. Napier, G. Narayan, J. A. Newman, J. Nie, B. Nord, D. J. Norman, K. A. G. Olsen, A. Paat, N. Palanque-Delabrouille, X. Peng, C. L. Poppett, M. R. Poremba, A. Prakash, D. Rabinowitz, A. Raichoor, M. Rezaie, A. N. Robertson, N. A. Roe, A. J. Ross, N. P. Ross, G. Rudnick, S. Safonova, A. Saha, F. J. Sánchez, E. Savary, H. Schweiker, A. Scott, H. Seo, H. Shan, D. R. Silva, Z. Slepian, C. Soto, D. Sprayberry, R. Staten, C. M. Stillman, R. J. Stupak, D. L. Summers, S. Sien Tie, H. Tirado, M. Vargas-Magaña, A. K. Vivas, R. H. Wechsler, D. Williams, J. Yang, Q. Yang, T. Yapici, D. Zaritsky, A. Zenteno, K. Zhang, T. Zhang, R. Zhou, and Z. ZhouOverview of the DESI Legacy Imaging Surveys.
AJ157 (5), pp. 168.
External Links: Document,
1804.08657Cited by: Figure 7,
§4,
§7.2.
Dicker et al. (2014)S. R. Dicker, P. A. R. Ade, J. Aguirre, J. A. Brevik, H. M. Cho, R. Datta, M. J. Devlin, B. Dober, D. Egan, J. Ford, P. Ford, G. Hilton, K. D. Irwin, B. S. Mason, P. Marganian, M. Mello, J. J. McMahon, T. Mroczkowski, M. Rosenman, C. Tucker, L. Vale, S. White, M. Whitehead, and A. H. YoungMUSTANG 2: A Large Focal Plane Array for the 100 m Green Bank Telescope.
Journal of Low Temperature Physics176 (5-6), pp. 808–814.
External Links: DocumentCited by: §10.2.1.
Dicker et al. (2021)S. R. Dicker, E. S. Battistelli, T. Bhandarkar, M. J. Devlin, S. M. Duff, G. Hilton, M. Hilton, A. D. Hincks, J. Hubmayr, K. Huffenberger, J. P. Hughes, L. Di Mascolo, B. S. Mason, J. A. B. Mates, J. McMahon, T. Mroczkowski, S. Naess, J. Orlowski-Scherer, B. Partridge, F. Radiconi, C. Romero, C. L. Sarazin, N. Sehgal, J. Sievers, C. Sifón, J. Ullom, L. R. Vale, M. R. Vissers, and Z. XuObservations of compact sources in galaxy clusters using MUSTANG2.
MNRAS508 (2), pp. 2600–2612.
External Links: Document,
2107.06725Cited by: §10.2.1,
§10.2.2.
Dicker et al. (2024)S. R. Dicker, K. Perez Sarmiento, B. Mason, T. Bhandarkar, M. J. Devlin, L. Di Mascolo, S. Haridas, M. Hilton, M. Madhavacheril, E. Moravec, T. Mroczkowski, J. Orlowski-Scherer, C. Romero, C. L. Sarazin, and J. SieversSensitive 3 mm Imaging of Discrete Sources in the Fields of Thermal Sunyaev─Zel’dovich Effect─Selected Galaxy Clusters.
ApJ970 (1), pp. 84.
External Links: Document,
2403.09855Cited by: §10.2.1.
Diehl et al. (2017)H. T. Diehl, E. J. Buckley-Geer, K. A. Lindgren, B. Nord, H. Gaitsch, S. Gaitsch, H. Lin, S. Allam, T. E. Collett, C. Furlanetto, M. S. S. Gill, A. More, J. Nightingale, C. Odden, A. Pellico, D. L. Tucker, L. N. da Costa, A. Fausti Neto, N. Kuropatkin, M. Soares-Santos, B. Welch, Y. Zhang, J. A. Frieman, F. B. Abdalla, J. Annis, A. Benoit-Lévy, E. Bertin, D. Brooks, D. L. Burke, A. Carnero Rosell, M. Carrasco Kind, J. Carretero, C. E. Cunha, C. B. D’Andrea, S. Desai, J. P. Dietrich, A. Drlica-Wagner, A. E. Evrard, D. A. Finley, B. Flaugher, J. García-Bellido, D. W. Gerdes, D. A. Goldstein, D. Gruen, R. A. Gruendl, J. Gschwend, G. Gutierrez, D. J. James, K. Kuehn, S. Kuhlmann, O. Lahav, T. S. Li, M. Lima, M. A. G. Maia, J. L. Marshall, F. Menanteau, R. Miquel, R. C. Nichol, P. Nugent, R. L. C. Ogand o, A. A. Plazas, K. Reil, A. K. Romer, M. Sako, E. Sanchez, B. Santiago, V. Scarpine, R. Schindler, M. Schubnell, I. Sevilla-Noarbe, E. Sheldon, M. Smith, F. Sobreira, E. Suchyta, M. E. C. Swanson, G. Tarle, D. Thomas, A. R. Walker, and DES CollaborationThe DES Bright Arcs Survey: Hundreds of Candidate Strongly Lensed Galaxy Systems from the Dark Energy Survey Science Verification and Year 1 Observations.
The Astrophysical Journal Supplement Series232 (1), pp. 15.
External Links: DocumentCited by: §7.1.
Dodelson et al. (2016)S. Dodelson, K. Heitmann, C. Hirata, K. Honscheid, A. Roodman, U. Seljak, A. Slosar, and M. TroddenCosmic Visions Dark Energy: Science.
arXiv e-prints, pp. arXiv:1604.07626.
External Links: Document,
1604.07626Cited by: §1.
Dolag et al. (2025)K. Dolag, R. Remus, L. M. Valenzuela, L. C. Kimmig, B. Seidel, S. Fortune, J. Stoiber, A. Ivleva, T. Hoffmann, V. Biffi, I. Marini, P. Popesso, and S. Vladutescu-ZoppEncyclopedia Magneticum: Scaling Relations from Cosmic Dawn to Present Day.
arXiv e-prints, pp. arXiv:2504.01061.
External Links: Document,
2504.01061Cited by: §1.
Donahue et al. (2020)M. Donahue, K. Funkhouser, D. Koeppe, R. L. S. Frisbie, and G. M. VoitClusters of Galaxies Masquerading as X-Ray Quasars.
ApJ889 (2), pp. 121.
External Links: Document,
2002.09431Cited by: §A.1.
Dreyer (1888)J. L. E. DreyerA New General Catalogue of Nebulæ and Clusters of Stars, being the Catalogue of the late Sir John F. W. Herschel, Bart, revised, corrected, and enlarged.
Memoirs of the Royal Astronomical Society49, pp. 1.
Cited by: §3.1.
Drlica-Wagner et al. (2022)A. Drlica-Wagner, P. S. Ferguson, M. Adamów, M. Aguena, S. Allam, F. Andrade-Oliveira, D. Bacon, K. Bechtol, E. F. Bell, E. Bertin, P. Bilaji, S. Bocquet, C. R. Bom, D. Brooks, D. L. Burke, J. A. Carballo-Bello, J. L. Carlin, A. Carnero Rosell, M. Carrasco Kind, J. Carretero, F. J. Castander, W. Cerny, C. Chang, Y. Choi, C. Conselice, M. Costanzi, D. Crnojević, L. N. da Costa, J. de Vicente, S. Desai, J. Esteves, S. Everett, I. Ferrero, M. Fitzpatrick, B. Flaugher, D. Friedel, J. Frieman, J. García-Bellido, M. Gatti, E. Gaztanaga, D. W. Gerdes, D. Gruen, R. A. Gruendl, J. Gschwend, W. G. Hartley, D. Hernandez-Lang, S. R. Hinton, D. L. Hollowood, K. Honscheid, A. K. Hughes, A. Jacques, D. J. James, M. D. Johnson, K. Kuehn, N. Kuropatkin, O. Lahav, T. S. Li, C. Lidman, H. Lin, M. March, J. L. Marshall, D. Martínez-Delgado, C. E. Martínez-Vázquez, P. Massana, S. Mau, M. McNanna, P. Melchior, F. Menanteau, A. E. Miller, R. Miquel, J. J. Mohr, R. Morgan, B. Mutlu-Pakdil, R. R. Muñoz, E. H. Neilsen, D. L. Nidever, R. Nikutta, J. L. Nilo Castellon, N. E. D. Noël, R. L. C. Ogando, K. A. G. Olsen, A. B. Pace, A. Palmese, F. Paz-Chinchón, M. E. S. Pereira, A. Pieres, A. A. Plazas Malagón, J. Prat, A. H. Riley, M. Rodriguez-Monroy, A. K. Romer, A. Roodman, M. Sako, J. D. Sakowska, E. Sanchez, F. J. Sánchez, D. J. Sand, L. Santana-Silva, B. Santiago, M. Schubnell, S. Serrano, I. Sevilla-Noarbe, J. D. Simon, M. Smith, M. Soares-Santos, G. S. Stringfellow, E. Suchyta, D. J. Suson, C. Y. Tan, G. Tarle, K. Tavangar, D. Thomas, C. To, E. J. Tollerud, M. A. Troxel, D. L. Tucker, T. N. Varga, A. K. Vivas, A. R. Walker, J. Weller, R. D. Wilkinson, J. F. Wu, B. Yanny, E. Zaborowski, A. Zenteno, Delve Collaboration, Des Collaboration, and Astro Data LabThe DECam Local Volume Exploration Survey Data Release 2.
ApJS261 (2), pp. 38.
External Links: Document,
2203.16565Cited by: §4.
Duchesne et al. (2025)S. Duchesne, K. Ross, A. J. M. Thomson, E. Lenc, T. Murphy, T. J. Galvin, A. W. Hotan, V. A. Moss, and M. T. WhitingThe Rapid ASKAP Continuum Survey (RACS) VI: The RACS-high 1655.5 MHz images and catalogue..
PASA42, pp. 38.
External Links: Document,
2501.04978Cited by: §10.2.1.
Duchesne et al. (2024)S. W. Duchesne, J. A. Grundy, G. H. Heald, E. Lenc, J. K. Leung, D. McConnell, T. Murphy, J. Pritchard, K. Rose, A. J. M. Thomson, Y. Wang, Z. Wang, and M. T. WhitingThe Rapid ASKAP Continuum Survey V: Cataloguing the sky at 1 367.5 MHz and the second data release of RACS-mid.
PASA41, pp. e003.
External Links: Document,
2311.12369Cited by: §10.1.1,
§10.2.2,
§10.2,
Figure 13.
Dutcher et al. (2021)D. Dutcher, L. Balkenhol, P. A. R. Ade, Z. Ahmed, E. Anderes, A. J. Anderson, M. Archipley, J. S. Avva, K. Aylor, P. S. Barry, R. Basu Thakur, K. Benabed, A. N. Bender, B. A. Benson, F. Bianchini, L. E. Bleem, F. R. Bouchet, L. Bryant, K. Byrum, J. E. Carlstrom, F. W. Carter, T. W. Cecil, C. L. Chang, P. Chaubal, G. Chen, H. -M. Cho, T. -L. Chou, J. -F. Cliche, T. M. Crawford, A. Cukierman, C. Daley, T. de Haan, E. V. Denison, K. Dibert, J. Ding, M. A. Dobbs, W. Everett, C. Feng, K. R. Ferguson, A. Foster, J. Fu, S. Galli, A. E. Gambrel, R. W. Gardner, N. Goeckner-Wald, R. Gualtieri, S. Guns, N. Gupta, R. Guyser, N. W. Halverson, A. H. Harke-Hosemann, N. L. Harrington, J. W. Henning, G. C. Hilton, E. Hivon, G. P. Holder, W. L. Holzapfel, J. C. Hood, D. Howe, N. Huang, K. D. Irwin, O. B. Jeong, M. Jonas, A. Jones, T. S. Khaire, L. Knox, A. M. Kofman, M. Korman, D. L. Kubik, S. Kuhlmann, C. -L. Kuo, A. T. Lee, E. M. Leitch, A. E. Lowitz, C. Lu, S. S. Meyer, D. Michalik, M. Millea, J. Montgomery, A. Nadolski, T. Natoli, H. Nguyen, G. I. Noble, V. Novosad, Y. Omori, S. Padin, Z. Pan, P. Paschos, J. Pearson, C. M. Posada, K. Prabhu, W. Quan, S. Raghunathan, A. Rahlin, C. L. Reichardt, D. Riebel, B. Riedel, M. Rouble, J. E. Ruhl, J. T. Sayre, E. Schiappucci, E. Shirokoff, G. Smecher, J. A. Sobrin, A. A. Stark, J. Stephen, K. T. Story, A. Suzuki, K. L. Thompson, B. Thorne, C. Tucker, C. Umilta, L. R. Vale, K. Vanderlinde, J. D. Vieira, G. Wang, N. Whitehorn, W. L. K. Wu, V. Yefremenko, K. W. Yoon, M. R. Young, and SPT-3G CollaborationMeasurements of the E -mode polarization and temperature-E -mode correlation of the CMB from SPT-3G 2018 data.
Phys. Rev. D104 (2), pp. 022003.
External Links: Document,
2101.01684Cited by: §2.2.
Euclid Collaboration et al. (2025)Euclid Collaboration, Y. Mellier, Abdurro’uf, J. A. Acevedo Barroso, A. Achúcarro, J. Adamek, R. Adam, G. E. Addison, N. Aghanim, M. Aguena, V. Ajani, Y. Akrami, A. Al-Bahlawan, A. Alavi, I. S. Albuquerque, G. Alestas, G. Alguero, A. Allaoui, S. W. Allen, V. Allevato, A. V. Alonso-Tetilla, B. Altieri, A. Alvarez-Candal, S. Alvi, A. Amara, L. Amendola, J. Amiaux, I. T. Andika, S. Andreon, A. Andrews, G. Angora, R. E. Angulo, F. Annibali, A. Anselmi, S. Anselmi, S. Arcari, M. Archidiacono, G. Aricò, M. Arnaud, S. Arnouts, M. Asgari, J. Asorey, L. Atayde, H. Atek, F. Atrio-Barandela, M. Aubert, E. Aubourg, T. Auphan, N. Auricchio, B. Aussel, H. Aussel, P. P. Avelino, A. Avgoustidis, S. Avila, S. Awan, R. Azzollini, C. Baccigalupi, E. Bachelet, D. Bacon, M. Baes, M. B. Bagley, B. Bahr-Kalus, A. Balaguera-Antolinez, E. Balbinot, M. Balcells, M. Baldi, I. Baldry, A. Balestra, M. Ballardini, O. Ballester, M. Balogh, E. Bañados, R. Barbier, S. Bardelli, M. Baron, T. Barreiro, R. Barrena, J.-C. Barriere, B. J. Barros, A. Barthelemy, N. Bartolo, A. Basset, P. Battaglia, A. J. Battisti, C. M. Baugh, L. Baumont, L. Bazzanini, J.-P. Beaulieu, V. Beckmann, A. N. Belikov, J. Bel, F. Bellagamba, M. Bella, E. Bellini, K. Benabed, R. Bender, G. Benevento, C. L. Bennett, K. Benson, P. Bergamini, J. R. Bermejo-Climent, F. Bernardeau, D. Bertacca, M. Berthe, J. Berthier, M. Bethermin, F. Beutler, C. Bevillon, S. Bhargava, R. Bhatawdekar, D. Bianchi, L. Bisigello, A. Biviano, R. P. Blake, A. Blanchard, J. Blazek, L. Blot, A. Bosco, C. Bodendorf, T. Boenke, H. Böhringer, P. Boldrini, M. Bolzonella, A. Bonchi, M. Bonici, D. Bonino, L. Bonino, C. Bonvin, W. Bon, J. T. Booth, S. Borgani, A. S. Borlaff, E. Borsato, B. Bose, M. T. Botticella, A. Boucaud, F. Bouche, J. S. Boucher, D. Boutigny, T. Bouvard, R. Bouwens, H. Bouy, R. A. A. Bowler, V. Bozza, E. Bozzo, E. Branchini, G. Brando, S. Brau-Nogue, P. Brekke, M. N. Bremer, M. Brescia, M.-A. Breton, J. Brinchmann, T. Brinckmann, C. Brockley-Blatt, M. Brodwin, L. Brouard, M. L. Brown, S. Bruton, J. Bucko, H. Buddelmeijer, G. Buenadicha, F. Buitrago, P. Burger, C. Burigana, V. Busillo, D. Busonero, R. Cabanac, L. Cabayol-Garcia, M. S. Cagliari, A. Caillat, L. Caillat, M. Calabrese, A. Calabro, G. Calderone, F. Calura, B. Camacho Quevedo, S. Camera, L. Campos, G. Cañas-Herrera, G. P. Candini, M. Cantiello, V. Capobianco, E. Cappellaro, N. Cappelluti, A. Cappi, K. I. Caputi, C. Cara, C. Carbone, V. F. Cardone, E. Carella, R. G. Carlberg, M. Carle, L. Carminati, F. Caro, J. M. Carrasco, J. Carretero, P. Carrilho, J. Carron Duque, and B. CarryEuclid: I. Overview of the Euclid mission.
A&A697, pp. A1.
External Links: Document,
2405.13491Cited by: §1,
§11,
§2.
Everett et al. (2020)W. B. Everett, L. Zhang, T. M. Crawford, J. D. Vieira, M. Aravena, M. A. Archipley, J. E. Austermann, B. A. Benson, L. E. Bleem, J. E. Carlstrom, C. L. Chang, S. Chapman, A. T. Crites, T. de Haan, M. A. Dobbs, E. M. George, N. W. Halverson, N. Harrington, G. P. Holder, W. L. Holzapfel, J. D. Hrubes, L. Knox, A. T. Lee, D. Luong-Van, A. C. Mangian, D. P. Marrone, J. J. McMahon, S. S. Meyer, L. M. Mocanu, J. J. Mohr, T. Natoli, S. Padin, C. Pryke, C. L. Reichardt, C. A. Reuter, J. E. Ruhl, J. T. Sayre, K. K. Schaffer, E. Shirokoff, J. S. Spilker, B. Stalder, Z. Staniszewski, A. A. Stark, K. T. Story, E. R. Switzer, K. Vanderlinde, A. Weiß, and R. WilliamsonMillimeter-wave Point Sources from the 2500 Square Degree SPT-SZ Survey: Catalog and Population Statistics.
ApJ900 (1), pp. 55.
External Links: Document,
2003.03431Cited by: §2,
§3.3.1.
Fazio et al. (2004)G. G. Fazio, J. L. Hora, L. E. Allen, M. L. N. Ashby, P. Barmby, L. K. Deutsch, J.-S. Huang, S. Kleiner, M. Marengo, S. T. Megeath, G. J. Melnick, M. A. Pahre, B. M. Patten, J. Polizotti, H. A. Smith, R. S. Taylor, Z. Wang, S. P. Willner, W. F. Hoffmann, J. L. Pipher, W. J. Forrest, C. W. McMurty, C. R. McCreight, M. E. McKelvey, R. E. McMurray, D. G. Koch, S. H. Moseley, R. G. Arendt, J. E. Mentzell, C. T. Marx, P. Losch, P. Mayman, W. Eichhorn, D. Krebs, M. Jhabvala, D. Y. Gezari, D. J. Fixsen, J. Flores, K. Shakoorzadeh, R. Jungo, C. Hakun, L. Workman, G. Karpati, R. Kichak, R. Whitley, S. Mann, E. V. Tollestrup, P. Eisenhardt, D. Stern, V. Gorjian, B. Bhattacharya, S. Carey, B. O. Nelson, W. J. Glaccum, M. Lacy, P. J. Lowrance, S. Laine, W. T. Reach, J. A. Stauffer, J. A. Surace, G. Wilson, E. L. Wright, A. Hoffman, G. Domingo, and M. CohenThe Infrared Array Camera (IRAC) for the Spitzer Space Telescope.
ApJS154, pp. 10–17.
External Links: arXiv:astro-ph/0405616,
DocumentCited by: §4.2,
§4.
Fixsen (2009)D. J. FixsenThe Temperature of the Cosmic Microwave Background.
ApJ707, pp. 916–920.
External Links: 0911.1955,
DocumentCited by: §3.
Flaugher et al. (2015)B. Flaugher, H. T. Diehl, K. Honscheid, T. M. C. Abbott, O. Alvarez, R. Angstadt, J. T. Annis, M. Antonik, O. Ballester, L. Beaufore, G. M. Bernstein, R. A. Bernstein, B. Bigelow, M. Bonati, D. Boprie, D. Brooks, E. J. Buckley-Geer, J. Campa, L. Cardiel-Sas, F. J. Castander, J. Castilla, H. Cease, J. M. Cela-Ruiz, S. Chappa, E. Chi, C. Cooper, L. N. da Costa, E. Dede, G. Derylo, D. L. DePoy, J. de Vicente, P. Doel, A. Drlica-Wagner, J. Eiting, A. E. Elliott, J. Emes, J. Estrada, A. Fausti Neto, D. A. Finley, R. Flores, J. Frieman, D. Gerdes, M. D. Gladders, B. Gregory, G. R. Gutierrez, J. Hao, S. E. Holland, S. Holm, D. Huffman, C. Jackson, D. J. James, M. Jonas, A. Karcher, I. Karliner, S. Kent, R. Kessler, M. Kozlovsky, R. G. Kron, D. Kubik, K. Kuehn, S. Kuhlmann, K. Kuk, O. Lahav, A. Lathrop, J. Lee, M. E. Levi, P. Lewis, T. S. Li, I. Mandrichenko, J. L. Marshall, G. Martinez, K. W. Merritt, R. Miquel, F. Muñoz, E. H. Neilsen, R. C. Nichol, B. Nord, R. Ogando, J. Olsen, N. Palaio, K. Patton, J. Peoples, A. A. Plazas, J. Rauch, K. Reil, J.-P. Rheault, N. A. Roe, H. Rogers, A. Roodman, E. Sanchez, V. Scarpine, R. H. Schindler, R. Schmidt, R. Schmitt, M. Schubnell, K. Schultz, P. Schurter, L. Scott, S. Serrano, T. M. Shaw, R. C. Smith, M. Soares-Santos, A. Stefanik, W. Stuermer, E. Suchyta, A. Sypniewski, G. Tarle, J. Thaler, R. Tighe, C. Tran, D. Tucker, A. R. Walker, G. Wang, M. Watson, C. Weaverdyck, W. Wester, R. Woods, B. Yanny, and DES CollaborationThe Dark Energy Camera.
AJ150, pp. 150.
External Links: 1504.02900,
DocumentCited by: §4.
Flender et al. (2016)S. Flender, L. Bleem, H. Finkel, S. Habib, K. Heitmann, and G. HolderSimulations of the Pairwise Kinematic Sunyaev-Zel’dovich Signal.
ApJ823, pp. 98.
External Links: Document,
1511.02843Cited by: §3.3.1.
Frontiere et al. (2025)N. Frontiere, J. D. Emberson, M. Buehlmann, E. M. Rangel, S. Habib, K. Heitmann, P. Larsen, V. Morozov, A. Pope, C. Faucher-Giguère, A. Georgiadou, D. Lebrun-Grandié, and A. ProkopenkoCosmological Hydrodynamics at Exascale: A Trillion-Particle Leap in Capability.
In SC ’25: Proceedings of the International Conference for High Performance Computing,
pp. 25–35.
External Links: Document,
2510.03557Cited by: §1.
Garg et al. (2007)A. Garg, C. W. Stubbs, P. Challis, W. M. Wood-Vasey, S. Blondin, M. E. Huber, K. Cook, S. Nikolaev, A. Rest, R. C. Smith, K. Olsen, N. B. Suntzeff, C. Aguilera, J. L. Prieto, A. Becker, A. Miceli, G. Miknaitis, A. Clocchiatti, D. Minniti, L. Morelli, and D. L. WelchLight Curves of Type Ia Supernovae from Near the Time of Explosion.
AJ133, pp. 403–419.
External Links: arXiv:astro-ph/0608639,
DocumentCited by: §4.3.
Ge et al. (2025)F. Ge, M. Millea, E. Camphuis, C. Daley, N. Huang, Y. Omori, W. Quan, E. Anderes, A. J. Anderson, B. Ansarinejad, M. Archipley, L. Balkenhol, K. Benabed, A. N. Bender, B. A. Benson, F. Bianchini, L. E. Bleem, F. R. Bouchet, L. Bryant, J. E. Carlstrom, C. L. Chang, P. Chaubal, G. Chen, P. M. Chichura, A. Chokshi, T.-L. Chou, A. Coerver, T. M. Crawford, T. de Haan, K. R. Dibert, M. A. Dobbs, M. Doohan, A. Doussot, D. Dutcher, W. Everett, C. Feng, K. R. Ferguson, K. Fichman, A. Foster, S. Galli, A. E. Gambrel, R. W. Gardner, N. Goeckner-Wald, R. Gualtieri, F. Guidi, S. Guns, N. W. Halverson, E. Hivon, G. P. Holder, W. L. Holzapfel, J. C. Hood, D. Howe, A. Hryciuk, F. Kéruzoré, A. R. Khalife, L. Knox, M. Korman, K. Kornoelje, C.-L. Kuo, A. T. Lee, K. Levy, A. E. Lowitz, C. Lu, A. Maniyar, E. S. Martsen, F. Menanteau, J. Montgomery, Y. Nakato, T. Natoli, G. I. Noble, Z. Pan, P. Paschos, K. A. Phadke, A. W. Pollak, K. Prabhu, M. Rahimi, A. Rahlin, C. L. Reichardt, D. Riebel, M. Rouble, J. E. Ruhl, E. Schiappucci, J. A. Sobrin, A. A. Stark, J. Stephen, C. Tandoi, B. Thorne, C. Trendafilova, C. Umilta, J. D. Vieira, A. Vitrier, Y. Wan, N. Whitehorn, W. L. K. Wu, M. R. Young, and J. A. ZebrowskiCosmology from cmb lensing and delensed power spectra using 2019–2020 spt-3g polarization data.
Phys. Rev. D111, pp. 083534.
External Links: Document,
LinkCited by: §2.
Ghirardini et al. (2024)V. Ghirardini, E. Bulbul, E. Artis, N. Clerc, C. Garrel, S. Grandis, M. Kluge, A. Liu, Y. E. Bahar, F. Balzer, I. Chiu, J. Comparat, D. Gruen, F. Kleinebreil, S. Krippendorf, A. Merloni, K. Nandra, N. Okabe, F. Pacaud, P. Predehl, M. E. Ramos-Ceja, T. H. Reiprich, J. S. Sanders, T. Schrabback, R. Seppi, S. Zelmer, X. Zhang, W. Bornemann, H. Brunner, V. Burwitz, D. Coutinho, K. Dennerl, M. Freyberg, S. Friedrich, R. Gaida, A. Gueguen, F. Haberl, W. Kink, G. Lamer, X. Li, T. Liu, C. Maitra, N. Meidinger, S. Mueller, H. Miyatake, S. Miyazaki, J. Robrade, A. Schwope, and I. StewartThe SRG/eROSITA all-sky survey: Cosmology constraints from cluster abundances in the western Galactic hemisphere.
A&A689, pp. A298.
External Links: Document,
2402.08458Cited by: §1,
§1.
Gladders and Yee (2000)M. D. Gladders and H. K. C. YeeA new method for galaxy cluster detection. i. the algorithm.
AJ120, pp. 2148–2162.
Cited by: §4.
Gonzalez et al. (2019)A. H. Gonzalez, D. P. Gettings, M. Brodwin, P. R. M. Eisenhardt, S. A. Stanford, D. Wylezalek, B. Decker, D. P. Marrone, E. Moravec, C. O’Donnell, B. Stalder, D. Stern, Z. Abdulla, G. Brown, J. Carlstrom, K. C. Chambers, B. Hayden, Y. Lin, E. Magnier, F. J. Masci, A. B. Mantz, M. McDonald, W. Mo, S. Perlmutter, E. L. Wright, and G. R. ZeimannThe Massive and Distant Clusters of WISE Survey. I. Survey Overview and a Catalog of >2000 Galaxy Clusters at z ≃ 1.
The Astrophysical Journal Supplement Series240, pp. 33.
External Links: Document,
1809.06820Cited by: §4.
Gonzalez et al. (2025)J. Gonzalez, T. Collett, K. Rojas, K. Bechtol, J. A. Acevedo Barroso, A. Melo, A. More, D. Sluse, C. Tortora, P. Holloway, N. E. P. Lines, and A. VermaDoes Machine Learning Work? A Comparative Analysis of Strong Gravitational Lens Searches in the Dark Energy Survey.
arXiv e-prints, pp. arXiv:2510.23782.
External Links: Document,
2510.23782Cited by: §7.1.
Gralla et al. (2014)M. B. Gralla, D. Crichton, T. A. Marriage, W. Mo, P. Aguirre, G. E. Addison, V. Asboth, N. Battaglia, J. Bock, J. R. Bond, M. J. Devlin, R. Dünner, A. Hajian, M. Halpern, M. Hilton, A. D. Hincks, R. A. Hlozek, K. M. Huffenberger, J. P. Hughes, R. J. Ivison, A. Kosowsky, Y.-T. Lin, D. Marsden, F. Menanteau, K. Moodley, G. Morales, M. D. Niemack, S. Oliver, L. A. Page, B. Partridge, E. D. Reese, F. Rojas, N. Sehgal, J. Sievers, C. Sifón, D. N. Spergel, S. T. Staggs, E. R. Switzer, M. P. Viero, E. J. Wollack, and M. B. ZemcovA measurement of the millimetre emission and the Sunyaev-Zel’dovich effect associated with low-frequency radio sources.
MNRAS445, pp. 460–478.
External Links: 1310.8281,
DocumentCited by: §10.2.
Gralla et al. (2011)M. B. Gralla, M. D. Gladders, H. K. C. Yee, and L. F. BarrientosConstraining the Redshift Evolution of First Radio Sources in RCS1 Galaxy Clusters.
ApJ734, pp. 103.
External Links: 1010.6011,
DocumentCited by: §10.2.
Grandis et al. (2025)S. Grandis, M. Costanzi, J. J. Mohr, L. E. Bleem, H.-Y. Wu, M. Aguena, S. Allam, F. Andrade-Oliveira, S. Bocquet, D. Brooks, A. Carnero Rosell, J. Carretero, L. N. da Costa, M. E. S. Pereira, T. M. Davis, S. Desai, H. T. Diehl, P. Doel, S. Everett, B. Flaugher, J. Frieman, J. García-Bellido, E. Gaztanaga, D. Gruen, R. A. Gruendl, G. Gutierrez, S. R. Hinton, J. Hlacacek-Larrondo, D. L. Hollowood, K. Honscheid, D. J. James, M. Klein, J. L. Marshall, J. Mena-Fernández, R. Miquel, A. Palmese, A. A. Plazas Malagón, C. L. Reichardt, A. K. Romer, S. Samuroff, D. Sanchez Cid, E. Sanchez, B. Santiago, A. Saro, I. Sevilla-Noarbe, M. Smith, M. Soares-Santos, M. W. Sommer, E. Suchyta, G. Tarle, C. To, D. L. Tucker, N. Weaverdyck, J. Weller, and P. WisemanSelection function of clusters in Dark Energy Survey year 3 data from cross-matching with South Pole Telescope detections.
A&A700, pp. A15.
External Links: Document,
2502.12914Cited by: Appendix B,
§10.2.
Green et al. (2017)T. S. Green, A. C. Edge, H. Ebeling, W. S. Burgett, P. W. Draper, N. Kaiser, R.-P. Kudritzki, E. A. Magnier, N. Metcalfe, R. J. Wainscoat, and C. WatersHiding in plain sight - recovering clusters of galaxies with the strongest AGN in their cores.
MNRAS465 (4), pp. 4872–4885.
External Links: Document,
1611.07996Cited by: §A.1.
Griffin et al. (2010)M. J. Griffin, A. Abergel, A. Abreu, P. A. R. Ade, P. André, J.-L. Augueres, T. Babbedge, Y. Bae, T. Baillie, J.-P. Baluteau, M. J. Barlow, G. Bendo, D. Benielli, J. J. Bock, P. Bonhomme, D. Brisbin, C. Brockley-Blatt, M. Caldwell, C. Cara, N. Castro-Rodriguez, R. Cerulli, P. Chanial, S. Chen, E. Clark, D. L. Clements, L. Clerc, J. Coker, D. Communal, L. Conversi, P. Cox, D. Crumb, C. Cunningham, F. Daly, G. R. Davis, P. de Antoni, J. Delderfield, N. Devin, A. di Giorgio, I. Didschuns, K. Dohlen, M. Donati, A. Dowell, C. D. Dowell, L. Duband, L. Dumaye, R. J. Emery, M. Ferlet, D. Ferrand, J. Fontignie, M. Fox, A. Franceschini, M. Frerking, T. Fulton, J. Garcia, R. Gastaud, W. K. Gear, J. Glenn, A. Goizel, D. K. Griffin, T. Grundy, S. Guest, L. Guillemet, P. C. Hargrave, M. Harwit, P. Hastings, E. Hatziminaoglou, M. Herman, B. Hinde, V. Hristov, M. Huang, P. Imhof, K. J. Isaak, U. Israelsson, R. J. Ivison, D. Jennings, B. Kiernan, K. J. King, A. E. Lange, W. Latter, G. Laurent, P. Laurent, S. J. Leeks, E. Lellouch, L. Levenson, B. Li, J. Li, J. Lilienthal, T. Lim, S. J. Liu, N. Lu, S. Madden, G. Mainetti, P. Marliani, D. McKay, K. Mercier, S. Molinari, H. Morris, H. Moseley, J. Mulder, M. Mur, D. A. Naylor, H. Nguyen, B. O’Halloran, S. Oliver, G. Olofsson, H.-G. Olofsson, R. Orfei, M. J. Page, I. Pain, P. Panuzzo, A. Papageorgiou, G. Parks, P. Parr-Burman, A. Pearce, C. Pearson, I. Pérez-Fournon, F. Pinsard, G. Pisano, J. Podosek, M. Pohlen, E. T. Polehampton, D. Pouliquen, D. Rigopoulou, D. Rizzo, I. G. Roseboom, H. Roussel, M. Rowan-Robinson, B. Rownd, P. Saraceno, M. Sauvage, R. Savage, G. Savini, E. Sawyer, C. Scharmberg, D. Schmitt, N. Schneider, B. Schulz, A. Schwartz, R. Shafer, D. L. Shupe, B. Sibthorpe, S. Sidher, A. Smith, A. J. Smith, D. Smith, L. Spencer, B. Stobie, R. Sudiwala, K. Sukhatme, C. Surace, J. A. Stevens, B. M. Swinyard, M. Trichas, T. Tourette, H. Triou, S. Tseng, C. Tucker, A. Turner, M. Vaccari, I. Valtchanov, L. Vigroux, E. Virique, G. Voellmer, H. Walker, R. Ward, T. Waskett, M. Weilert, R. Wesson, G. J. White, N. Whitehouse, C. D. Wilson, B. Winter, A. L. Woodcraft, G. S. Wright, C. K. Xu, A. Zavagno, M. Zemcov, L. Zhang, and E. ZoncaThe Herschel-SPIRE instrument and its in-flight performance.
A&A518, pp. L3.
External Links: 1005.5123,
DocumentCited by: §10.1.
Griffin et al. (2003)M. J. Griffin, B. M. Swinyard, and L. G. VigrouxSPIRE - Herschel’s Submillimetre Camera and Spectrometer.
In IR Space Telescopes and Instruments. Edited by John C. Mather . Proceedings of the SPIE, Volume 4850, pp. 686-697 (2003)., J. C. Mather (Ed.),
Presented at the Society of Photo-Optical Instrumentation Engineers (SPIE) Conference, Vol. 4850, pp. 686–697.
Cited by: §8.1.
Guns et al. (2021)S. Guns, A. Foster, C. Daley, A. Rahlin, N. Whitehorn, P. A. R. Ade, Z. Ahmed, E. Anderes, A. J. Anderson, M. Archipley, J. S. Avva, K. Aylor, L. Balkenhol, P. S. Barry, R. B. Thakur, K. Benabed, A. N. Bender, B. A. Benson, F. Bianchini, L. E. Bleem, F. R. Bouchet, L. Bryant, K. Byrum, J. E. Carlstrom, F. W. Carter, T. W. Cecil, C. L. Chang, P. Chaubal, G. Chen, H.-M. Cho, T.-L. Chou, J.-F. Cliche, T. M. Crawford, A. Cukierman, T. de Haan, E. V. Denison, K. Dibert, J. Ding, M. A. Dobbs, D. Dutcher, W. Everett, C. Feng, K. R. Ferguson, J. Fu, S. Galli, A. E. Gambrel, R. W. Gardner, N. Goeckner-Wald, R. Gualtieri, N. Gupta, R. Guyser, N. W. Halverson, A. H. Harke-Hosemann, N. L. Harrington, J. W. Henning, G. C. Hilton, E. Hivon, G. P. Holder, W. L. Holzapfel, J. C. Hood, D. Howe, N. Huang, K. D. Irwin, O. B. Jeong, M. Jonas, A. Jones, T. S. Khaire, L. Knox, A. M. Kofman, M. Korman, D. L. Kubik, S. Kuhlmann, C.-L. Kuo, A. T. Lee, E. M. Leitch, A. E. Lowitz, C. Lu, D. P. Marrone, S. S. Meyer, D. Michalik, M. Millea, J. Montgomery, A. Nadolski, T. Natoli, H. Nguyen, G. I. Noble, V. Novosad, Y. Omori, S. Padin, Z. Pan, P. Paschos, J. Pearson, K. A. Phadke, C. M. Posada, K. Prabhu, W. Quan, C. L. Reichardt, D. Riebel, B. Riedel, M. Rouble, J. E. Ruhl, J. T. Sayre, E. Schiappucci, E. Shirokoff, G. Smecher, J. A. Sobrin, A. A. Stark, J. Stephen, K. T. Story, A. Suzuki, K. L. Thompson, B. Thorne, C. Tucker, C. Umilta, L. R. Vale, J. D. Vieira, G. Wang, W. L. K. Wu, V. Yefremenko, K. W. Yoon, M. R. Young, and L. ZhangDetection of galactic and extragalactic millimeter-wavelength transient sources with SPT-3g.
The Astrophysical Journal916 (2), pp. 98.
External Links: Document,
LinkCited by: §2.
Gupta et al. (2017)N. Gupta, A. Saro, J. J. Mohr, B. A. Benson, S. Bocquet, R. Capasso, J. E. Carlstrom, I. Chiu, T. M. Crawford, T. de Haan, J. P. Dietrich, C. Gangkofner, W. L. Holzapfel, M. McDonald, D. Rapetti, and C. L. ReichardtHigh-frequency cluster radio galaxies: luminosity functions and implications for SZE-selected cluster samples.
MNRAS467 (3), pp. 3737–3750.
External Links: Document,
1605.05329Cited by: §10.2.
Hale et al. (2021)C. L. Hale, D. McConnell, A. J. M. Thomson, E. Lenc, G. H. Heald, A. W. Hotan, J. K. Leung, V. A. Moss, T. Murphy, J. Pritchard, E. M. Sadler, A. J. Stewart, and M. T. WhitingThe Rapid ASKAP Continuum Survey Paper II: First Stokes I Source Catalogue Data Release.
PASA38, pp. e058.
External Links: Document,
2109.00956Cited by: §10.1.1,
Figure 13.
Hashiguchi et al. (2023)A. Hashiguchi, Y. Toba, N. Ota, M. Oguri, N. Okabe, Y. Ueda, M. Imanishi, S. Yamada, T. Goto, S. Koyama, K. Lee, I. Mitsuishi, T. Nagao, A. J. Nishizawa, A. Noboriguchi, T. Oogi, K. Sakuta, M. Schramm, M. Shibata, Y. Terashima, T. Yamashita, A. Yanagawa, and A. YoshimotoAGN number fraction in galaxy groups and clusters at z ¡ 1.4 from the Subaru Hyper Suprime-Cam survey.
PASJ75 (6), pp. 1246–1261.
External Links: Document,
2309.01926Cited by: §10.2.
He et al. (2023)Z. He, N. Li, X. Cao, R. Li, H. Zou, and S. DyeDiscovering strongly lensed quasar candidates with catalogue-based methods from DESI Legacy Surveys.
A&A672, pp. A123.
External Links: Document,
2301.11080Cited by: §7.1.
Heitmann et al. (2019)K. Heitmann, H. Finkel, A. Pope, V. Morozov, N. Frontiere, S. Habib, E. Rangel, T. Uram, D. Korytov, H. Child, S. Flender, J. Insley, and S. RizziThe Outer Rim Simulation: A Path to Many-core Supercomputers.
ApJS245 (1), pp. 16.
External Links: Document,
1904.11970Cited by: §3.3.1.
Helly et al. (2026)J. C. Helly, R. J. McGibbon, J. Schaye, M. Schaller, W. McDonald, J. Braspenning, J. C. Broxterman, E. E. Costello, W. Elbers, V. J. Forouhar Moreno, C. S. Frenk, A. Jenkins, R. Kugel, I. G. McCarthy, J. Salcido, M. P. van Daalen, B. Vandenbroucke, and T. YangThe FLAMINGO simulations data release.
arXiv e-prints, pp. arXiv:2604.24324.
External Links: Document,
2604.24324Cited by: §1.
Hezaveh et al. (2013)Y. Hezaveh, K. Vanderlinde, G. Holder, and T. de HaanLensing Noise in Millimeter-wave Galaxy Cluster Surveys.
ApJ772, pp. 121.
External Links: 1210.6354,
DocumentCited by: §10.1.
High et al. (2010)F. W. High, B. Stalder, J. Song, P. A. R. Ade, K. A. Aird, S. S. Allam, R. Armstrong, W. A. Barkhouse, B. A. Benson, E. Bertin, S. Bhattacharya, L. E. Bleem, M. Brodwin, E. J. Buckley-Geer, J. E. Carlstrom, P. Challis, C. L. Chang, T. M. Crawford, A. T. Crites, T. de Haan, S. Desai, M. A. Dobbs, J. P. Dudley, R. J. Foley, E. M. George, M. Gladders, N. W. Halverson, M. Hamuy, S. M. Hansen, G. P. Holder, W. L. Holzapfel, J. D. Hrubes, M. Joy, R. Keisler, A. T. Lee, E. M. Leitch, H. Lin, Y.-T. Lin, A. Loehr, M. Lueker, D. Marrone, J. J. McMahon, J. Mehl, S. S. Meyer, J. J. Mohr, T. E. Montroy, N. Morell, C.-C. Ngeow, S. Padin, T. Plagge, C. Pryke, C. L. Reichardt, A. Rest, J. Ruel, J. E. Ruhl, K. K. Schaffer, L. Shaw, E. Shirokoff, R. C. Smith, H. G. Spieler, Z. Staniszewski, A. A. Stark, C. W. Stubbs, D. L. Tucker, K. Vanderlinde, J. D. Vieira, R. Williamson, W. M. Wood-Vasey, Y. Yang, O. Zahn, and A. ZentenoOptical Redshift and Richness Estimates for Galaxy Clusters Selected with the Sunyaev-Zel’dovich Effect from 2008 South Pole Telescope Observations.
ApJ723, pp. 1736–1747.
External Links: 1003.0005,
DocumentCited by: §4,
§7.
Hilton et al. (2018)M. Hilton, M. Hasselfield, C. Sifón, N. Battaglia, S. Aiola, V. Bharadwaj, J. R. Bond, S. K. Choi, D. Crichton, R. Datta, M. J. Devlin, J. Dunkley, R. Dünner, P. A. Gallardo, M. Gralla, A. D. Hincks, S.-P. P. Ho, J. Hubmayr, K. M. Huffenberger, J. P. Hughes, B. J. Koopman, A. Kosowsky, T. Louis, M. S. Madhavacheril, T. A. Marriage, L. Maurin, J. McMahon, H. Miyatake, K. Moodley, S. Næss, F. Nati, L. Newburgh, M. D. Niemack, M. Oguri, L. A. Page, B. Partridge, B. L. Schmitt, J. Sievers, D. N. Spergel, S. T. Staggs, H. Trac, A. van Engelen, E. M. Vavagiakis, and E. J. WollackThe Atacama Cosmology Telescope: The Two-season ACTPol Sunyaev-Zel\rsquodovich Effect Selected Cluster Catalog.
ApJS235, pp. 20.
External Links: 1709.05600,
DocumentCited by: §1.
Hilton et al. (2021)M. Hilton, C. Sifón, S. Naess, M. Madhavacheril, M. Oguri, E. Rozo, E. Rykoff, T. M. C. Abbott, S. Adhikari, M. Aguena, S. Aiola, S. Allam, S. Amodeo, A. Amon, J. Annis, B. Ansarinejad, C. Aros-Bunster, J. E. Austermann, S. Avila, D. Bacon, N. Battaglia, J. A. Beall, D. T. Becker, G. M. Bernstein, E. Bertin, T. Bhandarkar, S. Bhargava, J. R. Bond, D. Brooks, D. L. Burke, E. Calabrese, M. Carrasco Kind, J. Carretero, S. K. Choi, A. Choi, C. Conselice, L. N. da Costa, M. Costanzi, D. Crichton, K. T. Crowley, R. Dünner, E. V. Denison, M. J. Devlin, S. R. Dicker, H. T. Diehl, J. P. Dietrich, P. Doel, S. M. Duff, A. J. Duivenvoorden, J. Dunkley, S. Everett, S. Ferraro, I. Ferrero, A. Ferté, B. Flaugher, J. Frieman, P. A. Gallardo, J. García-Bellido, E. Gaztanaga, D. W. Gerdes, P. Giles, J. E. Golec, M. B. Gralla, S. Grandis, D. Gruen, R. A. Gruendl, J. Gschwend, G. Gutierrez, D. Han, W. G. Hartley, M. Hasselfield, J. C. Hill, G. C. Hilton, A. D. Hincks, S. R. Hinton, S. -P. P. Ho, K. Honscheid, B. Hoyle, J. Hubmayr, K. M. Huffenberger, J. P. Hughes, A. T. Jaelani, B. Jain, D. J. James, T. Jeltema, S. Kent, K. Knowles, B. J. Koopman, K. Kuehn, O. Lahav, M. Lima, Y. -T. Lin, M. Lokken, S. I. Loubser, N. MacCrann, M. A. G. Maia, T. A. Marriage, J. Martin, J. McMahon, P. Melchior, F. Menanteau, R. Miquel, H. Miyatake, K. Moodley, R. Morgan, T. Mroczkowski, F. Nati, L. B. Newburgh, M. D. Niemack, A. J. Nishizawa, R. L. C. Ogando, J. Orlowski-Scherer, L. A. Page, A. Palmese, B. Partridge, F. Paz-Chinchón, P. Phakathi, A. A. Plazas, N. C. Robertson, A. K. Romer, A. Carnero Rosell, M. Salatino, E. Sanchez, E. Schaan, A. Schillaci, N. Sehgal, S. Serrano, T. Shin, S. M. Simon, M. Smith, M. Soares-Santos, D. N. Spergel, S. T. Staggs, E. R. Storer, E. Suchyta, M. E. C. Swanson, G. Tarle, D. Thomas, C. To, H. Trac, J. N. Ullom, L. R. Vale, J. Van Lanen, E. M. Vavagiakis, J. De Vicente, R. D. Wilkinson, E. J. Wollack, Z. Xu, and Y. ZhangThe Atacama Cosmology Telescope: A Catalog of ¿4000 Sunyaev-Zel’dovich Galaxy Clusters.
ApJS253 (1), pp. 3.
External Links: Document,
2009.11043Cited by: §1.
Hoaglin et al. (2000)D.C. Hoaglin, F. Mosteller, and J.W. TukeyUnderstanding robust and exploratory data analysis.
Wiley Classics Library, Wiley.
External Links: ISBN 9780471384915,
LCCN 82008528,
LinkCited by: §10.1.
Högbom (1974)J. A. HögbomAperture Synthesis with a Non-Regular Distribution of Interferometer Baselines.
A&AS15, pp. 417–426.
External Links: LinkCited by: footnote 2.
Hood et al. (2023)I. Hood, A. Simpson, A. McDaniel, A. Foster, P. A. R. Ade, M. Ajello, A. J. Anderson, J. E. Austermann, J. A. Beall, A. N. Bender, B. A. Benson, F. Bianchini, L. E. Bleem, J. E. Carlstrom, C. L. Chang, P. Chaubal, H. C. Chiang, T. -L. Chou, R. Citron, C. C. Moran, T. M. Crawford, A. T. Crites, T. de Haan, M. A. Dobbs, W. Everett, J. Gallicchio, E. M. George, N. Gupta, N. W. Halverson, G. C. Hilton, G. P. Holder, W. L. Holzapfel, J. D. Hrubes, N. Huang, J. Hubmayr, K. D. Irwin, L. Knox, A. T. Lee, D. Li, A. Lowitz, G. Madejski, M. Malkan, J. J. McMahon, S. S. Meyer, J. Montgomery, T. Natoli, J. P. Nibarger, G. Noble, V. Novosad, Y. Omori, S. Padin, S. Patil, C. Pryke, C. L. Reichardt, J. E. Ruhl, B. R. Saliwanchik, K. K. Schaffer, C. Sievers, G. Smecher, A. A. Stark, C. Tucker, T. Veach, J. D. Vieira, G. Wang, N. Whitehorn, W. L. K. Wu, V. Yefremenko, J. A. Zebrowski, and L. ZhangSimultaneous Millimeter-wave, Gamma-Ray, and Optical Monitoring of the Blazar PKS 2326-502 during a Flaring State.
ApJ945 (2), pp. L23.
External Links: Document,
2302.14749Cited by: §2.
Hood et al. (2026)J. C. Hood, P. A. R. Ade, A. J. Anderson, M. Archipley, J. E. Austermann, J. A. Beall, A. N. Bender, B. A. Benson, F. Bianchini, L. E. Bleem, J. E. Carlstrom, C. L. Chang, P. Chaubal, H. C. Chiang, T-L. Chou, R. Citron, C. Corbett Moran, T. M. Crawford, A. T. Crites, T. de Haan, M. A. Dobbs, W. Everett, A. Foster, J. Gallicchio, E. M. George, N. Gupta, N. W. Halverson, G. C. Hilton, G. P. Holder, W. L. Holzapfel, J. D. Hrubes, N. Huang, J. Hubmayr, K. D. Irwin, E. Jarvela, L. Knox, A. T. Lee, D. Li, A. Lowitz, T. J. Maccarone, M. Malkan, J. J. McMahon, S. S. Meyer, J. Montgomery, T. Natoli, J. P. Nibarger, G. Noble, V. Novosad, S. Padin, S. Patil, K. A. Phadke, C. Pryke, C. L. Reichardt, J. E. Ruhl, B. R. Saliwanchik, K. K. Schaffer, C. Sievers, A. Simpson, G. Smecher, A. A. Stark, C. Tandoi, C. Tucker, T. Veach, J. D. Vieira, G. Wang, N. Whitehorn, W. L. K. Wu, V. Yefremenko, and J. A. ZebrowskiThe South Pole Telescope AGN Monitoring Campaign: First Release of SPTpol Bright AGN Light Curves.
arXiv e-prints, pp. arXiv:2604.02529.
External Links: Document,
2604.02529Cited by: §2.
Hoyt et al. (2026)T. J. Hoyt, I. S. Jang, W. L. Freedman, B. F. Madore, K. A. Owens, and A. J. LeeThe Chicago Carnegie Hubble Program: Improving the Calibration of Type Ia Supernovae with JWST Measurements of the Tip of the Red Giant Branch.
ApJ1002 (1), pp. 11.
External Links: DocumentCited by: §1.
Huang et al. (2020)N. Huang, L. E. Bleem, B. Stalder, P. A. R. Ade, S. W. Allen, A. J. Anderson, J. E. Austermann, J. S. Avva, J. A. Beall, A. N. Bender, B. A. Benson, F. Bianchini, S. Bocquet, M. Brodwin, J. E. Carlstrom, C. L. Chang, H. C. Chiang, R. Citron, C. C. Moran, T. M. Crawford, A. T. Crites, T. d. Haan, M. A. Dobbs, W. Everett, B. Floyd, J. Gallicchio, E. M. George, A. Gilbert, M. D. Gladders, S. Guns, N. Gupta, N. W. Halverson, N. Harrington, J. W. Henning, G. C. Hilton, G. P. Holder, W. L. Holzapfel, J. D. Hrubes, J. Hubmayr, K. D. Irwin, G. Khullar, L. Knox, A. T. Lee, D. Li, A. Lowitz, M. McDonald, J. J. McMahon, S. S. Meyer, L. M. Mocanu, J. Montgomery, A. Nadolski, T. Natoli, J. P. Nibarger, G. Noble, V. Novosad, S. Padin, S. Patil, C. Pryke, C. L. Reichardt, J. E. Ruhl, B. R. Saliwanchik, A. Saro, J. T. Sayre, K. K. Schaffer, K. Sharon, C. Sievers, G. Smecher, A. A. Stark, K. T. Story, C. Tucker, K. Vanderlinde, T. Veach, J. D. Vieira, G. Wang, N. Whitehorn, W. L. K. Wu, and V. YefremenkoGalaxy Clusters Selected via the Sunyaev-Zel’dovich Effect in the SPTpol 100-square-degree Survey.
AJ159 (3), pp. 110.
External Links: Document,
1907.09621Cited by: §1,
§3.3,
§6.1,
§7.2,
§8.1.
Ivezić et al. (2008)Ž. Ivezić, S. M. Kahn, J. A. Tyson, B. Abel, E. Acosta, R. Allsman, D. Alonso, Y. AlSayyad, S. F. Anderson, J. Andrew, and et al.LSST: from Science Drivers to Reference Design and Anticipated Data Products.
ArXiv e-prints.
External Links: 0805.2366Cited by: §2.
Ivezić et al. (2019)Ž. Ivezić, S. M. Kahn, J. A. Tyson, et al.LSST: From Science Drivers to Reference Design and Anticipated Data Products.
ApJ873 (2), pp. 111.
External Links: Document,
0805.2366Cited by: Appendix B.
Jonas and MeerKAT Team (2016)J. Jonas and MeerKAT TeamThe MeerKAT Radio Telescope.
In MeerKAT Science: On the Pathway to the SKA,
pp. 1.
External Links: DocumentCited by: §2.
Kaiser (1986)N. KaiserEvolution and clustering of rich clusters..
MNRAS222, pp. 323–345.
External Links: DocumentCited by: §6.1.
Kéruzoré et al. (2024)F. Kéruzoré, L. E. Bleem, N. Frontiere, N. Krishnan, M. Buehlmann, J. D. Emberson, S. Habib, and P. LarsenThe picasso gas model: Painting intracluster gas on gravity-only simulations.
The Open Journal of Astrophysics7, pp. 116.
External Links: Document,
2408.17445Cited by: §1.
Khullar et al. (2019)G. Khullar, L. E. Bleem, M. B. Bayliss, M. D. Gladders, B. A. Benson, M. McDonald, S. W. Allen, D. E. Applegate, M. L. N. Ashby, S. Bocquet, M. Brodwin, E. Bulbul, R. E. A. Canning, R. Capasso, I. Chiu, T. M. Crawford, T. de Haan, J. P. Dietrich, A. H. Gonzalez, J. Hlavacek-Larrondo, H. Hoekstra, W. L. Holzapfel, A. von der Linden, A. B. Mantz, S. Patil, C. L. Reichardt, A. Saro, K. Sharon, B. Stalder, S. A. Stanford, A. A. Stark, and V. StrazzulloSpectroscopic Confirmation of Five Galaxy Clusters at z > 1.25 in the 2500 deg SPT-SZ Survey.
ApJ870 (1), pp. 7.
External Links: Document,
1806.01962Cited by: 5th item.
Klein et al. (2019)M. Klein, S. Grandis, J. J. Mohr, M. Paulus, T. M. C. Abbott, J. Annis, S. Avila, E. Bertin, D. Brooks, E. Buckley-Geer, A. C. Rosell, M. C. Kind, J. Carretero, F. J. Castander, C. E. Cunha, C. B. D’Andrea, L. N. da Costa, J. De Vicente, S. Desai, H. T. Diehl, J. P. Dietrich, P. Doel, A. E. Evrard, B. Flaugher, P. Fosalba, J. Frieman, J. García-Bellido, E. Gaztanaga, P. A. Giles, D. Gruen, R. A. Gruendl, J. Gschwend, G. Gutierrez, W. G. Hartley, D. L. Hollowood, K. Honscheid, B. Hoyle, D. J. James, T. Jeltema, K. Kuehn, N. Kuropatkin, M. Lima, M. A. G. Maia, M. March, J. L. Marshall, F. Menanteau, R. Miquel, R. L. C. Ogando, A. A. Plazas, A. K. Romer, A. Roodman, E. Sanchez, V. Scarpine, R. Schindler, S. Serrano, I. Sevilla-Noarbe, M. Smith, R. C. Smith, M. Soares-Santos, F. Sobreira, E. Suchyta, M. E. C. Swanson, G. Tarle, D. Thomas, V. Vikram, and DES CollaborationA new RASS galaxy cluster catalogue with low contamination extending to z ̃ 1 in the DES overlap region.
MNRAS488 (1), pp. 739–769.
External Links: Document,
1812.09956Cited by: §4.1.1,
§4.1.2,
§4.
Klein et al. (2024a)M. Klein, J. J. Mohr, S. Bocquet, M. Aguena, S. W. Allen, O. Alves, B. Ansarinejad, M. L. N. Ashby, D. Bacon, M. Bayliss, B. A. Benson, L. E. Bleem, M. Brodwin, D. Brooks, E. Bulbul, D. L. Burke, R. E. A. Canning, J. E. Carlstrom, A. C. Rosell, J. Carretero, C. L. Chang, C. Conselice, M. Costanzi, A. T. Crites, L. N. da Costa, M. E. S. Pereira, T. M. Davis, J. De Vicente, S. Desai, T. de Haan, M. A. Dobbs, P. Doel, I. Ferrero, A. M. Flores, J. Frieman, E. M. George, G. Giannini, M. D. Gladders, A. H. Gonzalez, S. Grandis, D. Gruen, R. A. Gruendl, G. Gutierrez, N. W. Halverson, S. R. Hinton, G. P. Holder, D. L. Hollowood, W. L. Holzapfel, K. Honscheid, J. D. Hrubes, N. Huang, D. J. James, G. Khullar, K. Kim, L. Knox, R. Kraft, F. Kéruzoré, A. T. Lee, D. Luong-Van, G. Mahler, A. Mantz, D. P. Marrone, J. L. Marshall, M. McDonald, J. J. McMahon, J. Mena-Fernández, F. Menanteau, S. S. Meyer, R. Miquel, J. Myles, S. Padin, A. Pieres, A. A. Plazas Malagón, C. Pryke, C. L. Reichardt, K. Reil, J. Roberson, A. K. Romer, C. Romero, J. E. Ruhl, B. R. Saliwanchik, L. Salvati, E. Sanchez, A. Saro, K. K. Schaffer, T. Schrabback, M. Schubnell, I. Sevilla-Noarbe, K. Sharon, E. Shirokoff, M. Smith, T. Somboonpanyakul, B. Stalder, S. A. Stanford, A. A. Stark, V. Strazzullo, E. Suchyta, M. E. C. Swanson, G. Tarle, C. To, K. Vanderlinde, J. D. Vieira, A. von der Linden, N. Weaverdyck, R. Williamson, P. Wiseman, and M. YoungSPT-SZ MCMF: an extension of the SPT-SZ catalogue over the DES region.
MNRAS531 (4), pp. 3973–3990.
External Links: Document,
2309.09908Cited by: §1,
§4.1,
§4,
Figure 11,
§6,
§8.1,
Table 2.
Klein et al. (2024b)M. Klein, J. J. Mohr, and C. T. DaviesThe ACT-DR5 MCMF galaxy cluster catalog.
A&A690, pp. A322.
External Links: Document,
2406.14754Cited by: §4.1.1,
§4.1.2,
§9.1.
Klein et al. (2018)M. Klein, J. J. Mohr, S. Desai, H. Israel, S. Allam, A. Benoit-Lévy, D. Brooks, E. Buckley-Geer, A. Carnero Rosell, M. Carrasco Kind, C. E. Cunha, L. N. da Costa, J. P. Dietrich, T. F. Eifler, A. E. Evrard, J. Frieman, D. Gruen, R. A. Gruendl, G. Gutierrez, K. Honscheid, D. J. James, K. Kuehn, M. Lima, M. A. G. Maia, M. March, P. Melchior, F. Menanteau, R. Miquel, A. A. Plazas, K. Reil, A. K. Romer, E. Sanchez, B. Santiago, V. Scarpine, M. Schubnell, I. Sevilla-Noarbe, M. Smith, M. Soares-Santos, F. Sobreira, E. Suchyta, M. E. C. Swanson, G. Tarle, and DES CollaborationA multicomponent matched filter cluster confirmation tool for eROSITA: initial application to the RASS and DES-SV data sets.
MNRAS474 (3), pp. 3324–3343.
External Links: Document,
1706.06577Cited by: §4.1.2,
§4,
§4.
Kluge et al. (2024)M. Kluge, J. Comparat, A. Liu, F. Balzer, E. Bulbul, J. Ider Chitham, V. Ghirardini, C. Garrel, Y. E. Bahar, E. Artis, R. Bender, N. Clerc, T. Dwelly, M. H. Fabricius, S. Grandis, D. Hernández-Lang, G. J. Hill, J. Joshi, G. Lamer, A. Merloni, K. Nandra, F. Pacaud, P. Predehl, M. E. Ramos-Ceja, T. H. Reiprich, M. Salvato, J. S. Sanders, T. Schrabback, R. Seppi, S. Zelmer, A. Zenteno, and X. ZhangThe srg/erosita all-sky survey: optical identification and properties of galaxy clusters and groups in the western galactic hemisphere.
Astronomy & Astrophysics688, pp. A210.
External Links: ISSN 1432-0746,
Link,
DocumentCited by: §4.
Kornoelje et al. (2026)K. Kornoelje, L. E. Bleem, E. S. Rykoff, T. M. C. Abbott, P. A. R. Ade, M. Aguena, O. Alves, A. J. Anderson, F. Andrade-Oliveira, B. Ansarinejad, M. Archipley, M. L. N. Ashby, J. E. Austermann, D. Bacon, L. Balkenhol, M. B. Bayliss, J. A. Beall, K. Benabed, A. N. Bender, B. A. Benson, F. Bianchini, S. Bocquet, F. R. Bouchet, D. Brooks, D. L. Burke, M. Calzadilla, M. G. Campitiello, E. Camphuis, J. E. Carlstrom, A. Carnero Rosell, J. Carretero, C. L. Chang, P. Chaubal, H. C. Chiang, P. M. Chichura, A. Chokshi, T.-L. Chou, R. Citron, A. Coerver, C. C. Moran, M. Costanzi, T. M. Crawford, A. T. Crites, L. N. da Costa, C. Daley, T. de Haan, J. De Vicente, S. Desai, K. R. Dibert, M. A. Dobbs, P. Doel, M. Doohan, A. Doussot, D. Dutcher, W. Everett, S. Everett, C. Feng, K. R. Ferguson, J. Mena-Fernández, I. Ferrero, K. Fichman, B. Flaugher, B. Floyd, A. Foster, D. Friedel, J. Frieman, S. Galli, J. Gallicchio, A. E. Gambrel, J. García-Bellido, R. W. Gardner, R. Gassis, M. Gatti, F. Ge, E. M. George, G. Giannini, N. Goeckner-Wald, S. Grandis, D. Gruen, R. A. Gruendl, R. Gualtieri, F. Guidi, S. Guns, N. Gupta, G. Gutierrez, N. W. Halverson, S. R. Hinton, E. Hivon, G. P. Holder, D. L. Hollowood, W. L. Holzapfel, K. Honscheid, J. C. Hood, J. D. Hrubes, A. Hryciuk, N. Huang, J. Hubmayr, K. D. Irwin, D. J. James, F. Kéruzoré, A. R. Khalife, M. Klein, L. Knox, M. Korman, K. Kuehn, C.-L. Kuo, O. Lahav, A. T. Lee, S. Lee, K. Levy, D. Li, M. Lima, A. E. Lowitz, A. Lowitz, C. Lu, G. Mahler, A. Maniyar, J. L. Marshal, J. L. Marshall, E. S. Martsen, M. McDonald, J. J. McMahon, F. Menanteau, M. Millea, R. Miquel, J. J. Mohr, J. Montgomery, J. Myles, Y. Nakato, T. Natoli, J. P. Nibarger, G. I. Noble, V. Novosad, R. L. C. Ogando, Y. Omori, A. Ouellette, S. Padin, Z. Pan, S. Patil, M. E. S. Pereira, K. A. Phadke, A. Pieres, Plazas Malag&ooacute, A. A. n, A. W. Pollak, K. Prabhu, C. Pryke, W. Quan, M. Rahimi, A. Rahlin, C. L. Reichardt, M. Rodríguez-Monroy, A. K. Romer, M. Rouble, J. E. Ruhl, B. R. Saliwanchik, L. Salvati, S. Samuroff, E. Sanchez, A. Sarkar, A. Saro, K. K. Schaffer, E. Schiappucci, T. Schrabback, I. Sevilla-Noarbe, C. Sievers, G. Smecher, M. Smith, J. A. Sobrin, T. Somboonpanyakul, B. Stalder, A. A. Stark, V. Strazzullo, E. Suchyta, M. E. C. Swanson, C. Tandoi, G. Tarle, B. Thorne, C. To, C. Trendafilova, C. Tucker, C. Umilta, T. Veach, J. D. Vieira, M. Vincenzi, A. Vitrier, Y. Wan, G. Wang, N. Weaverdyck, J. Weller, N. Whitehorn, P. Wiseman, W. L. K. Wu, V. Yefremenko, M. R. Young, J. A. Zebrowski, and Y. ZhangThe SPT-deep Cluster Catalog: Sunyaev─Zel’dovich Selected Clusters from Combined SPT-3G and SPTpol Measurements over 100 Square Degrees.
ApJ1004 (1), pp. 48.
External Links: DocumentCited by: §1,
7th item,
Figure 1,
§2.4,
§3.3.2,
§3.3,
3rd item,
§4.2,
§4.4,
§4,
Figure 11,
§5.1,
§6,
§8.1,
Table 2.
Kumar et al. (2026)A. Kumar, M. C. Artale, A. D. Montero-Dorta, L. Guaita, J. Schaye, K. Lee, A. Pope, F. Rodriguez, E. Gawiser, H. S. Hwang, P. Troncoso Iribarren, J. Lee, S. Lee, C. Park, and Y. YangEvolution of submillimeter galaxies across cosmic-web environments.
arXiv e-prints, pp. arXiv:2602.11751.
External Links: Document,
2602.11751Cited by: §10.1.1.
Lagache et al. (2020)G. Lagache, M. Béthermin, L. Montier, P. Serra, and M. TucciImpact of polarised extragalactic sources on the measurement of CMB B-mode anisotropies.
A&A642, pp. A232.
External Links: Document,
1911.09466Cited by: §10.2.1,
§3.3.1.
Lau et al. (2025)E. T. Lau, D. Nagai, A. Farahi, T. Ishiyama, H. Miyatake, K. Osato, and M. ShirasakiBaryon Pasting the Uchuu Light-cone Simulation.
ApJ980 (1), pp. 122.
External Links: Document,
2411.00108Cited by: §1.
Lima and Hu (2005)M. Lima and W. HuSelf-calibration of cluster dark energy studies: Observable-mass distribution.
Phys. Rev. D72 (4), pp. 043006–+.
External Links: DocumentCited by: §11.
Lin et al. (2009)Y.-T. Lin, B. Partridge, J. C. Pober, K. E. Bouchefry, S. Burke, J. N. Klein, J. W. Coish, and K. M. HuffenbergerSpectral Energy Distribution of Radio Sources in Nearby Clusters of Galaxies: Implications for Sunyaev-Zel’Dovich Effect Surveys.
ApJ694, pp. 992–1009.
External Links: 0805.1750,
DocumentCited by: §10.2.
Liu et al. (2022)A. Liu, E. Bulbul, V. Ghirardini, T. Liu, M. Klein, N. Clerc, Y. Özsoy, M. E. Ramos-Ceja, F. Pacaud, J. Comparat, N. Okabe, Y. E. Bahar, V. Biffi, H. Brunner, M. Brüggen, J. Buchner, J. Ider Chitham, I. Chiu, K. Dolag, E. Gatuzz, J. Gonzalez, D. N. Hoang, G. Lamer, A. Merloni, K. Nandra, M. Oguri, N. Ota, P. Predehl, T. H. Reiprich, M. Salvato, T. Schrabback, J. S. Sanders, R. Seppi, and Q. ThibaudThe eROSITA Final Equatorial-Depth Survey (eFEDS). Catalog of galaxy clusters and groups.
A&A661, pp. A2.
External Links: Document,
2106.14518Cited by: §1.
Louis et al. (2025)T. Louis, A. La Posta, Z. Atkins, H. T. Jense, I. Abril-Cabezas, G. E. Addison, P. A. R. Ade, S. Aiola, T. Alford, D. Alonso, M. Amiri, R. An, J. E. Austermann, E. Barbavara, N. Battaglia, E. S. Battistelli, J. A. Beall, R. Bean, A. Beheshti, B. Beringue, T. Bhandarkar, E. Biermann, B. Bolliet, J. R. Bond, E. Calabrese, V. Capalbo, F. Carrero, S. Chen, G. Chesmore, H. Cho, S. K. Choi, S. E. Clark, N. F. Cothard, K. Coughlin, W. Coulton, D. Crichton, K. T. Crowley, O. Darwish, M. J. Devlin, S. Dicker, C. J. Duell, S. M. Duff, A. J. Duivenvoorden, J. Dunkley, R. Dunner, C. Embil Villagra, M. Fankhanel, G. S. Farren, S. Ferraro, A. Foster, R. Freundt, B. Fuzia, P. A. Gallardo, X. Garrido, M. Gerbino, S. Giardiello, A. Gill, J. Givans, V. Gluscevic, S. Goldstein, J. E. Golec, Y. Gong, Y. Guan, M. Halpern, I. Harrison, M. Hasselfield, E. Healy, S. Henderson, B. Hensley, C. Hervías-Caimapo, J. C. Hill, G. C. Hilton, M. Hilton, A. D. Hincks, R. Hložek, S. P. Ho, J. Hood, E. Hornecker, Z. B. Huber, J. Hubmayr, K. M. Huffenberger, J. P. Hughes, M. Ikape, K. Irwin, G. Isopi, N. Joshi, B. Keller, J. Kim, K. Knowles, B. J. Koopman, A. Kosowsky, D. Kramer, A. Kusiak, A. Laguë, V. Lakey, E. Lee, Y. Li, Z. Li, M. Limon, M. Lokken, M. Lungu, N. MacCrann, A. MacInnis, M. S. Madhavacheril, D. Maldonado, F. Maldonado, M. Mallaby-Kay, G. A. Marques, J. van Marrewijk, F. McCarthy, J. McMahon, Y. Mehta, F. Menanteau, K. Moodley, T. W. Morris, T. Mroczkowski, S. Naess, T. Namikawa, F. Nati, S. K. Nerval, L. Newburgh, A. Nicola, M. D. Niemack, M. R. Nolta, J. Orlowski-Scherer, L. Pagano, L. A. Page, S. Pandey, B. Partridge, K. Perez Sarmiento, H. Prince, R. Puddu, F. J. Qu, D. C. Ragavan, B. Ried Guachalla, K. K. Rogers, F. Rojas, T. Sakuma, E. Schaan, B. L. Schmitt, N. Sehgal, S. Shaikh, B. D. Sherwin, C. Sierra, J. Sievers, C. Sifón, S. Simon, R. Sonka, D. N. Spergel, S. T. Staggs, E. Storer, K. Surrao, E. R. Switzer, N. Tampier, R. Thornton, H. Trac, C. Tucker, J. Ullom, L. R. Vale, A. Van Engelen, J. Van Lanen, C. Vargas, E. M. Vavagiakis, K. Wagoner, Y. Wang, L. Wenzl, E. J. Wollack, K. Zheng, and The Atacama Cosmology Telescope collaborationThe Atacama Cosmology Telescope: DR6 power spectra, likelihoods and CDM parameters.
J. Cosmology Astropart. Phys2025 (11), pp. 062.
External Links: Document,
2503.14452Cited by: §1.
Mahler et al. (2025)G. Mahler, K. Sharon, M. Bayliss, Lindsey. E. Bleem, M. Brodwin, B. Floyd, R. Gassis, M. D. Gladders, G. Khullar, J. D. Remolina González, and A. SarkarStrong-lensing Analysis of SPT-CL J23254111 and SPT-CL J00492440, Two Powerful Cosmic Telescopes (R ¿ 40″) from the SPT Clusters Sample.
ApJ980 (1), pp. 48.
External Links: Document,
2501.03361Cited by: §7.
Martini et al. (2013)P. Martini, E. D. Miller, M. Brodwin, S. A. Stanford, A. H. Gonzalez, M. Bautz, R. C. Hickox, D. Stern, P. R. Eisenhardt, A. Galametz, D. Norman, B. T. Jannuzi, A. Dey, S. Murray, C. Jones, and M. J. I. BrownThe Cluster and Field Galaxy Active Galactic Nucleus Fraction at z = 1-1.5: Evidence for a Reversal of the Local Anticorrelation between Environment and AGN Fraction.
ApJ768 (1), pp. 1.
External Links: Document,
1302.6253Cited by: §A.2.
Martini et al. (2009)P. Martini, G. R. Sivakoff, and J. S. MulchaeyThe Evolution of Active Galactic Nuclei in Clusters of Galaxies to Redshift 1.3.
ApJ701 (1), pp. 66–85.
External Links: Document,
0906.1843Cited by: §A.2.
Mauch et al. (2003)T. Mauch, T. Murphy, H. J. Buttery, J. Curran, R. W. Hunstead, B. Piestrzynski, J. G. Robertson, and E. M. SadlerSUMSS: a wide-field radio imaging survey of the southern sky - ii. the source catalogue.
MNRAS342, pp. 1117–1130.
External Links: LinkCited by: §10.2.1.
McDonald et al. (2012)M. McDonald, M. Bayliss, B. A. Benson, R. J. Foley, J. Ruel, P. Sullivan, S. Veilleux, K. A. Aird, M. L. N. Ashby, M. Bautz, G. Bazin, L. E. Bleem, M. Brodwin, J. E. Carlstrom, C. L. Chang, H. M. Cho, A. Clocchiatti, T. M. Crawford, A. T. Crites, T. de Haan, S. Desai, M. A. Dobbs, J. P. Dudley, E. Egami, W. R. Forman, G. P. Garmire, E. M. George, M. D. Gladders, A. H. Gonzalez, N. W. Halverson, N. L. Harrington, F. W. High, G. P. Holder, W. L. Holzapfel, S. Hoover, J. D. Hrubes, C. Jones, M. Joy, R. Keisler, L. Knox, A. T. Lee, E. M. Leitch, J. Lieu, M. Lueker, D. Luong-Van, A. Mantz, D. P. Marrone, J. J. McMahon, J. Mehl, S. S. Meyer, E. D. Miller, L. Mocanu, J. J. Mohr, T. E. Montroy, S. S. Murray, T. Natoli, S. Padin, T. Plagge, C. Pryke, T. D. Rawle, C. L. Reichardt, A. Rest, M. Rex, J. E. Ruhl, B. R. Saliwanchik, A. Saro, J. T. Sayre, K. K. Schaffer, L. Shaw, E. Shirokoff, R. Simcoe, J. Song, H. G. Spieler, B. Stalder, Z. Staniszewski, A. A. Stark, K. Story, C. W. Stubbs, R. Suhada, A. van Engelen, K. Vanderlinde, J. D. Vieira, A. Vikhlinin, R. Williamson, O. Zahn, and A. ZentenoA Massive, Cooling-Flow-Induced Starburst in the Core of a Highly Luminous Galaxy Cluster.
Nature488, pp. 349–352.
External Links: 1208.2962,
DocumentCited by: §A.1.
Mead et al. (2020)A. J. Mead, T. Tröster, C. Heymans, L. Van Waerbeke, and I. G. McCarthyA hydrodynamical halo model for weak-lensing cross correlations.
Astronomy & Astrophysics641, pp. A130.
External Links: ISSN 1432-0746,
Link,
DocumentCited by: §1.
Meisner et al. (2022)A. M. Meisner, D. Lang, E. F. Schlafly, and D. J. Schlegel9-yr Deep Sky unWISE Coadds.
Research Notes of the American Astronomical Society6 (9), pp. 188.
External Links: DocumentCited by: §4.1.2,
§4.4,
§4.
Melin et al. (2006)J.-B. Melin, J. G. Bartlett, and J. DelabrouilleCatalog extraction in SZ cluster surveys: a matched filter approach.
A&A459, pp. 341–352.
External Links: arXiv:astro-ph/0602424,
DocumentCited by: §3.
Menanteau et al. (2010)F. Menanteau, J. P. Hughes, L. F. Barrientos, A. J. Deshpande, M. Hilton, L. Infante, R. Jimenez, A. Kosowsky, K. Moodley, D. Spergel, and L. VerdeSouthern Cosmology Survey. II. Massive Optically Selected Clusters from 70 Square Degrees of the Sunyaev-Zel’dovich Effect Common Survey Area.
ApJS191, pp. 340–351.
External Links: 1002.2226,
DocumentCited by: §3.1.
Merloni et al. (2024)A. Merloni, G. Lamer, T. Liu, M. E. Ramos-Ceja, H. Brunner, E. Bulbul, K. Dennerl, V. Doroshenko, M. J. Freyberg, S. Friedrich, E. Gatuzz, A. Georgakakis, F. Haberl, Z. Igo, I. Kreykenbohm, A. Liu, C. Maitra, A. Malyali, M. G. F. Mayer, K. Nandra, P. Predehl, J. Robrade, M. Salvato, J. S. Sanders, I. Stewart, D. Tubín-Arenas, P. Weber, J. Wilms, R. Arcodia, E. Artis, J. Aschersleben, A. Avakyan, C. Aydar, Y. E. Bahar, F. Balzer, W. Becker, K. Berger, T. Boller, W. Bornemann, M. Brüggen, M. Brusa, J. Buchner, V. Burwitz, F. Camilloni, N. Clerc, J. Comparat, D. Coutinho, S. Czesla, S. M. Dannhauer, L. Dauner, T. Dauser, J. Dietl, K. Dolag, T. Dwelly, K. Egg, E. Ehl, S. Freund, P. Friedrich, R. Gaida, C. Garrel, V. Ghirardini, A. Gokus, G. Grünwald, S. Grandis, I. Grotova, D. Gruen, A. Gueguen, S. Hämmerich, N. Hamaus, G. Hasinger, K. Haubner, D. Homan, J. Ider Chitham, W. M. Joseph, A. Joyce, O. König, D. M. Kaltenbrunner, A. Khokhriakova, W. Kink, C. Kirsch, M. Kluge, J. Knies, S. Krippendorf, M. Krumpe, J. Kurpas, P. Li, Z. Liu, N. Locatelli, M. Lorenz, S. Müller, E. Magaudda, C. Mannes, H. McCall, N. Meidinger, M. Michailidis, K. Migkas, D. Muñoz-Giraldo, B. Musiimenta, N. T. Nguyen-Dang, Q. Ni, A. Olechowska, N. Ota, F. Pacaud, T. Pasini, E. Perinati, A. M. Pires, C. Pommranz, G. Ponti, K. Poppenhaeger, G. Pühlhofer, A. Rau, M. Reh, T. H. Reiprich, W. Roster, S. Saeedi, A. Santangelo, M. Sasaki, J. Schmitt, P. C. Schneider, T. Schrabback, N. Schuster, A. Schwope, R. Seppi, M. M. Serim, S. Shreeram, E. Sokolova-Lapa, H. Starck, B. Stelzer, J. Stierhof, V. Suleimanov, C. Tenzer, I. Traulsen, J. Trümper, K. Tsuge, T. Urrutia, A. Veronica, S. G. H. Waddell, R. Willer, J. Wolf, M. C. H. Yeung, A. Zainab, F. Zangrandi, X. Zhang, Y. Zhang, and X. ZhengThe SRG/eROSITA all-sky survey. First X-ray catalogues and data release of the western Galactic hemisphere.
A&A682, pp. A34.
External Links: Document,
2401.17274Cited by: Figure 17,
§A.1,
§A.2,
Appendix A,
§2,
§8.3,
§8.3.
Miknaitis et al. (2007)G. Miknaitis, G. Pignata, A. Rest, W. M. Wood-Vasey, S. Blondin, P. Challis, R. C. Smith, C. W. Stubbs, N. B. Suntzeff, R. J. Foley, T. Matheson, J. L. Tonry, C. Aguilera, J. W. Blackman, A. C. Becker, A. Clocchiatti, R. Covarrubias, T. M. Davis, A. V. Filippenko, A. Garg, P. M. Garnavich, M. Hicken, S. Jha, K. Krisciunas, R. P. Kirshner, B. Leibundgut, W. Li, A. Miceli, G. Narayan, J. L. Prieto, A. G. Riess, M. E. Salvo, B. P. Schmidt, J. Sollerman, J. Spyromilio, and A. ZentenoThe ESSENCE Supernova Survey: Survey Optimization, Observations, and Supernova Photometry.
ApJ666, pp. 674–693.
External Links: arXiv:astro-ph/0701043,
DocumentCited by: §4.3.
Mo et al. (2020)W. Mo, A. Gonzalez, M. Brodwin, B. Decker, P. Eisenhardt, E. Moravec, S. A. Stanford, D. Stern, and D. WylezalekThe Massive and Distant Clusters of WISE Survey. VIII. Radio Activity in Massive Galaxy Clusters.
ApJ901 (2), pp. 131.
External Links: Document,
2008.07686Cited by: §10.2.
Moncelsi et al. (2020)L. Moncelsi, P. A. R. Ade, Z. Ahmed, M. Amiri, D. Barkats, R. Basu Thakur, C. A. Bischoff, J. J. Bock, V. Buza, J. R. Cheshire, J. Connors, J. Cornelison, M. Crumrine, A. J. Cukierman, E. V. Denison, M. Dierickx, L. Duband, M. Eiben, S. Fatigoni, J. P. Filippini, N. Goeckner-Wald, D. Goldfinger, J. A. Grayson, P. Grimes, G. Hall, M. Halpern, S. A. Harrison, S. Henderson, S. R. Hildebrandt, G. C. Hilton, J. Hubmayr, H. Hui, K. D. Irwin, J. H. Kang, K. S. Karkare, S. Kefeli, J. M. Kovac, C. L. Kuo, K. Lau, E. M. Leitch, K. G. Megerian, L. Minutolo, Y. Nakato, T. Namikawa, H. T. Nguyen, R. O’brient, S. Palladino, N. Precup, T. Prouve, C. Pryke, B. Racine, C. D. Reintsema, A. Schillaci, B. L. Schmitt, A. Soliman, T. St. Germaine, B. Steinbach, R. V. Sudiwala, K. L. Thompson, C. Tucker, A. D. Turner, C. Umiltà, A. G. Vieregg, A. Wandui, A. C. Weber, D. V. Wiebe, J. Willmert, W. L. K. Wu, E. Yang, K. W. Yoon, E. Young, C. Yu, L. Zeng, C. Zhang, and S. ZhangReceiver development for BICEP Array, a next-generation CMB polarimeter at the South Pole.
In Millimeter, Submillimeter, and Far-Infrared Detectors and Instrumentation for Astronomy X, J. Zmuidzinas and J. Gao (Eds.),
Society of Photo-Optical Instrumentation Engineers (SPIE) Conference Series, Vol. 11453, pp. 1145314.
External Links: Document,
2012.04047Cited by: §2.
More et al. (2024)A. More, R. Cañameras, A. T. Jaelani, Y. Shu, Y. Ishida, K. C. Wong, K. T. Inoue, S. Schuldt, and A. SonnenfeldSystematic comparison of neural networks used in discovering strong gravitational lenses.
MNRAS533 (1), pp. 525–537.
External Links: Document,
2405.12975Cited by: §7.1.
Mork et al. (2025)S. D. Mork, M. D. Gladders, G. Khullar, K. Sharon, N. Chicoine, A. P. Cloonan, H. Dahle, D. Garza, R. Glusman, K. Gozman, G. Horwath, B. C. Levine, O. Liang, D. Mahronic, V. Manwadkar, M. N. Martinez, A. Masegian, O. S. Matthews Acuña, K. Merz, Y. Pan, J. A. Sanchez, I. Sierra, D. J. Kavin Stein, E. Sukay, M. Tamargo-Arizmendi, K. Tavangar, R. Tu, G. Wagner, E. A. Zaborowski, Y. Zhang, and Cool-Lamps CollaborationCOOL-LAMPS. VII. Quantifying Strong-lens Scaling Relations with 177 Cluster-scale Strong Gravitational Lenses in DECaLS.
ApJ979 (2), pp. 184.
External Links: Document,
2401.08575Cited by: §7.1.
Muzzin et al. (2013)A. Muzzin, G. Wilson, R. Demarco, C. Lidman, J. Nantais, H. Hoekstra, H. K. C. Yee, and A. RetturaDiscovery of a Rich Cluster at z = 1.63 Using the Rest-frame 1.6 m ”Stellar Bump Sequence” Method.
ApJ767, pp. 39.
External Links: Document,
1301.5905Cited by: 7th item,
§4.
Naess et al. (2020)S. Naess, S. Aiola, J. E. Austermann, N. Battaglia, J. A. Beall, D. T. Becker, R. J. Bond, E. Calabrese, S. K. Choi, N. F. Cothard, K. T. Crowley, O. Darwish, R. Datta, E. V. Denison, M. Devlin, C. J. Duell, S. M. Duff, A. J. Duivenvoorden, J. Dunkley, R. Dünner, A. E. Fox, P. A. Gallardo, M. Halpern, D. Han, M. Hasselfield, J. C. Hill, G. C. Hilton, M. Hilton, A. D. Hincks, R. Hložek, S. P. Ho, J. Hubmayr, K. Huffenberger, J. P. Hughes, A. B. Kosowsky, T. Louis, M. S. Madhavacheril, J. McMahon, K. Moodley, F. Nati, J. P. Nibarger, M. D. Niemack, L. Page, B. Partridge, M. Salatino, E. Schaan, A. Schillaci, B. Schmitt, B. D. Sherwin, N. Sehgal, C. Sifón, D. Spergel, S. Staggs, J. Stevens, E. Storer, J. N. Ullom, L. R. Vale, A. Van Engelen, J. Van Lanen, E. M. Vavagiakis, E. J. Wollack, and Z. XuThe Atacama Cosmology Telescope: arcminute-resolution maps of 18 000 square degrees of the microwave sky from ACT 2008-2018 data combined with Planck.
J. Cosmology Astropart. Phys2020 (12), pp. 046.
External Links: Document,
2007.07290Cited by: §4.1.1.
Natarajan et al. (2024)P. Natarajan, L. L. R. Williams, M. Bradač, C. Grillo, A. Ghosh, K. Sharon, and J. WagnerStrong Lensing by Galaxy Clusters.
Space Sci. Rev.220 (2), pp. 19.
External Links: Document,
2403.06245Cited by: §7.
Navarro et al. (1996)J. F. Navarro, C. S. Frenk, and S. D. M. WhiteThe Structure of Cold Dark Matter Halos.
ApJ462, pp. 563–+.
External Links: arXiv:astro-ph/9508025,
DocumentCited by: §4.1.1.
Orlowski-Scherer et al. (2021)J. Orlowski-Scherer, L. Di Mascolo, T. Bhandarkar, A. Manduca, T. Mroczkowski, S. Amodeo, N. Battaglia, M. Brodwin, S. K. Choi, M. Devlin, S. Dicker, J. Dunkley, A. H. Gonzalez, D. Han, M. Hilton, K. Huffenberger, J. P. Hughes, A. MacInnis, K. Knowles, B. J. Koopman, I. Lowe, K. Moodley, F. Nati, M. D. Niemack, L. A. Page, B. Partridge, C. Romero, M. Salatino, A. Schillaci, N. Sehgal, C. Sifón, S. Staggs, S. A. Stanford, R. Thornton, E. M. Vavagiakis, E. J. Wollack, Z. Xu, and N. ZhuAtacama Cosmology Telescope measurements of a large sample of candidates from the Massive and Distant Clusters of WISE Survey. Sunyaev-Zeldovich effect confirmation of MaDCoWS candidates using ACT.
A&A653, pp. A135.
External Links: Document,
2105.00068Cited by: §10.2.
O’Donnell et al. (2022)J. H. O’Donnell, R. D. Wilkinson, H. T. Diehl, C. Aros-Bunster, K. Bechtol, S. Birrer, E. J. Buckley-Geer, A. Carnero Rosell, M. Carrasco Kind, L. N. da Costa, S. J. Gonzalez Lozano, R. A. Gruendl, M. Hilton, H. Lin, K. A. Lindgren, J. Martin, A. Pieres, E. S. Rykoff, I. Sevilla-Noarbe, E. Sheldon, C. Sifón, D. L. Tucker, B. Yanny, T. M. C. Abbott, M. Aguena, S. Allam, F. Andrade-Oliveira, J. Annis, E. Bertin, D. Brooks, D. L. Burke, J. Carretero, M. Costanzi, J. De Vicente, S. Desai, J. P. Dietrich, K. Eckert, S. Everett, I. Ferrero, B. Flaugher, P. Fosalba, J. Frieman, J. García-Bellido, E. Gaztanaga, D. W. Gerdes, D. Gruen, J. Gschwend, M. S. S. Gill, G. Gutierrez, S. R. Hinton, D. L. Hollowood, K. Honscheid, D. J. James, T. Jeltema, K. Kuehn, O. Lahav, M. Lima, M. A. G. Maia, J. L. Marshall, P. Melchior, F. Menanteau, R. Miquel, R. Morgan, B. Nord, R. L. C. Ogando, F. Paz-Chinchón, M. E. S. Pereira, A. A. Plazas Malagón, M. Rodriguez-Monroy, A. K. Romer, A. Roodman, E. Sanchez, V. Scarpine, M. Schubnell, S. Serrano, M. Smith, E. Suchyta, M. E. C. Swanson, G. Tarle, D. Thomas, C. To, and T. N. VargaThe Dark Energy Survey Bright Arcs Survey: Candidate Strongly Lensed Galaxy Systems from the Dark Energy Survey 5000 Square Degree Footprint.
ApJS259 (1), pp. 27.
External Links: Document,
2110.02418Cited by: §7.1.
Papovich (2008)C. PapovichThe Angular Clustering of Distant Galaxy Clusters.
ApJ676, pp. 206–217.
External Links: 0712.1819,
DocumentCited by: §4.
Persson et al. (2013)S. E. Persson, D. C. Murphy, S. Smee, C. Birk, A. J. Monson, A. Uomoto, E. Koch, S. Shectman, R. Barkhouser, J. Orndorff, R. Hammond, A. Harding, G. Scharfstein, D. Kelson, J. Marshall, and P. J. McCarthyFourStar: The Near-Infrared Imager for the 6.5m Baade Telescope at Las Campanas Observatory.
PASP125, pp. 654–682.
External Links: DocumentCited by: §4.3,
§4.
Planck Collaboration et al. (2016a)Planck Collaboration, R. Adam, P. A. R. Ade, N. Aghanim, M. I. R. Alves, M. Arnaud, M. Ashdown, J. Aumont, C. Baccigalupi, A. J. Banday, R. B. Barreiro, J. G. Bartlett, N. Bartolo, E. Battaner, K. Benabed, A. Benoît, A. Benoit-Lévy, J. -P. Bernard, M. Bersanelli, P. Bielewicz, J. J. Bock, A. Bonaldi, L. Bonavera, J. R. Bond, J. Borrill, F. R. Bouchet, F. Boulanger, M. Bucher, C. Burigana, R. C. Butler, E. Calabrese, J. -F. Cardoso, A. Catalano, A. Challinor, A. Chamballu, R. -R. Chary, H. C. Chiang, P. R. Christensen, D. L. Clements, S. Colombi, L. P. L. Colombo, C. Combet, F. Couchot, A. Coulais, B. P. Crill, A. Curto, F. Cuttaia, L. Danese, R. D. Davies, R. J. Davis, P. de Bernardis, A. de Rosa, G. de Zotti, J. Delabrouille, F. -X. Désert, C. Dickinson, J. M. Diego, H. Dole, S. Donzelli, O. Doré, M. Douspis, A. Ducout, X. Dupac, G. Efstathiou, F. Elsner, T. A. Enßlin, H. K. Eriksen, E. Falgarone, J. Fergusson, F. Finelli, O. Forni, M. Frailis, A. A. Fraisse, E. Franceschi, A. Frejsel, S. Galeotta, S. Galli, K. Ganga, T. Ghosh, M. Giard, Y. Giraud-Héraud, E. Gjerløw, J. González-Nuevo, K. M. Górski, S. Gratton, A. Gregorio, A. Gruppuso, J. E. Gudmundsson, F. K. Hansen, D. Hanson, D. L. Harrison, G. Helou, S. Henrot-Versillé, C. Hernández-Monteagudo, D. Herranz, S. R. Hildebrandt, E. Hivon, M. Hobson, W. A. Holmes, A. Hornstrup, W. Hovest, K. M. Huffenberger, G. Hurier, A. H. Jaffe, T. R. Jaffe, W. C. Jones, M. Juvela, E. Keihänen, R. Keskitalo, T. S. Kisner, R. Kneissl, J. Knoche, M. Kunz, H. Kurki-Suonio, G. Lagache, A. Lähteenmäki, J. -M. Lamarre, A. Lasenby, M. Lattanzi, C. R. Lawrence, M. Le Jeune, J. P. Leahy, R. Leonardi, J. Lesgourgues, F. Levrier, M. Liguori, P. B. Lilje, M. Linden-Vørnle, M. López-Caniego, P. M. Lubin, J. F. Macías-Pérez, G. Maggio, D. Maino, N. Mandolesi, A. Mangilli, M. Maris, D. J. Marshall, P. G. Martin, E. Martínez-González, S. Masi, S. Matarrese, P. McGehee, P. R. Meinhold, A. Melchiorri, L. Mendes, A. Mennella, M. Migliaccio, S. Mitra, M. -A. Miville-Deschênes, A. Moneti, L. Montier, G. Morgante, D. Mortlock, A. Moss, D. Munshi, J. A. Murphy, P. Naselsky, F. Nati, P. Natoli, C. B. Netterfield, H. U. Nørgaard-Nielsen, F. Noviello, D. Novikov, I. Novikov, E. Orlando, C. A. Oxborrow, F. Paci, L. Pagano, F. Pajot, R. Paladini, D. Paoletti, B. Partridge, F. Pasian, G. Patanchon, T. J. Pearson, O. Perdereau, L. Perotto, F. Perrotta, V. Pettorino, F. Piacentini, M. Piat, E. Pierpaoli, D. Pietrobon, S. Plaszczynski, E. Pointecouteau, G. Polenta, G. W. Pratt, G. Prézeau, S. Prunet, J. -L. Puget, J. P. Rachen, W. T. Reach, R. Rebolo, M. Reinecke, M. Remazeilles, C. Renault, A. Renzi, I. Ristorcelli, G. Rocha, C. Rosset, M. Rossetti, G. Roudier, J. A. Rubiño-Martín, B. Rusholme, M. Sandri, D. Santos, M. Savelainen, G. Savini, D. Scott, M. D. Seiffert, E. P. S. Shellard, L. D. Spencer, V. Stolyarov, R. Stompor, A. W. Strong, R. Sudiwala, R. Sunyaev, D. Sutton, A. -S. Suur-Uski, J. -F. Sygnet, J. A. Tauber, L. Terenzi, L. Toffolatti, M. Tomasi, M. Tristram, M. Tucci, J. Tuovinen, G. Umana, L. Valenziano, J. Valiviita, F. Van Tent, P. Vielva, F. Villa, L. A. Wade, B. D. Wandelt, I. K. Wehus, A. Wilkinson, D. Yvon, A. Zacchei, and A. ZoncaPlanck 2015 results. X. Diffuse component separation: Foreground maps.
A&A594, pp. A10.
External Links: Document,
1502.01588Cited by: Figure 1.
Planck Collaboration et al. (2014)Planck Collaboration, P. A. R. Ade, N. Aghanim, C. Armitage-Caplan, M. Arnaud, M. Ashdown, F. Atrio-Barandela, J. Aumont, H. Aussel, C. Baccigalupi, and et al.Planck 2013 results. XXIX. The Planck catalogue of Sunyaev-Zeldovich sources.
A&A571, pp. A29.
External Links: 1303.5089,
DocumentCited by: §3.1.
Planck Collaboration et al. (2016b)Planck Collaboration, P. A. R. Ade, N. Aghanim, M. Arnaud, M. Ashdown, J. Aumont, C. Baccigalupi, A. J. Banday, R. B. Barreiro, R. Barrena, J. G. Bartlett, N. Bartolo, E. Battaner, R. Battye, K. Benabed, A. Benoît, A. Benoit-Lévy, J. -P. Bernard, M. Bersanelli, P. Bielewicz, I. Bikmaev, H. Böhringer, A. Bonaldi, L. Bonavera, J. R. Bond, J. Borrill, F. R. Bouchet, M. Bucher, R. Burenin, C. Burigana, R. C. Butler, E. Calabrese, J. -F. Cardoso, P. Carvalho, A. Catalano, A. Challinor, A. Chamballu, R. -R. Chary, H. C. Chiang, G. Chon, P. R. Christensen, D. L. Clements, S. Colombi, L. P. L. Colombo, C. Combet, B. Comis, F. Couchot, A. Coulais, B. P. Crill, A. Curto, F. Cuttaia, H. Dahle, L. Danese, R. D. Davies, R. J. Davis, P. de Bernardis, A. de Rosa, G. de Zotti, J. Delabrouille, F. -X. Désert, C. Dickinson, J. M. Diego, K. Dolag, H. Dole, S. Donzelli, O. Doré, M. Douspis, A. Ducout, X. Dupac, G. Efstathiou, P. R. M. Eisenhardt, F. Elsner, T. A. Enßlin, H. K. Eriksen, E. Falgarone, J. Fergusson, F. Feroz, A. Ferragamo, F. Finelli, O. Forni, M. Frailis, A. A. Fraisse, E. Franceschi, A. Frejsel, S. Galeotta, S. Galli, K. Ganga, R. T. Génova-Santos, M. Giard, Y. Giraud-Héraud, E. Gjerløw, J. González-Nuevo, K. M. Górski, K. J. B. Grainge, S. Gratton, A. Gregorio, A. Gruppuso, J. E. Gudmundsson, F. K. Hansen, D. Hanson, D. L. Harrison, A. Hempel, S. Henrot-Versillé, C. Hernández-Monteagudo, D. Herranz, S. R. Hildebrandt, E. Hivon, M. Hobson, W. A. Holmes, A. Hornstrup, W. Hovest, K. M. Huffenberger, G. Hurier, A. H. Jaffe, T. R. Jaffe, T. Jin, W. C. Jones, M. Juvela, E. Keihänen, R. Keskitalo, I. Khamitov, T. S. Kisner, R. Kneissl, J. Knoche, M. Kunz, H. Kurki-Suonio, G. Lagache, J. -M. Lamarre, A. Lasenby, M. Lattanzi, C. R. Lawrence, R. Leonardi, J. Lesgourgues, F. Levrier, M. Liguori, P. B. Lilje, M. Linden-Vørnle, M. López-Caniego, P. M. Lubin, J. F. Macías-Pérez, G. Maggio, D. Maino, D. S. Y. Mak, N. Mandolesi, A. Mangilli, P. G. Martin, E. Martínez-González, S. Masi, S. Matarrese, P. Mazzotta, P. McGehee, S. Mei, A. Melchiorri, J. -B. Melin, L. Mendes, A. Mennella, M. Migliaccio, S. Mitra, M. -A. Miville-Deschênes, A. Moneti, L. Montier, G. Morgante, D. Mortlock, A. Moss, D. Munshi, J. A. Murphy, P. Naselsky, A. Nastasi, F. Nati, P. Natoli, C. B. Netterfield, H. U. Nørgaard-Nielsen, F. Noviello, D. Novikov, I. Novikov, M. Olamaie, C. A. Oxborrow, F. Paci, L. Pagano, F. Pajot, D. Paoletti, F. Pasian, G. Patanchon, T. J. Pearson, O. Perdereau, L. Perotto, Y. C. Perrott, F. Perrotta, V. Pettorino, F. Piacentini, M. Piat, E. Pierpaoli, D. Pietrobon, S. Plaszczynski, E. Pointecouteau, G. Polenta, G. W. Pratt, G. Prézeau, S. Prunet, J. -L. Puget, J. P. Rachen, W. T. Reach, R. Rebolo, M. Reinecke, M. Remazeilles, C. Renault, A. Renzi, I. Ristorcelli, G. Rocha, C. Rosset, M. Rossetti, G. Roudier, E. Rozo, J. A. Rubiño-Martín, C. Rumsey, B. Rusholme, E. S. Rykoff, M. Sandri, D. Santos, R. D. E. Saunders, M. Savelainen, G. Savini, M. P. Schammel, D. Scott, M. D. Seiffert, E. P. S. Shellard, T. W. Shimwell, L. D. Spencer, S. A. Stanford, D. Stern, V. Stolyarov, R. Stompor, A. Streblyanska, R. Sudiwala, R. Sunyaev, D. Sutton, A. -S. Suur-Uski, J. -F. Sygnet, J. A. Tauber, L. Terenzi, L. Toffolatti, M. Tomasi, D. Tramonte, M. Tristram, M. Tucci, J. Tuovinen, G. Umana, L. Valenziano, J. Valiviita, B. Van Tent, P. Vielva, F. Villa, L. A. Wade, B. D. Wandelt, I. K. Wehus, S. D. M. White, E. L. Wright, D. Yvon, A. Zacchei, and A. ZoncaPlanck 2015 results. XXVII. The second Planck catalogue of Sunyaev-Zeldovich sources.
A&A594, pp. A27.
External Links: Document,
1502.01598Cited by: §1,
Figure 11,
§6.
Planck Collaboration et al. (2020)Planck Collaboration, N. Aghanim, Y. Akrami, M. Ashdown, J. Aumont, C. Baccigalupi, M. Ballardini, A. J. Banday, R. B. Barreiro, N. Bartolo, S. Basak, R. Battye, K. Benabed, J. -P. Bernard, M. Bersanelli, P. Bielewicz, J. J. Bock, J. R. Bond, J. Borrill, F. R. Bouchet, F. Boulanger, M. Bucher, C. Burigana, R. C. Butler, E. Calabrese, J. -F. Cardoso, J. Carron, A. Challinor, H. C. Chiang, J. Chluba, L. P. L. Colombo, C. Combet, D. Contreras, B. P. Crill, F. Cuttaia, P. de Bernardis, G. de Zotti, J. Delabrouille, J. -M. Delouis, E. Di Valentino, J. M. Diego, O. Doré, M. Douspis, A. Ducout, X. Dupac, S. Dusini, G. Efstathiou, F. Elsner, T. A. Enßlin, H. K. Eriksen, Y. Fantaye, M. Farhang, J. Fergusson, R. Fernandez-Cobos, F. Finelli, F. Forastieri, M. Frailis, A. A. Fraisse, E. Franceschi, A. Frolov, S. Galeotta, S. Galli, K. Ganga, R. T. Génova-Santos, M. Gerbino, T. Ghosh, J. González-Nuevo, K. M. Górski, S. Gratton, A. Gruppuso, J. E. Gudmundsson, J. Hamann, W. Handley, F. K. Hansen, D. Herranz, S. R. Hildebrandt, E. Hivon, Z. Huang, A. H. Jaffe, W. C. Jones, A. Karakci, E. Keihänen, R. Keskitalo, K. Kiiveri, J. Kim, T. S. Kisner, L. Knox, N. Krachmalnicoff, M. Kunz, H. Kurki-Suonio, G. Lagache, J. -M. Lamarre, A. Lasenby, M. Lattanzi, C. R. Lawrence, M. Le Jeune, P. Lemos, J. Lesgourgues, F. Levrier, A. Lewis, M. Liguori, P. B. Lilje, M. Lilley, V. Lindholm, M. López-Caniego, P. M. Lubin, Y. -Z. Ma, J. F. Macías-Pérez, G. Maggio, D. Maino, N. Mandolesi, A. Mangilli, A. Marcos-Caballero, M. Maris, P. G. Martin, M. Martinelli, E. Martínez-González, S. Matarrese, N. Mauri, J. D. McEwen, P. R. Meinhold, A. Melchiorri, A. Mennella, M. Migliaccio, M. Millea, S. Mitra, M. -A. Miville-Deschênes, D. Molinari, L. Montier, G. Morgante, A. Moss, P. Natoli, H. U. Nørgaard-Nielsen, L. Pagano, D. Paoletti, B. Partridge, G. Patanchon, H. V. Peiris, F. Perrotta, V. Pettorino, F. Piacentini, L. Polastri, G. Polenta, J. -L. Puget, J. P. Rachen, M. Reinecke, M. Remazeilles, A. Renzi, G. Rocha, C. Rosset, G. Roudier, J. A. Rubiño-Martín, B. Ruiz-Granados, L. Salvati, M. Sandri, M. Savelainen, D. Scott, E. P. S. Shellard, C. Sirignano, G. Sirri, L. D. Spencer, R. Sunyaev, A. -S. Suur-Uski, J. A. Tauber, D. Tavagnacco, M. Tenti, L. Toffolatti, M. Tomasi, T. Trombetti, L. Valenziano, J. Valiviita, B. Van Tent, L. Vibert, P. Vielva, F. Villa, N. Vittorio, B. D. Wand elt, I. K. Wehus, M. White, S. D. M. White, A. Zacchei, and A. ZoncaPlanck 2018 results. VI. Cosmological parameters.
A&A641, pp. A6.
External Links: Document,
1807.06209Cited by: §1.
Pontoppidan et al. (2022)K. M. Pontoppidan, J. Barrientes, C. Blome, H. Braun, M. Brown, M. Carruthers, D. Coe, J. DePasquale, N. Espinoza, M. G. Marin, K. D. Gordon, A. Henry, L. Hustak, A. James, A. Jenkins, A. M. Koekemoer, S. LaMassa, D. Law, A. Lockwood, A. Moro-Martin, S. E. Mullally, A. Pagan, D. Player, C. Proffitt, C. Pulliam, L. Ramsay, S. Ravindranath, N. Reid, M. Robberto, E. Sabbi, L. Ubeda, M. Balogh, K. Flanagan, J. Gardner, H. Hasan, B. Meinke, and A. NotaThe JWST Early Release Observations.
ApJ936 (1), pp. L14.
External Links: Document,
2207.13067Cited by: §7.
Popovic et al. (2026)B. Popovic, P. Shah, W. D. Kenworthy, R. Kessler, T. M. Davis, A. Goobar, D. Scolnic, M. Vincenzi, P. Wiseman, R. Chen, E. Charleton, M. Acevedo, P. Armstrong, B. M. Boyd, D. Brout, R. Camilleri, J. Frieman, L. Galbany, M. Grayling, L. Kelsey, B. Rose, B. Sánchez, J. Lee, A. Möller, M. Smith, M. Sullivan, N. Shiamtanis, A. Alarcon, S. S. Allam, F. Andrade-Oliveira, S. Avila, D. Bacon, J. Blazek, S. Bocquet, D. Brooks, D. L. Burke, A. C. Rosell, J. Carretero, R. Cawthon, L. N. da Costa, M. E. d. S. Pereira, H. T. Diehl, S. Dodelson, P. Doel, S. Everett, C. Frohmaier, J. García-Bellido, D. Gruen, G. Gutierrez, K. Herner, S. R. Hinton, D. L. Hollowood, K. Honscheid, D. Huterer, D. J. James, N. Jeffrey, K. Kuehn, O. Lahav, S. Lee, C. Lidman, J. L. Marshall, J. Mena-Fernández, F. Menanteau, R. Miquel, J. Muir, J. Myles, R. L. C. Ogando, M. Paterno, A. A. P. Malagón, A. Porredon, J. Prat, R. C. Nichol, A. K. Romer, A. Roodman, E. Sanchez, D. S. Cid, I. Sevilla-Noarbe, E. Suchyta, M. E. C. Swanson, C. To, D. L. Tucker, A. R. Walker, N. Weaverdyck, and M. AguenaThe Dark Energy Survey supernova program: a reanalysis of cosmology results and evidence for evolving dark energy with an updated Type Ia supernova calibration.
MNRAS548 (4), pp. stag632.
External Links: Document,
2511.07517Cited by: §1,
§1.
Pordes et al. (2007)R. Pordes, D. Petravick, B. Kramer, D. Olson, M. Livny, A. Roy, P. Avery, K. Blackburn, T. Wenaus, F. Würthwein, I. Foster, R. Gardner, M. Wilde, A. Blatecky, J. McGee, and R. QuickThe open science grid.
In J. Phys. Conf. Ser.,
78, Vol. 78, pp. 012057.
External Links: DocumentCited by: Acknowledgments.
Postman et al. (2012)M. Postman, D. Coe, N. Benítez, L. Bradley, T. Broadhurst, M. Donahue, H. Ford, O. Graur, G. Graves, S. Jouvel, A. Koekemoer, D. Lemze, E. Medezinski, A. Molino, L. Moustakas, S. Ogaz, A. Riess, S. Rodney, P. Rosati, K. Umetsu, W. Zheng, A. Zitrin, M. Bartelmann, R. Bouwens, N. Czakon, S. Golwala, O. Host, L. Infante, S. Jha, Y. Jimenez-Teja, D. Kelson, O. Lahav, R. Lazkoz, D. Maoz, C. McCully, P. Melchior, M. Meneghetti, J. Merten, J. Moustakas, M. Nonino, B. Patel, E. Regös, J. Sayers, S. Seitz, and A. Van der WelThe Cluster Lensing and Supernova Survey with Hubble: An Overview.
ApJS199 (2), pp. 25.
External Links: Document,
1106.3328Cited by: §7.
Prabhu et al. (2024)K. Prabhu, S. Raghunathan, M. Millea, G. P. Lynch, P. A. R. Ade, E. Anderes, A. J. Anderson, B. Ansarinejad, M. Archipley, L. Balkenhol, K. Benabed, A. N. Bender, B. A. Benson, F. Bianchini, L. E. Bleem, F. R. Bouchet, L. Bryant, E. Camphuis, J. E. Carlstrom, T. W. Cecil, C. L. Chang, P. Chaubal, P. M. Chichura, A. Chokshi, T.-L. Chou, A. Coerver, T. M. Crawford, A. Cukierman, C. Daley, T. de Haan, K. R. Dibert, M. A. Dobbs, A. Doussot, D. Dutcher, W. Everett, C. Feng, K. R. Ferguson, K. Fichman, A. Foster, S. Galli, A. E. Gambrel, R. W. Gardner, F. Ge, N. Goeckner-Wald, R. Gualtieri, F. Guidi, S. Guns, N. W. Halverson, E. Hivon, G. P. Holder, W. L. Holzapfel, J. C. Hood, A. Hryciuk, N. Huang, F. Kéruzoré, L. Knox, M. Korman, K. Kornoelje, C.-L. Kuo, A. T. Lee, K. Levy, A. E. Lowitz, C. Lu, A. Maniyar, F. Menanteau, J. Montgomery, Y. Nakato, T. Natoli, G. I. Noble, V. Novosad, Y. Omori, S. Padin, Z. Pan, P. Paschos, K. A. Phadke, A. W. Pollak, W. Quan, M. Rahimi, A. Rahlin, C. L. Reichardt, M. Rouble, J. E. Ruhl, E. Schiappucci, G. Smecher, J. A. Sobrin, A. A. Stark, J. Stephen, A. Suzuki, C. Tandoi, K. L. Thompson, B. Thorne, C. Trendafilova, C. Tucker, C. Umilta, A. Vitrier, J. D. Vieira, Y. Wan, G. Wang, N. Whitehorn, W. L. K. Wu, V. Yefremenko, M. R. Young, and J. A. ZebrowskiTesting the CDM Cosmological Model with Forthcoming Measurements of the Cosmic Microwave Background with SPT-3G.
ApJ973 (1), pp. 4.
External Links: Document,
2403.17925Cited by: §11,
§2.
Predehl et al. (2021)P. Predehl, R. Andritschke, V. Arefiev, V. Babyshkin, O. Batanov, W. Becker, H. Böhringer, A. Bogomolov, T. Boller, K. Borm, W. Bornemann, H. Bräuninger, M. Brüggen, H. Brunner, M. Brusa, E. Bulbul, M. Buntov, V. Burwitz, W. Burkert, N. Clerc, E. Churazov, D. Coutinho, T. Dauser, K. Dennerl, V. Doroshenko, J. Eder, V. Emberger, T. Eraerds, A. Finoguenov, M. Freyberg, P. Friedrich, S. Friedrich, M. Fürmetz, A. Georgakakis, M. Gilfanov, S. Granato, C. Grossberger, A. Gueguen, P. Gureev, F. Haberl, O. Hälker, G. Hartner, G. Hasinger, H. Huber, L. Ji, A. v. Kienlin, W. Kink, F. Korotkov, I. Kreykenbohm, G. Lamer, I. Lomakin, I. Lapshov, T. Liu, C. Maitra, N. Meidinger, B. Menz, A. Merloni, T. Mernik, B. Mican, J. Mohr, S. Müller, K. Nandra, V. Nazarov, F. Pacaud, M. Pavlinsky, E. Perinati, E. Pfeffermann, D. Pietschner, M. E. Ramos-Ceja, A. Rau, J. Reiffers, T. H. Reiprich, J. Robrade, M. Salvato, J. Sanders, A. Santangelo, M. Sasaki, H. Scheuerle, C. Schmid, J. Schmitt, A. Schwope, A. Shirshakov, M. Steinmetz, I. Stewart, L. Strüder, R. Sunyaev, C. Tenzer, L. Tiedemann, J. Trümper, V. Voron, P. Weber, J. Wilms, and V. YaroshenkoThe eROSITA X-ray telescope on SRG.
A&A647, pp. A1.
External Links: Document,
2010.03477Cited by: §1.
Quan et al. (2026)W. Quan, E. Camphuis, C. Daley, N. Huang, Y. Omori, F. Guidi, E. Anderes, A. J. Anderson, B. Ansarinejad, M. Archipley, L. Balkenhol, D. R. Barron, K. Benabed, A. N. Bender, B. A. Benson, F. Bianchini, L. E. Bleem, S. Bocquet, F. R. Bouchet, M. G. Campitiello, J. E. Carlstrom, J. Carron, C. L. Chang, P. M. Chichura, A. Chokshi, T.-L. Chou, A. Coerver, T. M. Crawford, T. de Haan, K. R. Dibert, M. A. Dobbs, M. Doohan, D. Dutcher, C. Feng, K. R. Ferguson, N. C. Ferree, K. Fichman, A. Foster, S. Galli, A. E. Gambrel, A. K. Gao, F. Ge, S. Guns, N. W. Halverson, E. Hivon, G. P. Holder, W. L. Holzapfel, J. C. Hood, A. Hryciuk, T. Jhaveri, F. Kéruzoré, A. R. Khalife, L. Knox, K. Kornoelje, C.-L. Kuo, K. Levy, Y. Li, A. E. Lowitz, C. Lu, G. P. Lynch, T. J. Maccarone, A. S. Maniyar, E. S. Martsen, F. Menanteau, M. Millea, J. Montgomery, Y. Nakato, T. Natoli, A. Ouellette, Z. Pan, P. Paschos, K. A. Phadke, A. W. Pollak, K. Prabhu, S. Raghunathan, M. Rahimi, A. Rahlin, C. L. Reichardt, M. Rouble, J. E. Ruhl, A. C. Silva Oliveira, A. Simpson, J. A. Sobrin, A. A. Stark, J. Stephen, C. Tandoi, C. Trendafilova, J. D. Vieira, A. G. Vieregg, A. Vitrier, Y. Wan, N. Whitehorn, W. L. K. Wu, M. R. Young, and J. A. ZebrowskiSPT-3G D1: Maps of the millimeter-wave sky from 2019 and 2020 observations of the SPT-3G Main field.
arXiv e-prints, pp. arXiv:2603.20163.
External Links: Document,
2603.20163Cited by: §2.1,
§2.2,
§2.2,
§2.
Raghunathan et al. (2026)S. Raghunathan, P. A. R. Ade, D. Anbajagane, A. J. Anderson, B. Ansarinejad, M. Archipley, J. E. Austermann, L. Balkenhol, D. R. Barron, P. S. Barry, J. A. Beall, K. Benabed, A. N. Bender, B. A. Benson, F. Bianchini, L. E. Bleem, J. Bock, S. Bocquet, F. R. Bouchet, L. Bryant, E. Camphuis, M. G. Campitiello, J. E. Carlstrom, J. Carron, C. L. Chang, P. Chaubal, H. C. Chiang, P. M. Chichura, A. Chokshi, T.-L. Chou, R. Citron, A. Coerver, C. Corbett Moran, T. M. Crawford, A. T. Crites, C. Daley, T. de Haan, K. R. Dibert, M. A. Dobbs, M. Doohan, A. Doussot, D. Dutcher, W. Everett, C. Feng, K. R. Ferguson, N. C. Ferree, K. Fichman, A. Foster, S. Galli, J. Gallicchio, A. E. Gambrel, A. K. Gao, R. W. Gardner, F. Ge, E. M. George, N. Goeckner-Wald, R. Gualtieri, F. Guidi, S. Guns, N. Gupta, N. W. Halverson, E. Hivon, A. Y. Q. Ho, G. P. Holder, W. L. Holzapfel, J. C. Hood, J. D. Hrubes, A. Hryciuk, N. Huang, J. Hubmayr, K. D. Irwin, T. Jhaveri, F. Kéruzoré, A. R. Khalife, L. Knox, M. Korman, K. Kornoelje, C.-L. Kuo, A. T. Lee, K. Levy, Y. Li, D. Li, A. E. Lowitz, A. Lowitz, C. Lu, G. P. Lynch, T. J. Maccarone, A. S. Maniyar, E. S. Martsen, J. J. McMahon, F. Menanteau, M. Millea, J. Montgomery, Y. Nakato, T. Natoli, J. P. Nibarger, G. I. Noble, V. Novosad, Y. Omori, A. Ouellette, S. Padin, Z. Pan, P. Paschos, S. Patil, K. A. Phadke, A. W. Pollak, K. Prabhu, C. Pryke, W. Quan, M. Rahimi, A. Rahlin, C. L. Reichardt, M. Rouble, J. E. Ruhl, B. R. Saliwanchik, K. K. Schaffer, E. Schiappucci, C. Sievers, A. C. Silva Oliveira, A. Simpson, G. Smecher, J. A. Sobrin, A. A. Stark, J. Stephen, C. Tandoi, B. Thorne, C. Trendafilova, C. Tucker, C. Umilta, T. Veach, J. D. Vieira, A. G. Vieregg, M. P. Viero, A. Vitrier, Y. Wan, G. Wang, N. Whitehorn, W. L. K. Wu, V. Yefremenko, M. R. Young, J. A. Zebrowski, M. Zemcov, SPTpol, and SPT-3G CollaborationMeasurement of the Full Shape of the Thermal Sunyaev─Zel’dovich Power Spectrum from the South Pole Telescope and Herschel─SPIRE Observations.
ApJ1002 (1), pp. L22.
External Links: Document,
2602.10107Cited by: §2.
Raghunathan et al. (2019)S. Raghunathan, S. Patil, E. Baxter, B. A. Benson, L. E. Bleem, T. L. Chou, T. M. Crawford, G. P. Holder, T. McClintock, C. L. Reichardt, E. Rozo, T. N. Varga, T. M. C. Abbott, P. A. R. Ade, S. Allam, A. J. Anderson, J. Annis, J. E. Austermann, S. Avila, J. A. Beall, K. Bechtol, A. N. Bender, G. Bernstein, E. Bertin, F. Bianchini, D. Brooks, D. L. Burke, J. E. Carlstrom, J. Carretero, C. L. Chang, H. C. Chiang, H.-M. Cho, R. Citron, A. T. Crites, C. E. Cunha, L. N. da Costa, C. Davis, S. Desai, H. T. Diehl, J. P. Dietrich, M. A. Dobbs, P. Doel, T. F. Eifler, W. Everett, A. E. Evrard, B. Flaugher, P. Fosalba, J. Frieman, J. Gallicchio, J. García-Bellido, E. Gaztanaga, E. M. George, A. Gilbert, D. Gruen, R. A. Gruendl, J. Gschwend, N. Gupta, G. Gutierrez, T. de Haan, N. W. Halverson, N. Harrington, W. G. Hartley, J. W. Henning, G. C. Hilton, D. L. Hollowood, W. L. Holzapfel, K. Honscheid, Z. Hou, B. Hoyle, J. D. Hrubes, N. Huang, J. Hubmayr, K. D. Irwin, D. J. James, T. Jeltema, A. G. Kim, M. Carrasco Kind, L. Knox, A. Kovacs, K. Kuehn, N. Kuropatkin, A. T. Lee, T. S. Li, M. Lima, M. A. G. Maia, J. L. Marshall, J. J. McMahon, P. Melchior, F. Menanteau, S. S. Meyer, C. J. Miller, R. Miquel, L. Mocanu, J. Montgomery, A. Nadolski, T. Natoli, J. P. Nibarger, V. Novosad, S. Padin, A. A. Plazas, C. Pryke, D. Rapetti, A. K. Romer, A. Carnero Rosell, J. E. Ruhl, B. R. Saliwanchik, E. Sanchez, J. T. Sayre, V. Scarpine, K. K. Schaffer, M. Schubnell, S. Serrano, I. Sevilla-Noarbe, G. Smecher, R. C. Smith, M. Soares-Santos, F. Sobreira, A. A. Stark, K. T. Story, E. Suchyta, M. E. C. Swanson, G. Tarle, D. Thomas, C. Tucker, K. Vanderlinde, J. De Vicente, J. D. Vieira, G. Wang, N. Whitehorn, W. L. K. Wu, and Y. ZhangMass Calibration of Optically Selected DES Clusters Using a Measurement of CMB-cluster Lensing with SPTpol Data.
ApJ872, pp. 170.
External Links: 1810.10998,
DocumentCited by: §11.
Reichardt et al. (2021)C. L. Reichardt, S. Patil, P. A. R. Ade, A. J. Anderson, J. E. Austermann, J. S. Avva, E. Baxter, J. A. Beall, A. N. Bender, B. A. Benson, F. Bianchini, L. E. Bleem, J. E. Carlstrom, C. L. Chang, P. Chaubal, H. C. Chiang, T. L. Chou, R. Citron, C. C. Moran, T. M. Crawford, A. T. Crites, T. de Haan, M. A. Dobbs, W. Everett, J. Gallicchio, E. M. George, A. Gilbert, N. Gupta, N. W. Halverson, N. Harrington, J. W. Henning, G. C. Hilton, G. P. Holder, W. L. Holzapfel, J. D. Hrubes, N. Huang, J. Hubmayr, K. D. Irwin, L. Knox, A. T. Lee, D. Li, A. Lowitz, D. Luong-Van, J. J. McMahon, J. Mehl, S. S. Meyer, M. Millea, L. M. Mocanu, J. J. Mohr, J. Montgomery, A. Nadolski, T. Natoli, J. P. Nibarger, G. Noble, V. Novosad, Y. Omori, S. Padin, C. Pryke, J. E. Ruhl, B. R. Saliwanchik, J. T. Sayre, K. K. Schaffer, E. Shirokoff, C. Sievers, G. Smecher, H. G. Spieler, Z. Staniszewski, A. A. Stark, C. Tucker, K. Vanderlinde, T. Veach, J. D. Vieira, G. Wang, N. Whitehorn, R. Williamson, W. L. K. Wu, and V. YefremenkoAn Improved Measurement of the Secondary Cosmic Microwave Background Anisotropies from the SPT-SZ + SPTpol Surveys.
ApJ908 (2), pp. 199.
External Links: Document,
2002.06197Cited by: §3.3.1.
Reichardt et al. (2013)C. L. Reichardt, B. Stalder, L. E. Bleem, T. E. Montroy, K. A. Aird, K. Andersson, R. Armstrong, M. L. N. Ashby, M. Bautz, M. Bayliss, G. Bazin, B. A. Benson, M. Brodwin, J. E. Carlstrom, C. L. Chang, H. M. Cho, A. Clocchiatti, T. M. Crawford, A. T. Crites, T. de Haan, S. Desai, M. A. Dobbs, J. P. Dudley, R. J. Foley, W. R. Forman, E. M. George, M. D. Gladders, A. H. Gonzalez, N. W. Halverson, N. L. Harrington, F. W. High, G. P. Holder, W. L. Holzapfel, S. Hoover, J. D. Hrubes, C. Jones, M. Joy, R. Keisler, L. Knox, A. T. Lee, E. M. Leitch, J. Liu, M. Lueker, D. Luong-Van, A. Mantz, D. P. Marrone, M. McDonald, J. J. McMahon, J. Mehl, S. S. Meyer, L. Mocanu, J. J. Mohr, S. S. Murray, T. Natoli, S. Padin, T. Plagge, C. Pryke, A. Rest, J. Ruel, J. E. Ruhl, B. R. Saliwanchik, A. Saro, J. T. Sayre, K. K. Schaffer, L. Shaw, E. Shirokoff, J. Song, H. G. Spieler, Z. Staniszewski, A. A. Stark, K. Story, C. W. Stubbs, R. Šuhada, A. van Engelen, K. Vanderlinde, J. D. Vieira, A. Vikhlinin, R. Williamson, O. Zahn, and A. ZentenoGalaxy Clusters Discovered via the Sunyaev-Zel’dovich Effect in the First 720 Square Degrees of the South Pole Telescope Survey.
ApJ763, pp. 127.
External Links: 1203.5775,
DocumentCited by: §3.2,
§3.3.
Rest et al. (2005)A. Rest, C. Stubbs, A. C. Becker, G. A. Miknaitis, A. Miceli, R. Covarrubias, S. L. Hawley, R. C. Smith, N. B. Suntzeff, K. Olsen, J. L. Prieto, R. Hiriart, D. L. Welch, K. H. Cook, S. Nikolaev, M. Huber, G. Prochtor, A. Clocchiatti, D. Minniti, A. Garg, P. Challis, S. C. Keller, and B. P. SchmidtTesting LMC Microlensing Scenarios: The Discrimination Power of the SuperMACHO Microlensing Survey.
ApJ634, pp. 1103–1115.
External Links: DocumentCited by: §4.3.
Reuter et al. (2020)C. Reuter, J. D. Vieira, J. S. Spilker, A. Weiss, M. Aravena, M. Archipley, M. Béthermin, S. C. Chapman, C. De Breuck, C. Dong, W. B. Everett, J. Fu, T. R. Greve, C. C. Hayward, R. Hill, Y. Hezaveh, S. Jarugula, K. Litke, M. Malkan, D. P. Marrone, D. Narayanan, K. A. Phadke, A. A. Stark, and M. L. StrandetThe Complete Redshift Distribution of Dusty Star-forming Galaxies from the SPT-SZ Survey.
ApJ902 (1), pp. 78.
External Links: Document,
2006.14060Cited by: §2.
Riess and Breuval (2024)A. G. Riess and L. BreuvalThe Local Value of H.
In IAU Symposium, R. de Grijs, P. A. Whitelock, and M. Catelan (Eds.),
IAU Symposium, Vol. 376, pp. 15–29.
External Links: Document,
2308.10954Cited by: §1.
Rojas et al. (2022)K. Rojas, E. Savary, B. Clément, M. Maus, F. Courbin, C. Lemon, J. H. H. Chan, G. Vernardos, R. Joseph, R. Cañameras, and A. GalanSearch of strong lens systems in the Dark Energy Survey using convolutional neural networks.
A&A668, pp. A73.
External Links: Document,
2109.00014Cited by: §7.1.
Ruel et al. (2014)J. Ruel, G. Bazin, M. Bayliss, M. Brodwin, R. J. Foley, B. Stalder, K. A. Aird, R. Armstrong, M. L. N. Ashby, M. Bautz, B. A. Benson, L. E. Bleem, S. Bocquet, J. E. Carlstrom, C. L. Chang, S. C. Chapman, H. M. Cho, A. Clocchiatti, T. M. Crawford, A. T. Crites, T. de Haan, S. Desai, M. A. Dobbs, J. P. Dudley, W. R. Forman, E. M. George, M. D. Gladders, A. H. Gonzalez, N. W. Halverson, N. L. Harrington, F. W. High, G. P. Holder, W. L. Holzapfel, J. D. Hrubes, C. Jones, M. Joy, R. Keisler, L. Knox, A. T. Lee, E. M. Leitch, J. Liu, M. Lueker, D. Luong-Van, A. Mantz, D. P. Marrone, M. McDonald, J. J. McMahon, J. Mehl, S. S. Meyer, L. Mocanu, J. J. Mohr, T. E. Montroy, S. S. Murray, T. Natoli, D. Nurgaliev, S. Padin, T. Plagge, C. Pryke, C. L. Reichardt, A. Rest, J. E. Ruhl, B. R. Saliwanchik, A. Saro, J. T. Sayre, K. K. Schaffer, L. Shaw, E. Shirokoff, J. Song, R. Šuhada, H. G. Spieler, S. A. Stanford, Z. Staniszewski, A. A. Starsk, K. Story, C. W. Stubbs, A. van Engelen, K. Vanderlinde, J. D. Vieira, A. Vikhlinin, R. Williamson, O. Zahn, and A. ZentenoOptical Spectroscopy and Velocity Dispersions of Galaxy Clusters from the SPT-SZ Survey.
ApJ792, pp. 45.
External Links: 1311.4953,
DocumentCited by: 5th item.
Ruppin et al. (2021)F. Ruppin, M. McDonald, L. E. Bleem, S. W. Allen, B. A. Benson, M. Calzadilla, G. Khullar, and B. FloydStability of Cool Cores during Galaxy Cluster Growth: A Joint Chandra/SPT Analysis of 67 Galaxy Clusters along a Common Evolutionary Track Spanning 9 Gyr.
ApJ918 (2), pp. 43.
External Links: Document,
2012.14669Cited by: §3.2.
Rykoff et al. (2014)E. S. Rykoff, E. Rozo, M. T. Busha, C. E. Cunha, A. Finoguenov, A. Evrard, J. Hao, B. P. Koester, A. Leauthaud, B. Nord, M. Pierre, R. Reddick, T. Sadibekova, E. S. Sheldon, and R. H. WechslerredMaPPer. I. Algorithm and SDSS DR8 Catalog.
ApJ785, pp. 104.
External Links: 1303.3562,
DocumentCited by: §4.4,
§4.
Saliwanchik et al. (2015)B. R. Saliwanchik, T. E. Montroy, K. A. Aird, M. Bayliss, B. A. Benson, L. E. Bleem, S. Bocquet, M. Brodwin, J. E. Carlstrom, C. L. Chang, H. M. Cho, A. Clocchiatti, T. M. Crawford, A. T. Crites, T. de Haan, S. Desai, M. A. Dobbs, J. P. Dudley, R. J. Foley, W. R. Forman, E. M. George, M. D. Gladders, A. H. Gonzalez, N. W. Halverson, J. Hlavacek-Larrondo, G. P. Holder, W. L. Holzapfel, J. D. Hrubes, C. Jones, R. Keisler, L. Knox, A. T. Lee, E. M. Leitch, J. Liu, M. Lueker, D. Luong-Van, A. Mantz, D. P. Marrone, M. McDonald, J. J. McMahon, J. Mehl, S. S. Meyer, L. Mocanu, J. J. Mohr, S. S. Murray, D. Nurgaliev, S. Padin, A. Patej, C. Pryke, C. L. Reichardt, A. Rest, J. Ruel, J. E. Ruhl, A. Saro, J. T. Sayre, K. K. Schaffer, E. Shirokoff, H. G. Spieler, B. Stalder, S. A. Stanford, Z. Staniszewski, A. A. Stark, K. Story, C. W. Stubbs, K. Vanderlinde, J. D. Vieira, A. Vikhlinin, R. Williamson, O. Zahn, and A. ZentenoMeasurement of Galaxy Cluster Integrated Comptonization and Mass Scaling Relations with the South Pole Telescope.
ApJ779, pp. 137.
External Links: 1312.3015,
DocumentCited by: §3.2.
Sarazin (1986)C. L. SarazinX-ray emission from clusters of galaxies.
Reviews of Modern Physics58 (1), pp. 1–115.
External Links: DocumentCited by: §1.
Schaffer et al. (2011)K. K. Schaffer, T. M. Crawford, K. A. Aird, B. A. Benson, L. E. Bleem, J. E. Carlstrom, C. L. Chang, H. M. Cho, A. T. Crites, T. de Haan, M. A. Dobbs, E. M. George, N. W. Halverson, G. P. Holder, W. L. Holzapfel, S. Hoover, J. D. Hrubes, M. Joy, R. Keisler, L. Knox, A. T. Lee, E. M. Leitch, M. Lueker, D. Luong-Van, J. J. McMahon, J. Mehl, S. S. Meyer, J. J. Mohr, T. E. Montroy, S. Padin, T. Plagge, C. Pryke, C. L. Reichardt, J. E. Ruhl, E. Shirokoff, H. G. Spieler, B. Stalder, Z. Staniszewski, A. A. Stark, K. Story, K. Vanderlinde, J. D. Vieira, and R. WilliamsonThe First Public Release of South Pole Telescope Data: Maps of a 95 deg Field from 2008 Observations.
ApJ743, pp. 90.
External Links: 1111.7245,
DocumentCited by: §2.3.
Sfiligoi et al. (2009)I. Sfiligoi, D. C. Bradley, B. Holzman, P. Mhashilkar, S. Padhi, and F. WurthweinThe pilot way to grid resources using glideinwms.
In 2009 WRI World Congress on Computer Science and Information Engineering,
2, Vol. 2, pp. 428–432.
External Links: DocumentCited by: Acknowledgments.
Shaw et al. (2010)L. D. Shaw, D. Nagai, S. Bhattacharya, and E. T. LauImpact of Cluster Physics on the Sunyaev-Zel’dovich Power Spectrum.
ApJ725, pp. 1452–1465.
External Links: 1006.1945,
DocumentCited by: §3.2.
Sifón et al. (2013)C. Sifón, F. Menanteau, M. Hasselfield, T. A. Marriage, J. P. Hughes, L. F. Barrientos, J. González, L. Infante, G. E. Addison, A. J. Baker, N. Battaglia, J. R. Bond, D. Crichton, S. Das, M. J. Devlin, J. Dunkley, R. Dünner, M. B. Gralla, A. Hajian, M. Hilton, A. D. Hincks, A. B. Kosowsky, D. Marsden, K. Moodley, M. D. Niemack, M. R. Nolta, L. A. Page, B. Partridge, E. D. Reese, N. Sehgal, J. Sievers, D. N. Spergel, S. T. Staggs, R. J. Thornton, H. Trac, and E. J. WollackThe Atacama Cosmology Telescope: Dynamical Masses and Scaling Relations for a Sample of Massive Sunyaev-Zel’dovich Effect Selected Galaxy Clusters.
ApJ772, pp. 25.
External Links: 1201.0991,
DocumentCited by: 5th item.
Simons Observatory Collaboration (2019)Simons Observatory CollaborationThe Simons Observatory: science goals and forecasts.
J. Cosmology Astropart. Phys2019 (2), pp. 056.
External Links: Document,
1808.07445Cited by: §11.
Skrutskie et al. (2006)M. F. Skrutskie, R. M. Cutri, R. Stiening, M. D. Weinberg, S. Schneider, J. M. Carpenter, C. Beichman, R. Capps, T. Chester, J. Elias, J. Huchra, J. Liebert, C. Lonsdale, D. G. Monet, S. Price, P. Seitzer, T. Jarrett, J. D. Kirkpatrick, J. E. Gizis, E. Howard, T. Evans, J. Fowler, L. Fullmer, R. Hurt, R. Light, E. L. Kopan, K. A. Marsh, H. L. McCallon, R. Tam, S. Van Dyk, and S. WheelockThe Two Micron All Sky Survey (2MASS).
AJ131, pp. 1163–1183.
External Links: DocumentCited by: §4.3.
Sobrin et al. (2022)J. A. Sobrin, A. J. Anderson, A. N. Bender, B. A. Benson, D. Dutcher, A. Foster, N. Goeckner-Wald, J. Montgomery, A. Nadolski, A. Rahlin, P. A. R. Ade, Z. Ahmed, E. Anderes, M. Archipley, J. E. Austermann, J. S. Avva, K. Aylor, L. Balkenhol, P. S. Barry, R. B. Thakur, K. Benabed, F. Bianchini, L. E. Bleem, F. R. Bouchet, L. Bryant, K. Byrum, J. E. Carlstrom, F. W. Carter, T. W. Cecil, C. L. Chang, P. Chaubal, G. Chen, H. -M. Cho, T. -L. Chou, J. -F. Cliche, T. M. Crawford, A. Cukierman, C. Daley, T. d. Haan, E. V. Denison, K. Dibert, J. Ding, M. A. Dobbs, W. Everett, C. Feng, K. R. Ferguson, J. Fu, S. Galli, A. E. Gambrel, R. W. Gardner, R. Gualtieri, S. Guns, N. Gupta, R. Guyser, N. W. Halverson, A. H. Harke-Hosemann, N. L. Harrington, J. W. Henning, G. C. Hilton, E. Hivon, G. P. Holder, W. L. Holzapfel, J. C. Hood, D. Howe, N. Huang, K. D. Irwin, O. B. Jeong, M. Jonas, A. Jones, T. S. Khaire, L. Knox, A. M. Kofman, M. Korman, D. L. Kubik, S. Kuhlmann, C. -L. Kuo, A. T. Lee, E. M. Leitch, A. E. Lowitz, C. Lu, S. S. Meyer, D. Michalik, M. Millea, T. Natoli, H. Nguyen, G. I. Noble, V. Novosad, Y. Omori, S. Padin, Z. Pan, P. Paschos, J. Pearson, C. M. Posada, K. Prabhu, W. Quan, C. L. Reichardt, D. Riebel, B. Riedel, M. Rouble, J. E. Ruhl, B. Saliwanchik, J. T. Sayre, E. Schiappucci, E. Shirokoff, G. Smecher, A. A. Stark, J. Stephen, K. T. Story, A. Suzuki, C. Tandoi, K. L. Thompson, B. Thorne, C. Tucker, C. Umilta, L. R. Vale, K. Vanderlinde, J. D. Vieira, G. Wang, N. Whitehorn, W. L. K. Wu, V. Yefremenko, K. W. Yoon, and M. R. YoungThe Design and Integrated Performance of SPT-3G.
ApJS258 (2), pp. 42.
External Links: Document,
2106.11202Cited by: §2.
Somboonpanyakul et al. (2021)T. Somboonpanyakul, M. McDonald, M. Gaspari, B. Stalder, and A. A. StarkThe Clusters Hiding in Plain Sight (CHiPS) Survey: Complete Sample of Extreme BCG Clusters.
ApJ910 (1), pp. 60.
External Links: Document,
2101.01730Cited by: §A.1.
Song et al. (2012)J. Song, A. Zenteno, B. Stalder, S. Desai, L. E. Bleem, K. A. Aird, R. Armstrong, M. L. N. Ashby, M. Bayliss, G. Bazin, B. A. Benson, E. Bertin, M. Brodwin, J. E. Carlstrom, C. L. Chang, H. M. Cho, A. Clocchiatti, T. M. Crawford, A. T. Crites, T. de Haan, M. A. Dobbs, J. P. Dudley, R. J. Foley, E. M. George, D. Gettings, M. D. Gladders, A. H. Gonzalez, N. W. Halverson, N. L. Harrington, F. W. High, G. P. Holder, W. L. Holzapfel, S. Hoover, J. D. Hrubes, M. Joy, R. Keisler, L. Knox, A. T. Lee, E. M. Leitch, J. Liu, M. Lueker, D. Luong-Van, D. P. Marrone, M. McDonald, J. J. McMahon, J. Mehl, S. S. Meyer, L. Mocanu, J. J. Mohr, T. E. Montroy, T. Natoli, D. Nurgaliev, S. Padin, T. Plagge, C. Pryke, C. L. Reichardt, A. Rest, J. Ruel, J. E. Ruhl, B. R. Saliwanchik, A. Saro, J. T. Sayre, K. K. Schaffer, L. Shaw, E. Shirokoff, R. Šuhada, H. G. Spieler, S. A. Stanford, Z. Staniszewski, A. A. Stark, K. Story, C. W. Stubbs, A. van Engelen, K. Vanderlinde, J. D. Vieira, R. Williamson, and O. ZahnRedshifts, Sample Purity, and BCG Positions for the Galaxy Cluster Catalog from the First 720 Square Degrees of the South Pole Telescope Survey.
ApJ761, pp. 22.
External Links: 1207.4369,
DocumentCited by: §4,
§7.
Stalder et al. (2014)B. Stalder, A. A. Stark, S. M. Amato, J. Geary, S. A. Shectman, C. W. Stubbs, and A. SzentgyorgyiPISCO: the Parallel Imager for Southern Cosmology Observations.
In Ground-based and Airborne Instrumentation for Astronomy V,
Proc. SPIE, Vol. 9147, pp. 91473Y.
External Links: DocumentCited by: §7.2.
Staniszewski et al. (2009)Z. Staniszewski, P. A. R. Ade, K. A. Aird, B. A. Benson, L. E. Bleem, J. E. Carlstrom, C. L. Chang, H.-M. Cho, T. M. Crawford, A. T. Crites, T. de Haan, M. A. Dobbs, N. W. Halverson, G. P. Holder, W. L. Holzapfel, J. D. Hrubes, M. Joy, R. Keisler, T. M. Lanting, A. T. Lee, E. M. Leitch, A. Loehr, M. Lueker, J. J. McMahon, J. Mehl, S. S. Meyer, J. J. Mohr, T. E. Montroy, C.-C. Ngeow, S. Padin, T. Plagge, C. Pryke, C. L. Reichardt, J. E. Ruhl, K. K. Schaffer, L. Shaw, E. Shirokoff, H. G. Spieler, B. Stalder, A. A. Stark, K. Vanderlinde, J. D. Vieira, O. Zahn, and A. ZentenoGalaxy Clusters Discovered with a Sunyaev-Zel’dovich Effect Survey.
ApJ701, pp. 32–41.
External Links: 0810.1578,
DocumentCited by: §7.
Sun et al. (2022)F. Sun, E. Egami, S. Fujimoto, T. Rawle, F. E. Bauer, K. Kohno, I. Smail, P. G. Pérez-González, Y. Ao, S. C. Chapman, F. Combes, M. Dessauges-Zavadsky, D. Espada, J. González-López, A. M. Koekemoer, V. Kokorev, M. M. Lee, K. Morokuma-Matsui, A. M. Muñoz Arancibia, M. Oguri, R. Pelló, Y. Ueda, R. Uematsu, F. Valentino, P. Van der Werf, G. L. Walth, M. Zemcov, and A. ZitrinALMA Lensing Cluster Survey: ALMA-Herschel Joint Study of Lensed Dusty Star-forming Galaxies across z ≃ 0.5 - 6.
ApJ932 (2), pp. 77.
External Links: Document,
2204.07187Cited by: §10.1.
Sunyaev and Zeldovich (1980)R. A. Sunyaev and Y. B. ZeldovichThe velocity of clusters of galaxies relative to the microwave background - the possibility of its measurement.
MNRAS190, pp. 413.
External Links: LinkCited by: §3.3.1.
Sunyaev and Zel’dovich (1972)R. A. Sunyaev and Y. B. Zel’dovichThe Observations of Relic Radiation as a Test of the Nature of X-Ray Radiation from the Clusters of Galaxies.
Comments on Astrophysics and Space Physics4, pp. 173–+.
Cited by: §1,
§3.
Tandoi et al. (2024)C. Tandoi, S. Guns, A. Foster, P. A. R. Ade, A. J. Anderson, B. Ansarinejad, M. Archipley, L. Balkenhol, K. Benabed, A. N. Bender, B. A. Benson, F. Bianchini, L. E. Bleem, F. R. Bouchet, L. Bryant, E. Camphuis, J. E. Carlstrom, T. W. Cecil, C. L. Chang, P. Chaubal, P. M. Chichura, T.-L. Chou, A. Coerver, T. M. Crawford, A. Cukierman, C. Daley, T. de Haan, K. R. Dibert, M. A. Dobbs, A. Doussot, D. Dutcher, W. Everett, C. Feng, K. R. Ferguson, K. Fichman, S. Galli, A. E. Gambrel, R. W. Gardner, F. Ge, N. Goeckner-Wald, R. Gualtieri, F. Guidi, N. W. Halverson, E. Hivon, G. P. Holder, W. L. Holzapfel, J. C. Hood, N. Huang, F. Kéruzoré, L. Knox, M. Korman, K. Kornoelje, C.-L. Kuo, A. T. Lee, K. Levy, A. E. Lowitz, C. Lu, A. Maniyar, F. Menanteau, M. Millea, J. Montgomery, Y. Moon, Y. Nakato, T. Natoli, G. I. Noble, V. Novosad, Y. Omori, S. Padin, Z. Pan, P. Paschos, K. A. Phadke, K. Prabhu, Z. Qu, W. Quan, M. Rahimi, A. Rahlin, C. L. Reichardt, C. Reuter, M. Rouble, J. E. Ruhl, E. Schiappucci, G. Smecher, J. A. Sobrin, A. A. Stark, J. Stephen, A. Suzuki, K. L. Thompson, B. Thorne, C. Trendafilova, C. Tucker, C. Umilta, J. D. Vieira, Y. Wan, G. Wang, N. Whitehorn, W. L. K. Wu, V. Yefremenko, M. R. Young, and J. A. ZebrowskiFlaring Stars in a Nontargeted Millimeter-wave Survey with SPT-3G.
ApJ972 (1), pp. 6.
External Links: Document,
2401.13525Cited by: §2.
The LSST Dark Energy Science Collaboration et al. (2018)The LSST Dark Energy Science Collaboration, R. Mandelbaum, T. Eifler, R. Hložek, T. Collett, E. Gawiser, D. Scolnic, D. Alonso, H. Awan, R. Biswas, J. Blazek, P. Burchat, N. E. Chisari, I. Dell’Antonio, S. Digel, J. Frieman, D. A. Goldstein, I. Hook, Ž. Ivezić, S. M. Kahn, S. Kamath, D. Kirkby, T. Kitching, E. Krause, P. Leget, P. J. Marshall, J. Meyers, H. Miyatake, J. A. Newman, R. Nichol, E. Rykoff, F. J. Sanchez, A. Slosar, M. Sullivan, and M. A. TroxelThe LSST Dark Energy Science Collaboration (DESC) Science Requirements Document.
arXiv e-prints, pp. arXiv:1809.01669.
External Links: 1809.01669Cited by: Appendix B,
§1.
Thongkham et al. (2024a)K. Thongkham, A. H. Gonzalez, M. Brodwin, A. Trudeau, P. Eisenhardt, S. A. Stanford, E. Moravec, T. Connor, D. Stern, R. Spivey, and K. GarciaThe massive and distant clusters of wise survey 2: second data release.
The Astrophysical Journal976 (2), pp. 186.
External Links: Document,
LinkCited by: §9.3,
§9.
Thongkham et al. (2024b)K. Thongkham, A. H. Gonzalez, M. Brodwin, A. Trudeau, R. Saha, P. Eisenhardt, S. A. Stanford, E. Moravec, T. Connor, and D. SternThe Massive and Distant Clusters of WISE Survey 2: Equatorial First Data Release.
ApJ967 (2), pp. 123.
External Links: Document,
2403.16976Cited by: 6th item,
5th item.
Tody (1993)D. TodyIRAF in the Nineties.
In Astronomical Data Analysis Software and Systems II, R. J. Hanisch, R. J. V. Brissenden, and J. Barnes (Eds.),
Astronomical Society of the Pacific Conference Series, Vol. 52, pp. 173.
Cited by: §4.3.
Tucci et al. (2011)M. Tucci, L. Toffolatti, G. de Zotti, and E. Martínez-GonzálezHigh-frequency predictions for number counts and spectral properties of extragalactic radio sources. New evidence of a break at mm wavelengths in spectra of bright blazar sources.
A&A533, pp. A57.
External Links: 1103.5707,
DocumentCited by: §10.2.1.
Vanderlinde et al. (2010)K. Vanderlinde, T. M. Crawford, T. de Haan, J. P. Dudley, L. Shaw, P. A. R. Ade, K. A. Aird, B. A. Benson, L. E. Bleem, M. Brodwin, J. E. Carlstrom, C. L. Chang, A. T. Crites, S. Desai, M. A. Dobbs, R. J. Foley, E. M. George, M. D. Gladders, N. R. Hall, N. W. Halverson, F. W. High, G. P. Holder, W. L. Holzapfel, J. D. Hrubes, M. Joy, R. Keisler, L. Knox, A. T. Lee, E. M. Leitch, A. Loehr, M. Lueker, D. P. Marrone, J. J. McMahon, J. Mehl, S. S. Meyer, J. J. Mohr, T. E. Montroy, C.-C. Ngeow, S. Padin, T. Plagge, C. Pryke, C. L. Reichardt, A. Rest, J. Ruel, J. E. Ruhl, K. K. Schaffer, E. Shirokoff, J. Song, H. G. Spieler, B. Stalder, Z. Staniszewski, A. A. Stark, C. W. Stubbs, A. van Engelen, J. D. Vieira, R. Williamson, Y. Yang, O. Zahn, and A. ZentenoGalaxy Clusters Selected with the Sunyaev-Zel’dovich Effect from 2008 South Pole Telescope Observations.
ApJ722, pp. 1180–1196.
External Links: 1003.0003,
DocumentCited by: §10.1,
§5.1,
§5.1.
Vieira et al. (2013)J. D. Vieira, D. P. Marrone, S. C. Chapman, C. De Breuck, Y. D. Hezaveh, A. Weiβ, J. E. Aguirre, K. A. Aird, M. Aravena, M. L. N. Ashby, M. Bayliss, B. A. Benson, A. D. Biggs, L. E. Bleem, J. J. Bock, M. Bothwell, C. M. Bradford, M. Brodwin, J. E. Carlstrom, C. L. Chang, T. M. Crawford, A. T. Crites, T. de Haan, M. A. Dobbs, E. B. Fomalont, C. D. Fassnacht, E. M. George, M. D. Gladders, A. H. Gonzalez, T. R. Greve, B. Gullberg, N. W. Halverson, F. W. High, G. P. Holder, W. L. Holzapfel, S. Hoover, J. D. Hrubes, T. R. Hunter, R. Keisler, A. T. Lee, E. M. Leitch, M. Lueker, D. Luong-van, M. Malkan, V. McIntyre, J. J. McMahon, J. Mehl, K. M. Menten, S. S. Meyer, L. M. Mocanu, E. J. Murphy, T. Natoli, S. Padin, T. Plagge, C. L. Reichardt, A. Rest, J. Ruel, J. E. Ruhl, K. Sharon, K. K. Schaffer, L. Shaw, E. Shirokoff, J. S. Spilker, B. Stalder, Z. Staniszewski, A. A. Stark, K. Story, K. Vanderlinde, N. Welikala, and R. WilliamsonDusty starburst galaxies in the early Universe as revealed by gravitational lensing.
Nature495, pp. 344–347.
External Links: 1303.2723,
DocumentCited by: §2.
Vitrier et al. (2025)A. Vitrier, K. Fichman, L. Balkenhol, E. Camphuis, F. Guidi, A. R. Khalife, A. J. Anderson, B. Ansarinejad, M. Archipley, K. Benabed, A. N. Bender, B. A. Benson, F. Bianchini, L. E. Bleem, F. R. Bouchet, L. Bryant, M. G. Campitiello, J. E. Carlstrom, C. L. Chang, P. Chaubal, P. M. Chichura, A. Chokshi, T.-L. Chou, A. Coerver, T. M. Crawford, C. Daley, T. de Haan, K. R. Dibert, M. A. Dobbs, M. Doohan, A. Doussot, D. Dutcher, W. Everett, C. Feng, K. R. Ferguson, N. C. Ferree, A. Foster, S. Galli, A. E. Gambrel, R. W. Gardner, F. Ge, N. Goeckner-Wald, R. Gualtieri, S. Guns, N. W. Halverson, E. Hivon, G. P. Holder, W. L. Holzapfel, J. C. Hood, A. Hryciuk, N. Huang, F. Kéruzoré, L. Knox, M. Korman, K. Kornoelje, C.-L. Kuo, K. Levy, Y. Li, A. E. Lowitz, C. Lu, G. P. Lynch, A. Maniyar, E. S. Martsen, F. Menanteau, M. Millea, J. Montgomery, Y. Nakato, T. Natoli, G. I. Noble, Y. Omori, A. Ouellette, Z. Pan, P. Paschos, K. A. Phadke, A. W. Pollak, K. Prabhu, W. Quan, M. Rahimi, A. Rahlin, C. L. Reichardt, M. Rouble, J. E. Ruhl, E. Schiappucci, A. C. Silva Oliveira, A. Simpson, J. A. Sobrin, A. A. Stark, J. Stephen, C. Tandoi, B. Thorne, C. Trendafilova, C. Umilta, J. D. Vieira, Y. Wan, N. Whitehorn, W. L. K. Wu, M. R. Young, and J. A. ZebrowskiTowards constraining cosmological parameters with SPT-3G observations of 25% of the sky.
arXiv e-prints, pp. arXiv:2510.24669.
External Links: Document,
2510.24669Cited by: §11.
Walker et al. (2025)R. Walker, A. Kisare, and L. BleemImage Marker.
arXiv e-prints, pp. arXiv:2507.02153.
External Links: Document,
2507.02153Cited by: §7.2.
Wan et al. (2026)Y. Wan, J. D. Vieira, P. M. Chichura, T. J. Maccarone, A. J. Anderson, B. Ansarinejad, A. Anumarlapudi, M. Archipley, L. Balkenhol, P. S. Barry, K. Benabed, A. N. Bender, B. A. Benson, F. Bianchini, L. E. Bleem, F. R. Bouchet, L. Bryant, E. Camphuis, M. G. Campitiello, J. E. Carlstrom, C. L. Chang, P. Chaubal, A. Chokshi, T.-L. Chou, A. Coerver, T. M. Crawford, C. Daley, T. de Haan, K. R. Dibert, M. A. Dobbs, M. Doohan, A. Doussot, D. Dutcher, W. Everett, C. Feng, K. R. Ferguson, K. Fichman, A. Foster, S. Galli, A. E. Gambrel, R. W. Gardner, F. Ge, N. Goeckner-Wald, R. Gualtieri, F. Guidi, S. Guns, N. W. Halverson, E. Hivon, G. P. Holder, W. L. Holzapfel, J. C. Hood, A. Hryciuk, N. Huang, D. L. Kaplan, F. Kéruzoré, A. R. Khalife, L. Knox, M. Korman, K. Kornoelje, C.-L. Kuo, K. Levy, A. E. Lowitz, C. Lu, G. P. Lynch, A. Maniyar, E. S. Martsen, F. Menanteau, M. Millea, J. Montgomery, Y. Nakato, T. Natoli, G. I. Noble, Y. Omori, A. Ouellette, Z. Pan, P. Paschos, K. A. Phadke, A. W. Pollak, K. Prabhu, W. Quan, M. Rahimi, A. Rahlin, C. L. Reichardt, M. Rouble, J. E. Ruhl, E. Schiappucci, A. Simpson, J. A. Sobrin, A. A. Stark, J. Stephen, C. Tandoi, B. Thorne, C. Trendafilova, C. Umilta, A. Vitrier, N. Whitehorn, W. L. K. Wu, M. R. Young, and J. A. ZebrowskiDetection of Millimeter-wavelength Flares from Two Accreting White Dwarf Systems in the SPT-3G Galactic Plane Survey.
ApJ997 (2), pp. 133.
External Links: Document,
2509.08962Cited by: §2.
Wen and Han (2024)Z. L. Wen and J. L. HanA Catalog of 1.58 Million Clusters of Galaxies Identified from the DESI Legacy Imaging Surveys.
ApJS272 (2), pp. 39.
External Links: Document,
2404.02002Cited by: 6th item,
4th item,
§9.4,
§9.
Williamson et al. (2011)R. Williamson, B. A. Benson, F. W. High, K. Vanderlinde, P. A. R. Ade, K. A. Aird, K. Andersson, R. Armstrong, M. L. N. Ashby, M. Bautz, G. Bazin, E. Bertin, L. E. Bleem, M. Bonamente, M. Brodwin, J. E. Carlstrom, C. L. Chang, S. C. Chapman, A. Clocchiatti, T. M. Crawford, A. T. Crites, T. de Haan, S. Desai, M. A. Dobbs, J. P. Dudley, G. G. Fazio, R. J. Foley, W. R. Forman, G. Garmire, E. M. George, M. D. Gladders, A. H. Gonzalez, N. W. Halverson, G. P. Holder, W. L. Holzapfel, S. Hoover, J. D. Hrubes, C. Jones, M. Joy, R. Keisler, L. Knox, A. T. Lee, E. M. Leitch, M. Lueker, D. Luong-Van, D. P. Marrone, J. J. McMahon, J. Mehl, S. S. Meyer, J. J. Mohr, T. E. Montroy, S. S. Murray, S. Padin, T. Plagge, C. Pryke, C. L. Reichardt, A. Rest, J. Ruel, J. E. Ruhl, B. R. Saliwanchik, A. Saro, K. K. Schaffer, L. Shaw, E. Shirokoff, J. Song, H. G. Spieler, B. Stalder, S. A. Stanford, Z. Staniszewski, A. A. Stark, K. Story, C. W. Stubbs, J. D. Vieira, A. Vikhlinin, and A. ZentenoA Sunyaev-Zel’dovich-selected Sample of the Most Massive Galaxy Clusters in the 2500 deg South Pole Telescope Survey.
ApJ738, pp. 139–+.
External Links: 1101.1290,
DocumentCited by: §3.1.
Wright et al. (2025)A. H. Wright, B. Stölzner, M. Asgari, M. Bilicki, B. Giblin, C. Heymans, H. Hildebrandt, H. Hoekstra, B. Joachimi, K. Kuijken, S. Li, R. Reischke, M. von Wietersheim-Kramsta, M. Yoon, P. Burger, N. E. Chisari, J. de Jong, A. Dvornik, C. Georgiou, J. Harnois-Déraps, P. Jalan, A. J. William, S. Joudaki, G. F. Lesci, L. Linke, A. Loureiro, C. Mahony, M. Maturi, L. Miller, L. Moscardini, N. R. Napolitano, L. Porth, M. Radovich, P. Schneider, T. Tröster, E. Valentijn, A. Wittje, Z. Yan, and Y. ZhangKiDS-Legacy: Cosmological constraints from cosmic shear with the complete Kilo-Degree Survey.
A&A703, pp. A158.
External Links: Document,
2503.19441Cited by: §1.
Wright et al. (2010)E. L. Wright, P. R. M. Eisenhardt, A. K. Mainzer, M. E. Ressler, R. M. Cutri, T. Jarrett, J. D. Kirkpatrick, D. Padgett, R. S. McMillan, M. Skrutskie, S. A. Stanford, M. Cohen, R. G. Walker, J. C. Mather, D. Leisawitz, T. N. Gautier, I. McLean, D. Benford, C. J. Lonsdale, A. Blain, B. Mendez, W. R. Irace, V. Duval, F. Liu, D. Royer, I. Heinrichsen, J. Howard, M. Shannon, M. Kendall, A. L. Walsh, M. Larsen, J. G. Cardon, S. Schick, M. Schwalm, M. Abid, B. Fabinsky, L. Naes, and C.-W. TsaiThe Wide-field Infrared Survey Explorer (WISE): Mission Description and Initial On-orbit Performance.
AJ140, pp. 1868–1881.
External Links: 1008.0031,
DocumentCited by: §4.1.2,
§4.
Wright et al. (2019)E. L. Wright, P. R. M. Eisenhardt, A. K. Mainzer, M. E. Ressler, R. M. Cutri, T. Jarrett, J. D. Kirkpatrick, D. Padgett, R. S. McMillan, M. Skrutskie, S. A. Stanford, M. Cohen, R. G. Walker, J. C. Mather, D. Leisawitz, T. N. Gautier, I. McLean, D. Benford, C. J. Lonsdale, A. Blain, B. Mendez, W. R. Irace, V. Duval, F. Liu, D. Royer, I. Heinrichsen, J. Howard, M. Shannon, M. Kendall, A. L. Walsh, M. Larsen, J. G. Cardon, S. Schick, M. Schwalm, M. Abid, B. Fabinsky, L. Naes, and C. TsaiAllWISE Source Catalog.
In NASA IPAC DataSet, IRSA1,
External Links: DocumentCited by: §4.1.2.
Yamamoto et al. (2025)M. Yamamoto, M. R. Becker, E. Sheldon, M. Jarvis, R. A. Gruendl, F. Menanteau, E. S. Rykoff, S. Mau, T. Schutt, M. Gatti, M. A. Troxel, A. Amon, D. Anbajagane, G. M. Bernstein, D. Gruen, E. M. Huff, M. Tabbutt, A. Tong, B. Yanny, T. M. C. Abbott, M. Aguena, A. Alarcon, F. Andrade-Oliveira, K. Bechtol, J. Blazek, D. Brooks, A. C. Rosell, J. Carretero, C. Chang, A. Choi, M. Costanzi, M. Crocce, L. N. da Costa, T. M. Davis, J. De Vicente, S. Desai, H. T. Diehl, S. Dodelson, P. Doel, C. Doux, A. Drlica-Wagner, A. Ferté, B. Flaugher, P. Fosalba, J. Frieman, J. García-Bellido, E. Gaztanaga, G. Giannini, G. Gutierrez, W. G. Hartley, K. Herner, S. R. Hinton, D. L. Hollowood, K. Honscheid, D. Huterer, E. Krause, K. Kuehn, O. Lahav, M. Lima, J. L. Marshall, J. Mena-Fernández, R. Miquel, J. J. Mohr, J. Muir, J. Myles, R. L. C. Ogando, A. Pieres, A. A. P. Malagón, A. Porredon, J. Prat, M. Raveri, M. Rodriguez-Monroy, A. Roodman, S. Samuroff, E. Sanchez, D. Sanchez Cid, V. Scarpine, I. Sevilla-Noarbe, M. Smith, M. Soares-Santos, E. Suchyta, G. Tarle, V. Vikram, N. Weaverdyck, P. Wiseman, and Y. ZhangDark Energy Survey Year 6 results: cell-based coadds and METADETECTION weak lensing shape catalogue.
MNRAS543 (4), pp. 4156–4186.
External Links: Document,
2501.05665Cited by: §11.
Zenteno et al. (2025)A. Zenteno, M. Kluge, R. Kharkrang, D. Hernandez-Lang, G. Damke, A. Saro, R. Monteiro-Oliveira, E. R. Carrasco, M. Salvato, J. Comparat, M. Fabricius, J. Snigula, P. Arevalo, H. Cuevas, J. L. Nilo Castellon, A. Ramirez, S. Véliz Astudillo, M. Landriau, A. D. Myers, E. Schlafly, F. Valdes, B. A. Weaver, J. J. Mohr, S. Grandis, M. Klein, A. Liu, E. Bulbul, X. Zhang, J. S. Sanders, Y. E. Bahar, V. Ghirardini, M. E. Ramos, and F. BalzerThe dynamical state of eROSITA clusters and its impact on the brightest cluster galaxy luminosity.
A&A698, pp. A171.
External Links: Document,
2503.21066Cited by: §4.
Zhan and Reichardt (2026)J. Zhan and C. L. ReichardtBuilt-in precision: improving cluster cosmology through the self-calibration of a galaxy cluster sample.
Publications of the Astronomical Society of Australia43, pp. e003.
External Links: DocumentCited by: §11.
Appendix A Matches to Other eROSITA Samples
Figure 17: Redshift and mass distribution of matches between eRASS1 sources and the SPT-3G Main field cluster sample. For the clusters reported in 29 (Main CL) and 13 (PS CL) we adopt a matching radius of 3\arcmin. For sources from the Main (PS) and Supplemental (Supp. PS) catalog of 125 we adopt a 1\arcmin matching radius to reduce the probability of random associations to under 4%. We also exclude from these matches any SPT clusters also matched with X-ray clusters from the above catalogs. In total 1,348 eRASS1 clusters and 1,319 additional X-ray point sources have counterparts in the SPT-3G cluster sample. Masses and redshifts in this figure are from the SPT sample measurements.
In Sec. 8.3 we cross-matched the SPT-3G sample to the first cluster catalogs from the eRASS1 survey (29).
In this appendix we extend this matching to other eRASS1 source samples, focusing on associations with (1) the expanded X-ray cluster sample of 13 and (2) the full eRASS1 point source catalog of 125.
The large overlap in samples we show here briefly highlights the potential for future joint SPT-3G-eROSITA studies, particularly in understanding the evolution of X-ray AGN in clusters as well as in placing tighter constraints on biases in X-ray selection in moderate () resolution data owing to the mis-identification of clusters as X-ray point sources.
A.1 eROSITA Cluster Search in the eRASS1 Point Source Catalog
13 searched for clusters misclassified as X-ray point sources through a careful examination of the
point-like subset of the full eRASS1 source catalog (125).
Such misidentification can arise from multiple sources including X-ray bright AGN near cluster centers (77, e.g.,), difficulties in identifying faint sources as extended in the low SNR regime, or biased extent measurements from the presence of strong cool cores (120; 55; 172, e.g.,).
After examination the authors found an additional 8,347 clusters in the eROSITA data.
Of this new sample, 1,003 clusters are in the SPT-3G footprint, and 58% have matches within 3\arcmin in the SPT-3G cluster sample.
This is slightly lower than the 62% matched for the full eRASS1 cluster sample, and the median angular separation is higher (0\farcm49 v.s. 0\farcm36), potentially reflecting more false associations or more uncertainty in the X-ray ICM centroids.
13 classify the new cluster detections based on potential for the X-ray signal to be from Galactic, X-ray AGN, or ICM emission.
Of the clusters matched to the SPT-3G sample, 60% are in the most reliable classes (CLASS 4, potential cool core, or CLASS 5, most flux expected to come from ICM), compared to 40% in the unmatched sample; this fraction further raises to 68% with a stricter distance association of 1\arcmin to the SPT sample. The CLASS 4 and 5 systems also have a smaller median offset from SPT clusters () than the lower classes ().
A.2 SPT-3G Cluster Matches to the eRASS1 Point Source Catalog
The full eRASS1 point source sample contains over 1.25 million sources with detection likelihood greater than 5 (125); the reanalysis of 13 focused on the 576,154 sources with likelihood greater than 8 to improve the overall X-ray sample purity.
Here we match SPT-3G clusters to both the main catalog as well as the more contaminated supplemental catalog which contains detections with likelihoods between 5 and 6. The eRASS1 survey essentially covers the full SPT-3G Main Field footprint; using a million random locations within the field we estimate 4% (1.5%) probability of chance associations within 1\arcmin for sources in the eRASS1 main point source (supplemental) catalog.
Cross-matching these two lists using a 1\arcmin association radius to the SPT-3G cluster catalog (and excluding any SPT clusters with a more relaxed matching criterion of 3\arcmin to clusters in either 29 or 13), we find 921 matches from the main catalog (54% at X-ray detection likelihood less than 8, the examination threshold in previous reported work) and an additional 398 unique matched SPT cluster candidates using the supplemental catalog (a total of 1,319 additional matched SZ candidates); 90.5% of these candidates are confirmed as clusters through our optical analysis.
We plot the distribution of SPT-3G clusters matched to the different eRASS1 catalogs in Fig 17.
The median redshift of these matched samples increases from the primary cluster sample of 29 () to 13 () to purely point source matched clusters (/0.73, for main/supplementary point source sample).
We expect a large number of these cross-matches between SPT-3G clusters and the eRASS1 point source catalog to be cluster X-ray AGN—whose abundance in clusters have been shown in previous studies to have a strong evolution with redshift (118; 117; 28, see e.g.,)—but also expect the matches to contain a number of galaxy clusters misidentified in X-ray data.
As such, this large sample of cross-matched objects will provide a promising avenue for future explorations of both cluster AGN activity as well as the eROSITA selection function at high redshift.
Appendix B redMaPPer Richness-Mass Relation
We perform one additional characterization of the redMaPPer Y3 mass-richness relation, as the significant increase in sample matches and lowered mass threshold of the SPT-3G survey allows us to expand upon previous work presented in 21.
Here we follow the framework discussed in Sec. 5.2, however when evaluating the likelihood given by Eq. (15), we do not account for a richness cut according to , but instead we model the optical selection as . As in the study of MCMF richness, we consider the subsample of SPT-3G clusters with and .
Figure 18: Inferred scatter in the SZ and optical observables. Our baseline analysis using MCMF richness is shown in blue (same as in Fig. 9). The quantity that is well measured is the combined, quadrature-summed scatter , whereas the individual scatter components exhibit a narrow and bent degeneracy. The baseline redMaPPer analysis (orange) yields the largest amount of scatter. Limiting the redMaPPer analysis to higher-significance clusters reduces the total scatter (green), whereas applying a higher-significance cut also to the abundance analysis does not further shift the constraints (purple dashed).
We constrain the parameters of the richness-mass relation (Eq. 12) as follows:
(18)
(19)
(20)
(21)
The amplitude (considering the different pivots), redshift evolution, and scatter are consistent with 21, while the slope has decreased by ; the error bars on the parameters are reduced by 2.
Comparing to MCMF (Table 1), the amplitude is lower than that of the MCMF richness-mass relation owing to the different definitions of richness (MCMF probes further down in the cluster luminosity function and with different radial cuts). Similarly, the evolution with mass and redshift differ. The marginalized scatter in redMaPPer richness appears to be significantly lower than that in MCMF richness. We plot the posterior distributions of the SZ and richness scatter in Fig. 18.
The figure suggests that the lower scatter in redMaPPer richness is compensated by a larger scatter in . Note that our analysis is mostly sensitive to the total observable-to-observable scatter
(22)
The posterior distributions in Fig. 18 suggest that there is significantly more scatter between redMaPPer richness and the SZ significance than there is between the MCMF richness and the SZ significance (orange vs. blue distributions). To investigate further, we restrict the analysis of redMaPPer richness only to SPT-3G clusters with . The constraint on moves halfway to the value we obtain with MCMF (and is generally comparable to the simplified analysis of Sec. 9.5 for higher SZ mass systems), while the constraints on all other parameters (, , , , , and ) remain essentially unchanged. This finding might suggest that some element of the analysis of the sample is inadequate. We now restrict the entire SPT-3G sample to (instead of just discarding all redMaPPer measurements for clusters). The constraints on scatter remain essentially unchanged (green vs. purple dashed distributions in Fig. 18) as do the constraints on all other parameters except for which shifts up by about . The stability of the SZ-mass relation to these sample cuts suggests that there might be room for a more sophisticated modeling of the redMaPPer richness-mass relation (76, c.f.,); further work here will be important in the context of upcoming optical cluster surveys with the Vera Rubin Observatory Legacy Survey of Space and Time (98; 180, LSST;).
\onecolumngrid
Appendix C Column Descriptions
\colheadColumn
\colheadSymbol
\colheadDescription
SPT_ID
\nodata
Cluster name in the format SPT-CL JHHMM.mDDMM.m, except for clusters published previously with SPT designation, which are labeled as SPT-CL JHHMMDDMM to be consistent with previous IAU naming scheme
RA
\nodata
Right ascension (degrees)
DEC
\nodata
Declination (degrees)
XI
SPT detection significance
THETA_CORE
Filter core size corresponding to detection
YSZ
\nodata
Integrated Comptonization measured within
YSZ_UNC
\nodata
1 Uncertainty on integrated Comptonization measured within
PS_FLAG
\nodata
(1) if cluster within 4\arcmin of a bright source mJy at 150 GHz, (2) if measurement impacted by nearby source/massive cluster, (3) if both
REDSHIFT
Redshift
REDSHIFT_UNC
Uncertainty on redshift
REDSHIFT_SOURCE
\nodata
Source of redshift (spectroscopic, MCMF, Spitzer, etc.)
SPECZ
\nodata
Binary, 1 if redshift is spectroscopic, 0 if not
SPECZ_REF
\nodata
Bibliographic reference for spectroscopic redshift
M500C
Mass, units of
M500C_UERR
\nodata
Upper 1 uncertainty on the mass estimate
M500C_LERR
\nodata
Lower 1 uncertainty on the mass estimate
LAMBDA
MCMF richness (where available)
LAMBDA_UNC
\nodata
1 uncertainty on MCMF richness
FCONT
Contamination estimation for structure associated with redshift assignment
MCMF_MASK1
\nodata
Fraction of optical data within 1\arcmin masked in MCMF analysis
MCMF_MASK2
\nodata
Fraction of optical data within 2\arcmin masked in MCMF analysis
LOS
\nodata
Binary flag identifying systems with multiple significant optical/IR structures along the line of sight
LAMBDA2
\nodata
Richness estimation of secondary structure
LAMBDA2_UNC
\nodata
Uncertainty on richness estimation of secondary structure
REDSHIFT2
\nodata
Redshift estimate for secondary structure
REDSHIFT2_UNC
\nodata
Redshift uncertainty for secondary structure
FCONT2
\nodata
Contamination estimate for secondary structure
STRONG_LENS
\nodata
Gravitational strong lens flag, (1) Optical strong lens flagged by our visual analysis, (2) Strong lens from the literature, (3) if both.
STRONG_LENS_REF
\nodata
Bibliographic reference for strong lens
DSFG_FLAG
\nodata
(1) if DSFG within 30\arcsec of SZ centroid, (2) if potentially biased by dusty signal, (3) if both