SAOImageDS9: An Essential Tool for Astronomical Exploration
Abstract
SAOImageDS9 (DS9) is an open-source, cross-platform application for the visualization and analysis of astronomical data. Developed at the Smithsonian Astrophysical Observatory, DS9 evolved from an example implementation of reusable imaging components into one of the most widely used astronomical display environments. It has remained useful because it supports many astronomical file formats and coordinate systems, can work directly with event data and image cubes, provides interactive region-based analysis, and can communicate with external tools through command-line and messaging interfaces. DS9 is used in research, mission operations, and education across a range of wavelengths and at both ground- and space-based observatories. This paper summarizes the historical development of DS9, its principal capabilities, and its impact on the astronomical community, and concludes with an appendix describing the internal architecture that has supported its long-term sustainability.
show]afruscione@cfa.harvard.edu
I Introduction
SAOImageDS9111https://ds9.si.edu (hereafter DS9) is a widely used software application for viewing, exploring, and analyzing astronomical data. DS9 is often employed for image display, but it is more accurately described as an interactive analysis environment, combining direct data manipulation, accurate coordinate handling, region-based selection, and interoperability with external analysis tools. Distributed as open-source code and available across Linux, macOS, and Windows, DS9 has become an essential component of global astronomical research, and is used by astronomers, observatory operators, instrument scientists, students, and amateur astronomers.
This versatility comes from combining ease of use with support for detailed analysis. It reads standard astronomical data products such as FITS images and tables222https://heasarc.gsfc.nasa.gov/docs/heasarc/fits.html (originally Wells et al. 1981), interprets World Coordinate Systems (WCS; Greisen and Calabretta 2002), which provide the mathematical mapping between image pixels and celestial coordinates, and supports large datasets efficiently. Beyond its graphical interface, DS9 can be controlled via messaging systems such as the X11 Public Access (XPA; Joye and Mandel 2000) protocol and the Simple Application Messaging Protocol (SAMP; Taylor et al. 2012) a Virtual Observatory (VO)333https://www.ivoa.net/ standard that enables real-time application-to-application data exchange including control of DS9 from python scripts. Together, these capabilities support both interactive exploration and scripted analysis.
In this paper we review the development of DS9, summarize its principal user-facing capabilities, and discuss its scientific and educational impact. We also highlight the architectural decisions that have allowed DS9 to remain relevant across decades of evolving data standards, astronomy missions, and computing environments. Two appendices provide additional detail on the internal design and code structure.
II History of DS9 Development
DS9 grew out of a lineage of visualization tools developed at the Smithsonian Astrophysical Observatory (SAO) starting in 1990. The original, SAOImage, was among the first publicly available X11-based astronomical applications and established core scientific display techniques still in use today (Vanhilst 1990; Mink 1996). In the mid-1990s, SAOImage: The Next Generation (SAOtng) was developed using IRAF’s XIMTOOL graphics libraries (Tody, 1986) and Tool Command Language (Tcl). Tcl provided a high-level scripting environment that allowed for more rapid development and customization than traditional compiled languages. SAOtng also introduced the XPA which allowed external programs to exchange data and control the visualization interface (Mandel and Swick, 1994; Joye and Mandel, 2000).
Building on this modular philosophy, development of a complete redesign was initiated under a 1997–2000 NASA grant (NAG5-3996) titled Future Directions for Astronomical Image Display. This grant supported the SAOTk project, which provided a Tcl/Tk-based framework (utilizing both the Tcl language and its associated graphical user interface (GUI) toolkit, Tk) for reusable components such as display frames, panners, and magnifiers (Joye and Mandel, 1999; Ousterhout, 2010). DS9 emerged as the primary implementation of this framework, inheriting its visualization techniques from SAOImage and its modular architecture and messaging-based interoperability from SAOTk and SAOtng. Upon its 1999 release, it was quickly adopted by major high energy astrophysics missions, including NASA’s Chandra X-ray Observatory and ESA’s XMM-Newton, where it replaced older tools and was tailored to specific mission requirements.
The development of DS9 has been defined by its ability to adapt to shifting user requirements and technological standards. As astronomical datasets grew in complexity, DS9 evolved to support multi-extension FITS files, mosaics, and three-dimensional data cubes. These transitions required flexible rendering strategies and advanced memory management to maintain interactivity with large-scale data (Joye and Mandel, 2004). Simultaneously, the growth of online archives transformed DS9 from a local tool into one for distributed analysis, allowing users to invoke remote computations and retrieve results for interactive exploration.
Changes in hardware and standards also required substantial updates. Early versions of DS9 were constrained by the 8-bit (256 color) limitations of displays and system-level colormaps. As hardware improved, the application underwent substantial updates to support 24-bit “True color” rendering, with 8 bits for each Red-Green-Blue (RGB) color channel, and sophisticated visualization modes. Coordinate handling similarly expanded; while early versions focused on simple projections, DS9 was updated to interpret complex WCS standards, including all-sky representations and data based on Hierarchical Equal Area isoLatitude Pixelization (HEALPix; Górski et al. 2005).
In parallel, DS9 transitioned across computing environments, moving from support for specialized Silicon Graphics workstations from the ’90s to widely used operating systems such as Linux, macOS, and Windows. Staying adaptable has allowed DS9 to remain compatible with evolving FITS standards and modern operating systems and has been critical to its role as a general-purpose visualization environment. Because DS9 has continued to support accurate astronomical data analysis through many changes in computing, it remains useful for both mission pipelines and multiwavelength research.

III Design Principles
DS9 has been developed with an emphasis on maintaining a consistent structure, ease of use, and flexibility in its implementation (Joye and Mandel, 2005). A key feature of DS9 is that graphical interaction and programmatic control are treated as complementary modes. By ensuring that visualization components can be driven both by direct user input and by external messaging interfaces, DS9 provides a unified environment that supports both exploratory ”quick-look” analysis and complex automated scripting (Joye and Mandel, 1999, 2000).
DS9 uses a hybrid implementation: a flexible Tcl/Tk graphical interface coupled with compiled C/C++ components for high-performance computational tasks (Joye, 2011). This structure supports incremental development driven by user requirements rather than rigid, long-term specifications. This approach has allowed DS9 to evolve with changing scientific needs while keeping the user experience relatively stable.
A primary design goal is to minimize the configuration required by the user. DS9 automatically handles technical tasks such as FITS header interpretation, coordinate transformations, and dynamic image scaling. This approach makes DS9 accessible to students and occasional users, while still supporting the detailed analysis needed for research (Mandel et al., 2001). Furthermore, DS9 treats regions not just as graphical overlays, but as portable analysis objects. This allows interactive selections to be integrated into downstream analysis, connecting visual exploration and quantitative results.
IV Features and Capabilities
IV.1 Data Visualization
DS9 provides a visualization environment optimized for astronomical data products, especially FITS images and tables, while also supporting other common bitmap image formats (e.g., PNG, JPEG and TIFF). It can open multi-extension FITS files, display images derived from event files (a tabular format), and work with three-dimensional data cubes. It supports interactive exploration of slices and projections, and interpret both spatial and non-spatial WCS. Its display model distinguishes among the full dataset, the portion resident in memory, and the region currently rendered, helping maintain interactivity for large images. Users can zoom, pan, rotate, crop, block, and bin data, and overlay coordinate grids and alternate WCS descriptions.
The graphical interface is highly configurable, allowing users to tailor display elements such as coordinate readouts, panners, and magnifiers. The ability to maximize the image display area, combined with native support for specialized formats such as HEALPix (Fig.9), makes DS9 an effective tool for exploring both high-resolution localized imaging and all-sky survey data (Joye, 2011).

IV.2 Interactive Analysis
A primary use of DS9 is the comparison of heterogeneous datasets through multi-frame display modes (see Figure 3). Images can be tiled, blinked, matched by scale, or aligned in coordinate system. These capabilities support comparison across wavelengths or processing levels and the construction of RGB composites and mosaics. Interactive analysis tools include region creation and editing, centroiding, summation, axis projections, contours, smoothing, and plotting. Regions can be saved, exchanged in different coordinate systems, and used in downstream analysis.

DS9 also supports tabular data exploration through its catalog tool. VOTables(Ochsenbein et al., 2025) and FITS tables, including outputs from source detection algorithms and external tools, can be loaded and displayed alongside image data, providing a linked-view approach where selections in a scatter plot or a table automatically highlight corresponding sources in the image (Fig. 4). This feature enables coordinated exploration of images, catalogs, and derived quantities. (Glotfelty and Joye, 2024).

IV.3 Interoperability
A distinguishing feature of DS9 is that its functionality is accessible through multiple interfaces, including the graphical interface, command-line input, and messaging protocols such as XPA and SAMP. XPA enables external programs to control DS9 and exchange data in real time (Joye and Mandel, 2000), while SAMP provides interoperability with other astronomy applications within the VO. This interoperability operates at three distinct levels:


Analysis Level Integration: DS9 provides a framework for executing external tasks directly within its interface, utilizing user-defined parameters such as regions, coordinates, and data subsets. This is best exemplified by the DS9 Analysis Extension (DAX), developed for the Chandra Interactive Analysis of Observations (CIAO) software package (Glotfelty et al., 2011; Fruscione and others, 2026). DAX allows users to perform spectral extraction, image processing, and model fitting (see Figure 5) using CIAO tools without leaving the visualization environment (Glotfelty and Fruscione, 2020). Similar integration is available through the pyds9plugin, which enables Python-based quick-look processing (Picouet and Picouet, 2024).
Remote Data and Services: A second level of interoperability is achieved through support for remote data access. Using built-in HTTP-based mechanisms, DS9 can retrieve data products from remote archives and services, incorporating them directly into the local visualization environment. This capability has proven particularly effective in educational settings. Where relevant, DS9 makes use of VO standards to discover and access remote resources. This includes accessing a curated list of Simple Image Access (SIA)101010https://www.ivoa.net/documents/SIA/ protocol servers for image retrieval. Currently in development, DS9 will also support VO standard Multi-Order Coverage (MOC)111111https://www.ivoa.net/documents/MOC/ maps.
Virtual Observatory Integration: The third level involves integration with the VO through protocols such as SAMP (Taylor et al., 2012). DS9 supports various VO standards, including VOTable catalogs and footprint services, allowing it to interoperate with external applications such as Aladin and TOPCAT (Bonnarel et al., 2000; Baumann et al., 2022; Taylor, 2005). By acting as a SAMP hub or client, DS9 synchronizes its display with external web-based archives and visualization tools, as illustrated in the schematic overview in Figure 6. Integration of other applicable VO standards will be considered in future updates. Current standards such as the Table Access Protocol (TAP)121212https://www.ivoa.net/documents/TAP/ are much more suited to applications such as Topcat, and formats such as Hierarchical Progressive Survey (HiPS)131313https://www.ivoa.net/documents/HiPS/ are better handled by dedicated survey tools such as Aladin.
IV.4 From analysis to publication
Beyond its use in analysis, DS9 also provides rendering, layering, and annotation tools that support the creation of publication-quality figures. DS9’s ability to handle complex overlays, multi-scale contours, and coordinate grids ensures that final images remain scientifically rigorous while meeting the standards of peer-reviewed literature (see Figure 7).

V Selected Advanced Features
Describing all the features and capabilities of DS9 is beyond the scope of this paper, but we are highlighting here a few of the more advanced features useful for scientific analysis.
Tri-Color and True-Color Images Creating tri-color RGB images in DS9 has been possible for a long time and remains a standard technique, where three different datasets are mapped to the red, green, and blue channels to highlight their relative contributions. DS9 automatically handles the alignment based on the images WCS. In contrast, the use of the Hue-Saturation-Value (HSV) and Hue-Lightness-Saturation (HLS) color models is a more recent addition, offering a different approach in which a single dataset is mapped into a continuous color space. While RGB emphasizes comparisons between multiple datasets through color mixing, HSV and HLS focus on representing the structure within a single dataset, with hue encoding intensity and brightness controlled through value or lightness (see Figure 8). This newer capability provides more flexibility in visualizing subtle features, complementing the traditional RGB approach rather than replacing it.

Data Cubes and Slices In DS9, a data cube is a multi-dimensional dataset that may include spatial, spectral, temporal, polarization, or other axes. DS9 can handle datasets with up to nine dimensions, a capability particularly important in radio astronomy. In many applications, however, the most common case is the three-dimensional cube, with two spatial axes and a third axis representing quantities such as energy, wavelength, or time. These 3-D cubes can be explored by stepping through individual slices, animating them, or collapsing the cube along the third dimension to create integrated images. This allows users to connect spatial structures with their spectral or temporal behavior and to extract quantities like spectra or light curves from selected regions, providing a more complete view of the data than a single static image (see Figure 9).

Illustrate Mode allows users to add annotations (text, images, lines, circles, boxes, ellipses, etc.) to images. Unlike regions which are located within the coordinate system of the image, these annotations remain fixed within the display window so as the image is panned or zoom they do not move. This can be used to embed logos in displays, or as is shown in Figure 10 allows users to add call-out boxes with plots (or any other static bitmap image).

Animations. DS9 allows users to directly create animations. These can be generated from multiple individual frames as shown in the video linked to Figure 11 which displays the FITS images from the Double Asteroid Redirection Test (DART) mission’s impact. Other options include generating animations from individual slices through a multi-dimension data set or rotating the rendering of 3-dimensional about azimuth, elevation, and zoom. Animations can be saved in MPEG format or as animated GIFs.

Interactive Regions (DAX). DS9 includes advanced region-based tools that support interactive, data-driven analysis. Through the DAX extension, which is implemented within the core DS9 architecture, certain region types can adapt dynamically to the underlying data. One example is the “elastic ellipse” task, in which an elliptical region automatically resizes, repositions, and reorients to match the local source morphology based on second-order image moments. As shown in the video linked to Figure 12, this provides an intuitive and quantitative way to track extended or asymmetric sources.

VI DS9 in the community
VI.1 DS9 and Chandra
For over two decades, DS9 has been closely linked to Chandra data analysis, mission operations, and observation planning. Currently funded and maintained by the Chandra X-ray Center, DS9 is distributed as a core element of the CIAO software suite. It is utilized throughout the mission lifecycle, from the automated verification and validation pipelines used in quality assurance to the interactive analysis performed by individual researchers.
DAX (see Section IV.3) provides the most direct link between the two, acting as the main bridge between DS9 and the CIAO analysis tools. Within the Chandra workflow, DAX is routinely used to connect interactive source selection with downstream analysis, enabling a seamless transition from visualization to quantitative modeling (see Figure 5). Its tight integration with DS9 allows users to incorporate region definitions, coordinate information, and data filtering directly into CIAO tasks, streamlining the analysis process.
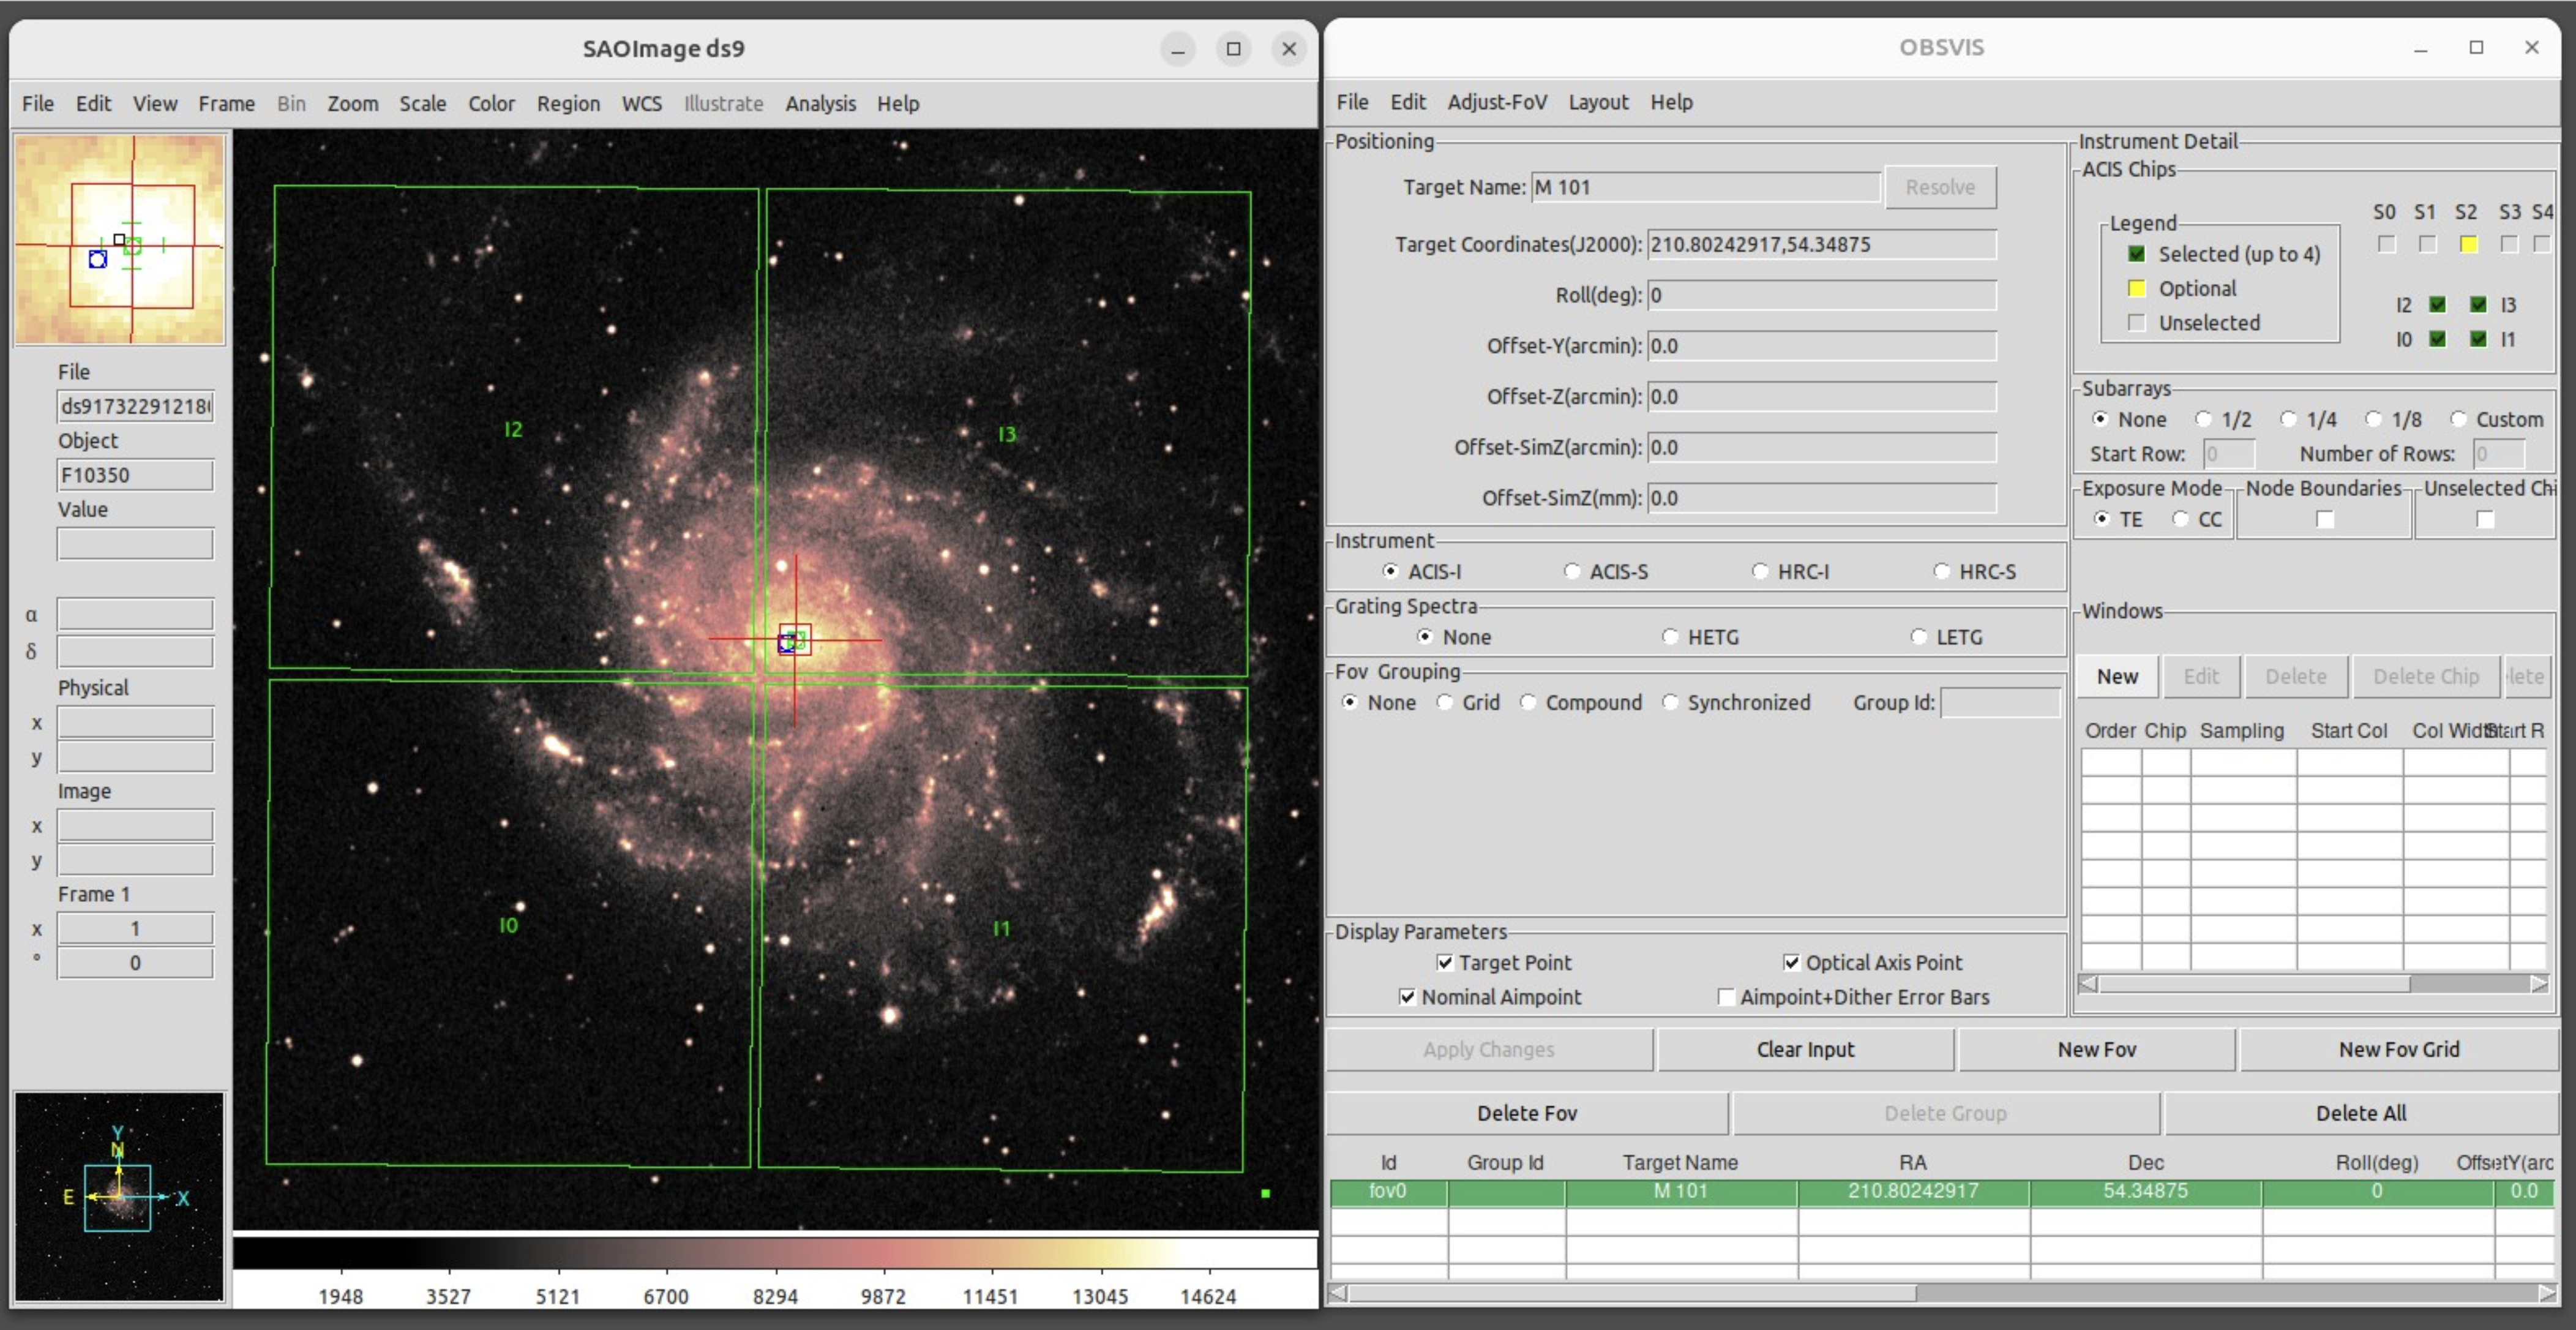
DS9 supports Chandra operations and proposal preparations through the Chandra Observation Visualizer (ObsVis). ObsVis enables interactive observation planning by allowing the overlay of instrument fields of view and pointings on celestial data (see Figure 13). Within the X-ray community, DS9 is particularly valued for its ability to operate directly on event-level data, allowing filtering in energy, time, and spatial dimensions.
Finally DS9 multiwavelength capabilities enable X-ray data to be interpreted alongside images and contours from other observatories, providing the framework necessary for modern multi-instrument analysis.
VI.2 Global Adoption
DS9 is one of the most widely used general-purpose visualization environment in astronomy, and it is used across a broad range of wavelengths and scientific domains. In optical and near-infrared astronomy, it was employed for the visual classification of galaxies in the Hubble CANDELS survey (Kartaltepe et al., 2015), and more recently, within the James Webb Space Telescope (JWST) community to generate three-color images during commissioning and to mitigate instrumental effects in early-release science programs (Rigby et al., 2023, 2025). DS9 has also been used in planetary science, including analysis of NEAR-Shoemaker images of asteroid Eros and contributed to the development and validation of FITS standards for planetary data (Durda et al., 2012; Marmo et al., 2018).
DS9 is widely utilized as a real-time display and quick-look analysis engine within observatory control systems and instrument pipelines. It serves as an operational standard for facilities including the W.M. Keck Observatory, the Dark Energy Survey (DES), and the Lick, Wendelstein, and Telescopio Nazionale Galileo observatories (Clarke et al., 2005; Rossetti et al., 2006; Kassis et al., 2016; Snigula et al., 2016; Diehl et al., 2018). It is used as the display system for European X-ray beamlines, including PANTER for the Advanced Telescope for High Energy Astrophysics (Athena) and Arcus optics characterization (Burwitz et al., 2019) (Figure 14), and XPBF and MINERVA for ongoing NewAthena calibrations (Heinis et al., 2024; Krumrey et al., 2024).

The distribution of DS9 usage across astrophysical domains (Fig. 15) reflects this breadth. While X-ray astronomy remains the largest category, studies of galaxies, radio astronomy, and active galactic nuclei also account for a large fraction of literature mentions. Beyond research, DS9 is used in education and public engagement, serving as a core component of the NASA/IPAC NITARP teacher initiative, the ”Analyzing the Universe” curriculum, and citizen science projects like the Hubble Asteroid Hunter (Matilsky et al., 2004; Garvin et al., 2022).
Download statistics show DS9’s broad use: from 2020 to 2025, DS9 was downloaded tens of thousands of times per year (Figure 16). The downloads span all major platforms, with Windows representing about 40–45%, macOS about 35%, and Linux about 25%. Geographically, while the United States account for 35% of users, the remaining 65% are distributed worldwide (Figure 17). This broad adoption is also reflected in the steady growth of literature mentions, although part of the increase may reflect better awareness of the importance of citing software (Figure 18). Because software remains historically under-cited in astronomical literature (Bouquin et al., 2020), these metrics likely provide a lower limit on DS9’s actual impact.


VII Conclusion
DS9 has become a fundamental tool in astronomy because it combines accurate astronomical coordinate handling, interactive performance, and cross-platform portability. Its longevity is a result of a modular architecture that has allowed it to adapt to evolving standards, larger and more complex datasets, and the emergence of the VO. DS9 is not simply a successful software package from the past, it is a mature and evolving environment that continues to support mission operations, professional research, and global education.
VIII Future Directions
Despite its success, the long history of DS9 presents significant challenges for the maintenance of a mature software system. The current architecture reflects decades of incremental updates and relies on legacy dependencies that are increasingly difficult to maintain within modern computing environments. While development is currently supported by the Chandra X-ray Center, the long-term outlook is linked to the life of the mission, which has now surpassed 25 years. A DS9 modernization must preserve its core strengths of portability, rigorous coordinate handling, interoperability, and support for both interactive and scripted analysis, while transitioning to a more sustainable codebase. Several broader computing trends also motivate modernization, for example the shift in display systems on Linux (from X11 to Wayland) and the growth of browser- and cloud-based analysis, where users expect visualization and analysis components to operate without a traditional local desktop application.
While no formal development has yet begun, concepts such as a future SAOImageDiscovery (a potential successor to DS9) represent a viable path forward for rethinking the platform. Securing the future of DS9 will require a sustained investment and commitment from the community to preserve the scientific reliability, transparency, and reproducibility that are essential for astronomical analysis. AI-assisted code review, automated refactoring, and dependency modernization may help determine whether DS9 can be updated incrementally or needs a more substantial redesign. Ultimately, the goal is to keep DS9 scientifically reliable and useful as astronomical datasets continue to grow in size and complexity.
IX Acknowledging or Citing DS9
If DS9 contributes to a scientific publication, we request that authors cite both the current paper (A. Fruscione et al. 2026)—to acknowledge the software package and its ongoing development—and the original DS9 reference (Joye and Mandel, 2003)—to acknowledge the introduction of DS9 to the astronomical community.
For AAS journal articles, DS9 should be included in the \software{} tag.
Authors may also include the following acknowledgment statement:
This research made use of SAOImageDS9, an astronomical imaging and data visualization application developed by the Smithsonian Astrophysical Observatory (A. Fruscione et. al 2026, Joye and Mandel 2003).
A.F. was responsible for writing the full draft of the paper and submitting the manuscript, and contributed scientific input and feedback during the development of DS9.
K.G. currently supports DS9 within the Chandra X-ray Center (CXC) and CIAO environments; he developed the Advanced View and DAX. All original figures in this paper were produced by him. He is the author of a technical document summarized in Appendix A.
W.J., now retired, initiated the development of DS9 in the late 1990s and was its primary developer throughout its history until his retirement in April 2026.
J.C.M., now retired, supervised the DS9 development over the past 10 years and authored the extensive “SAOImageDS9 Interface and Internal Design” document, which forms the basis of Appendix B.
All authors provided technical feedback, critical revisions, and oversight for the paper.
Appendix A Code Architecture
This appendix summarizes the technical design and implementation of the DS9 software system, including its architecture, codebase organization, and image rendering workflow.
A.1 Architecture
The code is implemented primarily in C/C++ for performance-critical components and in Tcl/Tk for the graphical user interface and scripting layer. The Tk event loop drives the application, managing both rendering and user interaction.
DS9 is a modular system composed of multiple packages (see Fig. 19). The DS9 project develops and maintains 20 packages and uses an additional 16 third-party packages. Over time, several critical components, such as funtools, xpa, and tkblt, have been forked into the DS9 project after being abandoned upstream, as they remain essential for core functionality with no viable replacements.

The DS9 code is organized into packages that handle distinct functional domains. The graphical interface is implemented through ds9 and tksao, while data handling relies on fitsy and funtools. Plotting capabilities are provided by tkblt, communication is handled by xpa, and supporting utilities include libraries such as vector and tclsignal. Structured input parsing is handled via flex141414https://en.wikipedia.org/wiki/Flex_(lexical_analyzer_generator) and bison151515https://en.wikipedia.org/wiki/GNU_Bison equivalent parsers generated with fickle and taccle.
Additional Tcl/Tk extensions provide support for XML-RPC (Remote Procedure Call) communication (tclxmlrpc) communication used for SAMP messages, in-memory file systems (ZIP-based, tclzipfs), animation and MPEG generation (tkagif and tkmpeg), as well as platform-specific utilities. The system also depends on several major third-party libraries, including the AST library for WCS and FITS coordinate handling, OpenSSL for secure communication, and the Tcl/Tk core libraries along with their associated extensions.
A.2 Graphical User Interface
The structure of the interface is illustrated in Fig. 20. The GUI consists of a top-level window managed by the ds9/library module, with custom C++ widgets used for image display, magnification, panning, and colorbar visualization. Celestial coordinate computations are performed using the AST library.

A.3 Repository
DS9 is distributed as open-source software and hosted on GitHub 161616https://github.com/SAOImageDS9/SAOImageDS9. The repository uses submodules to track specific versions of third-party dependencies, ensuring reproducibility across builds. Although the project is open to external contributions, community input has historically been limited. Several third party distributions also exist in certain Linux repositories (e.g. Debian and Arch), as well as MacPorts for macOS.
A.4 Packaging and Distribution
A single codebase is used to support multiple windowing systems, including X11 on Linux, macOS (both X11 and Aqua), and Windows via Cygwin. The build system is based on autoconf and automake, producing self-contained binaries that include all required dependencies.
Platform-specific packaging strategies vary: Linux distributions are provided as self-decompressing binaries with embedded resources; macOS builds are distributed either as DMG installers or as binaries with separate resource archives; and Windows versions are packaged as self-extracting executables. DS9 as of version 8.7 provides binaries for approximately 20 platforms.
A.5 Implementation Languages
The DS9 repository includes a mix of programming and markup languages, dominated by C/C++ (50.4%) and Tcl/Tk (19.9%) for the GUI and scripting. Additional languages include HTML and TeX for documentation, Roff for manual pages, and M4 for build configuration which make up the remaining 29.7%.
Appendix B Interface and Internal Design Overview
This appendix provides a technical summary of the SAOImageDS9 software, based on the comprehensive documentation “SAOImageDS9 Interface and Internal Design”171717https://ds9.si.edu/reference/ds9.pdf. The goal is to highlight the key architectural components, data handling mechanisms, and visualization pipeline relevant for scientific analysis, while preserving the essential technical details of the original document.
B.1 Control Architecture
DS9 can be controlled in three ways. Normally, the application is controlled by the GUI menus. DS9 also has a command language that can be used from the Unix command line with XPA commands, setting DS9 parameters and returning them:
xpaset -p ds9 [command] [value]
xpaget ds9 [command]
The same commands can also be used on the initial DS9 startup command line, where they are executed in sequence from left to right. XPA commands may be issued one at a time from the terminal or collected in a script to run in batch mode. Commands may be sent to DS9 as long as the GUI is open. DS9 can also be commanded on one machine using XPA commands sent from another machine.
B.2 FITS Handling
When a FITS file is opened successfully, DS9 displays a subset of its main image, specifically the first FITS HDU containing a non-null image. FITS files can contain multiple segments, or HDUs, and DS9 examines the HDUs in turn to identify valid image data. A primary HDU is selected if it contains a non-null image; other HDUs may also be selected if they contain a non-null image, a compressed image, an event file, or a HEALPIX image.
The FITS OBJECT and UNITS keywords are used to fill the corresponding entries in the information panel. The BSCALE and BZERO keywords are used to scale the data as it is read in. The BLANK keyword defines a null value, and the DATASEC keyword defines a file subsection. By default, if the DATASEC keyword is present, DS9 uses it to determine what subset of the data is considered valid for min/max calculations and display.
An X-ray event file is stored as a FITS table with columns usually including X and Y. DS9 recognizes an event file when it finds a binary table with EXTNAME equal to EVENTS, STDEVENT, or RAYEVENT, and with column names X and Y present. When the file is loaded, DS9 makes an image on the fly by binning the data on the X and Y columns. Columns with other names can also be used as the columns to bin on.
B.3 Rendering Pipeline
DS9 supports a number of operations on the displayed image, including binning or blocking, cropping, smoothing, scaling, color mapping, zooming, and panning. For table data, DS9 first determines whether the table is an event file. Event data are binned, while other table data are decompressed. Image data proceed directly to blocking. The subsequent operations are then applied in the following order:
blocking cropping smoothing scaling color mapping zooming
For event files, the binning step precedes blocking:
binning blocking cropping smoothing scaling color mapping zooming
DS9 also distinguishes between the full image, the part of the image currently in memory, the part displayed in the selected display frame, and the part displayed in the magnifier.
B.4 Visualization and Scaling
DS9 maps image pixel values to displayed RGB values using scale limits, a scaling function, color stretch, bias, and a color table. The scale limits and define the range of pixel values to be displayed. Pixel values are first converted to a normalized value used by the selected scaling function.
DS9 provides linear, logarithmic, power, square root, squared, arc-hyperbolic sine, hyperbolic sine, and histogram equalization functions. For example, the logarithmic and arc-hyperbolic sine scaling functions are
| (B1) | ||||
| (B2) |
After scaling, DS9 applies the color stretch and bias before using the color table lookup to determine the displayed RGB value. This mapping is represented by
| (B3) |
with
| (B4) |
and
| (B5) |
where is the color stretch, is the bias, and is the color table lookup.
DS9 allows the user to specify the scale limits directly or to compute them using algorithms in the Scale menu. The ZScale algorithm, inherited from IRAF, samples the pixel values, sorts them into a monotonic array, determines the median value, fits a line to the sorted values, and uses the fitted slope together with the contrast parameter to estimate the lower and upper scale limits.
B.5 Coordinate Systems
DS9 supports coordinate conversion among image, physical, and WCS coordinate systems. WCS coordinates are defined in the FITS header as a parameterized mapping from image physical coordinates. DS9 uses the AST library to compute celestial coordinates and supports transformations among standard astronomical coordinate systems, including FK4, FK5, ICRS, Galactic, and Ecliptic coordinates.
B.6 Regions and Spatial Analysis
DS9 regions are geometric shapes used to mark or select areas in an image. Supported region shapes include circles, annuli, ellipses, boxes, polygons, lines, points, and text. Regions may be defined in image, physical, or WCS coordinates, and can be edited interactively or loaded from region files. Regions can be used for measurements and analysis within selected areas, including counts and statistics. DS9 also supports Boolean operations on regions, allowing regions to be included, excluded, or combined to form more complex selections.
B.7 Advanced Data Handling
DS9 supports data cubes and event files. Event files are stored as FITS tables and can be displayed as images by binning selected columns, such as the X and Y columns. DS9 also supports multiple frames and RGB images for displaying more than one image or image component. Additional operations, including contour generation and smoothing, are supported.
B.8 Performance
DS9 uses memory mapping to support large image files, allowing image data to be accessed without reading the entire file into memory at once. This permits DS9 to display and process images that are larger than the available physical memory.
Certain operations in DS9 are multi-threaded, including 3D rendering, smoothing, and contour generation. These operations can make use of multiple processors and may reduce processing time depending on the number of processors available.
B.9 Interoperability
DS9 interfaces with external tools through XPA, SAMP, and Tcl scripting. XPA provides interprocess communication through commands such as xpaset and xpaget. SAMP support follows the VO SAMP standard and allows DS9 to communicate with other applications. DS9 can also be controlled from Astropy through SAMP, and it provides interfaces used with software such as CIAO and IRAF.
B.10 Customization
DS9 is implemented using Tcl/Tk. Visualization relies on color table lookup arrays for mapping scaled pixel values to RGB values. User customization is supported through startup and preference files that allow persistent configuration of DS9 behavior.
References
- Aladin Lite v3: Behind the Scenes of a Major Overhaul. In Astronomical Data Analysis Software and Systems XXX, J. E. Ruiz, F. Pierfedereci, and P. Teuben (Eds.), Astronomical Society of the Pacific Conference Series, Vol. 532, pp. 7. Cited by: §IV.3.
- The ALADIN interactive sky atlas. A reference tool for identification of astronomical sources. A&AS 143, pp. 33–40. External Links: Document Cited by: §IV.3.
- Credit Lost: Two Decades of Software Citation in Astronomy. ApJS 249 (1), pp. 8. External Links: Document Cited by: Figure 18, §VI.2.
- X-ray testing at PANTER of optics for the ATHENA and Arcus Missions. In International Conference on Space Optics — ICSO 2018, Z. Sodnik, N. Karafolas, and B. Cugny (Eds.), Society of Photo-Optical Instrumentation Engineers (SPIE) Conference Series, Vol. 11180, pp. 1118024. External Links: Document Cited by: Figure 14, §VI.2.
- Extending and Customising DS9. In Astronomical Data Analysis Software and Systems XIV, P. Shopbell, M. Britton, and R. Ebert (Eds.), Astronomical Society of the Pacific Conference Series, Vol. 347, pp. 114. Cited by: §VI.2.
- Dark energy survey operations: years 4 and 5. In Observatory Operations: Strategies, Processes, and Systems VII, Society of Photo-Optical Instrumentation Engineers (SPIE) Conference Series, Vol. 10704, pp. 107040D. External Links: Document Cited by: §VI.2.
- Detecting crater ejecta-blanket boundaries and constraining source crater regions for boulder tracks and elongated secondary craters on Eros. \maps 47 (6), pp. 1087–1097. External Links: Document Cited by: §VI.2.
- CIAO: chandra’s data analysis system for x-ray astronomy and beyond. ApJ, submitted. Note: submitted Cited by: §IV.3.
- Hubble Asteroid Hunter. II. Identifying strong gravitational lenses in HST images with crowdsourcing. A&A 667, pp. A141. External Links: Document, 2207.06997 Cited by: §VI.2.
- dax: DS9 Analysis Extensions in CIAO. In Astronomical Data Analysis Software and Systems XX, I. N. Evans, A. Accomazzi, D. J. Mink, and A. H. Rots (Eds.), Astronomical Society of the Pacific Conference Series, Vol. 442, pp. 629. Cited by: §IV.3.
- CIAO and DS9: a powerful pair through DAX. Chandra News 28, pp. 7. Cited by: §IV.3.
- SAOImageDS9 and chandra - 25 years of synergy. Note: Poster presented at the CXC Symposium 2024Center for Astrophysics — Harvard & Smithsonian External Links: Link Cited by: §IV.2.
- HEALPix: A Framework for High-Resolution Discretization and Fast Analysis of Data Distributed on the Sphere. ApJ 622, pp. 759–771. External Links: Document Cited by: §II.
- Representations of world coordinates in FITS. A&A 395, pp. 1061–1075. External Links: Document, astro-ph/0207407 Cited by: §I.
- MINERVA, a new x-ray facility at the ALBA Synchrotron devoted to assemble and characterize the Silicon Pore Optics Mirror Modules for the NewATHENA mission. In Space Telescopes and Instrumentation 2024: Ultraviolet to Gamma Ray, J. A. den Herder, S. Nikzad, and K. Nakazawa (Eds.), Society of Photo-Optical Instrumentation Engineers (SPIE) Conference Series, Vol. 13093, pp. 130934X. External Links: Document Cited by: §VI.2.
- New Features of SAOImage DS9. In Astronomical Data Analysis Software and Systems XII, H. E. Payne, R. I. Jedrzejewski, and R. N. Hook (Eds.), Astronomical Society of the Pacific Conference Series, Vol. 295, pp. 489. Cited by: §IX, §IX.
- New User Requirements for Astronomical Data Visualization. In Astronomical Data Analysis Software and Systems (ADASS) XIII, F. Ochsenbein, M. G. Allen, and D. Egret (Eds.), Astronomical Society of the Pacific Conference Series, Vol. 314, pp. 505. Cited by: §II.
- The Development of SAOImage DS9: Lessons Learned from a Small but Successful Software Project. In Astronomical Data Analysis Software and Systems XIV, P. Shopbell, M. Britton, and R. Ebert (Eds.), Astronomical Society of the Pacific Conference Series, Vol. 347, pp. 110. Cited by: §III.
- SAOTk and TclXPA: Tcl/Tk Extensions for Astronomy. In Astronomical Data Analysis Software and Systems IX, N. Manset, C. Veillet, and D. Crabtree (Eds.), Astronomical Society of the Pacific Conference Series, Vol. 216, pp. 91. Cited by: §I, §II, §III, §IV.3.
- SAOImage DS9 Frequently Asked Questions. In Astronomical Data Analysis Software and Systems XX, I. N. Evans, A. Accomazzi, D. J. Mink, and A. H. Rots (Eds.), Astronomical Society of the Pacific Conference Series, Vol. 442, pp. 633. Cited by: §III, §IV.1.
- SAOTk: Tcl/Tk Widgets for Imaging and Data Visualization. In Astronomical Data Analysis Software and Systems VIII, D. M. Mehringer, R. L. Plante, and D. A. Roberts (Eds.), Astronomical Society of the Pacific Conference Series, Vol. 172, pp. 429. Cited by: §II, §III.
- CANDELS Visual Classifications: Scheme, Data Release, and First Results. ApJS 221 (1), pp. 11. External Links: Document, 1401.2455 Cited by: §VI.2.
- Operational performance of MOSFIRE with its cryogenic configurable slitmask unit at the W. M. Keck Observatory. In Ground-based and Airborne Instrumentation for Astronomy VI, C. J. Evans, L. Simard, and H. Takami (Eds.), Society of Photo-Optical Instrumentation Engineers (SPIE) Conference Series, Vol. 9908, pp. 99080E. External Links: Document Cited by: §VI.2.
- Characterization of silicon pore optics for the NewAthena X-ray observatory in the PTB laboratory at BESSY II. Journal of Synchrotron Radiation 31, pp. 716–722. External Links: Document Cited by: §VI.2.
- Funtools: An Experiment with Minimal Buy-in Software. In Astronomical Data Analysis Software and Systems X, F. R. Harnden, F. A. Primini, and H. E. Payne (Eds.), Astronomical Society of the Pacific Conference Series, Vol. 238, pp. 225. Cited by: §III.
- Public Access Programming: Opening The Black Box That Hides Internal Data. In Astronomical Data Analysis Software and Systems III, D. R. Crabtree, R. J. Hanisch, and J. Barnes (Eds.), Astronomical Society of the Pacific Conference Series, Vol. 61, pp. 507. Cited by: §II.
- FITS Format for Planetary Surfaces: Definitions, Applications, and Best Practices. Earth and Space Science 5 (10), pp. 640–651. External Links: Document Cited by: §VI.2.
- Chandra X-ray Data Analysis in Educational Environments. In American Astronomical Society Meeting Abstracts, American Astronomical Society Meeting Abstracts, Vol. 205, pp. 96.07. Cited by: §VI.2.
- Browsing Images in World Coordinate Space with SAOimage. In Astronomical Data Analysis Software and Systems V, G. H. Jacoby and J. Barnes (Eds.), Astronomical Society of the Pacific Conference Series, Vol. 101, pp. 96. Cited by: §II.
- VOTable Format Definition Version 1.5. Note: IVOA Recommendation 16 January 2025 Cited by: §IV.2.
- A high-resolution radio morphology and polarization of the kiloparsec-scale X-ray jet of PKS 1127‒145. A&A 687, pp. A287. External Links: Document, 2405.04935 Cited by: Figure 7.
- Tcl and the tk toolkit (2nd edition). Addison-Wesley. Cited by: §II.
- Tackling the issue of image processing via plugins: the example of pyds9plugin. In Astronomical Data Analysis Software and Systems XXXI, B. V. Hugo, R. Van Rooyen, and O. M. Smirnov (Eds.), Astronomical Society of the Pacific Conference Series, Vol. 535, pp. 351. Cited by: §IV.3.
- The Science Performance of JWST as Characterized in Commissioning. PASP 135 (1046), pp. 048001. External Links: Document, 2207.05632 Cited by: §VI.2.
- JWST Early Release Science Program TEMPLATES: Targeting Extremely Magnified Panchromatic Lensed Arcs and Their Extended Star Formation. ApJ 978 (1), pp. 108. External Links: Document, 2312.10465 Cited by: §VI.2.
- GIANO: software design and acquisition facilities. In Advanced Software and Control for Astronomy, H. Lewis and A. Bridger (Eds.), Society of Photo-Optical Instrumentation Engineers (SPIE) Conference Series, Vol. 6274, pp. 627425. External Links: Document Cited by: §VI.2.
- Sherpa: An Open-source Python Fitting Package. ApJS 274 (2), pp. 43. External Links: Document, 2409.10400 Cited by: Figure 5.
- Wendelstein Observatory control software. In Software and Cyberinfrastructure for Astronomy IV, G. Chiozzi and J. C. Guzman (Eds.), Society of Photo-Optical Instrumentation Engineers (SPIE) Conference Series, Vol. 9913, pp. 99132G. External Links: Document Cited by: §VI.2.
- TOPCAT & STIL: Starlink Table/VOTable Processing Software. In Astronomical Data Analysis Software and Systems XIV, P. Shopbell, M. Britton, and R. Ebert (Eds.), Astronomical Society of the Pacific Conference Series, Vol. 347, pp. 29. Cited by: §IV.3.
- Simple Application Messaging Protocol Version 1.3. Note: IVOA Recommendation 11 April 2012 External Links: Document, 1110.0528 Cited by: §I, §IV.3.
- The IRAF Data Reduction and Analysis System. 627, pp. 733. External Links: Document Cited by: §II.
- SAOimage. Smithsonian Astrophysical Observatory. Report for the period through Jan 1990.. In Bulletin of the American Astronomical Society, Vol. 22, pp. 935. Cited by: §II.
- FITS - a Flexible Image Transport System. A&AS 44, pp. 363. Cited by: §I.
- The X-Ray Luminosity Function of Ultraluminous X-Ray Sources in Collisional Ring Galaxies. ApJ 863 (1), pp. 43. External Links: Document, 1806.02746 Cited by: Figure 3.