A Census of the 200 Most Massive Galaxies Spectroscopically Observed with JWST at
Abstract
Massive galaxies provide strong tests of galaxy formation models, yet a comprehensive spectroscopic view of their properties and demographics in the early Universe has remained elusive. Here we present a JWST spectroscopic census of the 200 most massive galaxies at , selected using an evolving stellar-mass threshold motivated by the halo mass function and anchored at at . These galaxies represent the top 3% most massive systems among all publicly available NIRSpec/prism observations in the DAWN JWST Archive. While not volume-complete, the sample provides the first statistical spectroscopic view of massive galaxies across the first two billion years of cosmic history. We derive their physical properties through joint spectral energy distribution (SED) fitting of spectroscopy and photometry, and construct a clean massive galaxy sample after removing little red dots and broad-line AGN contaminants. The inferred stellar masses, and hence the massive-galaxy selection, remain broadly robust under alternative SED-modeling assumptions, including the addition of MIRI photometry. We find that the massive galaxy population evolves strongly with redshift: normal star-forming galaxies (SFGs; dust attenuation of mag) dominate at , while dusty SFGs ( mag) and quiescent galaxies (QGs) become more common toward lower redshift. Dust attenuation decreases systematically toward higher redshift, consistent with lower levels of dust and metal enrichment in the earliest massive galaxies. We identify 29 massive QGs, including a population of recently quenched systems whose star formation declined rapidly within the past Myr. We further show that both the traditional UVJ and recently proposed selections suffer substantial inconsistency with the most massive galaxies at , motivating a revised criterion calibrated using our spectroscopic sample. Finally, we stack the spectra of different massive galaxy populations and cosmic age bins. The inferred formation histories suggest at least two pathways toward quiescence: a dust-enriched pathway linking normal SFGs, dusty SFGs, and QGs, and a more direct pathway connecting normal SFGs and QGs. Massive normal SFGs themselves appear to grow through both relatively gradual and rapid assembly modes. Together, these results suggest that rapid stellar-mass assembly, dust enrichment, and quenching were already shaping the evolutionary pathways of the most massive galaxies within the first billion years after the Big Bang.
Key Words.
galaxies: high-redshift – galaxies: active – galaxies: star-formation – galaxies: photometry – submillimetre: galaxies1 Introduction
Understanding how massive galaxies formed and evolved is a central question in astrophysics. These systems play critical roles in the cosmic baryon cycle: they host the most massive black holes (67, e.g.,), enrich the surrounding medium with heavy elements through stellar winds and supernovae (75, e.g.,), and regulate star formation via gas accretion and energetic feedback (107; 86, e.g.,). As they assemble most of their stars early and rapidly, massive galaxies provide crucial tests for galaxy formation models (91; 9; 110, e.g.,). In the standard hierarchical galaxy formation models, massive galaxies are expected to grow gradually over time through accretion and mergers within massive dark matter halos (120; 109; 113, e.g.,), often tracing the densest cosmic-web nodes that later evolve into today’s clusters (94; 24; 63, e.g.,). At the same time, the observed diversity of high-redshift massive systems – including dusty starbursts, compact quiescent galaxies, and gas-rich mergers – indicates multiple physical pathways shaping their early growth and quenching (38; 119; 112, e.g.,). Determining when and how these galaxies formed, how efficiently they converted gas into stars, and how they eventually quenched, and connect to their dark-matter halos remains a fundamental goal of galaxy evolution studies.
The first four years of the James Webb Space Telescope (JWST) have revolutionized our view of galaxy formation, revealing that galaxies formed bigger, faster, and earlier than previously expected (11; 74; 33; 98; 39; 26, e.g.,). These galaxies, almost as massive as the Milky Way, were found already in place within the first billion years after the Big Bang (126; 127; 70; 44, e.g.,). Such highly efficient formation of massive galaxies is indicated among three complementary populations/diagnostics: 1) a large excess at the bright end of the UV luminosity function beyond compared to pre-JWST predictions (35; 80; 81; 1; 52; 21; 117, e.g.,); 2) an overabundance at the massive end of the stellar mass function together with spectroscopically confirmed dusty massive star-forming systems at (126; 124; 116; 46; 25; 104; 70, e.g.,); 3) the emergence of massive quiescent galaxies at (19; 112; 48; 32; 115; 61; 130; 118, e.g.,), which not only assembled rapidly but also quenched fast.
Beyond their unexpectedly rapid mass assembly and quenching, JWST observations have also revealed that some high-redshift galaxies exhibit surprisingly mature morphologies, including disk-like structures and ordered stellar distributions (64; 40; 58; 59; 100, e.g.,). More recently, a morphologically mature massive spiral galaxy at has been reported, making it the most distant spiral galaxy candidate to date (127, Zhúlóng;). It exhibits a quiescent bulge and a large, extended star-forming disk, with a morphology similar to that of nearby galaxies, only 1 Gyr after the Big Bang. Together, these recent findings imply accelerated stellar-mass build-up, early star-formation quenching, and structural transformation within the first billion years.
In parallel, the release of large public JWST spectroscopic datasets now enables systematic studies of tens of thousands of galaxies with secure redshifts (92; 42; 14; 30; 82, e.g.,). New JWST/MIRI imaging (85, e.g., MINERVA;) extends rest-frame near-IR coverage, improving stellar-mass constraints for the highest-redshift galaxies. Altogether, the field has therefore reached a turning point where systematic, spectroscopically anchored studies of early massive galaxies are finally possible; the timing is ideal for a comprehensive study of early massive galaxies.
Leveraging the DAWN JWST archive (DJA)11 1 https://dawn-cph.github.io/dja with currently 10,000 robust JWST NIRSpec/prism spectra at in v4.5, this paper aims to construct a homogeneous spectroscopic catalog of the most massive currently known galaxies from and to study their physical properties. The final catalogs of the massive galaxies (this work) and the parent sample of all prism galaxies (Gottumukkala et al. in prep.), along with the FIR properties of massive galaxies with ALMA observations (Qi et al. in prep.), will be released on a dedicated webpage.
This paper is organized as follows. In Section 2, we describe the data, joint SED-fitting methodology, and the selection of the massive galaxy sample. Section 3 presents the classification of the massive galaxies into different populations. In Section 4, we investigate their demographic, physical, and spectroscopic properties, including their redshift evolution, star-formation activity, photometric selection criteria, and stacked spectral characteristics. We discuss the implications for the formation and evolution of massive galaxies, together with key caveats and systematic uncertainties, in Section 5. Finally, our conclusions are summarized in Section 6.
Throughout this paper, we adopt a Chabrier initial mass function (23, IMF;) to estimate star formation rate (SFR) and stellar mass (). We assume a Planck cosmology (28) with . When necessary, data from the literature have been converted with a conversion factor of (102, IMF) = 1.7 (23, IMF). All magnitudes are in the AB system (93), such that log(Sν [Jy]).
2 Data, method and sample
2.1 NIRSpec prism spectroscopy and photometry
To build a JWST spectroscopic sample of massive galaxies, we select all sources with secure spectroscopic redshifts that have both NIRSpec prism spectroscopy and NIRCam imaging. We begin with all publicly available prism spectra from the DJA, using the latest v4 reductions (13; 30; 56; 55; 96)22 2 Latest DJA public spectra: https://s3.amazonaws.com/msaexp-nirspec/extractions/nirspec_public_v4.5.html. Only spectra with robust redshift measurements (quality grade = 3) are retained.
All selected sources have matched photometry from the multi-wavelength catalog, constructed following 11233 3 Latest photometric catalog database: https://s3.amazonaws.com/grizli-v2/JwstMosaics/v7/index.html?search=phot.fits using the latest datasets available in DJA, including HST and JWST/NIRCam photometry for all fields. For JWST/MIRI, we use available photometry from COSMOS-Web, SMILES, MIDIS, and MINERVA (see Appendix B for more details). The combined photometry covers the rest-frame UV-to-NIR, enabling uniform SED modeling for the entire sample.
The final spectroscopic-photometric catalog spans all prime JWST blank legacy fields, including COSMOS, UDS, EGS, GOODS-South, and GOODS-North (Fig. 1). It contains 6,312 unique galaxies at (7,045 individual prism observations) until the latest release of DJA v4.5 on February 23, 2026.

2.2 Joint SED fitting of photometry and prism spectra
To identify massive galaxy candidates and best constrain their star formation histories (SFHs) and stellar populations, we perform joint UV-to-NIR SED fitting by combining the JWST/NIRSpec prism spectra (wavelength coverage of 0.5 - 5.5m) and NIRCam broad-band photometry (F090W, F115W, F150W, F200W, F277W, F356W, F444W). This joint analysis leverages the complementary strengths of the two datasets: the broad-band photometry provides broad wavelength coverage and high signal-to-noise ratio (S/N); the prism spectra provide continuous low-resolution spectroscopy, capturing the continuum shape and strong emission lines when present.
We use the Bagpipes code (18; 17) to fit the observed spectra and photometry simultaneously at fixed . We adopt a non-parametric SFH using a flexible continuity prior following 72. The SFH is modeled using ten time bins. The first five bins are fixed at [0, 3, 10, 25, 50, 100] Myr, while the remaining five are logarithmically spaced between 100 Myr and the maximum allowed age, defined as the age of the Universe relative to its age at . We use the BPASS stellar population models, and apply the 101 dust attenuation curve, which allows for variable attenuation slopes and UV bump strength. The dust attenuation to the rest-frame V-band () values is allowed to vary from 0 to 6 mag, the deviation from 15 slope varies from to 0.3, and the 2175 Å bump strength varies from 0 to 5. The metallicities are sampled log-uniformly from 0.01 to 2.5 and the ionization parameters log between -4 and -1. To correct residual slit-loss of the spectra compared to the photometry, we adopt a second-order polynomial spectral calibration model with Bayesian priors, and introduce a wavelength-independent noise scaling factor with a wide log-uniform prior to absorb any residual systematics. All fits are performed using the nautilus nested sampling algorithm (71), which efficiently explores the high-dimensional posterior space. We have applied this modeling methodology, which we note is similar to and extends upon that presented by 29, to the full DJA compilation of prism spectra. Additional technical details, as well as a full release of the model products and catalogs (12,275 prism spectra at ), will be provided by Gottumukkala et al. (in prep.).
2.3 Massive galaxy sample
2.3.1 Sample selection
Our goal is to trace the build-up and evolution of the most massive galaxies across cosmic time. To construct a representative sample of such systems over a wide redshift range, we do not adopt a fixed stellar-mass threshold, since stellar mass evolves significantly with redshift. Furthermore, although the stellar mass function provides a statistical view of the distribution of galaxy stellar masses (116; 104; 54, e.g.,), it is primarily derived from large photometric samples and remains highly uncertain at the massive end, particularly at high redshift. Contaminants such as little red dots can lead to overestimated stellar masses (69, e.g.,), while sources with broad photometric-redshift probability distributions, such as the so-called Schrödinger’s galaxies (88; 128, e.g.,), can scatter across both redshift and stellar-mass bins, further biasing the high-mass end. Consequently, the observed stellar mass function does not provide a robust basis for defining a redshift-dependent cutoff.
Instead, we adopt a simple and physically motivated approach based on the evolution of the dark matter halo mass function (111), inspired by abundance matching (83; 9, e.g.,). Under the assumption that the most massive galaxies at each epoch reside in the most massive dark matter halos, we use the cumulative halo mass function to trace the redshift evolution of halo masses at a fixed comoving number density. Assuming a constant baryon-to-star conversion efficiency, this evolution defines the slope of our evolving stellar-mass cut. The overall normalization is then fixed by a representative anchor point, log at (similar to log at ), which effectively sets the intercept of the curve. This yields a well-defined redshift-dependent mass cut (see Fig. 5). With this criterion, we identify a total of 283 candidate massive galaxies from our sample of 6,312 spectroscopically confirmed sources at .
Among 283 candidate massive galaxies, some of these stellar mass estimates may be biased due to contamination from broad-line active galactic nuclei (AGNs), including quasars and the so-called Little Red Dots (78, LRDs; e.g.,). These sources can significantly boost the photometric fluxes and alter the continuum shape, leading to unreliable SED fitting results, especially since we do not include any AGN template in the fitting (121; 114, e.g.,). Narrow-line AGNs, on the other hand, generally have minimal impact on the broad-band SED and are not expected to bias the derived stellar masses significantly. Therefore, we perform a detailed cleaning procedure to identify and remove the broad-line AGN contaminants, as described in the following sections (Sect. 2.3.2 and Sect. 2.3.3).

2.3.2 Measurements of spectral properties
We performed emission-line fitting for a sample of 283 candidate massive galaxies observed with JWST/NIRSpec prism spectroscopy. For each galaxy, we fit up to five prominent rest-frame optical emission lines: H (blended with [N ii]), [S ii] (modeled as a single component centered at their mean wavelength), H, [O iii] , and [O iii] , using single-component Gaussian profiles. The [O iii] / flux ratio was fixed at 1:2.96. The was allowed to vary within of the DJA catalog value during the fitting process.
Emission lines were grouped into two configurations: (1) H+S ii and (2) H+[O iii]. The local continua were modeled separately using linear fits to line-free regions extending Å around each emission-line configuration and subtracted before fitting. Then, the emission-line fitting was carried out using a weighted least-squares method via scipy.optimize.curve_fit, with inverse-variance weighting based on the flux uncertainties. Initial guesses for line amplitudes were set based on the observed flux range after continuum subtraction, and the Gaussian widths were initialized based on the wavelength-dependent instrumental resolution66 6 Dispersion curves for the NIRSpec dispersers: https://jwst-docs.stsci.edu/jwst-near-infrared-spectrograph/nirspec-instrumentation/nirspec-dispersers-and-filters#gsc.tab=0. Parameter bounds allowed line amplitudes to vary from 0 to twice the approximate peak value, and line widths from half to twice the instrumental resolution. From the best-fit models, we derived integrated line fluxes, rest-frame equivalent widths (EW0), and total line widths (full widths at half maximum, i.e., FWHMs; including instrumental broadening). Flux uncertainties were estimated from the covariance matrix of the fits, while FWHM uncertainties were derived using Monte Carlo resampling. Emission lines with S/N below 5 were excluded from the final measurements to ensure robustness.
In addition to emission lines, we also modeled the continuum shape by fitting a power-law () to two broad rest-frame windows: 1500-3200Å and 4200-7000Å. These regions lie blueward and redward of the Balmer break at 3645Å, and are used to determine the rest-frame UV () and optical continuum slopes (), respectively. To minimize contamination from emission lines, we masked 50Å around all strong transitions. Fits were performed only if at least 25 valid spectral points remained in a given window after masking. The and provide a quantitative view of the continuum shape and are used in the following Sect. 2.3.3 to identify LRDs with “V-shaped” spectra, a feature often linked to broad-line AGNs (68; 50; 65; 125; 60, e.g.,).
2.3.3 Identification of broad-line AGNs and LRDs
To remove unreliable stellar mass estimates caused by AGN contamination, we identify broad-line AGNs using three complementary approaches: (1) broad Balmer line widths from spectral fitting, (2) compactness combined with a V-shaped continuum, and (3) cross-matching with previously identified AGN/LRD candidates from the literature and performing a visual inspection. Note that our goal is not to compile a complete massive galaxy catalog – particularly since our sources originate from various JWST programs with different selection biases – but to build up a clean sample free from sources that could bias the inferred stellar masses. Therefore, any source that satisfies at least one of these criteria is considered an AGN contaminant and removed from our final sample.
First, we flag galaxies exhibiting broad Balmer emission lines, defined as having a ratio of total to instrumental FWHM greater than 1.5 for either H or H (depending on prism coverage at a given redshift). At , however, H lies beyond the prism wavelength range, and at , both H and H fall outside the spectral coverage. More importantly, many broad-line AGNs may remain unidentified due to the limited prism resolution – particularly at lower redshifts, where the instrumental FWHM reaches km s-1 for H at and km s-1 for H at ; or their Balmer lines which are intrinsically weak and thus not significantly detected. Thus, relying solely on this criterion is insufficient.
Second, we identify additional candidates using photometric and spectroscopic criteria indicative of LRDs (125; 65; 60, e.g.,). Specifically, we select compact sources with ”v-shaped” continuum slopes, defined by:
These criteria are motivated by recent studies showing that such sources often host broad-line AGNs (50, e.g.,).
Third, we cross-match our candidate massive sources with representative samples of broad-line AGN and LRD candidates identified in the literature studies (65; 60; 66; 31; 62), which have either medium-resolution NIRSpec spectroscopy or use photometric selection as a complement to our criteria. This step mitigates the limitations of the prism, including its low spectral resolution and redshift-dependent wavelength coverage in both emission lines and continuum. Finally, we also visually inspect all candidate sources to ensure that no obvious AGN contaminants – such as point-like morphologies, broad features, or quasar-like continua – were missed.
In total, we identify 83 sources as broad-line AGN contaminants. After removing these, our final clean sample consists of 200 massive galaxies at .
2.3.4 A representative sample of top 3% most massive galaxies at
Fig. 5 presents the redshift-stellar mass distribution of our final sample of 200 massive galaxies, selected from the full JWST/NIRSpec prism spectroscopic catalog of 6,312 sources at in the legacy field. These galaxies represent approximately the top 3% most massive systems among all the public prism sources in the first 2 billion years of the Universe.
To place these galaxies in context, we compare their stellar masses to the maximum expected values within various cosmic volumes, including the full sky, COSMOS-Web (22, 0.5 deg2;), PANORAMIC (122, 0.12 deg2;), and FRESCO (92, 124 arcmin2;), assuming a redshift slice of . These limits are derived from the halo mass function (111) and the cosmic baryon fraction (; 28), adopting a baryon-to-star conversion efficiency such that . We illustrate two scenarios: a maximum observational efficiency at lower redshift (; also the value of the Milky Way; e.g., 83; 110) and the theoretical upper limit ().
Since our sample is taken from a heterogeneous collection of public JWST/NIRSpec prism programs, the effective survey volume cannot be precisely determined. For comparison, we examine the representative surveys listed above and find that some extremely massive galaxies at could lie at , if they were located in smaller-area fields such as FRESCO and PANORAMIC. However, we note that: 1) the inferred efficiency is highly sensitive to the assumed survey volume (126, and also subject to cosmic variance; see); 2) at , stellar-mass estimates become increasingly uncertain, as most sources lack photometric coverage redward of F444W (rest-frame B-band). Crucially, none of the 6,312 prism spectroscopic sources at exceed the theoretical maximum efficiency of across the full sky. This indicates that all galaxies observed with JWST/NIRSpec prism to date — including the most massive ones — remain consistent with theoretical expectations under the CDM framework.
2.4 Robustness of stellar mass estimates
Since stellar mass is the fundamental quantity used both to construct our massive galaxy sample and to derive the physical properties presented throughout this work, we assess the robustness of the inferred stellar masses against a range of commonly adopted SED modeling assumptions. Using the full spectroscopic sample of 6,312 galaxies, we compare stellar masses derived (1) with and without MIRI photometry, (2) using photometry only versus joint photometry+prism fitting, (3) BPASS versus BC03 stellar population synthesis models, (4) the 101 versus 15 dust attenuation curves, and (5) three alternative star formation histories (delayed-, double-power-law+burst, and constant SFH). The detailed comparisons are presented in Appendix B and Appendix C.
Overall, the inferred stellar masses are broadly consistent across the different fitting configurations (Table 8). The largest deviation is found for the constant-SFH model, which yields both the largest systematic offset ( dex) and the largest scatter (NMAD = 0.251 dex). This is expected because a constant SFH cannot reproduce the bursty growth and rapid quenching observed in high-redshift galaxies and is therefore included only as a simplified limiting case rather than as a physically realistic model. Excluding this case, the median offsets are small (0.004-0.046 dex), while the NMAD ranges from 0.033 to 0.186 dex.
The inclusion of MIRI photometry has a negligible effect on the inferred stellar masses in general, with a median offset of only 0.004 dex (0.075 dex) and an NMAD of 0.033 dex (0.182 dex) for all prism sources with MIRI (massive sources in this work). However, the relatively large scatter (NMAD = 0.182 dex) of the massive galaxy sample indicates that, although the overall statistical trends remain robust, individual stellar-mass estimates should still be treated with caution. More significant discrepancies are primarily associated with likely contaminants, including LRDs and broad-line AGNs (which are excluded from our final massive-galaxy catalog). In comparison, fitting only the photometric data yields a similarly small median offset (0.030 dex) but a substantially larger scatter (NMAD = 0.186 dex), highlighting the importance of prism spectroscopy for reducing degeneracies among stellar mass, stellar age, dust attenuation, and nebular emission.
We further examine how these alternative assumptions affect the selection of the most massive galaxies. As summarized in Table 8, excluding the intentionally simplified constant-SFH model, 77-90% of the galaxies in our final sample remain above the adopted evolving stellar-mass threshold under the different fitting assumptions. In particular, among the 61 massive galaxies with available MIRI photometry, 55 (90%) remain above the mass threshold after including the MIRI data. We therefore conclude that, although the inferred stellar masses of individual galaxies vary modestly under different assumptions, the selection of the 200 most massive galaxies, and hence the scientific conclusions presented throughout this paper, remain robust.
| Properties | Total | Massive sample | Massive normal SFGs | Massive dusty SFGs | Massive QGs |
|---|---|---|---|---|---|
| 6312 | 200 | 105 | 66 | 29 | |
| log | |||||
| log(sSFR100/yr-1) | |||||
| log(sSFR10/yr-1) | |||||
| [mag] |

3 Classification of massive galaxies
Given the clean sample of 200 most massive galaxies, we classify them into three broad categories according to their recent star-formation activity and dust content: 1) quiescent galaxies (QGs); 2) dust-obscured star-forming galaxies (dusty SFGs); and 3) normal star-forming galaxies (normal SFGs).
To select QGs, we apply an evolving specific star-formation rate (sSFR) criterion (16; 6; 45, criterion #1; e.g.,),
| (1) |
where is the cosmic age at each galaxy’s redshift. Since sSFR100Myr averages over the last 100 Myr, we find that some recently quenched or “dormant” systems with strong Balmer breaks and negligible current star formation are not captured by the above criterion #1 alone. To recover these galaxies, we add an additional criterion #2 based on spectral features: the strength of the Balmer break and the H equivalent width (EW), similar to 29:
| (2) | |||
| (3) |
We calculate and directly by fitting the observed spectra. The Balmer break strength () is calculated as the ratio of the values between two sides of the Balmer break, a blue window from and a red window from . The is the rest-frame H EW calculated by dividing the H flux by the H continuum. Given the limited prism resolution, H is blended with [N ii] doublet, we therefore apply a small correction, assuming that 90% of the blended flux stems from the H line. Intriguingly, we found all galaxies selected as dormant by this criterion #2 show very weak [O iii] emission, with Å, further supporting their quiescent nature.
In total, we identify 29 QGs, of which 5 satisfy only the dormant selection (criterion #2) and 16 satisfy both the sSFR and dormant criteria (criterion #1 & criterion #2).
The remaining galaxies are classified as star-forming and further divided into dusty SFGs and normal SFGs based on their dust attenuation derived from the joint SED fits. We classify them into dusty SFGs and normal SFGs depending on the mag or mag, respectively (8, e.g.,)77 7 We note that, in this work, dusty and normal SFGs are distinguished solely by mag. Dusty SFGs may include, but are not equivalent to, so-called SMGs or DSFGs selected via submillimeter observations, while normal SFGs ( mag) may still contain some dust.
Finally, the breakdown of our sample is: 29 QGs (including 5 recently quenched dormant galaxies that satisfy only criterion #2), 66 dusty SFGs, and 105 normal SFGs.
We note that our sample is not volume-complete due to multiple JWST programs (Table 4) with different target selections and depths. Therefore, these numbers do not exactly represent intrinsic fractions. However, we still expect that our galaxy sample is broadly representative of the underlying galaxy population.
4 Results
4.1 Distribution of massive galaxy populations
Figure 5 shows the stellar mass vs. distribution of the 200 most massive galaxies identified from the full sample of 6,312 spectroscopically confirmed galaxies at . By construction, the stellar-mass threshold decreases toward higher redshift following the evolving halo-mass function (Sect. 2.3.1), allowing us to trace a representative population of the most massive galaxies over the first two billion years of cosmic history. The sample spans a wide redshift range of , covering the full range of massive galaxies identified in the current public JWST/NIRSpec prism sample.
Figure 3 illustrates how the composition of the massive galaxy population evolves with cosmic time. At , dusty SFGs constitute a substantial fraction of the massive galaxy population. Toward higher redshift, the fraction of normal SFGs rises rapidly and becomes dominant by , while dusty SFGs and QGs become increasingly rare. This transition is also reflected in the dust properties of the massive galaxies. Most galaxies at have mag, whereas heavily obscured systems are primarily found at lower redshift. The decline of dust attenuation toward higher redshift is consistent with a picture in which the earliest massive galaxies formed before substantial metal enrichment and dust production had occurred. The lower stellar masses (and likely lower metallicities) of the high-redshift galaxies may also contribute to this trend (20; 39, e.g.,). Together, these trends suggest that substantial dust enrichment and the emergence of quenched massive systems become common only after the first Gyr of cosmic evolution.
The median physical properties of each population are summarized in Table 1. Massive dusty SFGs and QGs have comparable stellar masses (), while massive normal SFGs extend to lower masses due to their broader redshift distribution and the evolving mass selection. By construction, dusty SFGs exhibit substantially higher dust attenuation ( mag) than normal SFGs ( mag), whereas QGs ( mag) show suppressed star formation without extreme obscuration.


4.2 Star-formation activity and location relative to the star-forming main sequence
Figure 4 places the massive galaxies relative to the star-forming main sequence (SFMS). When adopting SFR, i.e., the SFR averaged over the last 100 Myr (left panel), massive normal SFGs and dusty SFGs lie predominantly on the SFMS, while QGs are typically dex below it. When using SFR (right panel), actively star-forming systems exhibit a larger scatter but remain broadly consistent with the SFMS. The increased dispersion is consistent with a stochastic or bursty mode of star formation (27; 106; 79, e.g.,).
Notably, the five recently quenched (dormant) galaxies lie on the SFMS when using SFR, indicating substantial star formation within the past 100 Myr. In contrast, when adopting SFR, these galaxies fall 1-2 dex below the SFMS. This divergence between SFR and SFR directly indicates a rapid recent decline in star formation, supporting their interpretation as recently and rapidly quenched systems. The existence of such galaxies suggests that at least some massive galaxies transition from active star formation to quiescence on timescales significantly shorter than 100 Myr.
In addition, we note that none of the massive galaxies lie far above the SFMS in an extreme starburst regime in the left panel. This apparent upper boundary is primarily driven by the adopted SFR timescale. Since SFR is averaged over 100 Myr, short-lived starbursts are smoothed out, lowering its apparent SFR at fixed stellar mass. A similar but weaker effect is present when using SFR, where the shorter averaging timescale allows for a somewhat larger scatter toward high SFRs. Therefore, the lack of extreme outliers above the SFMS does not imply a physical cutoff in star formation, but instead reflects the smoothing effect introduced by the chosen SFR timescale.
Overall, the majority of massive galaxies at are broadly consistent with the SFMS, while a substantial population of quenched and recently quenched systems is already in place within the first two billion years of cosmic time. Together with the population trends presented in Sect. 4.1, this suggests that the emergence of massive quiescent galaxies is accompanied by a progressive build-up of dust-rich and rapidly evolving massive systems at early cosmic epochs.


4.3 UVJ and (ugi)s
Rest-frame color-color selections such as UVJ have long provided a convenient, purely photometric separation between quiescent and star-forming galaxies (123; 12; 108; 84; 112; 10; 61, e.g.,). In Fig. 5, we compare these widely used selection criteria to our sample of 200 most massive galaxies, whose classifications are based on sSFR and spectroscopic diagnostics (Sect. 3). In the UVJ plane (Fig. 5-left), a clear mismatch shows: while many of our massive QGs lie within the classical quiescent box, a fraction of 30% massive QGs – especially the recently quenched systems – fall close to the boundary or outside the UVJ box, even when adopting a looser criterion allowing for an extra padding of 0.2 mag. At the same time, several massive normal SFGs and dusty SFGs are also scattered into the nominal quiescent region.
This mismatch is not unexpected in the JWST era and highlights that UVJ boundaries calibrated primarily at lower redshift are not necessarily portable to massive galaxies at (4; 49; 73; 118, e.g.,). One issue is: high- QGs typically host younger stellar populations, resulting in relatively shallow Balmer breaks and therefore bluer colors compared to lower-redshift quiescent systems. As a result, recently quenched massive galaxies can fail the traditional UVJ selection (95, e.g.,). Second, UVJ relies critically on a robust estimate of rest-frame ; however, at the rest-frame band has already moved beyond the longest JWST/NIRCam coverage (F444W), making color increasingly sensitive to extrapolation and SED-template assumptions. Such extrapolation can alter rest-frame by up to 1 mag, directly affecting whether a galaxy falls inside or outside the UVJ-quiescent region (4). Third, strong rest-frame optical emission lines and dust attenuation can bias broad-band fluxes and mimic redder colors, making some star-forming galaxies appear quiescent in UVJ space. This contamination becomes increasingly important at high redshift as extreme emission-line galaxies become more common.
Motivated by these limitations, 4 proposed the synthetic (ugi)s diagram, designed to reduce sensitivity to rest-frame extrapolation and emission-line contamination. In Fig. 5-right, the (ugi)s space indeed produces a tighter sequence than UVJ. However, when adopting the original 4 quiescent boundary (dashed line), we find that a significant number of our massive dusty SFGs fall inside the nominal QG region. In other words, for our massive sample, this criterion encloses not only spectroscopically confirmed QGs but also a large fraction of dusty SFGs. A similar issue has also been reported by 129. This contamination directly motivates us to redefine the boundary.
We therefore introduce an empirical (ugi)s criterion tailored to our spectroscopic massive sample (red line in Fig. 5-right):
| (4) |
The new boundary is adjusted to better isolate spectroscopically selected massive QGs, while minimizing overlap with the massive dusty SFGs and massive normal SFGs.
Note that even in (ugi)s space, rest-frame colors remain sensitive to SED modeling and limited long-wavelength coverage. In particular, the rest-frame i band shifts beyond F444W at , making the inferred colors increasingly dependent on extrapolation. In addition, small shifts within the color uncertainties can move galaxies across the selection boundaries. As a result, color-color selections can help separate high- massive QGs, dusty SFGs, and normal SFGs in a statistical sense, but contamination between the populations cannot be fully avoided. Throughout this work, we therefore adopt spectroscopically anchored criteria (sSFR, Balmer-break strength, and ) as our primary classification scheme.
| Stack parameter | log | log(SFR100/yr-1) | [mag] | [Gyr] | ||
|---|---|---|---|---|---|---|
| (500 Myr cosmic age bin) | ||||||
| 58 | 3.44 | |||||
| 54 | 4.38 | |||||
| 38 | 5.95 | |||||
| 49 | 9.81 | |||||
| galaxy population | ||||||
| Massive dusty SFG | 65 | 3.69 | ||||
| Massive QG | 29 | 3.97 | ||||
| Massive normal SFG () | 67 | 5.59 | ||||
| Massive normal SFG () | 37 | 10.51 | ||||
- •
Note. Values correspond to physical properties derived from SED fitting of the median stacked spectra using Bagpipes, with uncertainties indicating the th-th percentile ranges. is defined as the age of the Universe when 50% of the final stellar mass had formed.
4.4 Stacking spectra and derived properties
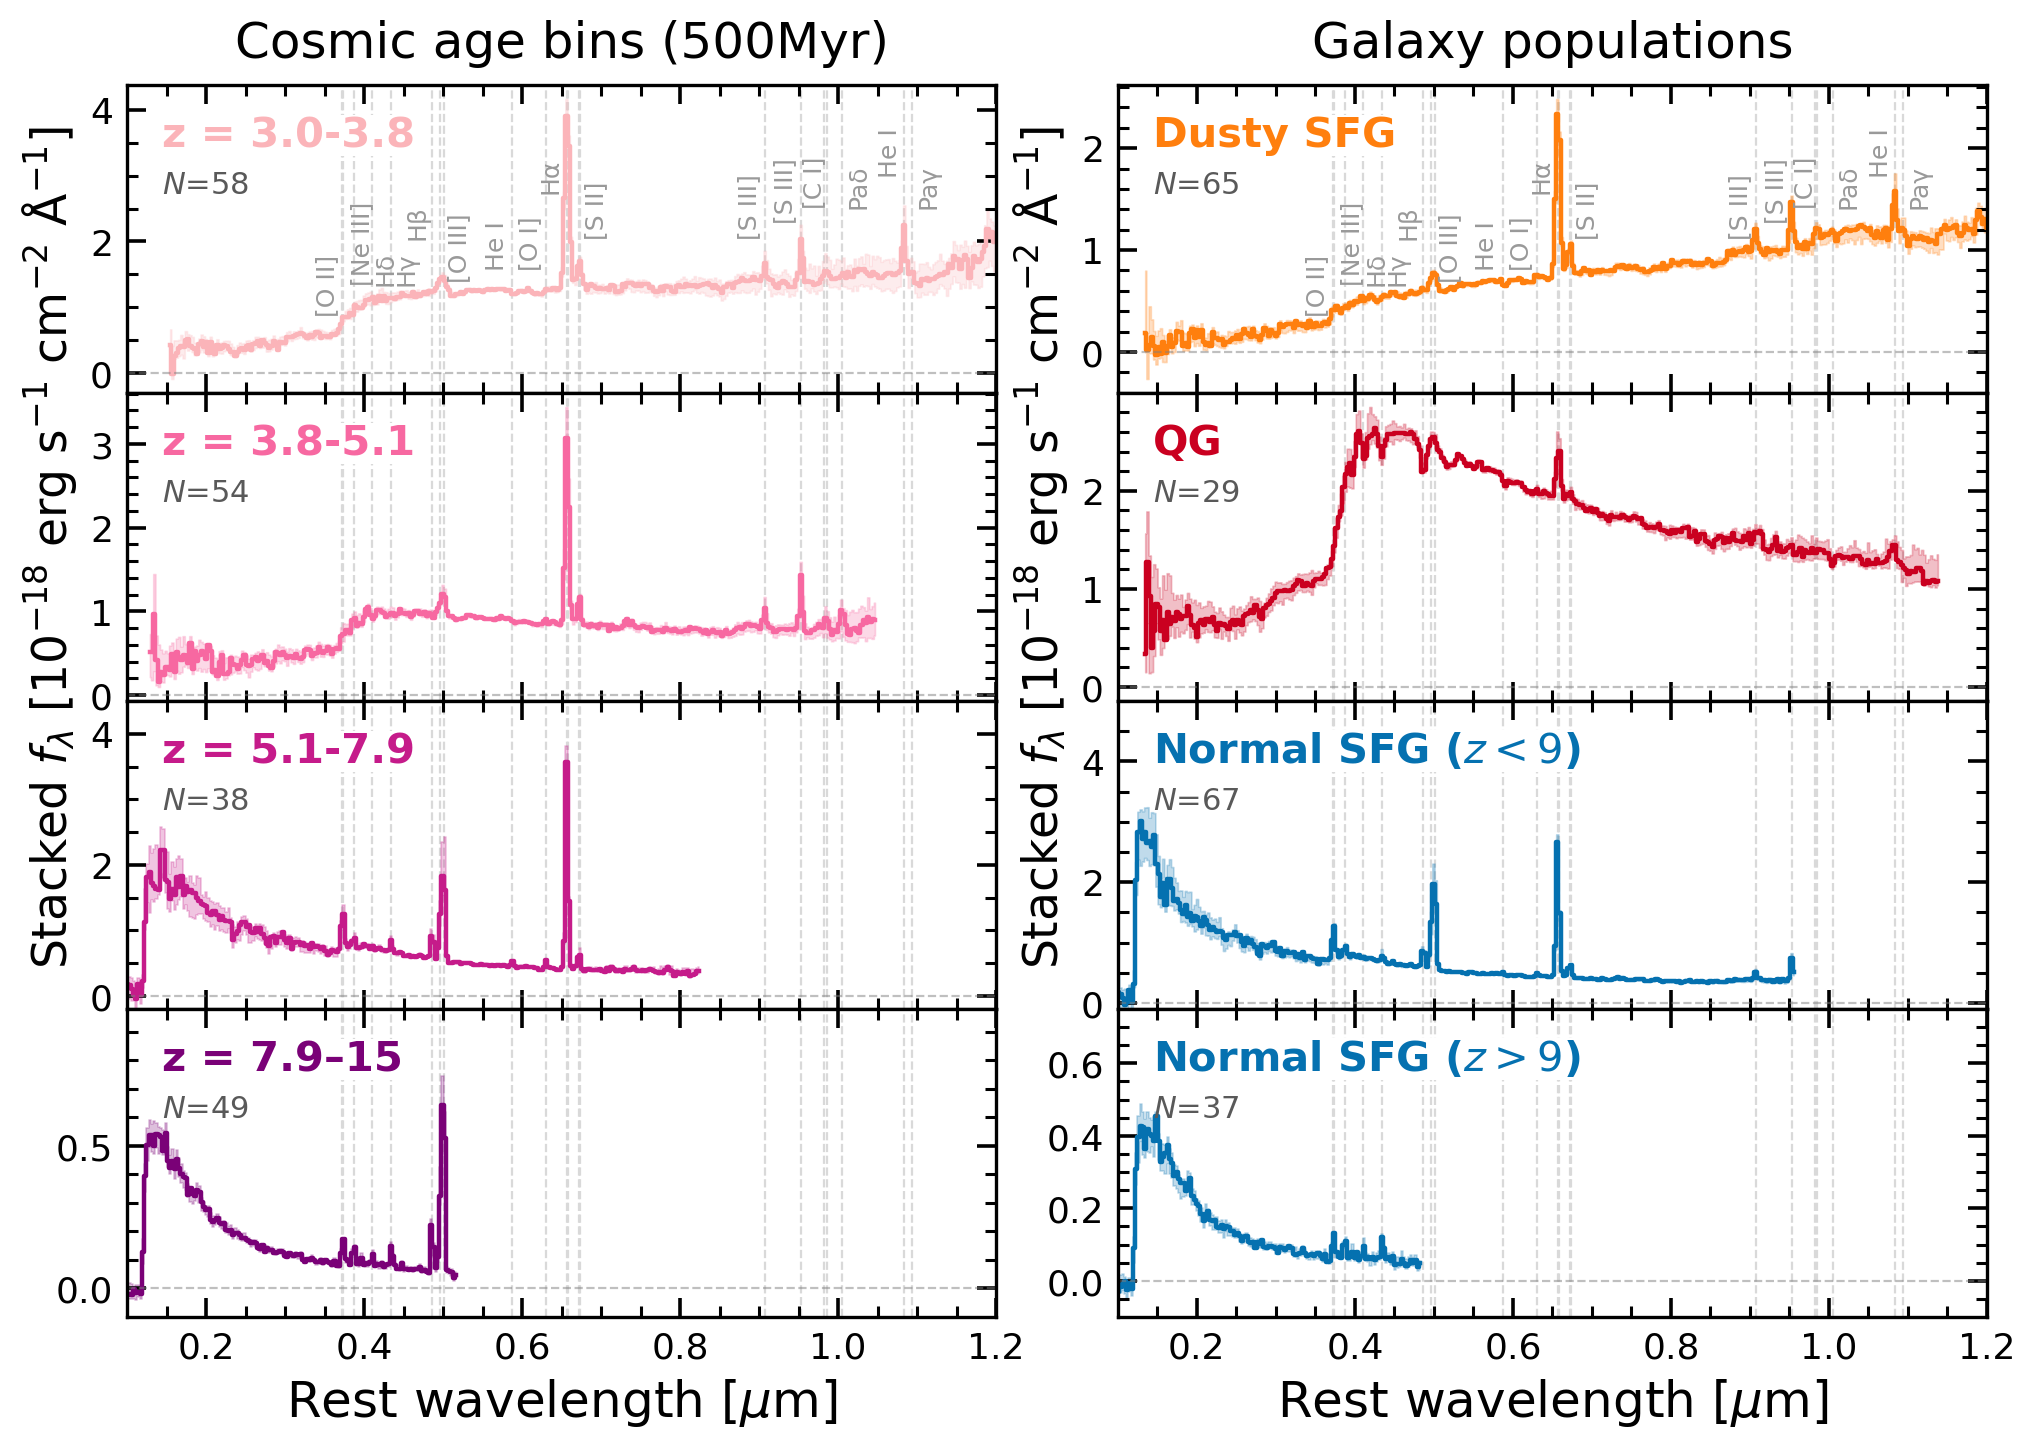
To better characterize the global spectral properties of massive galaxies and to improve the S/N ratio of faint spectral features, we construct median stacked spectra for the 200 massive galaxies in redshift bins and by galaxy population (Fig. 6). Each prism spectrum is first converted from observed flux density to rest-frame luminosity density using its , thereby removing redshift-dependent effects in both wavelength and flux. Prior to stacking, slit-loss corrections are applied based on the best-fit SED of each individual galaxy (Sect. 2.2). To preserve spectral shapes while minimizing luminosity-driven biases, each spectrum is normalized within a rest-frame window at m. The normalized spectra are then resampled onto a common rest-frame wavelength grid and combined using a median stacking approach. At each wavelength, stacked values are retained only if at least 10 galaxies contribute, ensuring robust statistics. Uncertainties are estimated via bootstrap resampling, including both source resampling and perturbations based on flux uncertainties. Finally, the stacked spectra and their uncertainties are converted back to the observed frame using the median redshift of each bin.
The stacked spectra in redshift bins (Fig. 6-left) reveal a clear evolution with cosmic time. At the highest redshifts (), the spectra are dominated by blue continua with weak Balmer breaks, indicating young stellar populations and low dust attenuation. Toward lower redshift, the continuum becomes progressively redder, with the stronger Balmer break, consistent with the build-up of more evolved stellar populations. By , the stacked spectra show prominent Balmer breaks and red continua, indicative of significant dust attenuation and more mature stellar populations. Strong nebular emission lines (e.g., H, H, and [O iii]) are detected across all redshift bins, with variations in relative strength reflecting changes in the underlying ISM conditions. These trends are consistent with the physical properties derived from SED fitting of the median stacked spectra (Table 2), where both stellar mass and dust attenuation decrease toward earlier cosmic times.
The stacked spectra separated by galaxy population (Fig. 6-right) show distinct spectral signatures. Massive normal SFGs exhibit blue continua and strong emission lines, characteristic of actively star-forming systems with modest dust attenuation. Massive dusty SFGs display significantly redder continua with suppressed UV emission, together with prominent emission lines, consistent with heavily obscured star formation. In contrast, massive QGs show pronounced Balmer breaks and weak or absent emission lines (32, the weak feature at 6500 Å is likely dominated by blended [N ii] doublet rather than H; e.g., ), indicating little ongoing star formation. These spectral differences provide an independent validation of our classification based on sSFR, Balmer-break strength, and dust attenuation (Sect. 3).
To further quantify these trends, we perform SED fitting on the median stacked spectra using Bagpipes, adopting the same parameterization and priors as for the individual galaxies (Sect. 2.2). The resulting median physical properties are summarized in Table 2, and their evolution with cosmic time is shown in Fig. 7. The stellar mass assembly histories (Fig. 7-left) indicate that massive galaxies build up a substantial fraction of their stellar mass rapidly at early times, with decreasing toward higher redshift in absolute time while remaining a significant fraction of the cosmic age at each epoch. At the same time, the dust attenuation (Fig. 7-middle) shows a clear decline with increasing redshift, consistent with progressively lower levels of dust and metal enrichment toward earlier cosmic times. This behavior is in good agreement with the trend observed for individual galaxies in Fig. 3. The offset from the star-forming main sequence (Fig. 7-right) indicates that, on average, the massive galaxy population remains broadly consistent with the main sequence within the typical scatter, although individual populations exhibit significant diversity.
Taken together, the stacked spectra and their derived properties suggest a coherent evolutionary picture in which the most massive galaxies transition from predominantly blue, less obscured star-forming systems at to more dust-rich and evolved systems by , while maintaining star-formation activity broadly consistent with the main sequence. However, we caution that these trends may be influenced by selection effects in the current JWST spectroscopic sample, e.g., high- surveys may be biased against the dustiest galaxies at high redshift.
4.5 Mass assembly history
The distinct spectral properties and physical characteristics of the massive QGs, dusty SFGs, and normal SFGs suggest that these populations represent different stages of massive galaxy evolution. To investigate their possible evolutionary connections, we compare the stellar mass assembly histories of the three populations derived from the median stacked spectra. Fig. 8 shows the resulting assembly tracks from Bagpipes SED fitting for the three redshift bins (, , and ; 750 Myr cosmic age intervals) of different massive galaxy populations. The assembly histories are overplotted on the stellar mass-cosmic age plane, along with the full prism spectroscopic sample.
The inferred assembly histories indicate that massive QGs at had already assembled most of their stellar mass within the first 1 Gyr after the Big Bang, implying that the bulk of their stellar mass was already in place roughly 500 Myr before the observed epoch and prior to quenching. This picture is supported by their stacked spectra, which exhibit pronounced Balmer breaks together with weak nebular emission lines (Fig. 6), indicative of evolved stellar populations and strongly suppressed ongoing star formation. Such rapid early assembly is broadly consistent with recent studies suggesting that high-redshift massive quiescent galaxies often experienced bursty rather than smoothly declining SFHs (43; 89, e.g.,). Interestingly, the higher-redshift QG stack follows a broadly similar assembly history while reaching a comparable stellar mass at an even earlier cosmic epoch. Such an alignment suggests that the formation and quenching of massive galaxies within the first billion years of cosmic history were driven by similar mechanisms to those at lower redshifts, both of which cause rapid star formation quenching.
The massive normal SFGs exhibit markedly different assembly histories across redshift. Both the highest-redshift () and lowest-redshift () stacks show relatively gradual stellar-mass growth. However, the intermediate-redshift normal SFGs () display a substantially steeper assembly history, rapidly building up stellar masses of within less than 100 Myr of cosmic time. Such rapid growth is broadly consistent with scenarios in which a large fraction of the stellar mass is assembled during a short period of intense star formation, resembling the “monolithic” growth picture proposed for some of the UV-bright starburst galaxies at (76; 34, e.g.,). The diversity of assembly histories among the normal SFGs suggests that massive star-forming galaxies might not follow a single evolutionary mode, but instead experience both relatively gradual and highly accelerated phases of stellar-mass assembly.


The massive dusty SFGs show substantial stellar-mass growth at early cosmic times while maintaining intense ongoing star formation. Massive galaxies at the highest redshifts are predominantly blue systems with low dust attenuation, whereas dusty SFGs become increasingly common at later cosmic times. A natural interpretation is that the earliest massive galaxies formed during epochs when the Universe had not yet experienced sufficient metal enrichment to produce large dust reservoirs. Alternatively, dust may be more efficiently expelled by stellar feedback in lower-mass galaxies, while only the more massive systems are able to retain substantial dust reservoirs over longer timescales. Metals produced by the earlier generations of stars and SNe subsequently enriched the ISM and invoked efficient dust formation at later cosmic times. This led to the increase of dust obscuration in massive galaxies, eventually giving rise to the massive dusty SFG population commonly observed at .
Taken together, the assembly histories reveal a diversity of growth modes among the most massive galaxies in the early Universe, ranging from relatively gradual stellar-mass build-up to extremely rapid assembly. In the following Sect. 5, we will discuss the possible evolutionary connections between different massive galaxy populations and caveats.
5 Evolutionary pathways of the most massive galaxies
The assembly histories presented in Fig. 8 suggest that the massive QGs, dusty SFGs, and normal SFGs may be linked through a common evolutionary framework. However, the inferred connections between these populations are not unique, and multiple evolutionary pathways may contribute to the formation of the most massive galaxies in the early Universe. The two schematic evolutionary pathways discussed below are illustrated in the conceptual diagram shown in Fig. 9.
One possible pathway is that galaxies evolve from normal SFGs into dusty SFGs and subsequently cease their star formation and evolve to massive QGs. This scenario is naturally supported by the observed evolution of dust attenuation. Massive galaxies at the highest redshifts are predominantly blue systems with relatively low dust attenuation and lower , whereas the more massive dusty SFGs become increasingly common toward lower redshift. The systematic increase in with cosmic time and mass suggests ongoing metal enrichment and dust production, gradually transforming initially unobscured star-forming galaxies into heavily obscured systems. In this picture, dusty SFGs represent a transitional phase between early star-forming galaxies and the massive quiescent population observed at . The assembly histories shown in Fig. 8 are broadly consistent with such a sequence, where the confidence interval of massive normal SFGs at and (which assemble their stellar mass through both relatively gradual and rapid growth) broadly aligns with that of dusty SFGs at and massive QGs at .
A second pathway may involve a more direct transition from normal SFGs to QGs without passing through a prolonged dusty star-forming phase. This possibility is motivated by the highest-redshift normal SFG population (), which already contains massive systems at very early cosmic times and may plausibly evolve into the quiescent population observed at , as indicated by the general consistency between their mass assembly histories in Fig. 8. In this picture, quenching occurs before substantial dust enrichment has taken place, bypassing the dusty SFG phase that appears to be common among massive galaxies at later cosmic times.
Nevertheless, these evolutionary pathways should not be interpreted as direct progenitor-descendant tracks. The median assembly histories shown in Fig. 8 represent only the average behavior of each population, while the actual SFHs of individual galaxies are likely substantially more diverse. Furthermore, the “most massive” galaxies selected at different redshifts do not necessarily trace a single continuously evolving population. Galaxies may enter or leave the massive galaxy selection as their star formation histories evolve, particularly if their growth is bursty rather than smooth. As a result, the observed massive galaxy population at a given epoch likely reflects a mixture of systems caught at different stages of assembly, dust enrichment, and quenching rather than a single evolutionary sequence.
Finally, we caution that the inferred stellar mass assembly histories, particularly for dusty SFGs and normal SFGs, remain uncertain. In actively star-forming galaxies, the observed light can be dominated by young stellar populations, leading to the well-known outshining effect (90; 47, e.g.,), where older underlying stellar populations become difficult to constrain. This issue is likely amplified in dusty SFGs due to heavy dust obscuration (51, e.g.,). In addition, degeneracies between stellar age, dust attenuation, metallicity, and the reconstruction of complex non-parametric SFHs can broaden the allowed solutions, especially at early cosmic times. Therefore, while the relative differences between galaxy populations are likely robust, the detailed assembly timescales and early SFHs should still be interpreted with caution.
6 Conclusions
Using all publicly available JWST/NIRSpec prism spectroscopy in the DAWN JWST Archive (v4.5), we construct the first spectroscopic census of the 200 most massive galaxies at . This sample represents the top 3% most massive systems within a parent sample of 6,312 spectroscopically confirmed galaxies in JWST blank-field legacy fields, including COSMOS, UDS, EGS, GOODS-South, and GOODS-North. By combining joint SED fitting of NIRSpec spectroscopy and multi-band photometry, we assess the robustness of their inferred stellar masses and investigate their demographics, physical properties, and evolutionary pathways of the most massive galaxies during the first two billion years of cosmic history. Our main conclusions are as follows:
- 1.
We construct a clean sample of the 200 most massive galaxies after identifying and removing likely contaminants, including broad-line AGNs and LRDs (Figs. 1, 5, 13). We further demonstrate that the inferred stellar masses are robust against commonly adopted SED modeling assumptions, including different stellar population models, dust attenuation curves, star formation histories, and the inclusion of MIRI photometry (Figs. 11, 12; Table 8).
- 2.
Massive galaxies exhibit a strong demographic transition with cosmic time (Fig. 3). At , the population is dominated by normal SFGs, whereas dusty SFGs and QGs become increasingly common toward lower redshift. Dust attenuation also decreases systematically toward higher redshift, indicating that the earliest massive galaxies were, on average, less chemically enriched than their lower-redshift counterparts.
- 3.
We identify 29 massive QGs, including recently quenched galaxies whose star formation declined rapidly within the past Myr (Fig. 4). Their locations relative to the SFMS and their strong Balmer breaks indicate that rapid quenching was already occurring within the first two billion years after the Big Bang.
- 4.
We show that both the traditional UVJ selection and recently proposed criterion exhibit significant incompleteness and contamination when applied to massive galaxies at (Fig. 5). Motivated by our spectroscopically classified sample, we propose an updated empirical criterion that provides a cleaner separation between QGs and SFGs.
- 5.
Combining the stacked spectra, reconstructed SFHs, and demographic evolution (Figs. 6, 7, Table 2), we propose that massive galaxies likely evolve through at least two pathways toward quiescence: one proceeds through a dust-enriched phase linking normal SFGs, dusty SFGs, and QGs, while another connects normal SFGs directly to QGs without a prolonged dusty phase (Figs. 8, 9). Massive normal SFGs themselves exhibit both relatively gradual and rapid stellar-mass assembly modes.
- 6.
Together, these results suggest that rapid stellar-mass assembly, dust enrichment, and star-formation quenching were already shaping the evolutionary pathways of the most massive galaxies within the first billion years after the Big Bang.
Our spectroscopic census provides a statistical spectroscopic view for studying massive galaxies across the first two billion years of cosmic history and establishes an observational foundation for future comparisons with galaxy formation models and cosmological simulations. We caution that our sample is assembled from heterogeneous JWST programs (Table 4) with different selection functions and is therefore not volume-complete. Nevertheless, it places important constraints on the demographics and evolutionary pathways of the earliest massive galaxies. The physical mechanisms responsible for their rapid stellar-mass assembly, dust enrichment, and quenching, however, remain poorly understood. Ongoing and future ALMA observations (e.g., Qi et al., in prep.) will provide key constraints on the cold gas and dust reservoirs of these systems, while upcoming large-area spectroscopic surveys from facilities including Euclid, the Nancy Grace Roman Space Telescope, and the concept AtLAST and LST, will extend this census to much larger cosmic volumes. Combined with cosmological simulations, these observations will enable the evolutionary pathways identified in this work to be tested quantitatively, providing a more complete picture of how the most massive galaxies assembled and evolved during the first two billion years of cosmic history.
References
- [1] (2024) EPOCHS. II. The Ultraviolet Luminosity Function from 7.5 ¡ z ¡ 13.5 Using 180 arcmin$^2$ of Deep, Blank Fields from the PEARLS Survey and Public JWST Data. ApJ 965 (2), pp. 169. External Links: 10.3847/1538-4357/ad2a7b Cited by: §1.
- [2] (2025) JWST+ALMA reveal the ISM kinematics and stellar structure of MAMBO-9, a merging pair of DSFGs in an overdense environment at $z=5.85$. arXiv e-prints, pp. arXiv:2508.06607. External Links: 10.48550/arXiv.2508.06607 Cited by: Figure 10.
- [3] (2024) SMILES Initial Data Release: Unveiling the Obscured Universe with MIRI Multiband Imaging. ApJ 976 (2), pp. 224. External Links: 10.3847/1538-4357/ad7396 Cited by: 1st item.
- [4] (2023) Beyond UVJ: Color Selection of Galaxies in the JWST Era. ApJ 943 (2), pp. 166. External Links: 10.3847/1538-4357/aca294 Cited by: Figure 5, §4.3, §4.3.
- [5] (2023) Confirmation and refutation of very luminous galaxies in the early Universe. Nature 622 (7984), pp. 707-711. External Links: 10.1038/s41586-023-06521-7 Cited by: Table 4.
- [6] (2025) Double Trouble: Two spectroscopically confirmed low-mass quiescent galaxies at z>5 in overdensities. arXiv e-prints, pp. arXiv:2509.09761. External Links: 10.48550/arXiv.2509.09761 Cited by: §3.
- [7] (2025) Quiescent or dusty? Unveiling the nature of extremely red galaxies at z>3. MNRAS. External Links: 10.1093/mnras/staf013 Cited by: Table 4.
- [8] (2024) Quiescent or dusty? Unveiling the nature of extremely red galaxies at $z>3$. arXiv e-prints, pp. arXiv:2404.08052. External Links: 10.48550/arXiv.2404.08052 Cited by: §3.
- [9] (2019) UNIVERSEMACHINE: The correlation between galaxy growth and dark matter halo assembly from z = 0-10. MNRAS 488 (3), pp. 3143-3194. External Links: 10.1093/mnras/stz1182 Cited by: §1, §2.3.1.
- [10] (2019) MOSFIRE Spectroscopy of Quiescent Galaxies at 1.5 < z < 2.5. II. Star Formation Histories and Galaxy Quenching. ApJ 874 (1), pp. 17. External Links: 10.3847/1538-4357/ab07af Cited by: §4.3.
- [11] (2023) Stress testing $\Lambda$CDM with high-redshift galaxy candidates. Nature Astronomy 7, pp. 731-735. External Links: 10.1038/s41550-023-01937-7 Cited by: §1.
- [12] (2011) The Number Density and Mass Density of Star-forming and Quiescent Galaxies at 0.4 <= z <= 2.2. ApJ 739 (1), pp. 24. External Links: 10.1088/0004-637X/739/1/24 Cited by: §4.3.
- [13] msaexp: NIRSpec analyis tools External Links: 10.5281/zenodo.7299500, https://github.com/gbrammer/msaexp Cited by: §2.1.
- [14] (2024) JADES NIRSpec initial data release for the Hubble Ultra Deep Field: Redshifts and line fluxes of distant galaxies from the deepest JWST Cycle 1 NIRSpec multi-object spectroscopy. A&A 690, pp. A288. External Links: 10.1051/0004-6361/202347094 Cited by: §1.
- [15] (2000) The Dust Content and Opacity of Actively Star-forming Galaxies. ApJ 533 (2), pp. 682-695. External Links: 10.1086/308692 Cited by: Figure 12, Table 3, Appendix C, §2.2, §2.4.
- [16] (2024) The JWST EXCELS survey: too much, too young, too fast? Ultra-massive quiescent galaxies at 3 < z < 5. MNRAS 534 (1), pp. 325-348. External Links: 10.1093/mnras/stae2092 Cited by: §3.
- [17] (2019) The VANDELS survey: the star-formation histories of massive quiescent galaxies at 1.0 < z < 1.3. MNRAS 490 (1), pp. 417-439. External Links: 10.1093/mnras/stz2544 Cited by: §2.2.
- [18] (2018) Inferring the star formation histories of massive quiescent galaxies with BAGPIPES: evidence for multiple quenching mechanisms. MNRAS 480 (4), pp. 4379-4401. External Links: 10.1093/mnras/sty2169 Cited by: §2.2.
- [19] (2023) A massive quiescent galaxy at redshift 4.658. Nature 619 (7971), pp. 716-719. External Links: 10.1038/s41586-023-06158-6 Cited by: §1.
- [20] (2026) Dust in the Average Galaxy: Attenuation, Emission, and Opacity from 0<z<7. arXiv e-prints, pp. arXiv:2606.17270. External Links: 10.48550/arXiv.2606.17270 Cited by: §4.1.
- [21] (2024) COSMOS-Web: Intrinsically Luminous z $\gtrsim$ 10 Galaxy Candidates Test Early Stellar Mass Assembly. ApJ 965 (1), pp. 98. External Links: 10.3847/1538-4357/ad2075 Cited by: §1.
- [22] (2023) COSMOS-Web: An Overview of the JWST Cosmic Origins Survey. ApJ 954 (1), pp. 31. External Links: 10.3847/1538-4357/acc2bc Cited by: §2.3.4.
- [23] (2003) Galactic Stellar and Substellar Initial Mass Function. PASP 115 (809), pp. 763-795. External Links: 10.1086/376392 Cited by: §1.
- [24] (2017) Galaxy Protoclusters as Drivers of Cosmic Star Formation History in the First 2 Gyr. ApJ 844 (2), pp. L23. External Links: 10.3847/2041-8213/aa7e7b Cited by: §1.
- [25] (2024) Evidence for a Shallow Evolution in the Volume Densities of Massive Galaxies at z = 4–8 from CEERS. AJ 168 (3), pp. 113. External Links: 10.3847/1538-3881/ad57c1 Cited by: §1.
- [26] (2026) Massive Galaxies Form Early and Gray: Stellar Assembly and Dust Attenuation at $\mathbfz>3.5$ from CAPERS. arXiv e-prints, pp. arXiv:2605.13966. External Links: 10.48550/arXiv.2605.13966 Cited by: §1.
- [27] (2024) Identification of a transition from stochastic to secular star formation around z = 9 with JWST. A&A 686, pp. A128. External Links: 10.1051/0004-6361/202348091 Cited by: §4.2.
- [28] (2020) Planck 2018 results. VI. Cosmological parameters. A&A 641, pp. A6. External Links: 10.1051/0004-6361/201833910 Cited by: §1, §2.3.4.
- [29] (2025) A systematic search for dormant galaxies at z\raisebox-2.15277pt\textasciitilde5-7 from the JWST NIRSpec archive. arXiv e-prints, pp. arXiv:2506.22540. External Links: 10.48550/arXiv.2506.22540 Cited by: §2.2, §3.
- [30] (2025) RUBIES: A complete census of the bright and red distant Universe with JWST/NIRSpec. A&A 697, pp. A189. External Links: 10.1051/0004-6361/202452186 Cited by: Table 4, §1, §2.1.
- [31] (2025) Little Red Dots host Black Hole Stars: A unified family of gas-reddened AGN revealed by JWST/NIRSpec spectroscopy. arXiv e-prints, pp. arXiv:2511.21820. External Links: 10.48550/arXiv.2511.21820 Cited by: §2.3.3.
- [32] (2025) Efficient formation of a massive quiescent galaxy at redshift 4.9. Nature Astronomy 9, pp. 280-292. External Links: 10.1038/s41550-024-02424-3 Cited by: Figure 10, §1, §4.4.
- [33] (2023) Efficient formation of massive galaxies at cosmic dawn by feedback-free starbursts. MNRAS 523 (3), pp. 3201-3218. External Links: 10.1093/mnras/stad1557 Cited by: §1.
- [34] (2025) Unveiling dust, molecular gas, and high star-formation efficiency in extremely UV bright star-forming galaxies at z $\sim$ 2.1─3.6. A&A 693, pp. A17. External Links: 10.1051/0004-6361/202451832 Cited by: §4.5.
- [35] (2023) The evolution of the galaxy UV luminosity function at redshifts z ≃ 8 - 15 from deep JWST and ground-based near-infrared imaging. MNRAS 518 (4), pp. 6011-6040. External Links: 10.1093/mnras/stac3472 Cited by: §1.
- [36] (2024) JADES Data Release 3 -- NIRSpec/MSA spectroscopy for 4,000 galaxies in the GOODS fields. arXiv e-prints, pp. arXiv:2404.06531. External Links: 10.48550/arXiv.2404.06531 Cited by: Table 4.
- [37] (2023) Overview of the JWST Advanced Deep Extragalactic Survey (JADES). arXiv e-prints, pp. arXiv:2306.02465. External Links: 10.48550/arXiv.2306.02465 Cited by: Table 4.
- [38] (2018) Starbursts in and out of the star-formation main sequence. A&A 616, pp. A110. External Links: 10.1051/0004-6361/201732370 Cited by: §1.
- [39] (2026) The ALPINE─CRISTAL─JWST Survey: The Fast Metal Enrichment of Massive Galaxies at z $\sim$ 5. ApJ 1004 (1), pp. 22. External Links: 10.3847/1538-4357/ae6645 Cited by: §1, §4.1.
- [40] (2023) The JWST Hubble Sequence: The Rest-frame Optical Evolution of Galaxy Structure at 1.5 < z < 6.5. ApJ 955 (2), pp. 94. External Links: 10.3847/1538-4357/acec76 Cited by: §1.
- [41] (2025) The Cosmic Evolution Early Release Science Survey (CEERS). ApJ 983 (1), pp. L4. External Links: 10.3847/2041-8213/adbbd3 Cited by: Table 4.
- [42] (2024) The Complete CEERS Early Universe Galaxy Sample: A Surprisingly Slow Evolution of the Space Density of Bright Galaxies at z $\sim$ 8.5–14.5. ApJ 969 (1), pp. L2. External Links: 10.3847/2041-8213/ad4495 Cited by: §1.
- [43] (2020) The Massive Ancient Galaxies at z > 3 NEar-infrared (MAGAZ3NE) Survey: Confirmation of Extremely Rapid Star Formation and Quenching Timescales for Massive Galaxies in the Early Universe. ApJ 903 (1), pp. 47. External Links: 10.3847/1538-4357/abb819 Cited by: §4.5.
- [44] (2026) How galaxies acquire their stellar mass at high redshift: High star formation efficiencies and the relative roles of dust and initial mass function. arXiv e-prints, pp. arXiv:2605.26209. External Links: 10.48550/arXiv.2605.26209 Cited by: §1.
- [45] (2014) Charting the Evolution of the Ages and Metallicities of Massive Galaxies since z = 0.7. ApJ 788 (1), pp. 72. External Links: 10.1088/0004-637X/788/1/72 Cited by: §3.
- [46] (2024) Not-so-little Red Dots: Two Massive and Dusty Starbursts at z $\sim$ 5–7 Pushing the Limits of Star Formation Discovered by JWST in the COSMOS-Web Survey. ApJ 973 (1), pp. L2. External Links: 10.3847/2041-8213/ad738a Cited by: §1.
- [47] (2024) Outshining in the spatially resolved analysis of a strongly lensed galaxy at z = 6.072 with JWST NIRCam. A&A 686, pp. A63. External Links: 10.1051/0004-6361/202349135 Cited by: §5.
- [48] (2024) A massive galaxy that formed its stars at z $\approx$ 11. Nature 628 (8007), pp. 277-281. External Links: 10.1038/s41586-024-07191-9 Cited by: §1.
- [49] (2023) COSMOS2020: Exploring the Dawn of Quenching for Massive Galaxies at 3 < z < 5 with a New Color-selection Method. AJ 165 (6), pp. 248. External Links: 10.3847/1538-3881/accadc Cited by: §4.3.
- [50] (2024) UNCOVER Spectroscopy Confirms the Surprising Ubiquity of Active Galactic Nuclei in Red Sources at z > 5. ApJ 964 (1), pp. 39. External Links: 10.3847/1538-4357/ad1e5f Cited by: §2.3.2, §2.3.3.
- [51] (2026) There Is More to Outshining: 2D Dust Effects on Stellar Mass Estimates at $3\leqz<9$ with JWST in the JADES Field. arXiv e-prints, pp. arXiv:2601.15963. External Links: 10.48550/arXiv.2601.15963 Cited by: §5.
- [52] (2024) Pure Spectroscopic Constraints on UV Luminosity Functions and Cosmic Star Formation History from 25 Galaxies at z $_spec$ = 8.61-13.20 Confirmed with JWST/NIRSpec. ApJ 960 (1), pp. 56. External Links: 10.3847/1538-4357/ad0b7e Cited by: §1.
- [53] (2025) COSMOS-Web: MIRI Data Reduction and Number Counts at 7.7 $\mu$m Using JWST. ApJ 992 (1), pp. 45. External Links: 10.3847/1538-4357/adfa1e Cited by: 2nd item.
- [54] (2025) EPOCHS. IV. SED Modeling Assumptions and Their Impact on the Stellar Mass Function at 6.5 $\leq$ z $\leq$ 13.5 Using PEARLS and Public JWST Observations. ApJ 978 (1), pp. 89. External Links: 10.3847/1538-4357/ad8c29 Cited by: §2.3.1.
- [55] (2025) The JWST-PRIMAL archival survey: A JWST/NIRSpec reference sample for the physical properties and Lyman-$\alpha$ absorption and emission of $\sim$600 galaxies at z = 5.0 $-$ 13.4. A&A 693, pp. A60. External Links: 10.1051/0004-6361/202450243 Cited by: §2.1.
- [56] (2024) Strong damped Lyman-$\alpha$ absorption in young star-forming galaxies at redshifts 9 to 11. Science 384 (6698), pp. 890-894. External Links: 10.1126/science.adj0343 Cited by: §2.1.
- [57] (2025) Photometric detection at 7.7 $\mu$m of a galaxy beyond redshift 14 with JWST/MIRI. Nature Astronomy 9, pp. 729-740. External Links: 10.1038/s41550-025-02503-z Cited by: footnote 5.
- [58] (2024) Galaxy morphology from z $\sim$ 6 through the lens of JWST. A&A 685, pp. A48. External Links: 10.1051/0004-6361/202346800 Cited by: §1.
- [59] (2025) COSMOS-Web: The emergence of the Hubble sequence. A&A 704, pp. A94. External Links: 10.1051/0004-6361/202553782 Cited by: §1.
- [60] (2025) RUBIES: A Spectroscopic Census of Little Red Dots; All V-Shaped Point Sources Have Broad Lines. arXiv e-prints, pp. arXiv:2506.05459. External Links: 10.48550/arXiv.2506.05459 Cited by: §2.3.2, §2.3.3, §2.3.3.
- [61] (2026) PANORAMIC: The Dawn of Massive Quiescent Galaxies I. Number Density and Cosmic Variance from 1000 arcmin$^2$ NIRCam Imaging. arXiv e-prints, pp. arXiv:2604.05022. External Links: 10.48550/arXiv.2604.05022 Cited by: §1, §4.3.
- [62] (2026) JADES: comprehensive census of broad-line AGN from reionization to cosmic noon revealed by JWST. MNRAS 546 (3), pp. stag086. External Links: 10.1093/mnras/stag086 Cited by: §2.3.3.
- [63] (2026) The role of small-scale environments in the quenching of massive galaxies at $1<z<5$. arXiv e-prints, pp. arXiv:2604.11942. External Links: 10.48550/arXiv.2604.11942 Cited by: §1.
- [64] (2023) CEERS Key Paper. III. The Diversity of Galaxy Structure and Morphology at z = 3-9 with JWST. ApJ 946 (1), pp. L15. External Links: 10.3847/2041-8213/acad01 Cited by: §1.
- [65] (2024) The Rise of Faint, Red AGN at $z>4$: A Sample of Little Red Dots in the JWST Extragalactic Legacy Fields. arXiv e-prints, pp. arXiv:2404.03576. External Links: 10.48550/arXiv.2404.03576 Cited by: §2.3.2, §2.3.3, §2.3.3.
- [66] (2024) A Census of Photometrically Selected Little Red Dots at 4 < z < 9 in JWST Blank Fields. ApJ 968 (1), pp. 38. External Links: 10.3847/1538-4357/ad4265 Cited by: §2.3.3.
- [67] (2013) Coevolution (Or Not) of Supermassive Black Holes and Host Galaxies. ARA&A 51 (1), pp. 511-653. External Links: 10.1146/annurev-astro-082708-101811 Cited by: §1.
- [68] (2023) UNCOVER: Candidate Red Active Galactic Nuclei at 3<z<7 with JWST and ALMA. arXiv e-prints, pp. arXiv:2306.07320. External Links: 10.48550/arXiv.2306.07320 Cited by: §2.3.2.
- [69] (2023) A population of red candidate massive galaxies 600 Myr after the Big Bang. Nature 616 (7956), pp. 266-269. External Links: 10.1038/s41586-023-05786-2 Cited by: §2.3.1.
- [70] (2026) Overdense fireworks in GOODS-N: Unveiling a record number of massive dusty star-forming galaxies at z $\sim$ 5.2 with the N2CLS. A&A 705, pp. A214. External Links: 10.1051/0004-6361/202555947 Cited by: §1.
- [71] (2023) NAUTILUS: boosting Bayesian importance nested sampling with deep learning. MNRAS 525 (2), pp. 3181-3194. External Links: 10.1093/mnras/stad2441 Cited by: §2.2.
- [72] (2019) How to Measure Galaxy Star Formation Histories. II. Nonparametric Models. ApJ 876 (1), pp. 3. External Links: 10.3847/1538-4357/ab133c Cited by: §2.2.
- [73] (2024) Efficient NIRCam Selection of Quiescent Galaxies at 3 < z < 6 in CEERS. ApJ 970 (1), pp. 68. External Links: 10.3847/1538-4357/ad4cea Cited by: §4.3.
- [74] (2023) Extreme value statistics of the halo and stellar mass distributions at high redshift: are JWST results in tension with $\Lambda$CDM?. MNRAS 518 (2), pp. 2511-2520. External Links: 10.1093/mnras/stac3224 Cited by: §1.
- [75] (2019) De re metallica: the cosmic chemical evolution of galaxies. A&A Rev. 27 (1), pp. 3. External Links: 10.1007/s00159-018-0112-2 Cited by: §1.
- [76] (2024) Witnessing an extreme, highly efficient galaxy formation mode with resolved Lyman-$\alpha$ and Lyman-continuum emission. A&A 691, pp. A87. External Links: 10.1051/0004-6361/202451667 Cited by: §4.5.
- [77] (2024) The NIRSpec Wide GTO Survey. A&A 689, pp. A73. External Links: 10.1051/0004-6361/202449914 Cited by: Table 4.
- [78] (2024) Little Red Dots: An Abundant Population of Faint Active Galactic Nuclei at z $\sim$ 5 Revealed by the EIGER and FRESCO JWST Surveys. ApJ 963 (2), pp. 129. External Links: 10.3847/1538-4357/ad2345 Cited by: §2.3.1.
- [79] (2025) The THESAN-ZOOM project: burst, quench, repeat ─ unveiling the evolution of high-redshift galaxies along the star-forming main sequence. MNRAS 544 (1), pp. 513-534. External Links: 10.1093/mnras/staf1660 Cited by: §4.2.
- [80] (2024) The galaxy UV luminosity function at z ≃ 11 from a suite of public JWST ERS, ERO, and Cycle-1 programs. MNRAS 527 (3), pp. 5004-5022. External Links: 10.1093/mnras/stad3471 Cited by: §1.
- [81] (2026) A search for the first galaxies across $>0.6$ deg$^2$ of JWST imaging: new evidence for a rapid decline in star-formation activity at $z>12$. arXiv e-prints, pp. arXiv:2604.16666. Cited by: §1.
- [82] (2025) ALMA 360 pc high-frequency observations reveal warm dust in the center of a $z=6.9$ quasar. arXiv e-prints, pp. arXiv:2502.14539. External Links: 10.48550/arXiv.2502.14539 Cited by: §1.
- [83] (2013) Galactic star formation and accretion histories from matching galaxies to dark matter haloes. MNRAS 428 (4), pp. 3121-3138. External Links: 10.1093/mnras/sts261 Cited by: §2.3.1, §2.3.4.
- [84] (2013) The Evolution of the Stellar Mass Functions of Star-forming and Quiescent Galaxies to z = 4 from the COSMOS/UltraVISTA Survey. ApJ 777, pp. 18. External Links: 10.1088/0004-637X/777/1/18 Cited by: §4.3.
- [85] (2025) MINERVA: A NIRCam Medium Band and MIRI Imaging Survey to Unlock the Hidden Gems of the Distant Universe. arXiv e-prints, pp. arXiv:2507.19706. External Links: 10.48550/arXiv.2507.19706 Cited by: 4th item, §1.
- [86] (2017) Theoretical Challenges in Galaxy Formation. ARA&A 55 (1), pp. 59-109. External Links: 10.1146/annurev-astro-081913-040019 Cited by: §1.
- [87] (2026) A Cosmic Miracle: A Remarkably Luminous Galaxy at zspec = 14.44 Confirmed with JWST. The Open Journal of Astrophysics 9, pp. 56033. External Links: 10.33232/001c.156033 Cited by: Figure 10, Table 4.
- [88] (2022) Schrodinger’s Galaxy Candidate: Puzzlingly Luminous at $z\approx17$, or Dusty/Quenched at $z\approx5$?. arXiv e-prints, pp. arXiv:2208.02794. External Links: 10.48550/arXiv.2208.02794 Cited by: §2.3.1.
- [89] (2025) The Formation Histories of Massive and Quiescent Galaxies in the 3 < z < 4.5 Universe. ApJ 981 (1), pp. 78. External Links: 10.3847/1538-4357/ada6ac Cited by: Table 4, §4.5.
- [90] (2024) Outshining by Recent Star Formation Prevents the Accurate Measurement of High-z Galaxy Stellar Masses. ApJ 961 (1), pp. 73. External Links: 10.3847/1538-4357/ad0966 Cited by: §5.
- [91] (2006) Natural downsizing in hierarchical galaxy formation. MNRAS 372 (2), pp. 933-948. External Links: 10.1111/j.1365-2966.2006.10918.x Cited by: §1.
- [92] (2023) The JWST FRESCO survey: legacy NIRCam/grism spectroscopy and imaging in the two GOODS fields. MNRAS 525 (2), pp. 2864-2874. External Links: 10.1093/mnras/stad2411 Cited by: §1, §2.3.4.
- [93] (1983) Secondary standard stars for absolute spectrophotometry.. ApJ 266, pp. 713-717. External Links: 10.1086/160817 Cited by: §1.
- [94] (2016) The realm of the galaxy protoclusters. A review. A&A Rev. 24 (1), pp. 14. External Links: 10.1007/s00159-016-0100-3 Cited by: §1.
- [95] (2023) Rapid Quenching of Galaxies at Cosmic Noon. ApJ 953 (1), pp. 119. External Links: 10.3847/1538-4357/acd54a Cited by: §4.3.
- [96] (2026) Novel z $\sim$ 10 auroral line measurements extend the gradual offset of the fundamental metallicity relation deep into the first gigayear of cosmic time. A&A 708, pp. A203. External Links: 10.1051/0004-6361/202556032 Cited by: §2.1.
- [97] (2023) The main sequence of star-forming galaxies across cosmic times. MNRAS 519 (1), pp. 1526-1544. External Links: 10.1093/mnras/stac3214 Cited by: Figure 4, Figure 7.
- [98] (2026) Galaxies at z ¿ 10: $\Lambda$CDM predicts increased Star Formation Efficiency. arXiv e-prints, pp. arXiv:2604.18683. External Links: 10.48550/arXiv.2604.18683 Cited by: §1.
- [99] (2024) SMILES: A Prototype JWST Multiband Mid-infrared Survey. ApJ 975 (1), pp. 83. External Links: 10.3847/1538-4357/ad6cd2 Cited by: 1st item.
- [100] (2024) REBELS-25: discovery of a dynamically cold disc galaxy at z = 7.31. MNRAS 535 (3), pp. 2068-2091. External Links: 10.1093/mnras/stae2217 Cited by: §1.
- [101] (2018) Dust Attenuation Curves in the Local Universe: Demographics and New Laws for Star-forming Galaxies and High-redshift Analogs. ApJ 859 (1), pp. 11. External Links: 10.3847/1538-4357/aabf3c Cited by: Appendix B, Figure 12, Appendix C, §2.2, §2.4, footnote 8.
- [102] (1955) The Luminosity Function and Stellar Evolution.. ApJ 121, pp. 161. External Links: 10.1086/145971 Cited by: §1.
- [103] (2015) The Herschel view of the dominant mode of galaxy growth from z = 4 to the present day. A&A 575, pp. A74. External Links: 10.1051/0004-6361/201425017 Cited by: Figure 4.
- [104] (2025) COSMOS-Web: Stellar mass assembly in relation to dark matter halos across 0.2 < z < 12 of cosmic history. A&A 695, pp. A20. External Links: 10.1051/0004-6361/202452570 Cited by: §1, §2.3.1.
- [105] (2025) COSMOS2025: The COSMOS-Web galaxy catalog of photometry, morphology, redshifts, and physical parameters from JWST, HST, and ground-based imaging. A&A 704, pp. A339. External Links: 10.1051/0004-6361/202555799 Cited by: 2nd item.
- [106] (2025) Bursting at the seams: the star-forming main sequence and its scatter at z = 3─9 using NIRCam photometry from JADES. MNRAS 544 (4), pp. 4551-4575. External Links: 10.1093/mnras/staf1950 Cited by: §4.2.
- [107] (2015) Physical Models of Galaxy Formation in a Cosmological Framework. ARA&A 53, pp. 51-113. External Links: 10.1146/annurev-astro-082812-140951 Cited by: §1.
- [108] (2014) Exploring the z = 3-4 Massive Galaxy Population with ZFOURGE: The Prevalence of Dusty and Quiescent Galaxies. ApJ 787 (2), pp. L36. External Links: 10.1088/2041-8205/787/2/L36 Cited by: Figure 5, §4.3.
- [109] (2005) Simulations of the formation, evolution and clustering of galaxies and quasars. Nature 435 (7042), pp. 629-636. External Links: 10.1038/nature03597 Cited by: §1.
- [110] (2018) A Redshift-independent Efficiency Model: Star Formation and Stellar Masses in Dark Matter Halos at z $\gtrsim$ 4. ApJ 868 (2), pp. 92. External Links: 10.3847/1538-4357/aae8e0 Cited by: §1, §2.3.4.
- [111] (2008) Toward a Halo Mass Function for Precision Cosmology: The Limits of Universality. ApJ 688 (2), pp. 709-728. External Links: 10.1086/591439 Cited by: §2.3.1, §2.3.4.
- [112] (2023) An Atlas of Color-selected Quiescent Galaxies at z > 3 in Public JWST Fields. ApJ 947 (1), pp. 20. External Links: 10.3847/1538-4357/acbefa Cited by: §1, §1, §2.1, §4.3, footnote 5.
- [113] (2020) Cosmological simulations of galaxy formation. Nature Reviews Physics 2 (1), pp. 42-66. External Links: 10.1038/s42254-019-0127-2 Cited by: §1.
- [114] (2024) RUBIES: Evolved Stellar Populations with Extended Formation Histories at z $\sim$ 7–8 in Candidate Massive Galaxies Identified with JWST/NIRSpec. ApJ 969 (1), pp. L13. External Links: 10.3847/2041-8213/ad55f7 Cited by: §2.3.1.
- [115] (2024) RUBIES Reveals a Massive Quiescent Galaxy at z=7.3. arXiv e-prints, pp. arXiv:2409.03829. External Links: 10.48550/arXiv.2409.03829 Cited by: Figure 10, §1.
- [116] (2024) Galaxy build-up in the first 1.5 Gyr of cosmic history: insights from the stellar mass function at z 4-9 from JWST NIRCam observations. MNRAS 533 (2), pp. 1808-1838. External Links: 10.1093/mnras/stae1891 Cited by: §1, §2.3.1.
- [117] (2025) Exploring Cosmic Dawn with PANORAMIC I: The Bright End of the UVLF at $z\sim9-17$. arXiv e-prints, pp. arXiv:2507.06292. External Links: 10.48550/arXiv.2507.06292 Cited by: §1.
- [118] (2026) Quenching of Star Formation in Massive Galaxies. arXiv e-prints, pp. arXiv:2606.12156. External Links: 10.48550/arXiv.2606.12156 Cited by: §1, §4.3.
- [119] (2021) High Molecular-gas to Dust Mass Ratios Predicted in Most Quiescent Galaxies. ApJ 922 (2), pp. L30. External Links: 10.3847/2041-8213/ac399f Cited by: §1.
- [120] (1978) Core condensation in heavy halos: a two-stage theory for galaxy formation and clustering.. MNRAS 183, pp. 341-358. External Links: 10.1093/mnras/183.3.341 Cited by: §1.
- [121] (2024) The Galaxies Missed by Hubble and ALMA: The Contribution of Extremely Red Galaxies to the Cosmic Census at 3 < z < 8. ApJ 968 (1), pp. 34. External Links: 10.3847/1538-4357/ad3f17 Cited by: §2.3.1.
- [122] (2024) The PANORAMIC Survey: Pure Parallel Wide Area Legacy Imaging with JWST/NIRCam. arXiv e-prints, pp. arXiv:2410.01875. External Links: 10.48550/arXiv.2410.01875 Cited by: §2.3.4.
- [123] (2009) Detection of Quiescent Galaxies in a Bicolor Sequence from Z = 0-2. ApJ 691, pp. 1879-1895. External Links: 10.1088/0004-637X/691/2/1879 Cited by: §4.3.
- [124] (2026) From Grism to IFU: Revising the Redshift and Nature of the Massive Dusty Galaxy S1 with JWST and ALMA. arXiv e-prints, pp. arXiv:2602.03030. External Links: 10.48550/arXiv.2602.03030 Cited by: §1.
- [125] (2025) No [C II] or dust detection in two Little Red Dots at z$_spec$¿ 7. A&A 700, pp. A231. External Links: 10.1051/0004-6361/202554361 Cited by: §2.3.2, §2.3.3.
- [126] (2024) Accelerated formation of ultra-massive galaxies in the first billion years. Nature 635 (8038), pp. 311-315. External Links: 10.1038/s41586-024-08094-5 Cited by: §1, §2.3.4.
- [127] (2025) PANORAMIC: Discovery of an ultra-massive grand-design spiral galaxy at z $\sim$ 5.2. A&A 696, pp. A156. External Links: 10.1051/0004-6361/202453487 Cited by: §1, §1.
- [128] (2023) Dusty Starbursts Masquerading as Ultra-high Redshift Galaxies in JWST CEERS Observations. ApJ 943 (2), pp. L9. External Links: 10.3847/2041-8213/acacfe Cited by: §2.3.1.
- [129] (2026) RUBIES Spectroscopically Confirms the High Number Density of Quiescent Galaxies from 2 < z< 5. ApJ 997 (2), pp. 252. External Links: 10.3847/1538-4357/ae24e1 Cited by: §4.3.
- [130] (2026) Winding Back the Clock: Recent Star Formation Histories of Massive Quiescent Galaxies Are Consistent With Their Rapid Number Density Evolution Since $\mathbfz\sim7$. arXiv e-prints, pp. arXiv:2604.05024. External Links: 10.48550/arXiv.2604.05024 Cited by: §1.
- [131] (2025) MIRI Deep Imaging Survey (MIDIS) of the Hubble Ultra Deep Field: Survey description and early results for the galaxy population detected at 5.6 $\mu$m. A&A 696, pp. A57. External Links: 10.1051/0004-6361/202451723 Cited by: 3rd item.
Appendix A Examples of massive galaxies.


Appendix B Robustness of stellar mass: with and without MIRI.
To evaluate the impact of mid-infrared photometry on the derived stellar masses, we compare Bagpipes fits performed with and without MIRI photometry for all galaxies with available MIRI observations. Since AGN emission is not included in our fiducial Bagpipes model, only MIRI filters up to F1000W are used in the fitting to minimize contamination from hot dust emission. To isolate the effect of MIRI photometry, all other fitting methods and assumptions, including joint SED fitting of photometry and prism spectra, the non-parametric SFH, BPASS stellar population models, the 101 dust attenuation curve, are kept identical to the fiducial setup adopted throughout this work.
We require each source to have at least one MIRI band detected at S/N 3. This yields 1,021 of the 6,312 galaxies in the parent prism sample and 61 of the 200 galaxies in our massive galaxy sample with MIRI detections. Details of the MIRI catalog used in our work are shown as follows:
- •
- •
- •
MIDIS (131): covers a deep area of 2.4 arcmin2 in the HUDF with the MIRI/F560W filter. The typical 5 point-source depth is 28.65 mag.
- •
MINERVA UDS (85): covers an area of 125 arcmin2 in the UDS field with the MIRI F770W, F1280W, F1500W, and F1800W filters, where the F770W and F1800W data are provided by the PRIMER survey (PI: Dunlop). The typical 5 point-source depth is 23.9 mag in F1280W.
Figure 11 compares the stellar masses derived from Bagpipes with and without MIRI photometry. We quantify the agreement using the median offset,
| (5) |
the normalized median absolute deviation (NMAD),
| (6) |
and the outlier fraction, defined as the fraction of sources with dex.

Appendix C Robustness of stellar mass: under different modeling assumptions.
To assess the dependence of our stellar mass estimates on the adopted SED modeling assumptions, we repeat the Bagpipes fitting using several alternative configurations. Specifically, we compare the effects of using (1) photometry only vs. photometry+prism spectroscopy, (2) BC03 vs. BPASS stellar population synthesis models, (3) the 15 vs. 101 dust attenuation curves, and (4) three alternative SFHs (delayed-, double-power-law + burst, and constant SFH) relative to our fiducial non-parametric SFH. Likely contaminants, including LRDs and broad-line AGNs, are excluded from these comparisons. Except for the photometry-only case, all fits are performed using joint SED fitting of photometry and prism spectroscopy. The median offsets, NMAD values, and outlier fractions for each comparison are computed following the same methodology described in Appendix B and are reported in the corresponding panels of Fig. 12.

a Fraction of the 200 most massive galaxies that remain above the adopted evolving stellar-mass threshold (Sect. 2.3) under each alternative fitting assumption. b Among the 200 most massive galaxies, 61 have available MIRI photometry, and 55 sources remain above the adopted evolving stellar-mass threshold after adding MIRI photometry.
| Alternative fitting assumption | Median offset | NMAD | Outlier fraction | Massive galaxiesa |
|---|---|---|---|---|
| (dex) | (dex) | (%) | remaining (%) | |
| With MIRI | 0.004 | 0.033 | 6.9 | 55/61 (90%) |
| Photometry only | 0.030 | 0.186 | 34.7 | 165/200 (83%) |
| BC03 | 0.027 | 0.143 | 16.4 | 173/200 (87%) |
| 15 attenuation curve | 0.034 | 0.052 | 6.0 | 176/200 (88%) |
| Delayed- SFH | 0.046 | 0.104 | 11.6 | 153/200 (77%) |
| double-power-law + burst SFH | 0.021 | 0.081 | 8.5 | 165/200 (83%) |
| Constant SFH | -0.120 | 0.251 | 55.0 | 98/200 (49%) |
Appendix D Catalog of 200 massive galaxies.
| Programs | spectra |
|---|---|
| CAPERS (GO-6368; PI: Dickinson) | 52 |
| CEERS-ERS (GO-1345; 41) | 5 |
| DD-2750 (5) | 5 |
| DD-6585 (PI: Coulter) | 1 |
| GO-2198 (7) | 6 |
| GO-2565 (89) | 17 |
| GO-4106 (PI: Nelson) | 1 |
| GO-5997 (PI: Looser) | 2 |
| GO-8018 (PI: Lin) | 2 |
| GO-8060 (PI: Egami) | 3 |
| GTO-WIDE (GTO-1211; GTO-1212; GTO-1213; GTO-1214; GTO-1215; 77) | 35 |
| JADES (GTO-1180; GTO-1181; GTO-1210; GTO-1286; GTO-1287; GO-3215; 36; 37) | 45 |
| MoM (GO-5224; PIs: Naidu & Oesch; 87) | 18 |
| RUBIES (GO-4233; 30) | 74 |
| N | JWST name | RA | Dec | log | log(SFR100/yr-1) | log(SFR10/yr-1) | [mag] | Classification | |
|---|---|---|---|---|---|---|---|---|---|
| xx | xx | 3.44 |
- •
Note. The whole catalog will be released when the paper is accepted.
