On-farm management strategies for reducing H5N1 transmission in dairy cattle
Abstract
Introductions of H5N1 clade 2.3.4.4b into dairy cattle have resulted in outbreaks on dairy farms across the United States since early-2024. Outbreaks have significant consequences for animal health, result in economic losses for the dairy industry, and pose a threat to human health. Though the relative contributions of different on-farm transmission pathways remain a key uncertainty, a major route is considered to be through repeated contamination of milking stalls (i.e. the equipment and area where an individual cow is milked) due to the milking of infected animals. Here we develop mathematical models of H5N1 transmission dynamics on dairy farms, considering multiple possible transmission pathways, and identify factors that contribute to outbreak risk and on-farm interventions for mitigating risk. In particular, we demonstrate that dividing cattle into ‘milking cohorts’, with cohorts kept in separate pens or paddocks and milked in the same order every day, would be highly effective at mitigating outbreaks irrespective of the dominant transmission pathway. Cohorting cattle is most effective when implemented pre-emptively (i.e. before an outbreak) and when newly introduced cattle are kept in the final milking cohort. Additionally, we demonstrate that frequent bulk milk sample testing (e.g. weekly) would enable the rapid detection of outbreaks and implementation of reactive interventions (or scaling up of existing interventions). Our findings can support the development of management guidelines for effectively responding to H5N1 outbreaks in dairy cattle.
1 Introduction
H5N1 influenza viruses belonging to clade 2.3.4.4b have circulated widely in bird and mammal populations since 2020 [22]. An introduction of H5N1 clade 2.3.4.4b into dairy cattle from wild birds (genotype B3.13) in December 2023 resulted in outbreaks on dairy farms across the United States (US) [4, 21, 8]. These have had serious consequences for animal health [8, 13, 15], resulting in significant economic losses for the dairy industry [19, 23], and posed a threat to human health through spillover infections and the contamination of raw milk products. Furthermore, continued circulation of H5N1 in cattle —– with frequent spillover into humans —– increases the risk of an influenza virus emerging that is capable of efficient human-to-human transmission. Although human-to-human transmission has not been detected, experimental challenge studies in ferrets (the animal model predominantly used for assessing transmissibility of influenza viruses between humans) have demonstrated the virus’ potential for ongoing respiratory transmission [14, 5].
The initial dairy farm outbreaks in early-2024 were the result of an introduction into dairy cattle of the genotype B3.13, a relatively rare genotype in wild birds at the time [22]. In early 2025, two introductions of genotype D1.1 (a genotype relatively prevalent in North American wild birds by early-2025) [20, 9] were detected [3, 2]. The potential for other genotypes to cause infection in dairy cattle have also been demonstrated by experimental inoculation [15]. This suggests that even if outbreaks are controlled, re-introductions may occur into the future, triggering new outbreaks in the US and potentially internationally. It is crucial that management strategies for effectively preventing and responding to H5N1 outbreaks on dairy farms are developed and adopted.
National management guidelines in the US have broadly focused on testing to prevent the interstate transfer of infected cattle [28]. However, modelling suggests that interstate export controls have had minimal impact on the propagation of outbreaks across the US, and that ‘farm-focused’ interventions are required to prevent and control H5N1 outbreaks [24]. In 2024 the US Department of Agriculture (USDA) commenced a nationwide voluntary Dairy Herd Status Program [11], in which farms can enrol for weekly testing of bulk tank milk samples for H5N1; a herd with three consecutive negative tests receives ‘Monitored Unaffected’ herd status allowing the farm to move animals interstate without additional testing. Additionally, such frequent testing would likely allow outbreaks to be detected rapidly in enrolled farms. On 8 May 2026, 130 herds across 21 states were enrolled in the program [11]. With 23,609 licensed dairy farms in the US in 2025 [30], this limited enrolment may reflect privacy concerns or a lack of intervention measures available for farms to effectively reduce the risk and size of outbreaks.
Here we use mathematical analysis and a stochastic simulation model of H5N1 transmission dynamics on dairy farms to identify opportunities for controlling and mitigating outbreaks. We focus on on-farm intervention and testing strategies that are practical to implement as evidenced by existing policy and guidelines. In particular, we investigate: enhanced cleaning of milking stalls (i.e. the area in which an individual cattle is milked); and the division of cattle into separate ‘milking cohorts’, with cohorts kept in separate pens or paddocks and milked in the same order every day. We evaluate the effectiveness of measures implemented pre-emptively (i.e. before an outbreak) and the relative effectiveness of introducing the same measures reactively (following a positive test) under different bulk milk sample testing frequencies. Our findings will be useful to inform the development of management strategies for reducing H5N1 transmission in dairy cattle, and for responding to future outbreaks.
2 A mathematical description of outbreak propagation between farms

We begin by developing a mathematical description of outbreak propagation between farms in order to identify the factors impacting spread that could be targeted by on-farm interventions. In the US, dairy cattle are frequently transported between farms intra- and inter-state [26]. The movement of infected cattle — many of which may be asymptomatic — between dairy farms is a key driver of the propagation of H5N1 dairy farm outbreaks [21, 8]. The propagation of outbreaks can be considered in terms of the probability that an outbreak on one farm (the source farm, farm ) directly causes an outbreak on another farm (the recipient farm, farm ) [31]. This will depend on: (1) the size of the outbreak on the source farm, characterised by the infection incidence over time, ; (2) the probability that an infected animal on the source farm is transported to the recipient farm, characterised by the rate over time at which infected animals are exported from source to recipient farm, ; and (3) the probability that an infected animal introduced to the recipient farm causes an outbreak, , which will depend on the time since the animal was infected, , as well as factors on the recipient farm (hence the subscript ). The probability of an outbreak on the source farm causing an outbreak on the recipient farm, , is then given by:
| (1) |
where
| (2) |
The expression being integrated over (from to ) in equation 2 is the rate at which farm introduces an outbreak to farm over time (see Supplementary Methods). The smaller the value of the smaller the probability of a secondary outbreak at farm . The expected number of secondary outbreaks arising from source farm will scale (approximately) with the sum of outbreak probabilities over all possible recipient farms, (this is only approximate as the probabilities will likely not be independent). These equations highlight which factors increase or decrease the risk of a farm seeding secondary outbreaks — the larger the farm (larger outbreaks are expected on farms with more cattle), the higher the rate at which cattle are exported from a farm, and the greater the number of recipient farms (per export farm), the greater the risk of outbreak propagation.
Equations 1–2 also indicate where opportunities exist for preventing outbreaks or slowing the onward propagation of outbreaks. Interventions that decrease the terms in equation 2 will reduce the expected number of secondary outbreaks. Existing interventions predominantly target , the rate at which infected animals are exported. For example, testing of exported cattle can reduce before an outbreak has been detected, while export restrictions for farms with a detected outbreak can reduce (Figure 1). Interventions could also be developed to reduce the size of outbreaks at the source farm () and probability of outbreaks at the recipient farm (). Pre-emptive measures that reduce on-farm transmission would: (1) reduce the probability of an outbreak occurring (following the introduction of an infected animal); and (2) when an outbreak occurs, reduce the overall size of the outbreak (Figure 1). Reactive measures that reduce on-farm transmission could also reduce the overall size of the outbreak, provided that testing strategies can identify outbreaks in a timely manner. In the following sections we will explore interventions and testing strategies that target the reduction of outbreak risk and size (i.e. and in equation 2).
3 A mathematical description of on-farm transmission
A major route of transmission between dairy cattle is considered to be through the repeated contamination of milking stalls (i.e. the milking unit, feed trough, milking platform and air around which an individual cattle is milked) due to the milking of infected animals: far greater viral RNA loads have been detected in milk samples from infected animals compared to nasal swabs [8, 15]; high infectious viral loads have been isolated from milk samples [8]; and influenza A virus in milk samples pipetted onto rubber inflation liners and stainless steel –— key materials of individual milking units –— have been detected many hours after exposure [17, 16]. It is also thought that a degree of transmission occurs without the intermediary contamination of milking stalls. For example, via contamination of the air with aerosols (i.e. direct respiratory transmission) or via contaminated wastewater (e.g. water used for washing down dairies) that may be reclaimed and used at multiple sites on the farm increasing the presence of H5N1 in the environment [7]. However, the presence or relative importance of these transmission routes have not been described in the literature at the time of writing.
To gain insight into the effect of multiple possible transmission routes we have developed a deterministic model of the on-farm transmission of H5N1, explicitly modelling the infection status of dairy cattle and contamination status of milking stalls. The model has also been adapted into a less analytically tractable, but more realistic stochastic model which we have used to perform simulation studies. We categorise cattle as either: susceptible to infection (S); exposed but not yet infectious (E); infectious (I); or recovered and not susceptible (R) (cattle develop immunity following H5N1 infection [13]). We categorise milking stalls as either: uncontaminated (U); or contaminated and therefore infectious (V). Transitions between states are governed by a system of ordinary differential equations:
| (3) | ||||
| (4) | ||||
| (5) | ||||
| (6) | ||||
| (7) | ||||
| (8) |
The definitions of all parameters are provided in Table 1. The number of cattle () and milking stalls () are also assumed to remain constant:
| (9) | ||||
| (10) |
This system explicitly models two modes of transmission, direct cow-to-cow transmission and transmission via milking stalls (cow-to-milking stall-to-cow transmission). Direct cow-to-cow transmission can either be frequency dependent ( term in equation 3) or density dependent ( term in equation 3). Cow-to-milking stall-to-cow transmission involves two steps: (1) contamination of a milking stall by an infectious animal ( term in equation 7); and (2) infection of an animal by a contaminated milking stall ( term in equation 3). The cow-to-milking stall and milking stall-to-cow transmission rates, and respectively, can be written in terms of the milking rate () and the per milking probability of infection () and contamination ():
| (11) | ||||
| (12) |
| Parameter | Interpretation |
|---|---|
| Frequency dependent cow–cow transmission rate | |
| Density dependent cow–cow transmission rate | |
| Area (of cattle’s paddock) | |
| Milking stall–cow transmission rate | |
| Cow–milking stall transmission rate | |
| Rate exposed cattle become infectious ( is the mean latent period) | |
| Recovery rate ( is the mean duration cattle remain infectiousness) | |
| Decontamination rate ( is the mean duration milking stalls remain contaminated) | |
| Milking rate ( is the mean duration between a cow being milked) | |
| Probability cow is infected when milked at a contaminated milking stall | |
| Probability milking stall is contaminated when an infected cattle is milked at the stall |
The basic reproduction number, , is the expected number of secondary infections in cattle caused by a single infected cow in an otherwise susceptible population (more formally the largest eigenvalue of the next generation matrix). For a deterministic system, when infections will increase, and when infections will die out. For the system defined by equations 3–12 is defined as:
| (13) |
where we have defined and as:
| (14) |
is the theoretical definition of if no transmission is via milking stalls, whereas, is the theoretical definition of if all transmission is via milking stalls. The primary route of transmission between dairy cattle is considered to be via contamination of milking stalls (particularly the milking units that directly attaches to the animal to extract milk). As such is small and we can use a Taylor expansion to write:
| (15) |
The value of is approximately given by , with any additional transmission via a mechanism other than milking stalls leading to a net increase in . Under the assumption that all transmission is via milking stalls, we can derive the probability that infected cattle introduced to a farm lead to a major outbreak [1], :
| (16) |
which is equivalent to one minus the probability that the initial infections () become extinct before causing a major outbreak [1].
If no transmission occurs via milking stalls () then the probability that infected cattle introduced to a farm leads to a major outbreak is given by the (standard) expression: .
4 Factors increasing (or decreasing) outbreak risk
We can identify factors that increase (or decrease) the risk and size of H5N1 outbreaks on a dairy farm by looking at the form of in equation 14, and in equation 16. Farms on which cattle are milked more frequently will have greater rates of transmission (e.g. ). Dairy cattle are usually milked twice daily, but the frequency varies between farms, with farms regularly milking from one to three times per day [27]. Farms may also vary their milking frequency over time depending on the lactation period of cattle or pasture abundance [27]; during periods of higher milking frequencies farms will be at greater risk of an outbreak. Farms with a higher number of cattle per milking stall will also be at greater risk of an outbreak, with greater rates of transmission (i.e. ).
We can also identify where opportunities may exist for reducing the risk and size of H5N1 outbreaks. The longer that cattle remain infectious the greater the rate of transmission (i.e.). If infectious cattle could be detected and then prevented from sharing milking stalls with susceptible cattle, this would effectively reduce their mean duration of infectiousness (. Case isolation of clinical cases is unlikely to be effective unless a high proportion of infectious cattle could be detected rapidly following infection (that is, while they remain infectious) [12]; seroprevalence studies following an outbreak on a US dairy farm suggested that approximately 25% of infections were clinical (and thus more readily detected) [23]. While subclinical cases are likely to be less infectious, their detection and isolation would contribute to outbreak control. The longer that contaminated milking stalls remain infectious the greater the rate of transmission (i.e.). The viral concentration of influenza on milking unit rubber liners has been found to decay with a half life of approximately one hour [17], although there is now some evidence that the half life may be longer (based on irradiated milk samples) [16] and the number of half lives to reach zero infectiousness is not known. Interventions aimed at reducing the mean duration that units remain contaminated () would be most effective if implemented when infectiousness is highest. Contamination happens (with some probability) when an infected animal is milked — biosecurity interventions that decontaminate units, performed at more frequent intervals would reduce the mean duration of milking stall contamination. Additionally, biosecurity interventions that reduce the per milking probability of infection () or contamination () would further reduce transmission (i.e. ). Biosecurity protocols include pre-milking teat cleaning, post-milking teat disinfection [10], improved ventilation, and the regular cleaning of milking equipment and the milking stall feed trough [25]. The effectiveness of these measures in preventing H5N1 transmission via milking stalls has not been empirically estimated, but is expected to depend on how frequently effectively, and consistently the measures are implemented.
5 Stochastic simulation of on-farm outbreaks
To investigate the effect of potential interventions on outbreak risk and size requires some additional features to be incorporated into the model above. We extended the mathematical description above into a stochastic simulation model that more realistically describes the milking process on dairy farms (see Methods for full details). Briefly, milking is simulated as discrete-time events (i.e. milking processes start and finish at the same time each day) during which transmission between cows and milking stalls can occur. During the milking process cows are randomly selected and assigned to the milking stalls, and time is advanced by the milking time (i.e. the time to milk a single cow). This process is iterated over until all cattle have been milked. Contamination of a milking stall occurs with fixed probability upon milking of an infected animal. The probability of an animal being infected upon milking within a contaminated milking stall decays exponentially with time since contamination. Note that one could also consider a decay with the number of uses since contamination (i.e. milking of non-infectious cattle could reduce viral concentration on contaminated surfaces). The time between all other events (e.g. cow–cow transmission, recovery from infection) are determined using a Gillespie algorithm.
We considered three sets of parameters (see Methods) describing three transmission regimes: cow–cow transmission only; cow–milking stall–cow transmission only; and mixed mode transmission (representing predominantly cow–milking stall–cow transmission). All parameters (except for the transmission parameters) were selected to match estimates in the literature (see Methods). The transmission parameters for all three transmission regimes were selected to result in an approximate mean attack rate of 89% (selected to align with the size of an outbreak on a farm in the US that was estimated using serological data [23]) across simulations (in which an outbreak occurs) for dairy farms with 50 milking stalls () and 1000 cattle () that are milked twice daily. This alignment between parameter sets was used to establish the same baseline scenario for all three transmission regimes, allowing the relative effect of proposed interventions to be compared fairly across those regimes.

6 The effect of pre-emptively separating herds into milking cohorts
Separating cattle into distinct ordered ‘milking cohorts’ (cohorts milked in the same order every day) prior to the introduction of infections (i.e. pre-emptively) led to a reduction in infections across all scenarios (Figure 3A). We performed 100 simulations of an outbreak — initially seeded with 10 exposed (E compartment) cattle — across all three transmission regimes, and for different numbers (1, 2, 3, 4, 5, and 10) of equally sized milking cohorts. The ten initial infections were distributed (approximately) uniformly across all milking cohorts. Milking cohorts were assumed to be housed in separate paddocks with no interaction between cohorts in lane ways (i.e. we assumed that no cow–cow transmission occurred between cohorts for the main analyses, even when studying the cow–cow transmission only regime), with milking cohorts milked in the same order each day. The greater the number of milking cohorts, the smaller the outbreak size (on average). The reason for this pattern differs between the three transmission regimes.
When only cow–cow transmission was assumed, outbreaks were effectively distinct between the milking cohorts (no transmission occurring between cohorts, although we relaxed this assumption in the sensitivity analysis below). As the number of milking cohorts was increased the initial number of infections seeding the outbreaks in each cohort decreased (one initial infection in each cohort for ten cohorts), which increased the probability of stochastic extinction; the reduction in overall outbreak size was thus due to a number of the cohort-level outbreaks never taking off (Figure 3).
When only cow–milking stall–cow transmission was assumed, the reduction in outbreak size (Figure 3A) was due to the presence of a consistent milking order of the cohorts. A hierarchy in attack rates was observed between milking cohorts; the highest attack rate was in the last milking cohort, while the smallest attack rate was in the first milking cohort (Figure 3B&C). This was due to the rapid decay of infectiousness assumed for the contaminated milking stalls — which was based on estimates of viral decay rates on milking unit rubber liners [17] (we conducted a sensitivity analysis around this decay rate, see Section 7). This severely limited transmission from later cohorts to earlier cohorts as the infectiousness of contaminated milking stalls decays to near zero between milking periods. For example, cows in the last milking cohort can (with an appreciable probability) be infected by milking stalls that were contaminated by any of the preceding milking cohorts. Whereas cows in the first milking cohort are unlikely to be infected by milking stalls contaminated by other cohorts because the virus decays too quickly (i.e. between milking of the last cohort and milking of the first cohort in the subsequent milking period).
Assuming a small degree of cow–cow transmission, with cow–milking stall–cow transmission still the dominant transmission route (i.e. the mixed mode transmission regime), also resulted in a reduction in outbreak size as the number of milking cohorts increased, but it was less dramatic than for the cow–milking stall–cow transmission only regime because of the possibility of within cohort transmission occurring outside of milking periods.

7 The impact of seeding infections in the last cohort
When investigating the effects of seeding all infections in a single cohort (i.e., non-uniform seeding), we found that for transmission regimes including cow–milking stall–cow transmission, the later the cohort in which infections were seeded the smaller the final outbreak size. That is, the smallest outbreaks occurred when infections were seeded in the last milking cohort (Figure 4). We performed 100 simulations of an outbreak on a dairy farm running five milking cohorts, across all three transmission regimes, and for initial infections (ten cattle in the E compartment for a single cohort) seeded in each cohort (1, 2, 3, 4, or 5). A drastic reduction in outbreak size was observed as the cohort of infection seeding was made later in the milking order. For example, under our assumptions for the cow–milking stall–cow transmission only regime, the median modelled outbreak size fell from approximately 520 cumulative infections (out of 1000 cattle, 52% attack rate) when infections were seeded in the first cohort, to approximately 20 cumulative infections (out of 1000 cattle, 2% attack rate) when infections were seeded in the fifth cohort. A similar effect was observed when a small degree of cow–cow transmission was assumed (mixed mode transmission regime). For both the mixed mode transmission and cow-milking stall–cow transmission only regimes, we observed the same hierarchy in outbreak size by milking cohort as when seeding infections were uniformly distributed across cohorts (see previous section). Even when all infections were seeded in the first cohort, higher attack rates were observed in the later cohorts (Figure 4B). When infections were seeded in later cohorts, zero infections were frequently observed in earlier milking cohorts. These findings have implications for managing cattle when outbreaks are active in a region but a farm has no detected infections; newly introduced cattle should be kept in the last milking cohort to limit the possibility of infection (via milking stalls) to other milking cohorts.
For all seeding scenarios and transmission regimes that include cow–milking stall–cow transmission, the heterogeneity in attack rates between cohorts was due to the rapid decay of infectiousness assumed for contaminated milking stalls (half life of 0.87 hours), as in Section 6. When the decay rate was assumed to be slower (half lifes of , , and hours, i.e. contaminated units are infectious for longer) the cohort of infection seeding had a smaller impact on the overall outbreak size (Figures S5 and S6). However, these simulations assume no cleaning/active decontamination of milking stalls occurs during or between milking periods, which, if occurring, would effectively reduce the duration of milking stall infectiousness. The same benefits of employing ordered milking cohorts where the decay rate of milking stall infectiousness is fast (e.g. half life of 0.87 hours), were still achievable where the decay rate was slower (e.g. half life of hours) under the assumption that milking stalls were cleaned and substantially decontaminated (e.g. 99% or 99.9% reduction in infectiousness upon cleaning) between milking periods (i.e. between milking of the last and first cohorts) (Figures S7 and S8). However, if enhanced cleaning can only be implemented once per milking period and the decay rate is fast (half life of 0.87 hours), we found that enhanced cleaning was best implemented in the middle of the milking period (Figures S3 and S4); this is because enhanced cleaning between the last and first milking cohort would prevent little transmission (as infectiousness of milking stalls decays to near zero over this period), for the baseline decay parameter. The optimum timing of enhanced cleaning will depend on both the effectiveness of cleaning, the decay rate of milking stall infectiousness, and the time between milking periods.
When only cow–cow transmission was assumed, the seeding of all infections into a single cohort instead of across multiple cohorts drastically reduced the size of an outbreak. Unsurprisingly, outbreaks had approximately the same attack rate irrespective of the cohort in which seeding occurred (compare Figure 3 and Figure 4). For example, the outbreak size on a farm with five milking cohorts and uniform infection seeding resulted in an attack rate of approximately 74% (Figure 3), whereas seeding all infections into any one of those cohorts produces an attack rate of approximately 18% (Figure 4). This was as expected because the outbreak now only occurred in a single milking cohort — the cohort of infection seeding had no impact on outbreak size as transmission is assumed to be entirely independent of milking processes and cow–cow transmission occurs only within, and not between, cohorts. When a small degree of cow–cow transmission was assumed to occur between milking cohorts the overall outbreak size increased as some infections were able to seed outbreaks in other cohorts (Figure S2). The higher the degree of between cohort cow–cow transmission the more cohorts experienced outbreaks and the larger the overall attack rate, highlighting the importance of biosecurity protocols that reduce the potential for transmission between cohorts. Overall, these results further support the recommendation that newly introduced cattle are kept in the last milking cohort, and that a ’sick/hospital’ herd containing H5N1 affected cattle (when identified) is milked last. Although the cohort of infection seeding had no effect under the cow–cow transmission only regime, the overall outbreak size can be minimised by introducing all new cattle into the same cohort.

8 The impact of bulk milk sample testing frequency on outbreak detection
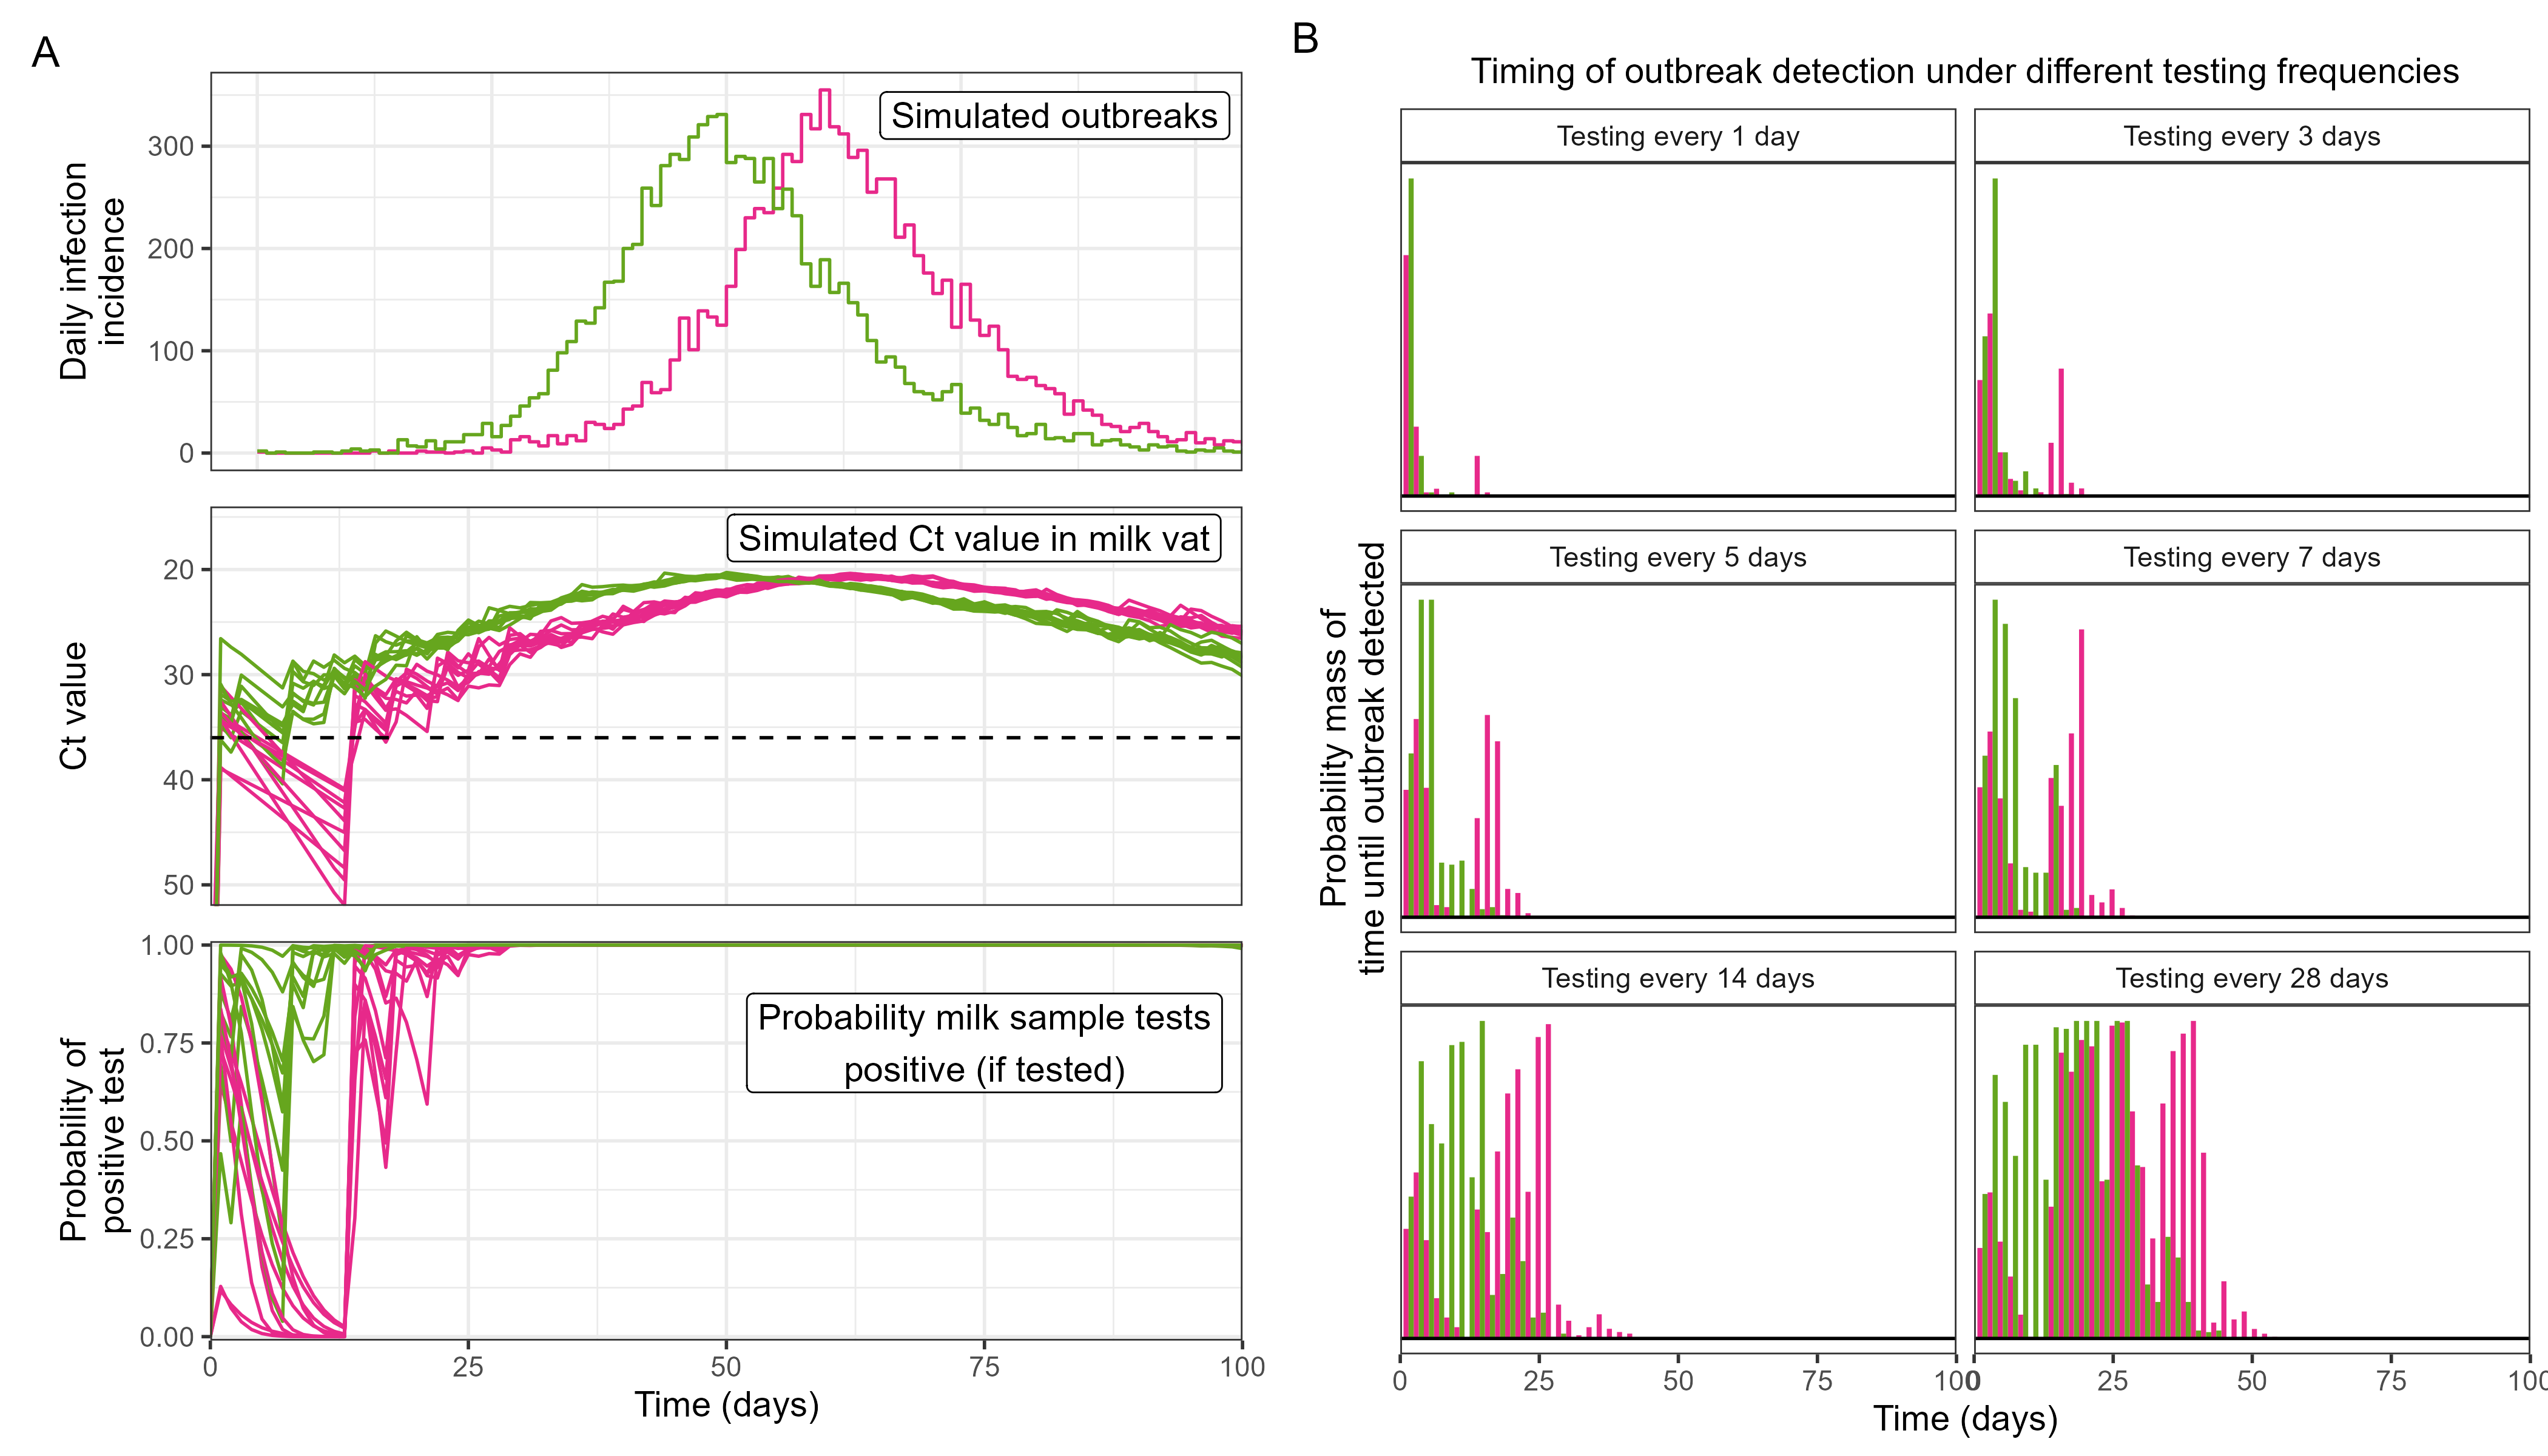
Although pre-emptively separating cattle into milking cohorts is estimated to reduce the size (and probability) of outbreaks, it may be difficult for dairy farms to implement such practices for a sustained period. Hence we also investigated the effectiveness of reactively implementing ordered milking cohorts as soon as an outbreak is detected. Since this strategy relies on early outbreak detection, we considered it in concert with different testing frequencies of bulk milk samples. We performed 100 simulations under the cow–milking stall–cow only transmission regime, for single cohort dairy farms of 100, 1000 and 10,000 cattle, with a single initial infection seeded (one cow in the E compartment). We only considered simulations in which outbreaks occurred (defined as an outbreak size greater than ten infected cattle). For each simulated outbreak we simulated the viral load and corresponding expected Ct value in a bulk milk sample (i.e. a milk sample taken from the bulk milk vat) over time (ten Ct value trajectories simulated per outbreak) using a previously published model of H5N1 viral kinetics [12] — conservatively assuming that infected cattle produce 25% as much milk as non-infected cattle — and calculated the probability of a positive test assuming a (conservative) Ct value limit of detection of 36 (see Methods) (Figure 5). These probabilities were then used to determine a distribution of time to outbreak detection — assuming the outbreak is only detected by bulk milk sample testing and not due to the presence of clinically affected cattle — across all simulated outbreaks, under different assumed testing frequencies.
The time to outbreak detection was almost entirely dependent on the testing frequency, as opposed to the infection dynamics. This is because bulk milk sample testing was highly sensitive to detecting even a single infected cow in the bulk milk sample (the time taken for an infected cow’s viral load to reach its maximum was approximately one day), under our conservative assumptions (see Methods). This means that on small farms (i.e. 100 cattle) the sensitivity of bulk milk sample testing to a single infected cow was close to 100% (from one day post infection) and so the expected time to detect an outbreak was half the interval between tests (plus one day) (Figure 6). This was because the first test after introduction (which would be positive) could occur (with equal probability) after any number of days within the testing interval.
Outbreaks were detected more slowly for larger dairy herds, but at lower infection prevalences. For some simulations on larger dairy farms (i.e. 1000 or 10,000 cattle), the outbreak was only detected on the second (or later) test — this can be seen in the gradient changes of the cumulative probability of time to detection after the first testing interval (particularly clear for the 1,000 cattle farm in Figure 6). Any differences in assumptions that lead to higher sensitivity of tests or to faster outbreaks (e.g. a shorter incubation period) would shift the distribution of outbreak detection times earlier (i.e. the distribution would be closer to a uniform distribution across the testing interval). Although outbreaks were detected more slowly on larger farms, they were detected at lower infection prevalences. For example, when bulk milk sample testing was assumed to be every four weeks, 50% of outbreaks were detected when the outbreak size was equal to or fewer than 16, 17, or 32 infected cattle (within 15, 16, and 19 days) for dairy herds of 100 (prevalence of 16%), 1000 (1.7%) and 10,000 (0.32%) cattle respectively. Notably when testing was sufficiently frequent, a sizeable proportion of outbreaks were detected on a farm with only a single infected cow (Figure 6) — for example, if testing was performed weekly then 37%, 36%, and 18% of outbreaks were detected when there was only a single infection for dairy herds of 100, 1000, and 10,000 cattle respectively. Any reactive measures would effectively be pre-emptive under such a scenario. The relative effectiveness of reactive interventions (see Section 9) will directly depend on the cumulative number of infections when those interventions are implemented. As such more frequent testing would allow dairy farms to implement more effective control strategies, and reduce the disease impact on their farm.

9 The effect of reactively separating herds into milking cohorts upon outbreak detection
As expected, the earlier in an outbreak that a dairy herd was reactively separated into milking cohorts (hereafter reactive cohorting), the greater the reduction in outbreak size. We performed 200 simulations of an outbreak in a dairy herd (with a single infection seeding), across all three transmission regimes, for dairy farm sizes of 100, 1000 and 10,000 cattle, assuming bulk milk sample testing detected the outbreak at different levels of cumulative infections (1, 5, 10, 20, 50, i.e. vertical dashed lines on Figure 6) before the dairy herd was separated randomly into five cohorts (see Methods). The largest reduction in outbreak size due to reactive cohorting was observed for the cow–milking stall–cow transmission only regime. For any threshold (cumulative infections before cohorting was implemented) the most significant reduction in attack rate was observed for the largest farms (Figure 7). This is not surprising because the same absolute number of infections reflects a lower infection prevalence for a larger farm. However, it is important to note that due to the high sensitivity of bulk milk sample testing it is likely that outbreaks will be detected at (relatively) similar absolute infection numbers as opposed to population prevalences.
When a small degree of cow–cow transmission was allowed for (mixed mode transmission regime) the effectiveness of reactive cohorting was reduced (though still highly effective for the parameters assumed) (Figure S10). When only cow–cow transmission was assumed, reactive cohorting resulted in a modest reduction in outbreak size, and attack rates of almost 20% were frequently observed even with an outbreak detection threshold of one infected cow (Figure S9). Overall outbreak sizes (as a proportion) for a given detection threshold were similar between farm sizes; this was because the reduction in outbreak size was due to outbreaks not occurring in some cohorts, either due to infected cattle not being allocated into those cohorts (when the reactive cohorting was implemented), or stochastic extinction occurring after infected cattle were allocated.

10 Discussion
We have developed mathematical models of H5N1 transmission dynamics on dairy farms and used them to identify factors that may contribute to outbreak risk and on-farm interventions for mitigating this risk. Previous models of H5N1 transmission have focussed on between farm transmission dynamics [24], and so have not explicitly considered the role of milking stalls in the transmission process (a valid simplifying assumption for modelling studies not investigating the effects of on-farm interventions). Here we explicitly modelled the milking process and transmission between dairy cattle through contamination of milking stalls (cow–milking stall–cow transmission), while also allowing for direct cow–cow transmission. While the relative contributions of different transmission pathways remains a key uncertainty [7] — neither transmission to cows via contaminated milking equipment (included in cow–milking stall–cow transmission in our model) nor close contact with infected animals (cow–cow transmission in our model) have been achieved under experimental conditions [18] — we have identified intervention strategies that would be effective irrespective of the transmission regime. We demonstrated that separating the herd into milking cohorts, where milking cohorts are kept in separate paddocks and milked in the same order every day, reduces the risk of occurrence and size of outbreaks. Cohorting was particularly effective when outbreaks were seeded in the last cohort, suggesting that during active outbreaks newly introduced cattle should be kept in the last milking cohort.
Many key epidemiological parameters that determine on-farm transmission dynamics are highly uncertain and likely to vary between dairy farms and locations. Our mathematical analyses are able to highlight where interventions can be targeted to alter the “effective” value of these parameters to reduce transmission. However, unless appropriate epidemiological data are available to robustly infer key parameters, analyses such as ours are not able to precisely estimate the expected magnitude of reductions in transmission. We have presented multiple combinations of intervention strategies that would be (theoretically) effective at reducing transmission irrespective of specific epidemiological conditions. More detailed epidemiological investigations during outbreaks could help better quantify parameters, and thus refine estimates of the effectiveness of different intervention strategies.
The duration of milking stall infectiousness is an influential but highly uncertain parameter. This parameter is informed by experimental studies that measure the viral titre of influenza virus in milk samples on surfaces over time. Variable rates of viral decay have been reported depending on surface material (e.g. stainless steel, rubber liners), temperature [17, 16] and study. We assumed a rapid decay in milking stall infectiousness (half life of approximately 1 hour, towards the faster end of viral decays observed at ) based on the decay of influenza virus in milk samples on rubber liners (the material at the milking unit that attaches to an animal’s teats) [17]. This assumes that the decay of infectiousness of the milking stall (including the feed trough, air or other surfaces that may contribute to transmission) is similar to the decay of infectiousness of the milking unit. The model also assumes that milking stall infectiousness is proportional to the concentration of influenza virus in milk samples; a non-linear relationship is also entirely plausible (e.g. only a small amount of virus, or a threshold amount of virus, might be needed for infection to occur [18]). Additionally, our decay function assumes that the rate of infectiousness decays entirely due to degradation over time. It is also possible that viral concentration decays due to repeated use (i.e. milk from non-infected cattle dilutes viral concentration), or due to standard biosecurity protocols (e.g. cleaning of equipment between uses). Despite the uncertainty in the duration of milking stall infectiousness and the specific transmission regime, we have demonstrated that even when milking stalls remain infectious for longer than our decay function, the benefits of employing ordered milking cohorts will stand if effective disinfection occurs between milking periods (mimicking the effects of a faster decay rate). As one would expect, the more cleaning of milking stalls the lower the rate of transmission, but if resources (e.g. time) are constrained, limiting the frequency of cleaning, the optimum timing will depend on: the effectiveness of disinfection; the decay rate of milking stall infectiousness; and how often and when cattle are milked. In our analysis (half life of 0.87 hours, five cohorts, with milking twice daily, and cleaning once per milking period) cleaning was most effective at preventing H5N1 transmission when performed between the second and third cohorts. Although we note that cleaning would still be required following the end of each milking period to prevent bacterial growth in milk residue between milking periods.
We have developed a model to capture the salient features of on-farm transmission dynamics, but numerous simplifications had to be made for model tractability. Cow–cow transmission rates were assumed to be constant over time, but in reality will likely vary over time; for example, there may be increased opportunities for cow–cow transmission when cows are in closer contact as they move through lane ways before and after milking. We have also only considered farms with a single milking parlour, and large farms may have multiple milking parlours. In such instances ensuring that individual cattle visit the same milking parlour every milking would reduce routes of transmission, decreasing outbreak risk and size. Furthermore, observing biosecurity protocols when workers or equipment move between cattle using different milking parlours would effectively split the farm into multiple smaller farms, reducing outbreak size. Finally, we did not consider the possibility of milking orders within herds. Due to the social dynamics of cattle within a herd, a degree of natural milking order is typically observed (e.g. certain cows will always present for milking first). Even when such natural ordering occurs, further dividing a herd into ordered milking cohorts would likely increase ordering overall, and thus reduce outbreak risk and size.
We demonstrated that bulk milk sample testing is highly sensitive to detecting an outbreak of only a few infections, and so frequent testing (e.g. weekly) would allow outbreaks on farms to be rapidly detected. The nationwide (US) voluntary Dairy Herd Status Program [11], in which farms can enrol for weekly testing of bulk milk samples, reported limited enrolment over the course of the US outbreaks [29]. We have demonstrated that reactively separating cattle into milking cohorts can be highly effective at reducing the size of outbreaks, as long as outbreaks are detected rapidly. Effective reactive interventions, that become possible when undertaking bulk milk sample testing, may encourage higher enrolment rates in future monitoring programs and larger benefits for the industry. Higher enrolment rates would then also reduce between farm transmission. For example, testing measures in the United States, aimed at preventing movement of infected cattle, included required testing of a subset (up to a maximum of 30) of cattle being transported. However, the median size of dairy cattle shipments in the United States is 48 cattle [6]; for shipments larger than 48 with a single infected cow, the probability of testing that infected cow would be less than 62.5% (30/48) whereas our results suggest that a farm conducting frequent bulk milk sample testing would be highly unlikely to export infected cattle. The exact probability of a farm exporting infected cattle would depend on the farm’s size and the rate the farm exports cattle.
11 Conclusions
We have used mathematical methods to quantify the effect of different interventions for mitigating outbreaks of H5N1 influenza on dairy farms. Our findings may be considered in the development of management guidelines to inform H5N1 outbreak response strategies on dairy farms. In the event of active influenza H5N1 outbreaks affecting cattle in a region, pre-emptive interventions can be taken on infection-free farms to reduce the risk of outbreaks, and the size of outbreaks should they occur, including: pre-emptively separating herds into ordered milking cohorts; placing newly introduced cattle into the final milking cohort; regular enhanced cleaning of milking stalls; and observing strict biosecurity protocols when workers or equipment move between milking cohorts (e.g. decontamination or cleaning). Additionally, frequent bulk milk sample testing (e.g. weekly) would enable the rapid detection of outbreaks and implementation of reactive interventions (or scaling up of existing interventions). All interventions explored in our analysis should be practical to implement, as evidenced by existing policy or practice. For example, many dairy farms routinely run multiple ‘mobs’ (e.g. to separate cattle by A2/A1 milk type, or to quarantine mastitis-affected cattle), and milking them in a consistent order would likely require minimal additional coordination. Our findings can directly inform the development of management guidelines for effectively responding to future H5N1 outbreaks in dairy cattle.
Methods
Propagation of outbreaks
The probability of an outbreak on farm seeding an outbreak on farm by time is given by [31]:
| (17) |
where is the time an outbreak is seeded, and is the time varying rate at which farm introduces an outbreak to farm over time. This time-varying rate, can be expressed as:
| (18) |
where: is the infection incidence on farm over time; is the rate at which infected animals are exported from farm to farm over time; and is the probability that an infected animal introduced to farm causes an outbreak, as a function of the time since infection. The probability density function for the time at which an outbreak on farm seeds an outbreak on farm is then given by:
| (19) |
and the overall probability that farm seeds an outbreak on farm is given by:
| (20) |
The expected number of secondary outbreaks cause by farm will scale (approximately) with the sum of outbreak probabilities,
| (21) |
This expression is only approximate as the probabilities will likely not be independent.
Stochastic model of H5N1 transmission
We simulate on-farm outbreaks using a stochastic model of on-farm transmission dynamics. The model considers two modes of transmission: cow–cow transmission, that is simulated using a Gillespie algorithm; and cow–milking stall–cow transmission, that is simulated at discrete times using time-varying probabilities (see below). The model defines a farm as a number of individual cattle and milking stalls. Cattle are divided into separate milking cohorts (i.e. separate pens or paddocks, that are milked in a consistent order). Milking stalls could analogously be divided into separate milking parlours, with different cohorts milked at different milking parlours. However, we only consider one milking parlour in this analyses; if there was more than one and all cohorts only went to a single parlour consistently then the structure would be analogous (in transmission terms) to two farms.
Cow–cow transmission model
Individual cattle are either: susceptible to infection (S); exposed but not yet infectious (E); infectious (I); or recovered and not susceptible (R). Cattle are divided into distinct milking cohorts, which are kept in separate paddocks (subscript ). Outside of milking events (next section), transitions between states are governed by a system of ordinary differential equations:
| (22) | ||||
| (23) | ||||
| (24) | ||||
| (25) |
With transition events and times simulated using a Gillespie algorithm until the next milking event. Here, is the force of infection on milking cohort . For the main analyses the force of infection takes the form . Where is the density dependent transmission rate and is the area of the paddock (which we assume is constant between cohorts). In addition we run sensitivity analyses allowing there to be some degree of between cohort cow–cow transmission,
| (26) |
where the summations are over all cohorts . This allows there to be some additional (equal) degree of transmission between all cattle (mediated by the area of the entire farm). In all analyses we assume (1.1 days is the time until minimum Ct value (peak viral load) is reached in Eales et al. [12]) and (7.8 days is the average duration of infectiousness inferred in Eales et al. [12].
Cow–milking stall–cow transmission
A milking stall becomes contaminated when an infected cow is milked at the milking stall with probability . Milking stall–cow transmission occurs when a susceptible cow is milked at a previously contaminated milking stall, with probability . We assume that this probability decays exponentially over time:
| (27) |
with decay rate .
In the main analyses we assume that per hour. This was the approximate decay rate of H1N1 influenza A virus in milk on rubber liners over 5 hours (see Figure 1C and supporting data for Le Sage et al 2024 [17]); the same study found similar decay rates between influenza A H5N1 and H1N1 over the first hour, but did not collect data over a longer period for H5N1. The decay rate for H5N1 in milk on rubber liners over one hour was approximately 1.4 per hour (see Figure 1A and supporting data for Le Sage et al 2024 [17]). This reflects only a slightly shorter half-life (0.7 hours) than that used in the main analyses (0.87 hours). A recent study has estimated a longer half life of H5N1 in irradiated milk on rubber (approximately 3.3 hours at and 12 hours at ) [16] and so we also considered sensitivity analyses with slower decay rates for milking stall infectiousness. The probabilities, and were calibrated, with full details given in the Simulation studies section below. In addition we run sensitivity analyses in which decreases by a proportion every time enhanced cleaning occurs (see Table S1 for the timings of cleaning and values of investigated).
Timing of milking events
Cow–milking stall–cow transmission is dependent on the timing of milking events. The timing of all milking periods (the period over which all cattle are milked) is defined at the beginning of the simulation. For all simulations we assume that cattle are milked twice daily over two milking periods starting at 0600 and 1800 (i.e. 12 hours apart). During the milking periods individual milking events (i.e. cow and milking stall pairings) are determined systematically. cows are randomly selected from the first cohort and paired with the milking stalls. Potential cow–milking stall–cow transmission events are probabilistically simulated (see above). Time is advanced by the assumed time taken for each cow to be milked (assumed to be 5 minutes throughout); during this period Gillespie events (i.e. cow–cow transmission, recovery) can occur as in the above section. The cows that have just been milked are then transferred to an empty paddock (or the same area as their original paddock), and the next cows are randomly selected. This is repeated until all cows in the cohort have been milked and then repeated for each of the cohorts. We assume there is no additional time between each milking cohort (i.e. as soon as first milking cohort is completed the second cohort begins).
Simulation studies
We perform simulation studies to explore the impact of intervention measures and parameter values. For most of the main analyses we consider three sets of transmission parameters describing three transmission regimes: cow–cow transmission only; cow–milking stall–cow transmission only; and mixed mode transmission (representing predominantly cow–milking stall–cow transmission). The transmission parameters are calibrated so that simulated outbreaks (initialised with ) on dairy farms with , , a single milking cohort, and milking occurring twice per day (at 0600 and 1800) average to approximately 89% [23]. The transmission parameter values used in these simulations are provided in Table 2. Full details for all simulations performed are provided in Table S1.
| Parameter (unit) | Cow–cow | Mixed-mode | Cow–milking stall–cow |
|---|---|---|---|
| transmission | transmission | transmission | |
| ((individualsdays)-1) | 0 | 0 | 0 |
| ((individualsdays)-1) | 0.34 | 0.07 | 0 |
| 0 | 0.16 | 0.18 | |
| 0 | 0.16 | 0.18 |
Bulk milk sample testing
We estimate the time it takes to detect an outbreak under different frequencies of bulk milk sample testing (i.e. testing a sample of milk from the central milk vat). To do this we: simulate outbreaks (see Table S1) on dairy farms of 100, 1000 and 10,000 cattle; simulate Ct value trajectories in bulk milk samples over time for each outbreak; calculate the probability of a positive test given the Ct value of the bulk milk sample; and finally, simulate different testing frequencies and compute when the first positive test occurs.
Ct value model
We simulate the H5N1 viral kinetics in milk samples of infected cattle using a previously parametrised model [12]. The model assumes that the Ct value of a milk sample from one infected cattle is given by:
| (28) | ||||
| (29) |
Where is the minimum Ct value reached, is the time since infection () at which the minimum is reached, the viral growth rate (decrease in Ct) before the minimum Ct value is reached, and the viral decay rate (increase in Ct) after the minimum Ct value is reached. An individual cow’s Ct value in milk is thus governed by their time of infection and four parameters: . For each infected cow we draw parameter values from the population-level distribution using the median population-level parameter estimates from the previously published study [12].
The Ct value of bulk milk samples is calculated by combining the individual-level Ct values of infected cattle. Ct value is converted to virus concentration in a milk sample ( equivalent/ml) using the standard curve: [13]. The virus concentration in the bulk milk sample is then calculated by averaging over all cattle assuming conservatively that each infected cow produces 25% of the milk produced by a non-infected cow. The virus concentration is then converted back to a Ct value using the standard curve above.
Probability of testing positive
The probability of a bulk milk sample testing positive given its Ct value is defined as the probability that the Ct value is less than a threshold value. We chose the threshold value conservatively to be 36, though some studies have used detection sensitivities of higher Ct values (lower viral loads). We calculate the probability that the Ct value is less than the threshold value assuming that the measured Ct value will be normally distributed around its expected value with standard deviation taken from the model in Eales et al [12].
Simulating testing frequencies
We simulate different testing frequencies during the course of an outbreak and determine the time at which the first positive test occurs, given the probability of a bulk milk sample testing positive over time. We assume that testing is performed at the same time on any given day (mid-day). For any testing interval it is equally possible that the first test occurs on any day between the outbreak beginning and the first complete testing interval. For example, if testing was performed every 10 days then there is an equal probability of the first test being on any day from day 0 to day 9 of the outbreak. For each possible day of first test we simulate testing beginning on that day and being performed at regular intervals, with test results determined using the probability of a positive test.
For each infection trajectory (for outbreaks that do not immediately become extinct), we simulate 10 Ct value trajectories and calculate the probability of a positive test. We then perform 10 simulations of bulk milk sample testing for each testing frequency, and for each possible day of first test. We then consider the probability distribution over all simulations of the time to first positive test (and the number of infections prior to the first positive test).
Code availability
All code supporting this paper is available at https://github.com/Eales96/H5N1-transmission-dynamics/
Acknowledgements
This research is supported by the Livestock Biosecurity Fund – Cattle Compensation Fund (CCF 25.19). OE is supported by a University of Melbourne McKenzie Fellowship and Andrew Sisson support package. FMS is supported by the National Health and Medical Research Council of Australia through the Investigator Grant Scheme (Emerging Leader Fellowship, 2021/GNT2010051). JMM is supported by the Australian Research Council through the Laureate Fellowship Scheme (FL240100126). This research is supported by the Australian Consortium of Epidemic Forecasting and Analytics (ACEFA), a National Health and Medical Research Council of Australia Centre of Research Excellence (2035303). FMS and JMM’s research is also supported by an Australian Research Council Discovery Project Grant (DP240102286).
References
- [1] (2012-03) Extinction thresholds in deterministic and stochastic epidemic models. J. Biol. Dyn. 6 (2), pp. 590–611 (en). Cited by: §3, §3.
- [2] APHIS confirms D1.1 genotype in dairy cattle in nevada. Technical report U.S. Derpartment of Agriculture: Animal and Plant Health Inspection Service (en). Cited by: §1.
- [3] APHIS identifies third HPAI spillover in dairy cattle. Technical report U.S. Derpartment of Agriculture: Animal and Plant Health Inspection Service (en). Cited by: §1.
- [4] (2025-05) Evolution, spread and impact of highly pathogenic H5 avian influenza a viruses. Nat. Rev. Microbiol., pp. 1–16 (en). Cited by: §1.
- [5] (2025-06) Avian influenza a(H5N1) isolated from dairy farm worker, michigan. Emerg. Infect. Dis. 31 (6), pp. 1253 (en). Cited by: §1.
- [6] (2021-08) Spatial and network analysis of U.S. livestock movements based on interstate certificates of veterinary inspection. Prev. Vet. Med. 193 (105391), pp. 105391 (en). Cited by: §10.
- [7] (2026-05) Surveillance on california dairy farms reveals multiple possible sources of H5N1 influenza virus transmission. PLoS Biol. 24 (5), pp. e3003761 (en). Cited by: §10, §3.
- [8] (2024-10) Spillover of highly pathogenic avian influenza H5N1 virus to dairy cattle. Nature 634 (8034), pp. 669–676 (en). Cited by: §1, §2, §3.
- [9] (2026-04) Emergence of D1.1 reassortant H5N1 avian influenza viruses in north america. bioRxivorg, pp. 2025.12.19.695329 (en). Cited by: §1.
- [10] (2020) Farm guidelines for mastitis control. Technical report Dairy Australia (en). Cited by: §4.
- [11] Dairy herd status program. (en). Note: https://www.aphis.usda.gov/livestock-poultry-disease/avian/avian-influenza/hpai-detections/livestock/dairy-herd-status-programAccessed: 2025-7-11 Cited by: §1, §10.
- [12] (2026-01) Modeling of H5N1 influenza virus kinetics during dairy cattle infection suggests the timing of infectiousness. PLoS Biol. 24 (1), pp. e3003586 (en). Cited by: §4, §8, Cow–cow transmission model, Ct value model, Ct value model, Probability of testing positive.
- [13] (2025-06) Dairy cows develop protective immunity against reinfection with bovine H5N1 influenza virus. Nat. Microbiol. 10 (6), pp. 1366–1377 (en). Cited by: §1, §3, Ct value model.
- [14] (2024-12) A human isolate of bovine H5N1 is transmissible and lethal in animal models. Nature 636 (8043), pp. 711–718 (en). Cited by: §1.
- [15] (2024-09) H5N1 clade 2.3.4.4b dynamics in experimentally infected calves and cows. Nature, pp. 1–3 (en). Cited by: §1, §3.
- [16] (2025-04) Highly pathogenic avian influenza a(H5N1) virus stability in irradiated raw milk and wastewater and on surfaces, united states. Emerg. Infect. Dis. 31 (4), pp. 833–837 (en). Cited by: §10, §3, §4, Cow–milking stall–cow transmission.
- [17] (2024-08) Persistence of influenza H5N1 and H1N1 viruses in unpasteurized milk on milking unit surfaces. Emerg. Infect. Dis. 30 (8), pp. 1721–1723 (en). Cited by: §10, §3, §4, §6, Cow–milking stall–cow transmission.
- [18] (2025-06) Dairy cows infected with influenza a(H5N1) reveals low infectious dose and transmission barriers. Research Square (en). Cited by: §10, §10.
- [19] (2025-01) The impact of H5N1 on US domestic and international dairy markets. Social Science Research Network. Cited by: §1.
- [20] (2025-07) Highly pathogenic avian influenza H5N1 in the united states: recent incursions and spillover to cattle. Npj Viruses 3 (1), pp. 54 (en). Cited by: §1.
- [21] (2025-04) Emergence and interstate spread of highly pathogenic avian influenza a(H5N1) in dairy cattle in the united states. Science 388 (6745), pp. eadq0900 (en). Cited by: §1, §2.
- [22] (2024-09) The global H5N1 influenza panzootic in mammals. Nature, pp. 1–2 (en). Cited by: §1.
- [23] (2025-07) The impact of highly pathogenic avian influenza H5N1 virus infection on dairy cows. Nat. Commun. 16 (1), pp. 6520 (en). Cited by: §1, §4, §5, Simulation studies.
- [24] (2025-05) A mathematical model of H5N1 influenza transmission in US dairy cattle. Nat. Commun. 16 (1), pp. 4308 (en). Cited by: §1, §10.
- [25] (2013-01) Milking machines and milking parlors. In Handbook of Farm, Dairy and Food Machinery Engineering, pp. 177–197. Cited by: §4.
- [26] (2022-12) Modeling U.S. cattle movements until the cows come home: who ships to whom and how many?. Comput. Electron. Agric. 203 (107483), pp. 107483 (en). Cited by: §2.
- [27] (2013-06) Invited review: reduced milking frequency: milk production and management implications. J. Dairy Sci. 96 (6), pp. 3401–3413 (en). Cited by: §4.
- [28] Federal orders. (en). Note: https://www.aphis.usda.gov/livestock-poultry-disease/avian/avian-influenza/hpai-detections/livestock/federal-orderAccessed: 2025-7-11 Cited by: §1.
- [29] United states 2022 census of agriculture. table 11. cattle and calves - inventory and sales: 2022 and 2017 (accessed 09 december 2024). Note: https://www.nass.usda.gov/Publications/AgCensus/2022/Full\_Report/Volume\_1,\_Chapter\_2\_US\_State\_Level/st99\_2\_011\_011.pdf Cited by: §10.
- [30] (2026) USDA milk production report. Technical report National Agricultural Statistics Service, United States Department of Agriculture: National Agricultural Statistics Service (en). Cited by: §1.
- [31] (2018-09) The distribution of the time taken for an epidemic to spread between two communities. Math. Biosci. 303, pp. 139–147 (en). Cited by: §2, Propagation of outbreaks.
Supplementary figures
![[Uncaptioned image]](2606.26674v1/x1.png)


