Impact of Clouds on the Atmosphere-Mantle Interface of Sub-NeptunesPICASO (Mukherjee et al., 2023; Mang et al., 2026; Batalha et al., 2019), VIRGA (Rooney et al., 2021; Batalha et al., 2025), photochem (wogan2025; wogan24)
Abstract
Sub-Neptunes are among the most common type of close-in planets found in our galaxy, yet their bulk composition remains largely uncertain; H-rich envelopes overlaying rocky cores, volatile-rich planets, and carbon-rich interiors all remain viable configurations for members of this population. Atmospheric characterization has been proposed as a means of distinguishing between these scenarios, but growing evidence suggests that sub-Neptunes may host molten atmosphere-mantle interfaces which could alter the composition of their atmosphere. We use the PICASO 1D climate model, coupled to interior-structure and magma-atmosphere chemistry frameworks to quantify how clouds alter the atmospheric and interior structure of sub-Neptunes. For temperate sub-Neptunes like TOI-270 d, we find that clouds can lead to K heating at depth ( bar) and K cooling at shallow pressures (1 bar). This heating is very sensitive to the cloud sedimentation efficiency and, to a lesser extent, to metallicity. Most sub-Neptunes in our sample should have a molten atmosphere-mantle interface, except TOI-1231 b and GJ 1214 b. For these two planets, cloudy models have a molten interface whereas clear models can allow a solid boundary. Clouds can heat the atmosphere-mantle interfaces by a temperature difference between K for most sub-Neptunes in our sample. Such cloud-driven heating can substantially change the composition of the interface with abundances of , , and SiO showing a % increase between cloudy and clear models of TOI-270 d. We discuss the implications of our results for the thermal evolution and measurements of intrinsic heat flux for this population.
Keywords:
\uatExoplanets498, \uatExoplanet atmospheres487show]smukhe50@asu.edu
]
]
]
]
]
]
I Introduction
Sub-Neptunes are the most common close-in planets in the galaxy (Fulton et al., 2017; Howard et al., 2012; Fressin et al., 2013). Their radii lie between (Rogers, 2015), and their measured bulk densities (e.g., Luque et al., 2022; Turtelboom et al., 2022; Rosenthal et al., 2021; Jiang et al., 2025; Livingston et al., 2026) are consistent with bulk structures as varied as H-rich envelopes overlaying rocky cores (e.g., Barnes et al., 2009; Rogers and Seager, 2010a; Rogers, 2015; lopez14), ‘water-worlds” composed of 10% by mass (e.g., Kuchner, 2003; Fu et al., 2010; fortney2007planetary; Rogers and Seager, 2010b; Zeng et al., 2019), and carbon-rich compositions (Lin and Seager, 2025; Li et al., 2026; madhu12). Mass and radius alone cannot distinguish these scenarios, and atmospheric characterization has been proposed as a means to distinguish them (e.g., Adams et al., 2008; Miller-Ricci et al., 2009; fortney13).
The strength of gaseous absorption features in transmission spectra of sub-Neptunes are a function of their atmospheric mean molecular weight (along with temperature, gravity, and aerosol-driven obscuration), which might be indicative of the chemical composition of these planets (benneke2013). For example, a very -rich composition might have a much larger atmospheric mean molecular weight compared to a planet with an extended H/He envelope over a rocky or ice-rich core. However, physical processes in the atmospheres and their interaction with planetary interiors might further complicate this picture.
Atmospheric processes including condensation (morley13; Charnay et al., 2021; Gao and Benneke, 2018; lee2025), photochemical production of hazes (He24; mak2025; gao2017sulfur), photochemistry (tsai23; mukherjee25), and large-scale dynamics (Mukherjee et al., 2022; Zhang and Showman, 2018; Fortney et al., 2020) can significantly alter the chemical composition, as well as the mean molecular weight, of planetary photospheres. Apart from these atmospheric processes, deep interiors of sub-Neptunes might develop molten magma oceans due to extremely high pressures and temperatures at the base of their envelopes (Kite et al., 2019, 2020; tang25; Nixon2025). The possibility of water oceans has also been proposed for temperate sub-Neptunes (madhu2021; Nixon2021; piette2020).
Magma oceans can exchange gases at the mantle-envelope interface, which can alter their atmospheric chemical composition (Hakim et al., 2026; Misener et al., 2023; Schlichting and Young, 2022; Kite et al., 2020; Horn et al., 2025; Nixon2025) and modify their thermal structures (Misener et al., 2023; Markham et al., 2022; Misener and Schlichting, 2022). Understanding the physical nature of this atmosphere-mantle interface (breza25; calder2025; tejada2026) is therefore critical for leveraging atmospheric observations of sub-Neptunes to reveal their composition, evolution, and formation mechanisms.
Observational efforts to characterize sub-Neptune atmospheres with space-based telescopes have been ongoing for more than a decade (e.g., Kreidberg et al., 2014; brande24; benneke2019; barat24; mikalevans2021; mikalevans2023). Aerosol-driven muting of their transmission spectra emerged as a common theme across these observations, albeit at varying levels (dymont2022; brande24). Recently, JWST has enabled transmission spectroscopy of these sub-Neptune atmospheres across a much wider wavelength range with enhanced precision (e.g., madhu23; hu2025; benneke2024; davenport25; gao23; barat2025; piaulet2024; wallack24; wallack2026; Teske25). Featureless spectra or muted spectral features have remained the most prominent results borne out of these studies, which has been postulated as due to either high mean molecular weight atmospheres or atmospheres dominated by aerosols. Phase curve observations of sub-Neptunes have further highlighted the role of aerosols in their atmospheres (kempton23).
While a significant volume of theoretical work has sought to understand the nature of these aerosols (e.g., he2024; horst2018; Huseby2025), their composition (e.g., morley13; Gao and Benneke, 2018; lavvas19), and spatial distribution (e.g., steinrueck2025; malsky2025), how aerosol coverage in sub-Neptunes can impact the atmosphere-mantle interface has remained underexplored. lee2025 explored mineral cloud formation in sub-Neptune exoplanets, finding abundant cloud formation near the atmosphere-mantle boundary and suggested these clouds could substantially impact the boundary, but did not quantify the effect. Here, we quantify the impact of mineral clouds on the pressure, temperature, phase, and chemistry of the atmosphere-mantle interface across a representative sample of sub-Neptune exoplanets.
II Modeling
II.1 Climate and Chemistry
We use PICASO (Mukherjee et al., 2023; Mang et al., 2026; Batalha et al., 2019) to simulate sub-Neptune atmospheres. Our climate model assumes radiative-convective equilibrium and is self-consistently coupled to the photochem 1D chemical kinetics model (wogan2024; wogan2025; mukherjee25). We divide our model atmospheres into 90 plane-parallel layers with pressures equally-spaced in the logarithmic space. We assume a full-redistribution of the incident stellar energy between the day- and night- sides of the model planets, which corresponds to rfacv=0.5 in PICASO. We assume K for all models, in line with the relatively cold interiors expected from the mature sub-Neptune population due to their thermal evolution (Fortney et al., 2020; fortney2007planetary; thorngren2016; tang25).
We compute atmospheric chemistry by interfacing the radiative-convective model “on-the-fly” with the photochem 1D chemical kinetics model. Photochem computes the abundances of gases at each major iteration of the profile within PICASO. We use a C-H-N-O-S chemical network to compute the atmospheric chemistry for CO, , , , , , HCN, , , , , , and with photochem. On the other hand, we compute the abundances of Na, K, and FeH assuming thermochemical equilibrium with the equilibrium chemistry solver within photochem.
We use mixing length theory (Gierasch and Conrath, 1985) to compute the strength of vertical mixing, parametrized using the 1D eddy diffusion coefficient– , in the convective atmospheric layers. In the radiative layers, the is also computed using mixing length theory but the mixing length is decreased using a factor, which is the ratio of the local lapse rate and adiabatic gradient following previous work (Morley et al., 2024; ackerman2001cloud). This profile is used to compute the chemical state in disequilibrium with photochem at each iteration of the climate model.
Correlated-k opacities of CO, , , , , , HCN, , , , , , , Na, K, and FeH are mixed at every iteration of the climate model with the resort-rebin technique (Amundsen et al., 2017). We do not include photolysis reactions in photochem, and instead only consider gas-phase kinetics because the effects of photochemical processes on the profile are known to be small (100 K) and localized to smaller pressures (mukherjee25). Therefore, the photochem model computes the abundance profiles taking quenching due to vertical mixing and thermochemical equilibrium into account.
II.2 Clouds
We simulate clouds using the VIRGA cloud model (Batalha et al., 2025; Rooney et al., 2021). The VIRGA cloud model derives its heritage from the eddysed cloud model (ackerman2001cloud) and has been fully coupled with the climate modules of PICASO 4.0 (Mang et al., 2026). This coupling ensures that the cloud structure and its impact on the thermal structure are computed self-consistently within our climate model, enabling us to explore radiatively active mineral clouds in sub-Neptune atmospheres.
VIRGA simulates the vertical distribution of cloud droplets by solving the balance between the vertical lofting of cloud droplets and condensible vapor due to atmospheric dynamics and the gravitational settling of droplets. This balance is described by,
| (1) |
where is the mass mixing ratio of the cloud droplets and condensible vapor, is altitude, is the ratio between the settling velocity of droplets and the convective velocity in the atmosphere (), and is the mass mixing ratio of the cloud droplets (ackerman2001cloud). Lower causes cloud droplets to be extended to lower pressures or higher altitudes, whereas a higher causes bigger cloud droplets to remain lofted in the atmosphere. We do not vary as a free parameter but calculate it self-consistently to preserve the physical self-consistency between the climate and cloud modeling framework (Morley et al., 2024). VIRGA assumes a log-normal distribution of droplet sizes. The droplet size distribution at each atmosphere layer is set by the mean particle radii and its standard deviation. These are calculated using both and following ackerman2001cloud. We use the same profile for cloud droplets and vertical transport of gases.
We consider seven cloud species , Fe, , , KCl, MnS, and ZnS that have been predicted to condense in the deeper atmospheres of warm to temperate exoplanets (morley2012neglected; Visscher et al., 2006, 2010; lee2025). We use wavelength-dependent cloud optical properties of each of these species (Appendix C) and assume perfectly spherical cloud droplets. We also consider a spatially uniform coverage of clouds, even though there is growing empirical evidence that cloud coverage in giant exoplanets can be patchy (Mukherjee2025; Fu2025; coulombe2025; MacDonald2017; Welbanks and Madhusudhan, 2021). We further discuss this assumption in §IV.
II.3 Interior Structure Modeling
We model the internal structure of sub-Neptunes using SMILE (Nixon2021; Nixon et al., 2024), which computes the radius of a planet for a given mass, profile, and composition. SMILE is used to solve the equations of hydrostatic equilibrium and mass conservation for planets consisting of an iron core, silicate mantle, and mixed gaseous envelope consisting of H, He and H2O. The atmospheric profile and composition are taken from the PICASO models. Due to limited equation of state data for many of the chemical species in the atmosphere, we use H2O as a proxy for all atmospheric components heavier than H/He, a common assumption in many internal structure models (e.g., thorngren2016; Egger et al., 2025; Rigby and Madhusudhan, 2026). We choose the proportions of atmospheric H/He and H2O such that the mean molecular weight profile is identical to that of the atmospheric models, following Nixon et al. (2024). In cases where the gaseous envelope extends to deeper pressures than considered in the atmospheric model, we assume an adiabatic profile and a constant mean molecular weight, fixed to its value at the deepest pressure in the atmospheric model.
For each planet under consideration, we explore a grid of models with varying envelope mass fractions from 0.1% to 50% in steps of 0.05%. We use steps of 0.005% for TOI-421 b due to its smaller bulk envelope fraction compared to all other targets. We accept all models for which the model mass and radius are consistent with measured values to 1. For each accepted model, we extract the pressure and temperature at the atmosphere-mantle boundary, to find the range of surface conditions that may be possible for the planet.
II.4 Atmosphere-Interior Exchange
We also investigate how changes in pressures and temperatures at the atmosphere-mantle interface due to deep atmospheric clouds can impact the chemical products of magma-atmosphere interactions. For the majority of targets considered in this work, the surface of the silicate layer is expected to be molten (magma), meaning that chemical interactions between the silicate layer and the overlying gaseous envelope can significantly alter the planet’s chemical composition (Schaefer et al., 2016; Kite et al., 2019). The resulting composition at the base of the atmosphere is therefore strongly dependent on the pressure-temperature conditions at the interface (Schlichting and Young, 2022; Nixon2025).
We use the equilibrium thermodynamic model for a sub-Neptune-like exoplanet which accounts for chemical interactions between a metal core, silicate-dominated mantle, and an initially hydrogen-rich atmosphere presented in Schlichting and Young (2022). The temperature at the atmosphere-mantle boundary is chosen to match the values extracted from the internal structure models, as described in Section II.3. We employ the “reactive metal” model, in which the metal (possibly in the form of a differentiated core) participates fully in the chemistry. The system is described by a basis set of reactions, and the condition for chemical equilibrium is a zero sum of the product of the chemical potentials of each species and their stoichiometric coefficients in each reaction.
III Results
We first explore how clouds affect the temperature-pressure structure of the temperate sub-Neptune TOI-270 d (§III.1), and how this effect depends on the sedimentation efficiency of cloud droplets and atmospheric metallicity. Then, we explore the impact of cloud-driven heating over a generalized gravity– grid to later focus on a sample of 8 representative sub-Neptunes, including TOI-270 d, for which we quantify the impact of mineral clouds on their atmosphere-mantle interfaces their phases and pressure-temperature conditions (§III.2), and their chemical composition (§III.3)).
III.1 Radiative feedback of clouds in sub-Neptune atmospheres

We use TOI-270 d (Gunther2019) as our primary case study because its atmospheric metallicity and C/O ratio have recently been constrained by JWST observations (benneke24), allowing for our cloudy and clear self-consistent models to be anchored against these empirical estimates. We assume a significantly metal enriched atmosphere with [M/H] and a C/O, consistent with the derived composition from those observations (benneke2024). We assume for the cloudy model, but also explore the effects of higher or lower sedimentation efficiencies in §III.1.1.
Figure 1 shows the difference in the atmospheric structure of TOI-270 d between a cloudy and a clear atmosphere model. The left panel of Figure 1 compares the profiles between the two cases. The condensation curves of the considered cloud species are also shown. The cloudy model has a colder profile between pressures bar but a much hotter profile for bar. We also find that the clear atmosphere model shows a deep radiative-convective boundary near bar pressure, whereas the radiative-convective boundary for the cloudy model extends to bar, which is three orders of magnitude shallower in pressure. However, the clear atmosphere model shows a detached convective region near 0.1 bar. This difference in the thermal structure between these two cases is driven by two effects: clouds reflecting incident stellar light to space, and clouds trapping the thermal radiation in the planet’s deep atmosphere. We explore the effect of these two processes in Appendix C.
The temperature difference () between these two models is shown in the middle panel of Figure 1. We find that clouds can heat up the atmosphere of TOI-270 d by about 1200 K near bar and cool their shallower atmospheres (near bar) by 600 K. This suggests that deep mineral clouds can cause additional condensation at higher altitudes of temperate sub-Neptune atmospheres. For example, this cooling effect near smaller pressures could lead to condensation in planets for which clear-atmosphere models do not predict it. We further discuss the impact of these clouds on the transmission spectra of temperate sub-Neptune TOI-270 d in §IV.2. The right panel of Figure 1 shows the mass mixing ratio profiles of the condensates. The maximum mass mixing ratios of condensates like Fe or can reach as high as 10% at pressures near bar due to elevated metallicities (solar here).
III.1.1 Role of cloud droplet settling efficiency

The settling rate of cloud droplets, parametrized in VIRGA as (§II), determines the vertical extent of the clouds and the depth to which their radiative effects propagate. This rate is poorly constrained in exoplanet atmospheres (Morley et al., 2024; Rooney et al., 2021; Gao et al., 2018). We explore five different values between 0.35 and 3, representing typical values used for Solar System planets and exoplanets (Gao et al., 2018). The left panel of Figure 2 compares the five different profiles from these cloudy models with a clear model for TOI-270 d. The middle panel shows the change in temperature in these cloudy atmospheres relative to the clear model, while the right panel shows the mass mixing ratio profiles of clouds. The mass mixing ratio profiles show that the cloud droplets extend to lower pressures for lower values. As decreases, the temperatures at smaller pressures become progressively colder relative to the clear model. On the other hand, the peak mass mixing ratio of clouds increases with decreasing . This causes the deep cloudy atmospheres to get increasingly hot relative to the clear atmosphere with decreasing .
The cloudy atmosphere with is hotter by K relative to the clear atmosphere at bar, whereas this heating only causes K temperature difference for . This suggests that if cloud particles settle very efficiently, then they should have little impact on the deep atmospheric structure and the atmosphere-mantle boundary. However, if the settling velocity of cloud droplets are low relative to the strength of vertical dynamics, they could have a dramatic effect on the deep atmospheric conditions and the atmosphere-mantle interface.
Recent observations of transiting exoplanets, directly imaged exoplanets, and brown dwarfs show that cloud droplets are lofted to low to very low pressures (Mukherjee2025; welbanks24; kiefer2026; Suárez and Metchev, 2022; Mukherjee et al., 2025; gao23). The measured from fitting the JWST spectra of several exoplanets have found values that are often smaller than 1 (e.g., inglis24; Mukherjee2025; kiefer2026; grant23). Additionally, sub-Neptune transmission spectra show strongly muted spectral features (gao23; brande24; wallack24; wallack2026) and their phase-curve measurements have revealed high albedos as well (kempton23). This suggests that the expected values in these atmospheres could be low rather than high. Therefore, we assume for the rest of this work as a nominal case.
III.1.2 Variation of cloud radiative feedback with metallicity

The cloud species we have considered are composed of elements other than H and He (e.g., , , ZnS, Fe), so the abundance of condensable species (and therefore the cloud reservoir) increases with atmospheric metallicity. Figure 3 shows how clouds impact the thermal structure of TOI-270 d relative to clear models at various atmospheric metallicities (for ). The left panel presents the clear profiles (dashed lines) and the cloudy profiles (solid lines) at various metallicities between 10 to 300solar. The middle panel shows the temperature differences between the cloudy and clear models at each metallicity and the right panel shows the cloud mass mixing ratio profiles.
The maximum cloud mass mixing ratio increases, as expected, with increasing metallicity from 1% at 10solar to 10% at 300solar. As a result, the heating caused by clouds in the deep atmosphere ( bar) increases with increasing metallicity. The temperature difference caused by clouds increases from about K at 10solar metallicity to about K at 300solar metallicity at bar owing to increasing cloud mass mixing ratio with increasing metallicity. The right panel in Figure 3 shows that the maximum mass mixing ratio of clouds shift from higher pressures to smaller pressures with increasing metallicity, which is also driven by the hotter deep atmospheres in higher metallicity cases. Therefore, this heating impact of clouds is likely much more important in the deep atmospheres of metal-rich planets (e.g., sub-Neptunes) compared to gas giants that are nominally expected to be less rich in metals (welbanks19).
III.1.3 Impact throughout the vs. space
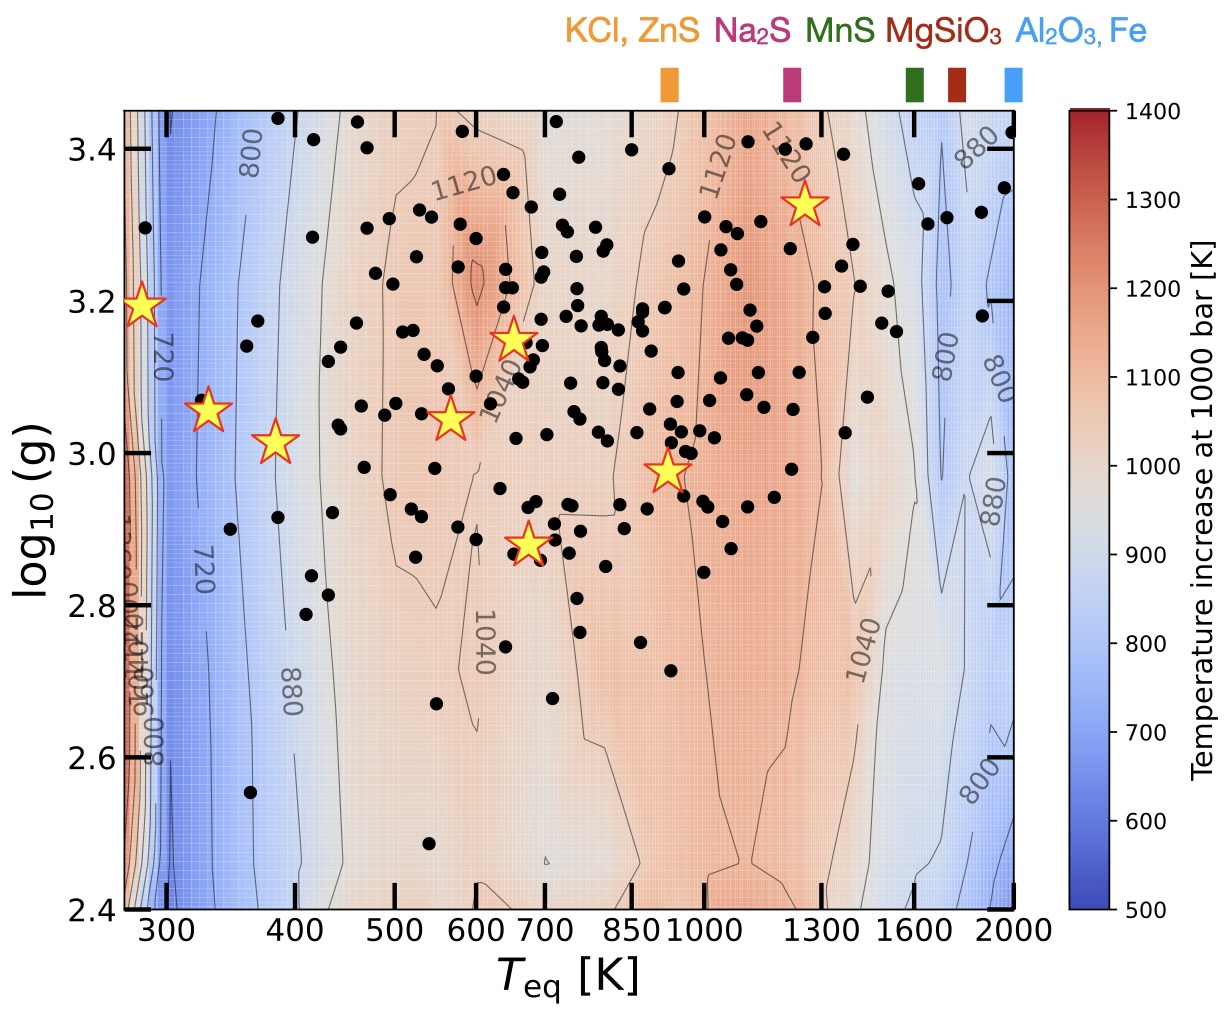
The above case study shows that clouds can profoundly impact the temperature at depth in sub-Neptune atmospheres. Here, we generalize this result by first exploring how the heating effects of clouds vary with planetary and gravity, followed by planet-specific analyses for representative, well studied planets. We generate a grid of clear models with K, varying from 250 K to 2000 K and planet gravity from 1.6 ms-2 to 30 ms-2. We adopt the stellar properties of TOI-270 and assume an atmospheric metallicity of 100Solar. We also compute a grid of cloudy models within this parameter space, assuming . The heat map in Figure 4 shows the temperature difference between the cloudy and clear models as a function of and at 1000 bar. The cloudy models are always K hotter than the clear models at this pressure.
The nearly vertical contours in Figure 4 show that this heating is sensitive to but not to the planet’s gravity. We find that lowering gravity makes both the clear and cloudy models hotter at deep pressures (e.g., 1000 bar), but by nearly the same amount. The dependance of the heating on is shaped by the onset of condensation of various clouds with lowering temperatures and subsequent sinking of those clouds in the atmosphere. The cloud species that dominates the heating at a given depends on , as changing gravity shifts the profile relative to the condensation curves. However, beyond K, the heating is generally driven by Al2O3 and Fe clouds. The temperature difference caused by clouds increases from about 800 K to 1100 K when decreases from 2000 K to 1200 K due to the onset of MgSiO3 and MnS condensation. This level of heating is maintained by Na2S, ZnS, and KCl clouds for 1200 K400 K. For 400 K, the cloud-driven temperature difference at 1000 bar decreases to 700 K owing to the sinking of these cloud decks to deeper pressures with colder temperatures.
The sample of transiting sub-Neptunes (1.74 R⊕) that have mass and radius uncertainties smaller than 25% are shown as black points in Figure 4. The impact of clouds at 1000 bar is substantial across the parameter space occupied by the sub-Neptune population. To explore how clouds impact the interior-mantle interface in sub-Neptunes, we pick a sample of 8 representative planets spanning this vs. space. We investigate the impact of clouds on the atmosphere-mantle interface for– K2-18 b (montet2015), TOI-270 d (Gunther19), TOI-421 b (carleo2020), TOI-824 b (burt2020), TOI-836 c (hawthorn2023), TOI-1231 b (Burt2021), GJ 9827 d (Niraula2017), and GJ 1214 b (charbonneau2009). This sample is identical to the one explored in breza25. The zero-albedo varies from 280 K to 1250 K within this sample. For TOI-824 b, and TOI-1231 b, we assume a solar metallicity due to lack of strong metallicity constraints. Maintaining consistency with recent JWST observations, we assume different metallicities for the other sub-Neptunes: K2-18 b (100solar, hu2025), TOI-270 d (200solar, benneke2024), TOI-421 b (0.1solar, davenport25), TOI-836 c (200solar, wallack24), GJ 9827 d (300solar, piaulet2024), and GJ 1214 b (300solar, kempton23; gao23).
III.2 Impact of clouds on the atmosphere-mantle interface
We couple our cloudy and clear atmosphere models with the SMILE interior structure model to investigate how these deep atmospheric clouds alter the pressure and temperature conditions at the atmosphere-mantle boundary. Our interior structure model considers a miscible mixture of , He, and , an assumption that has been examined in the literature (e.g., piaulet2025). We investigate the impact of clouds on three physical aspects of these boundaries: 1) the phase of the interface, 2) the pressure-temperature conditions at the interface, and 3) the chemical behavior at the interface.
III.2.1 The phase of the atmosphere-mantle interface

Figure 5 shows profiles of cloudy and clear atmospheres and the location of the atmosphere-mantle interface in the pressure-temperature space overlaid on the phase diagram for silicate. The cluster of these interfaces for TOI-270 d and TOI-1231 b are shown in the two panels of Figure 5. The red and blue points mark the interfaces for the clear and cloudy models of each planet, respectively. These are shown as a cluster of interfaces instead of a single and value due to varying envelope mass fractions () in our interior structure model. The interfaces for the other 6 planets in our sample are shown in Appendix A along with a zoomed-in view of the interfaces of TOI-1231 b.
Figure 5 shows that the atmosphere-mantle interface are expected to be in the molten phase for TOI-270 d in both the cloudy and clear cases. However, for TOI-1231 b, the cloudy models prefer a molten interface whereas the clear models are in the solid phase. This is because TOI-1231 b’s measured mass and radius are consistent with a relatively high , leading to interface pressures and temperatures high enough that the clear and cloudy models straddle the boundary between the molten and solid phases. Figure 9 in Appendix A show that the phase of the interfaces remain molten for K2-18 b, TOI-421 b, TOI-824 b, TOI-836 c, and GJ 9827 d in both the cloudy and clear cases. The atmosphere-mantle interface is in the molten phase-space for the cloudy models for GJ 1214 b, whereas they are near the solid state phase in the clear models. Like for TOI-1231 b, this is again due to the high values consistent with GJ 1214 b’s measured mass and radius. Our results suggest that cloud-driven changes in the conditions can have a strong impact on the phase of the interface for sub-Neptunes, especially those with high values of allowed .
III.2.2 Pressure–temperature conditions at the interface
For all sub-Neptunes in our sample except TOI-421 b, the atmosphere-mantle interface is pushed to substantially different and conditions in the cloudy planet models relative to the clear models. The cloudy atmospheres heat up the envelope to varying levels and move the atmosphere–mantle interface to hotter temperatures and lower pressures, with temperature differences of K between the cloudy and clear models. Figure 6 shows the interface temperature derived from cloudy and clear atmosphere models as a function of the envelope mass fraction () for K2-18 b, TOI-270 d, GJ-1214 b, and TOI-1231 b. For K2-18 b, the cloudy model has an interface temperature of about () 7600 K; that is 1843 K hotter than the clear model (5800 K). The interface temperature in the cloudy models show a stronger dependence on relative to the clear models. For TOI-270 d, the interface temperature in the cloudy model is hotter by K than the clear model. The interfaces for GJ 1214 b and TOI-1231 b are heated by K and K relative to the clear models, respectively. We show the interface conditions for the other four sub-Neptunes in Appendix B. TOI-824 b, TOI-836 c, and GJ 9827 d also show K cloud-driven temperature increase at their atmosphere-mantle interface among these four planets. The interface for TOI-421 b does not show any significant cloud-driven change in conditions owing to its low atmospheric metal-enrichment (Appendix B). This shows that the temperatures at the atmosphere-mantle interface can be significantly increased due to clouds, particularly in metal-enriched sub-Neptunes.
The pressure conditions at the interface are shown as colors of markers in each panel of Figure 6. Cloudy models have atmosphere-mantle interfaces at shallower pressures than clear atmosphere models. The difference in interface pressure ranges between 0.29 (in bar) (K2-18 b) to 0.06 (in bar) (TOI-824 b), except for TOI-421 b for which there is no difference in interface pressure between cloudy and clear models. The interface pressure also shows a weak dependence on , where it generally tends to increase with higher . However, the extent of this increase varies between planets in our sample. For example, the interface pressure in the clear models of K2-18 b increases by about 42% when increases from 0.052 to 0.083. The interface pressure in the cloudy models show about 46% increase when increases from 0.026 to 0.044. On the other hand, the increase in interface pressure for TOI-1231 b is about 16% both in the cloudy and clear models within the extent of allowed values. GJ 1214 b models show about 9% increase in interface pressure with increasing for both cloudy and clear cases. Table 1 summarizes the average interface properties across the 8 sub-Neptunes in our representative sample.

| Planet | M/H | [K] | [bar] | Phase | |||||
|---|---|---|---|---|---|---|---|---|---|
| ( Solar) | Clear | Cloudy | Clear | Cloudy | Clear | Cloudy | |||
| K2-18 b | 100 | 5836 | 7679 | 1843 | 5.56 | 5.27 | -0.29 | molten | molten |
| TOI-270 d | 200 | 5353 | 6870 | 1517 | 5.30 | 5.10 | -0.19 | molten | molten |
| TOI-421 b | 0.1 | 3064 | 3207 | 142 | 4.43 | 4.43 | 0 | molten | molten |
| TOI-824 b | 100 | 6804 | 8824 | 2019 | 5.59 | 5.52 | -0.06 | molten | molten |
| TOI-836 c | 200 | 6205 | 8552 | 2347 | 5.72 | 5.56 | -0.16 | molten | molten |
| TOI-1231 b | 100 | 8692 | 11085 | 2393 | 6.28 | 6.18 | -0.09 | solid | molten |
| GJ 9827 d | 300 | 5107 | 6531 | 1423 | 5.02 | 4.82 | -0.19 | molten | molten |
| GJ 1214 b | 300 | 7302 | 9891 | 2588 | 6.08 | 5.92 | -0.15 | solid/molten | molten |
III.3 Impact on atmosphere-mantle chemical interactions

We explore how increased temperature at the atmosphere-mantle boundary due to clouds may impact the composition at the base of the atmosphere using the global chemical equilibrium model described in Schlichting and Young (2022). We consider the planet TOI-270 d, a planet whose observed atmospheric composition (benneke24) has been suggested to be consistent with the outcome of magma-atmosphere interactions (Nixon2025). Hycean conditions for TOI-270 d have not been ruled out (holmberg24) but for our case study we assume the presence of a magma ocean. The global chemical equilibrium model becomes unreliable at temperatures exceeding 5000 K due to a lack of relevant experimental data; we therefore consider models with a metallicity of 50 solar for which both the clear and cloudy cases result in temperatures below 5000 K at the atmosphere-mantle boundary. All parameters other than the temperature at the atmosphere-mantle boundary are fixed to those used in Nixon2025. For the atmosphere-mantle boundary temperature, we consider two values: 3897 K, the mean boundary temperature recorded for cloud-free atmospheres of TOI-270 d, and 4842 K, the mean temperature for cloudy atmospheres.
The resulting compositions at the base of the atmosphere are shown as pie charts in Figure 7. The pie charts show the fraction of different gases excluding . The fraction of the ’th gas is computed by . is the abundance of the ’th gas. Both pie charts show the most dominant species at the interface other than is . This is followed by CO, SiO, Na, and Mg in decreasing order of abundance. Figure 7 also shows the change in the abundance of each gas between the cloudy and the clear model. We find a number of compositional trends with temperature: the abundances of , CO, , and all decrease in the cloudy model by % relative to the clear model. abundance shows a decrease of 1.3% in the cloudy model than the clear model. On the other hand, abundances of , Fe, Mg, SiO, Na and substantially increase in the cloudy model relative to the clear model. , , and SiO show the maximum increase of 36%, 44%, and 40%, respectively. Both Fe and Mg show 25% increase and Na increases by 11%. Overall, the increased temperature at the atmosphere-mantle boundary leads to the release of more oxygen and refractory species from the interior.
These models highlight that deep atmospheric mineral clouds may alter the composition of a sub-Neptune by changing the thermodynamic properties of the interface between the atmosphere and surface. However, the high boundary temperatures predicted by the atmospheric models largely lie above the range for which experimental data exists. Additional laboratory data at higher temperatures (e.g., Miozzi et al., 2025) are critical in order to better understand the relationship between sub-Neptune interiors and atmospheres.
IV Discussion
IV.1 Inhibited convection and moist adiabats
Mean molecular weight gradients due to condensation of mineral clouds can make convection inefficient in deep H-dominated atmospheres (Misener and Schlichting, 2022; Leconte2017; Guillot1994). This leads to the formation of radiative layers near the cloud base, allowing steeper temperature gradients than the adiabatic lapse rate to be stable against convection. We do not include this physical effect in our atmospheric or interior structure modeling but such radiative layers will only further increase the temperature at the atmosphere-mantle interface for the cloudy models relative to the clear models. Condensation can release latent heat as well, causing convective parts of atmosphere to follow moist adiabats instead of dry adiabats above the cloud base. While the effects of this latent heat release is almost negligible for near-solar composition gas giant planets (woitke2003), it can be more pronounced for metal-rich sub-Neptunes (Herbort2022) with more than 1 order of magnitude higher mass mixing ratios of clouds (e.g., Figure 3). Latent heat release may make the temperature gradient less steep than the dry adiabats considered in our work. This will lead to smaller atmosphere-mantle interface temperature differences between the cloudy and clear models than predicted in this work. Future work will be needed to quantify the impact of these two physical processes on our predictions.
IV.2 Impact on spectra

While we have focused on the profound impact of clouds on the physical conditions at the atmosphere-mantle interface, they also shape the spectra of these planets (e.g., lee2025). Figure 8 shows the impact of clouds on the transmission, emission, and reflected-light spectra of TOI-270 d for the clear atmosphere models and cloudy models with different . We note that our goal here is not necessarily to fit the observed transmission spectrum of TOI-270 d (e.g., benneke2024), but rather to explore how these clouds modify the spectrum across different observing geometries. A lower causes more muting in the transmission spectrum as cloud particles are lofted to smaller pressures. Lower values also change the chemical composition of gases like CH4, CO, and NH3 in the deeper atmosphere due to their heating effect. A hotter deep atmosphere due to lower causes a lower quenched CH4 abundance. As a result, a lower value causes smaller as well as more muted CH4 feature in the L-band in Figure 8. The lowest case also shows the silicate absorption feature between 8-10 m, detecting which with JWST will further test the presence of these lofted cloud droplets in the atmospheres of temperate sub-Neptunes like TOI-270 d.
Middle panel of Figure 8 shows lower clouds (0.5) suppress the thermal flux from TOI-270 d for wavelengths below m. The short-wavelength peaks of the emission spectrum disappear for these very cloudy atmospheres, making them emit more like blackbodies. The cloudier atmospheres are brighter than the clear atmospheres at certain long wavelength bands like -2.4 m and -4.2 m. Because transmission spectroscopy alone can be susceptible to the aerosol–mean molecular weight degeneracy, thermal-emission observations of sub-Neptunes at shorter wavelengths, when analyzed together with their transmission spectroscopy, can prove highly complementary for testing the presence of these predicted clouds and constraining their atmospheric properties.
Reflected-light spectra (bottom panel) show very large differences between these cases. The reflected light signal from the clear atmosphere drops from 1 ppm at wavelengths shorter than m to below ppm for wavelengths longer than m. But the reflected light from the lowest model () shows ppm level signals between 0.6 to 8 m with some molecular absorption bands. This suggests that eclipse spectroscopy of these sub-Neptunes, probing both their reflected and thermal light, can prove diagnostic of these deep clouds with upcoming telescopes like the Extremely Large Telescope, Nancy Grace Roman Telescope, and the Habitable Worlds Observatory.
IV.3 Patchiness of clouds
We do not consider spatially inhomogeneous clouds in our atmosphere models. However, recent JWST observations have provided a large volume of evidence that aerosol coverage for hot giant exoplanets can be patchy. This evidence has come in the form of large aerosol-driven limb asymmetries in transmission (e.g., Mukherjee2025; Fu2025) and phase-curve measurements (e.g., coulombe2025). These spatial variations are likely driven by temperature difference-driven diurnal cloud cycles (Mukherjee2025). But 3D models show that the temperature structure across the globe tend to become more homogeneous for colder exoplanets due to very long radiative-cooling timescales of their atmospheres (roth24). This suggests that the temperature-driven diurnal cloud cycles may be weaker in colder sub-Neptunes.
Our models show that clouds cause the radiative-convective boundary to move to smaller pressures relative to clear models. 3D and 1.5D models show that the day and night sides of exoplanets should be thermally homogeneous deeper than the radiative–convective boundary (lines19; gandhi2020). This suggests that these deep mineral clouds in sub-Neptunes are likely to be much more homogeneous across their day and night sides than in hot Jupiters, where they are formed near relatively smaller pressures. Therefore, our use of a homogeneous cloud-cover is justified in the deep atmosphere, but how these deep mineral clouds affect the circulation patterns in sub-Neptunes need to be further explored with 3D models (e.g., Charnay et al., 2021).
IV.4 Implications for thermal evolution
While several physical processes with potentially large impact on the radius evolution of sub-Neptunes have been identified (e.g., gupta2019; tang25; lopez14; vazan2018; steinmeyer2026), the thermal profile of the deep atmosphere remains a key factor that regulates their cooling rate and radius contraction over time. The clouds explored in this study make the atmospheres of these sub-Neptunes more opaque, likely diminishing their efficiency of losing their intrinsic heat. As a result, these clouds are expected to slow down the thermal evolution and radius contraction of these low mass planets. The adiabatic temperature of the atmosphere at 10 bars or has been used in the literature to compute the thermal evolution of irradiated or isolated substellar objects over time (e.g., Mukherjee2026; Morley et al., 2024; Saumon and Marley, 2008). For the TOI-270 d models shown in Figure 1, the adiabatic of the cloudy model is hotter by 330 K relative to the clear model. Using clear-atmosphere boundary conditions in thermal evolution models would therefore tend to overestimate the cooling rate of cloudy sub-Neptunes and underestimate the duration over which their atmosphere–mantle interfaces remain molten.
IV.5 Bias on intrinsic temperature
Another related implication of the cloud-driven deep atmospheric heating is a potential bias on the measured of sub-Neptunes. Quenching of gases like CH4, CO, and NH3 has been proposed as a way to measure the intrinsic heat of planets (e.g., Fortney et al., 2020; ohno23; mukherjee25). This technique has been used to estimate the intrinsic heat flux of a few giant exoplanets, Neptune-like exoplanets, and sub-Neptunes with JWST observations (welbanks24; sing24; barat2025; beatty2024). A key aspect of this technique is that it probes the temperature and pressure conditions of the atmosphere near the quench pressures of gases like CH4, CO, CO2, and NH3, which is driven by atmospheric vertical mixing. The interpretation of this condition as a measure of the interior heat flux characterized by is more complex. Figure 1 shows clouds might cause the deep atmosphere to be much warmer than clear models, even if both models have the same intrinsic heat flux or . This suggests that if Neptune-like or sub-Neptune planets like WASP-107 b, V1298 Tau b, GJ3470 b, or GJ436 b have such deep atmosphere clouds and we interpret their measured abundances with clear atmosphere models (e.g., RCPE models), we will tend to overestimate the of their interiors. This is because a clear atmosphere model will require a higher value to match the conditions at the CH4 quench point to model its observed abundance. This effect could at least partially cause the measured of several exoplanets to be much higher than expected from their thermal evolution models (yu2026). Alternatively, the obtained from clear self-consistent atmosphere models can be considered an upper limit.
IV.6 Limitations of modeling the deep interior
Several of our conclusions regarding the phase of silicates at the atmosphere-mantle boundary, as well as the chemical reactions taking place at that boundary, rely on our relatively limited understanding of material properties at very high pressures and temperatures. For example, this work incorporates MgSiO3 phase transitions from Ono and Oganov (2005) and Belonoshko et al. (2005) which have been employed in several internal structure models (Huang et al., 2022; breza25). However, other works have predicted different melting behavior of silicates at high pressure, suggesting that the mantle could remain molten at higher pressures (Fei et al., 2021). Additional experimental work to understand the material properties of planetary components at high pressures is essential in order to more accurately infer sub-Neptune structures.
Our interior-atmosphere exchange models assume a “reactive” core in which iron participates in the equilibrium chemistry, as opposed to an “unreactive” core which is isolated from interactions with the mantle and atmosphere. Schlichting and Young (2022) compared the resulting atmospheric composition from both cases and found some differences, including that CO abundances tend to exceed H2O abundances in the unreactive case, with this effect reversed in the reactive case. However, more recent work by Young et al. (2025) suggests that the cores and mantles of sub-Neptunes are likely to to be fully miscible, suggesting that the iron component of the planet is likely to participate in the equilibrium chemistry. For this reason, we adopted the reactive core throughout this work.
V Conclusions
Our work reveals several key findings about the impact of clouds on the atmosphere-mantle boundary of sub-Neptunes. Using a self-consistent cloudy climate model coupled to an interior-structure model and a magma-atmosphere chemistry framework, we find:
-
1.
Cloud-driven heating and cooling: We find that abundant mineral cloud formation with base pressures between 100-1000 bars might heat up the deep atmospheres of sub-Neptunes like TOI-270 d by K at 104 bar. These clouds, at the same time, can cool down the higher altitudes of the atmosphere by 600 K near 1 bar. Such optically thick clouds can have a large impact on the convective structure of the atmosphere of these planets, moving the radiative–convective boundary by several orders of magnitude in pressure.
-
2.
Impact of cloud sedimentation efficiency: The heating effect of clouds is a strong function of the sedimentation parameter , where lower values cause larger heating relative to a clear atmosphere. The heating can be as large as 2000 K at bar for in TOI-270 d. On the other hand, it can be as small as 250 K for .
-
3.
Role of atmospheric metallicity: Atmospheric metallicity controls the extent of mineral cloud formation and the heating resulting from their radiative feedback. The heating at bar can vary from K to K if TOI-270 d’s metallicity is increased from to solar.
-
4.
Effect of clouds on the atmosphere–mantle interface: The phase of the atmosphere-mantle interface remains molten for both the cloudy and clear models of most sub-Neptunes in our sample, except for TOI-1231 b and GJ 1214 b. For these two planets, the cloudy model prefers a molten boundary whereas the clear model are either in or extremely close to the solid phase region owing to high values required to explain their mass and radius.
-
5.
Quantifying cloud-driven heating of the interface: Clouds substantially raise the temperature at the atmosphere–mantle interface, by about – K relative to clear atmosphere models across various sub-Neptunes in our sample. TOI-421 b is the exception because of its lower metallicity.
-
6.
Impact on interface pressure: The pressure of the atmosphere-mantle boundary shows changes due to clouds too. The cloudy models generally show smaller interface pressures within 0.3 (in bar).
-
7.
Effect on interface chemistry: The cloud-driven change in conditions of the atmosphere-mantle interface causes large changes in the chemistry at this interface relative to clear models. Molecules like , , and SiO increase in abundance by in the cloudy model for TOI-270 d. Fe, Na, and Mg are also enhanced but by more moderate amounts. Molecules like , , , CO, and are depleted at the interface of the cloudy models by .
These results argue that deep mineral clouds should be included in climate models and their impact considered as part of the boundary conditions in coupled atmosphere-interior models of sub-Neptunes. The thermal profile of the deep atmosphere, the phase of the atmosphere-mantle interface, and the chemistry of any exchange between the atmosphere and mantle are all sensitive to the presence of clouds. Using clear atmosphere models in evolutionary and retrieval analysis may bias inferences on the intrinsic heat flux, interior structure, and atmospheric composition. Laboratory measurements at the high temperatures predicted by these cloudy models are needed to extend the present analysis to metal-rich sub-Neptunes. Overall, the scope of future modeling, observational, and experimental work on this population remains vast. A key priority would be to build a coupled atmosphere–interior model including cloud radiative feedback, which can in turn serve as the boundary condition for thermal evolutionary models of sub-Neptunes. The full complexity of this planet population can only be uncovered within such increasingly complex modeling frameworks.
SM formulated the idea for this research, performed the cloudy and clear climate simulations, contributed to necessary developments of the PICASO climate model, and led the preparation of this manuscript. MCN performed the interior structure modeling and the atmosphere-interior interface chemistry simulations. LW and MRL provided scientific feedback and mentorship throughout the project. JM, NFW, and NEB led several developments in the PICASO climate model needed for this work.
, SMILE (Nixon2021), Magma-atmosphere interaction model (Schlichting and Young, 2022)
Appendix A Phase of atmosphere-mantle boundary for other sub-Neptunes
Figure 9 show the profiles and atmosphere-mantle interfaces of K2-18 b, TOI-421 b, TOI-824 b, TOI-836 c, GJ-9827 d, and GJ-1214 b overlaid on the phase diagram for silicates (similar to Figure 5). The clear models are indicated in red and the cloudy models are indicated in blue. A zoomed-in view of the interface conditions for the cloudy and clear models of TOI-1231 b are shown in Figure 10. The clear models are consistent with a solid atmosphere-mantle interface, whereas the cloudy models are consistent with a molten interface.


Appendix B conditions of the atmosphere-mantle interface for other sub-Neptunes
Figure 11 show the and of the atmosphere-mantle interfaces for TOI-421 b, TOI-824 b, TOI-836 c, and GJ 9827 d (similar to Figure 6). These are the other sub-Neptunes in our sample that have not been shown in Figure 6. The interfaces for the cloudy and clear models overlap for TOI-421 b due to its low atmospheric metallicity.

Appendix C Effect of clouds on thermal structure of sub-Neptunes
Figure 12 shows the impact of clouds on TOI-270 d’s climate by comparing the layer-by-layer thermal flux, stellar flux, and intrinsic heat flux between the clear (left panel) and the cloudy (right panel) atmosphere models following Marley and Robinson (2015). The incident stellar flux is fully absorbed near 10 bar in the clear atmosphere. The planet’s thermal emission transfers its intrinsic heat flux between bar. The intrinsic flux is transferred convectively deeper than this pressure in the clear atmosphere. However, the incident stellar flux in the cloudy atmosphere is fully absorbed or reflected by the clouds near a much smaller pressure bar (or higher altitude). This causes the cloudy atmosphere to be colder than the clear atmosphere at pressures between bar & 30 bar. Thermal radiation carries the planet’s intrinsic heat flux between bar, but deeper than 1 bar convective flux dominates. This extended convective region in the cloudy model is caused by enhanced opacity in the deeper atmosphere due to the clouds. We use wavelength-dependent optical properties of these clouds from the literature: from Scott and Duley (1996), Fe from palik1991, from koike95; begemann1997, from khachai2009; montaner1979, KCl from Querry (1987), MnS from montaner1979; huffman1967, and ZnS from Querry (1987).

References
- Ocean Planet or Thick Atmosphere: On the Mass-Radius Relationship for Solid Exoplanets with Massive Atmospheres. ApJ 673 (2), pp. 1160–1164. External Links: Document, 0710.4941 Cited by: §I.
- Treatment of overlapping gaseous absorption with the correlated-k method in hot Jupiter and brown dwarf atmosphere models. A&A 598, pp. A97. External Links: Document, 1610.01389 Cited by: §II.1.
- The HD 40307 Planetary System: Super-Earths or Mini-Neptunes?. ApJ 695 (2), pp. 1006–1011. External Links: Document, 0901.1698 Cited by: §I.
- Exoplanet Reflected-light Spectroscopy with PICASO. ApJ 878 (1), pp. 70. External Links: Document, 1904.09355 Cited by: Impact of Clouds on the Atmosphere-Mantle Interface of Sub-Neptunes, §II.1.
- Condensation Clouds in Substellar Atmospheres with Virga. arXiv e-prints, pp. arXiv:2508.15102. External Links: Document, 2508.15102 Cited by: Impact of Clouds on the Atmosphere-Mantle Interface of Sub-Neptunes, §II.2.
- High-Pressure Melting of MgSiO. Phys. Rev. Lett. 94 (19), pp. 195701. External Links: Document Cited by: §IV.6.
- Formation and dynamics of water clouds on temperate sub-Neptunes: the example of K2-18b. A&A 646, pp. A171. External Links: Document, 2011.11553 Cited by: §I, §IV.3.
- Searching for hot water world candidates with CHEOPS: Refining the radii and analysing the internal structures and atmospheric lifetimes of TOI-238 b and TOI-1685 b. A&A 696, pp. A28. External Links: Document, 2502.07887 Cited by: §II.3.
- Melting and density of MgSiO determined by shock compression of bridgmanite to 1254GPa. Nature Communications 12, pp. 876. External Links: Document Cited by: §IV.6.
- Beyond Equilibrium Temperature: How the Atmosphere/Interior Connection Affects the Onset of Methane, Ammonia, and Clouds in Warm Transiting Giant Planets. AJ 160 (6), pp. 288. External Links: Document, 2010.00146 Cited by: §I, §II.1, §IV.5.
- The False Positive Rate of Kepler and the Occurrence of Planets. ApJ 766 (2), pp. 81. External Links: Document, 1301.0842 Cited by: §I.
- The Interior Dynamics of Water Planets. ApJ 708 (2), pp. 1326–1334. External Links: Document, 1001.2890 Cited by: §I.
- The California-Kepler Survey. III. A Gap in the Radius Distribution of Small Planets. AJ 154 (3), pp. 109. External Links: Document, 1703.10375 Cited by: §I.
- Microphysics of KCl and ZnS Clouds on GJ 1214 b. ApJ 863 (2), pp. 165. External Links: Document, 1807.04924 Cited by: §I, §I.
- Sedimentation Efficiency of Condensation Clouds in Substellar Atmospheres. ApJ 855 (2), pp. 86. External Links: Document, 1802.06241 Cited by: §III.1.1.
- Energy conversion processes in the outer planets.. In Recent Advances in Planetary Meteorology, G. E. Hunt (Ed.), pp. 121–146. Cited by: §II.1.
- Silane─methane competition in sub-Neptune atmospheres as a diagnostic of metallicity and magma oceans. MNRAS 546 (2), pp. stag133. External Links: Document, 2508.19235 Cited by: §I.
- Building Wet Planets through High-Pressure Magma-Hydrogen Reactions. arXiv e-prints, pp. arXiv:2511.06507. External Links: Document, 2511.06507 Cited by: §I.
- Planet Occurrence within 0.25 AU of Solar-type Stars from Kepler. ApJS 201 (2), pp. 15. External Links: Document, 1103.2541 Cited by: §I.
- MAGRATHEA: an open-source spherical symmetric planet interior structure code. MNRAS 513 (4), pp. 5256–5269. External Links: Document, 2201.03094 Cited by: §IV.6.
- Toward High-precision Mass Measurements of Two Sub-Neptunes in the K2-266 Planetary System Through Transit Timing. AJ 169 (5), pp. 243. External Links: Document, 2503.08905 Cited by: §I.
- Superabundance of Exoplanet Sub-Neptunes Explained by Fugacity Crisis. ApJ 887 (2), pp. L33. External Links: Document, 1912.02701 Cited by: §I, §II.4.
- Atmosphere Origins for Exoplanet Sub-Neptunes. ApJ 891 (2), pp. 111. External Links: Document, 2001.09269 Cited by: §I, §I.
- Clouds in the atmosphere of the super-Earth exoplanet GJ1214b. Nature 505 (7481), pp. 69–72. External Links: Document, 1401.0022 Cited by: §I.
- Volatile-rich Earth-Mass Planets in the Habitable Zone. ApJ 596 (1), pp. L105–L108. External Links: Document, astro-ph/0303186 Cited by: §I.
- Soot Planets Instead of Water Worlds. ApJ 997 (1), pp. L29. External Links: Document, 2508.16781 Cited by: §I.
- Carbon-rich Sub-Neptune Interiors Are Compatible with JWST Observations. ApJ 990 (2), pp. L35. External Links: Document, 2508.15117 Cited by: §I.
- A young progenitor for the most common planetary systems in the Galaxy. Nature 649 (8096), pp. 310–314. External Links: Document, 2601.10598 Cited by: §I.
- Precise mass determination for the keystone sub-Neptune planet transiting the mid-type M dwarf G 9-40. A&A 666, pp. A154. External Links: Document, 2208.07287 Cited by: §I.
- PICASO 4.0: Clouds and Photochemistry in Climate Models of Brown Dwarfs and Exoplanets. arXiv e-prints, pp. arXiv:2602.22468. External Links: Document, 2602.22468 Cited by: Impact of Clouds on the Atmosphere-Mantle Interface of Sub-Neptunes, §II.1, §II.2.
- Convective inhibition with an ocean. I. Supercritical cores on sub-Neptunes/super-Earths. A&A 665, pp. A12. External Links: Document, 2207.04708 Cited by: §I.
- On the Cool Side: Modeling the Atmospheres of Brown Dwarfs and Giant Planets. 53, pp. 279–323. External Links: Document, 1410.6512 Cited by: Appendix C.
- The Atmospheric Signatures of Super-Earths: How to Distinguish Between Hydrogen-Rich and Hydrogen-Poor Atmospheres. ApJ 690 (2), pp. 1056–1067. External Links: Document, 0808.1902 Cited by: §I.
- Experiments reveal extreme water generation during planet formation. Nature 648 (8094), pp. 551–555. External Links: Document, 2511.01351 Cited by: §III.3.
- Atmospheres as windows into sub-Neptune interiors: coupled chemistry and structure of hydrogen-silane-water envelopes. MNRAS 524 (1), pp. 981–992. External Links: Document, 2303.09653 Cited by: §I.
- The importance of silicate vapour in determining the structure, radii, and envelope mass fractions of sub-Neptunes. MNRAS 514 (4), pp. 6025–6037. External Links: Document, 2201.04299 Cited by: §I, §IV.1.
- The Sonora Substellar Atmosphere Models. III. Diamondback: Atmospheric Properties, Spectra, and Evolution for Warm Cloudy Substellar Objects. arXiv e-prints, pp. arXiv:2402.00758. External Links: Document, 2402.00758 Cited by: §II.1, §II.2, §III.1.1, §IV.4.
- PICASO 3.0: A One-dimensional Climate Model for Giant Planets and Brown Dwarfs. ApJ 942 (2), pp. 71. External Links: Document, 2208.07836 Cited by: Impact of Clouds on the Atmosphere-Mantle Interface of Sub-Neptunes, §II.1.
- Probing the Extent of Vertical Mixing in Brown Dwarf Atmospheres with Disequilibrium Chemistry. ApJ 938 (2), pp. 107. External Links: Document, 2208.14317 Cited by: §I.
- A JWST Panchromatic Thermal Emission Spectrum of the Warm Neptune Archetype GJ 436b. ApJ 982 (2), pp. L39. External Links: Document, 2502.17418 Cited by: §III.1.1.
- New Insights into the Internal Structure of GJ 1214 b Informed by JWST. ApJ 970 (2), pp. L28. External Links: Document, 2407.12079 Cited by: §II.3.
- In situ observations of phase transition between perovskite and CaIrO -type phase in MgSiO and pyrolitic mantle composition. Earth and Planetary Science Letters 236 (3-4), pp. 914–932. External Links: Document Cited by: §IV.6.
- Optical constants of minerals and other materials from the millimeter to the ultraviolet. Chemical Research, Development & Engineering Center, US Army Armament …. Cited by: Appendix C.
- The surface and interior conditions of temperate sub-Neptune TOI-270 d. MNRAS 545 (1), pp. staf1969. External Links: Document, 2511.16722 Cited by: §II.3.
- A Framework for Quantifying the Degeneracies of Exoplanet Interior Compositions. ApJ 712 (2), pp. 974–991. External Links: Document, 0912.3288 Cited by: §I.
- Three Possible Origins for the Gas Layer on GJ 1214b. ApJ 716 (2), pp. 1208–1216. External Links: Document, 0912.3243 Cited by: §I.
- Most 1.6 Earth-radius Planets are Not Rocky. ApJ 801 (1), pp. 41. External Links: Document, 1407.4457 Cited by: §I.
- A New Sedimentation Model for Greater Cloud Diversity in Giant Exoplanets and Brown Dwarfs. arXiv e-prints, pp. arXiv:2110.05903. External Links: 2110.05903 Cited by: Impact of Clouds on the Atmosphere-Mantle Interface of Sub-Neptunes, §II.2, §III.1.1.
- The California Legacy Survey. I. A Catalog of 178 Planets from Precision Radial Velocity Monitoring of 719 Nearby Stars over Three Decades. ApJS 255 (1), pp. 8. External Links: Document, 2105.11583 Cited by: §I.
- The Evolution of L and T Dwarfs in Color-Magnitude Diagrams. ApJ 689 (2), pp. 1327–1344. External Links: Document, 0808.2611 Cited by: §IV.4.
- Predictions of the Atmospheric Composition of GJ 1132b. ApJ 829 (2), pp. 63. External Links: Document, 1607.03906 Cited by: §II.4.
- Chemical Equilibrium between Cores, Mantles, and Atmospheres of Super-Earths and Sub-Neptunes and Implications for Their Compositions, Interiors, and Evolution. \psj 3 (5), pp. 127. External Links: Document, 2107.10405 Cited by: §I, §II.4, §II.4, §III.3, §IV.6, §V.
- Ultraviolet and Infrared Refractive Indices of Amorphous Silicates. ApJS 105, pp. 401. External Links: Document Cited by: Appendix C.
- Ultracool Dwarfs Observed with the Spitzer Infrared Spectrograph. II. Emergence and Sedimentation of Silicate Clouds in L Dwarfs, and Analysis of the Full M5–T9 Field Dwarf Spectroscopic Sample. arXiv e-prints, pp. arXiv:2205.00168. External Links: 2205.00168 Cited by: §III.1.1.
- The TESS-Keck Survey. XI. Mass Measurements for Four Transiting Sub-Neptunes Orbiting K Dwarf TOI-1246. AJ 163 (6), pp. 293. External Links: Document, 2204.11895 Cited by: §I.
- Atmospheric Chemistry in Giant Planets, Brown Dwarfs, and Low-Mass Dwarf Stars. II. Sulfur and Phosphorus. ApJ 648 (2), pp. 1181–1195. External Links: Document, astro-ph/0511136 Cited by: §II.2.
- Atmospheric Chemistry in Giant Planets, Brown Dwarfs, and Low-mass Dwarf Stars. III. Iron, Magnesium, and Silicon. ApJ 716 (2), pp. 1060–1075. External Links: Document, 1001.3639 Cited by: §II.2.
- Aurora: A Generalized Retrieval Framework for Exoplanetary Transmission Spectra. ApJ 913 (2), pp. 114. External Links: Document, 2103.08600 Cited by: §II.2.
- Differentiation, the Exception, Not the Rule: Evidence for Full Miscibility in Sub-Neptune Interiors. \psj 6 (11), pp. 251. External Links: Document, 2507.00947 Cited by: §IV.6.
- Growth model interpretation of planet size distribution. Proceedings of the National Academy of Science 116 (20), pp. 9723–9728. External Links: Document, 1906.04253 Cited by: §I.
- Global-mean Vertical Tracer Mixing in Planetary Atmospheres. I. Theory and Fast-rotating Planets. ApJ 866 (1), pp. 1. External Links: Document, 1803.09149 Cited by: §I.
