Nowhere Left to Hide: Uncovering All of the Massive Young Embedded Star Clusters in the Antennae with JWST111This work is based on observations made with the NASA/ESA/CSA James Webb Space Telescope. The data were obtained from the Mikulski Archive for Space Telescopes at the Space Telescope Science Institute, which is operated by the Association of Universities for Research in Astronomy, Inc., under NASA contract NAS 5-03127 for JWST. These observations are associated with program #2581.
Abstract
The Antennae galaxies merger produces the brightest infrared emission of any galaxy within Mpc, mostly from intense star formation taking place in supergiant molecular cloud complexes in the overlap region. Here, we present new, high-resolution NIRCam and MIRI images of the Antennae galaxies taken with the F150W, F187N, F335M, F360M, F410M, and F770W filters on JWST to search for the predicted but as-yet-undiscovered population of deeply embedded, optically obscured star clusters. We identify a population of 45 sources, 40 previously unknown, with high Br and Pa flux ratios which are likely very young clusters still embedded or just emerging from their natal cocoons, and estimate their age, extinction (AV), and mass. We find that all are extremely young ( Myr), have AV between 2 and 10 mag, and masses between and several. We believe we have now uncovered all clusters with and A mag in the Antennae. While our sample represents a small fraction(%) of clusters younger than 3 Myr by number, it dominates the ionizing photon luminosity across the galaxy pair (%). We find elevated HPAH ratios of the ISM surrounding the most massive pair of embedded clusters, supporting the idea that merger-induced shock-heated gas play an important role in the formation of extremely massive clusters.
I Introduction
The likely progenitors of globular star clusters (GCs) forming just Gyr after the Big Bang have recently been discovered in James Webb Space Telescope (JWST) images of high redshift galaxies (e.g., Mowla et al., 2022; Vanzella et al., 2022; Claeyssens et al., 2023; Vanzella et al., 2023; Senchyna et al., 2024; Adamo et al., 2024; Messa et al., 2024). This direct new evidence of massive cluster formation so early in cosmic history underscores the importance of understanding the physical processes that drive massive cluster formation and early evolution. In several systems, the estimated cluster masses are extremely high, reaching (Vanzella et al., 2022, 2023; Adamo et al., 2024). Several of the parent galaxies show tidal features and morphological evidence of interactions, indications that processes commonly found in galaxy collisions almost certainly drive massive cluster formation (e.g., Whitaker et al., 2025). Because observations are currently limited to the high-mass end, the initial mass function of globular clusters has not yet been measured directly.
The shape of the initial cluster mass function is a fundamental diagnostic of the star formation process on galaxy scales. Globular cluster masses reach in Milky-Way mass galaxies and have a steepening or cutoff at the high end (e.g., Goudfrooij et al., 2003; Peng et al., 2010; Goudfrooij and Fall, 2016; De Lucia et al., 2024), which could either result from billions of years of evolution or have been imprinted at birth (e.g., Fall and Rees, 1977; Capriotti and Hawley, 1996; Kavelaars and Hanes, 1997; Fall and Zhang, 2001; Elmegreen, 2010). If imprinted at birth, such a cutoff would indicate a physical limit to the mass with which clusters can form. Unfortunately, the intense star formation needed to create such massive clusters is mostly taking place in luminous infrared galaxies that are dust-obscured, distant, or both (e.g., Adamo et al., 2020; Linden et al., 2023). As the closest system forming clusters with masses , the merging Antennae galaxies are ideal to assess the shape of the initial cluster mass function.
The overlap region in the Antennae, where the two progenitor spiral galaxies are merging together and recent star formation is driving strong infrared emission (the strongest observed in any galaxy within Mpc), is the closest system where extremely massive () clusters are forming. This region has intense star formation, a vast reservoir of cold gas organized into super giant molecular cloud complexes (Gao et al., 2001; Wilson et al., 2003), and many radio sources (Neff and Ulvestad, 2000). Velocity maps from ALMA/CO indicate that cloud-cloud collisions may play an important role in triggering the formation of massive clusters (Tsuge et al., 2021). A color image of the Antennae constructed from BVIH filters taken by the Hubble Space Telescope (HST) is shown in the left panel of Figure 1. A number of very young, recently formed clusters are observed by their H emission (which makes them look pink) in the overlap region, but most of the area is dark because it is obscured by large amounts of dust. The high dust obscuration in the overlap region (Mirabel et al., 1998) and in other LIRGs suggests that optically-based studies may be largely incomplete, and may miss as much as % of the recently formed ( Myr) cluster population (e.g., Linden et al., 2023). While extremely massive clusters are forming in other dusty, merger-driven (U)LIRGs, most of these systems are much further away and the massive clusters tend to be significantly older (e.g., Arp 220, Chandar et al. 2023; NGC 7252, Miller et al. 1997; NGC 34 Schweizer and Seitzer 2007).
Our current understanding of the recent star and cluster formation histories in the Antennae relies mostly on optical studies with the Hubble Space Telescope (e.g., Whitmore et al., 1999; Fall and Zhang, 2001; Fall et al., 2005; Whitmore et al., 2010), and predictions from high resolution (parsec-scale) hydrodynamical simulations of galaxy mergers (Renaud et al., 2015; Li et al., 2017). A number of works have concluded that most of the active star formation in the Antennae is embedded in thick layers of dust with high extinction mag, and is therefore invisible at optical (and possibly) near-infrared wavelengths (e.g., Kunze et al., 1996; Mirabel et al., 1998; Neff and Ulvestad, 2000). If this is confirmed, current conclusions are based on an incomplete census of star clusters and may need to be revised. On the other hand, Whitmore and Zhang (2002) concluded that most (%) recently formed massive clusters have extinction values A mag and should be detected at optical wavelengths, at least in the I band.
The source WS80 is the best-known example of the embedded clusters we are searching for. It is the most massive (), recently formed, highly extinguished cluster known in the Antennae (Herrera and Boulanger, 2017). WS80 is the brightest source of thermal bremsstrahlung radiation at radio wavelengths in the Antennae, but is barely visible in a deep V-band HST image. If the mass function of very young ( Myr) clusters in the Antennae follows a power law with index as found for the cluster population younger than 10 Myr (Fall and Zhang, 2001), there should be on the order of WS80-like clusters with high extinction and masses greater than few forming in the overlap region, although very few such clusters have been discovered to date. The main goal of this paper is to use new infrared images taken with the JWST of the merging Antennae galaxies to search for the predicted but as-yet-undiscovered population of deeply embedded/optically obscured massive () clusters and to estimate their basic properties, i.e. age, extinction (AV), and mass. In a future work, newly discovered embedded sources will be combined with optically-selected ones to create a complete census of obscuredunobscured clusters. We adopt a distance of 21.5 Mpc (distance modulus of = 31.66; Riess et al. 2011) to the Antennae, which gives a physical scale of pc per arsecond.
The rest of this paper is organized as follows. The new JWST observations and basic reduction are presented in Section 2, along with color images of the Antennae created from different optical-infrared filter combinations. In Section 3 we use maps of BrH and PaH flux ratios to select a new catalog of embedded cluster candidates in the Antennae, and in Section 4 we estimate the age, extinction, and mass for each cluster. Section 5 estimates the reddening and mass ranges of clusters that might still be missed in the JWST observations, determines the distribution of embedded cluster masses, and examines the local environment of the two most massive clusters to constrain formation mechanisms. We summarize the main results and discuss future plans in Section 6. The Appendix investigates the infrared emission from bright 6 cm sources from the Neff and Ulvestad (2000) catalog.
II Observations of the Antennae

II.1 New JWST Images
| Instrument | Filter | # exposures | Total Exposure | Proposal | VEGAMAG |
|---|---|---|---|---|---|
| Camera | Name | Time (sec) | ID | zeropoint1 | |
| HST/WFC3 | F275W (NUV) | 3 | 2610 | 14593 | 22.64 mag |
| HST/WFC3 | F336W (U) | 5 | 5534 | 11577 | 23.526 mag |
| HST/ACS | F435W (B) | 3 | 1320 | 10188 | 25.766 mag |
| HST/WFC3 | F555W (V) | 2 | 1032 | 11577 | 25.843 mag |
| HST/ACS | F658N (H) | 4 | 2300 | 10188 | 22.390 mag |
| HST/WFC3 | F814W (I) | 2 | 1032 | 11577 | 25.520 mag |
| JWST/NIRCam | F150W | 24 | 7472 | 2581 | 1192.64 Jy |
| JWST/NIRCam | F187N (Pa) | 12 | 3736 | 2581 | 779.34 Jy |
| JWST/NIRCam | F335M (3.3m PAH) | 12 | 3736 | 2581 | 300.24 Jy |
| JWST/NIRCam | F360M | 12 | 3736 | 2581 | 262.24 Jy |
| JWST/NIRCam | F410M (Br) | 12 | 3736 | 2581 | 208.45 Jy |
| JWST/MIRI | F770W (7.7m PAH) | 4 | 244 | 2581 | … |
Images of the Antennae galaxies were taken by JWST as part of program GO-2581 (PI: R. Chandar) in June 2023 using the F150W, F187N, F335M, F360M, F410M filters on NIRCam and the F770M filter on MIRI. These filters cover stellar and dust continuum emission (F150W, F360M), hydrogen emission lines (Pa at 1.87m and Br at 4.1m), and PAH features (3.3m and 7.7 m). Basic information about the observations, including the number of dithered exposures and total photon collection time for each filter, are compiled in Table 1. All photometry in this work is in the VEGAMAG system.
With NIRCam, we use Module B, the FULL subarray, and an INTRAMODULEBOX primary dither pattern with 4 positions. At each primary dither position, we take three exposures using a “small-grid” sub-pixel dither pattern for a total of 12 exposures and 3736 seconds of photon collection time in the F187N, F335M, F360M, and F410M filters. The F150W filter was observed twice in this configuration so has 24 exposures and a total photon collection time of 7472 seconds. The SHALLOW4 readout pattern with one integration per exposure was used for all NIRCam observations. For our MIRI F770W observations, we use a 4-point dither and the FASTR1 readout pattern yielding a total photon collection time of 244 sec.
We start with the uncalibrated raw (“uncal”) files obtained from MAST and use Detector1Pipeline, which converts from “ramps” to “slopes” and applies basic detector-level corrections to the data, including flagging saturated pixels and correcting for chip persistence. We ran the Detector1Pipeline with the default parameters for most steps, except for the ramp_fitting step for which we used suppress_one_group = False to avoid hard saturation for the brightest objects in the field. Stage 2 of the pipeline produces calibrated individual exposures. During this stage, the pixel coordinates are translated into WCS coordinates, which includes a correction for geometric distortion. This stage also includes flat-fielding and background subtraction (the latter was only performed for the MIRI data).
Before combining the individual exposures, the individual, flatfielded NIRCam images are run through an algorithm which minimizes the effect of electronic 1/ noise. This algorithm, which is publicly available and described in JWST documentation, masks pixels that have intensities above the background, takes the median value of non-masked pixels in each line in the slow readout direction and adjusts the level of each of those lines by subtracting the difference between those line medians and the overall median level of non-masked pixels. Stage 3 combines individual tiles to produce a final, geometrically rectified mosaic of the Antennae in units of surface brightness (MJy/sr). The final redrizzling step produces mosaics oriented with north pointing up and east to the left.
The standard mosaics produced by the Level-3 pipeline have good relative alignment between NIRCam tiles, but the alignment of the JWST images relative to other data with well-established absolute astrometry tends to be poorer, with offsets as large as in some cases. Furthermore, there were non-negligible offsets in pixel space between the Level-3 products of the different filters. For our final Stage-3 processing, we therefore performed additional corrections to improve the relative and absolute astrometry of the NIRCam and MIRI images using the tweakreg step of the pipeline. These corrections included: (i) creating a single reference star catalog to align all individual exposures, (ii) measuring “true” sky levels from custom sky regions; this was only important for the short-wavelength F150W and F187N filters where the 4 individual detectors sample different regions within the full field-of-view. For this purpose, we use relative sky levels measured in the long-wavelength F360M image as a reference; (iii) matching the sky coordinates in the catalog to the Gaia DR3 reference frame, (iv) drizzling all Stage-3 products to a common celestial position for the reference pixel, and (v) adopting a common pixel scale and image size across all Stage-3 products. The final pixel scale of the images is 0031 pix-1.
II.2 Archival HST Images
The Antennae galaxies have been imaged by HST through several different programs over the years. In this work, we include archival observations in both broad- and narrow-band filters covering the near-ultraviolet and optical. We use observations taken with the WFC3/UVIS camera in the F275W/NUV (GO-14593, PI: N. Bastian), F336W/U, F555W/V, and F814W/I (GO-11577, PI: B. Whitmore) filters, and with the ACS/WFC camera in the F435W/B, and F658N/H filters (GO-10188; PI: B. Whitmore). Details of the HST observations, including the Proposal ID, number of exposures and total exposure time, are compiled in Table 1.
Individual exposures are processed through the standard CALACS or CALWFC3 software, which performs initial data quality flagging, bias subtraction, gain correction, bias stripe removal, correction for CTE losses, dark current subtraction, flat-fielding and photometric calibration. These individual files are aligned and drizzled to the common grid to create a single image per filter in counts sec-1 using the DRIZZLEPAC software package. The WFC3 (ACS) images have a pixel scale of 004 pix-1 (005 pix-1) and are used for producing spectral energy distributions.
II.3 Flux-Calibrated, Continuum-Subtracted Maps
The narrow-band images contain both starlight and recombination line emission from ionized gas, and trace the locations of very recently formed massive stars and clusters. Because the optical light from the very youngest of these clusters is heavily extinguished because they are still embedded in their natal gas and dust, hydrogen recombination lines in the infrared (such as Pa and Br) are well-suited to identify these young dusty objects. The m Br line in particular is near the minimum in the Galactic extinction curve (Gordon et al., 2023).
We produce maps of hydrogen recombination lines by subtracting the stellar continuum from the narrow- and medium-band filters: F658N (H), F187N (Pa), and F410M (Br). For Pa, we estimate the continuum level by interpolating between the F150W and F360M images (using a first degree polynomial fit) to the central wavelength of the F187N filter. We then use several isolated, non-saturated, stars and intermediate-age clusters in the Antennae to determine the scale factor () between our interpolated continuum image and the F187N linecontinuum image. These sources do not have nebular or dust emission, so should give a good measure of the stellar continuum in all filters. For the F410M filter we adopt the nearby F360M image as our ‘continuum’ and scale it based on the same line-free sources described above. This filter is the closest one in wavelength that does not contain significant contributions from dust or recombination line emission. To create H line maps we adopt a scaled (by a factor of 0.64) F814W filter as the continuum and subtract this from the F658N image. All continuum-subtracted images are in physical flux density units of erg s. These continuum-subtracted H, Pa, and Br maps will be used to search for recently formed, embedded clusters.
II.4 Spitzer Mid-Infrared Spectroscopy
Most of the Antennae, including the interaction region, was observed by the Infrared Spectrograph (IRS) on Spitzer as part of program 21 (PI: J.R. Houck). The observations span the wavelength range 5.2 - 14.7m with a scale of and from 14.2 - m at . Previously, Brandl et al. (2009) extracted and analyzed the spectra for 6 bright infrared peaks and the two galactic nuclei from these observations.
Spitzer/IRS data cubes are created as part of a uniform reduction of all low spectral resolution IRS mapping programs, which includes hundreds of galaxies, by the Spitzer/IRS Mapping Legacy Archive (SIMLA) project (Donnelly et al., 2025). The SIMLA pipeline leveraged off-source observations from the entire IRS archive to create custom backgrounds for each spectral map, resulting in significantly reduced noise in the extracted spectra. In this work, we measure the HPAH ratio from the Spitzer spectra in a few special locations in the Antennae, and leave a more detailed investigation of the full region and rich spectral features to a future work.
II.5 An Infrared View of Optically-Dark Regions

Figure 1 contrasts the Antennae in optical (left panel) and infrared light (right panel). The north and south nuclei, partially intact northern disk, and dusty overlap region (the region to the east between the two galaxy nuclei) are all clearly seen in the optical filter combination of B, V, IH displayed in the left panel. This filter combination highlights the dark dust lanes found throughout the Antennae, particularly in the overlap region, where some areas appear fully dark with little H emission from recently formed star-clusters. The infrared (F150W, Pa, F360M) filter combination in the right panel minimizes this obscuration and reveals sites where star formation is (and is not) taking place. With the new JWST images we can essentially see all of massive clusters forming in the Antennae.
In Figure 2 we show different combinations of JWSTHST filters to highlight different aspects of this iconic system.
-
•
Top-left: This image combines the continuum-subtracted H (blue), Pa (green), and Br (red) maps to highlight warm ionized gas. For the most part, this emission traces natal gas ionized by massive stars within recently formed star clusters. Warm ionized gas is observed throughout the Antennae, from the northern disk, throughout the overlap region and near the southern nucleus. The gas shows a range of colors, indicating a range of extinction, with the most highly extinguished regions found mostly in the overlap region. The latter appear yellow since they are dominated by Pa emission and their inferred extinctions lie between 4.5 and 15 mag.
-
•
Top-right: An image of 3.3 m emitting dust grains replaces the continuum-subtracted Pa image from the top-left panel (in green). Most of the green in this image, where the 3.3m PAH emission dominates over H and Br, is diffuse and extends away from regions of ionized gas. Strong 3.3m emission is also co-spatial with many (but not all) shells and bubbles around HII regions, as also observed in a sample of PHANGS galaxies (Rodríguez et al., 2025). We will study the association between PAH emission and young stellar clusters in the Antennae in an upcoming paper.
-
•
Bottom-left: This color composite is created from the V (blue), H (green), and 7.7m PAH band images. Like the previous image, there is a significant amount of diffusely distributed PAH emission, now seen in red. This image also reveals an interesting ’bubble’ in the northern disk, where the 7.7m emission appears to fall just outside of an H shell. This bubble is reminiscent of the ’Phantom Void’, a large, feedback-driven kpc-scale bubble observed in PAH emission in the spiral galaxy NGC 628 (Barnes et al., 2023).
-
•
Bottom-right: The combination of the V band (blue), F150W (green), and continuum-subtracted Pa (red) filters highlights differences in the warm ionized gas properties in the northern disk, which are a dark pink color, with those in the overlap region which are more of an orange-red due to their higher extinction. Many blue, slightly older (by a few Myr) clusters are also observed in the northern disk.
III A New Catalog of Very Young, Embedded Clusters in the Antennae
III.1 Cluster Selection Based on Hydrogen Recombination Line Ratios
Recently formed star clusters are typically still surrounded by their parental cloud of gas and dust, which makes their emission difficult to detect at optical wavelengths but easier at longer wavelengths. Because the intrinsic flux ratios for H/Br and H/Pa are 36.679 and 8.584, respectively (Hummer and Storey, 1987), H will be stronger than Pa and Br in H II regions with nebular extinction mag, Pa will be strongest for sources with to mag, and Br will be strongest for sources with mag.222These estimates assume Case B recombination for a a typical electron temperature of 10,000 K and electron density and a Milky Way-like attenuation curve with . Note that the Calzetti et al. (2000) law finds that the nebular reddening is times higher than the reddening experienced by stellar emission. In this section, we use our high resolution maps of hydrogen recombination line emission in H, Pa, and Br to identify embedded star clusters in the Antennae.
Maps of Br/H and Pa/H flux ratios are ideal for identifying sources with high nebular extinction (e.g., Brandl et al., 2012; Messa et al., 2021; Graham et al., 2025). As a guide to the specific flux ratios to use from our maps, we examine the measured ratios for WS80 and its companion, the latter being another very young, massive cluster with moderate reddening which was first identified by Rubin et al. (1970). Images of this cluster pair are shown in Figure 3 from m through m, with WS80 identified by the cyan cross. WS80 is not detected in the NUV, U, or B filters, is very faint in V, H, and I, becomes progressively brighter towards longer wavelengths and by m is the brightest source in the Antennae. By contrast, its neighbor is the brightest source (excluding the galactic nuclei) in the near-ultraviolet (F275W) and U (F336W) bands, and remains bright over all plotted wavelengths, including Pa and Br. WS80 and its companion are among the brightest sources in the PaH line ratio map shown in the right panel of Figure 4, and WS80 is the brightest source in both maps.
Based on the observed ratios for WS80 and its neighbor, we require a candidate embedded cluster to have (at least) one pixel with Pa/H or Br/H, or to have at least 3 contiguous pixels with Pa/H or Br/H. An initial list of embedded cluster candidates which satisfied these criteria are selected automatically from the flux ratio maps, followed by careful visual inspection of each candidate in both maps. Two additional criteria were imposed on sources that satisfied these line ratios: (i) the source must have similar morphology in the Pa/H and Br/H ratio maps (this step eliminated a number of point sources with imperfect continuum subtraction); and (ii) the source must be broader than the point spread function (PSF) at 3.6 m (more below).
We identify 45 candidate embedded clusters which satisfy our selection criteria and list their coordinates in Table 2. All have Pa and Br emission; we did not discover any sources with Br but no Pa emission. Not surprisingly, most of the embedded clusters (28/45 or %) are found in the overlap region between the two galaxies. Approximately 15% (6/45) are in the southern galaxy (all but one in the optically-dark star-forming arc around the nucleus) while % (11/45) are forming in the disk of the northern galaxy. We do not identify any embedded cluster candidate in the ‘Firecracker’ (Whitmore et al., 2014), despite high flux ratios (Br/H) throughout the region (see Figure 4). The Firecracker is a well-studied, infrared-bright region located north and slightly west of WS80 (see Figure 4) with no known star or cluster formation (Whitmore et al. 2014; Johnson et al. 2015; Finn et al. 2019, although see Herrera and Boulanger 2017) for a different view), lending confidence to our selection criteria.


| Source1 | RA | Dec | Age | AV | Mass | apcorraaThe aperture correction listed for each cluster is the magnitude difference measured between aperture radii of 15 and 5 pixels, , in the NIRCAM F360W filter. | CrossID |
|---|---|---|---|---|---|---|---|
| ID | (J2000) | (J2000) | [log ()] | (mag) | [log ()] | [mag] | |
| 1 | 12:01:52.24 | -18:53:27.96 | -1.2 | ||||
| 2 | 12:01:52.96 | -18:53:15.44 | -0.7 | ||||
| 3 | 12:01:53.09 | -18:53:09.82 | -1.7 | ||||
| 4 | 12:01:53.12 | -18:53:09.78 | -1.8 | possibly NU1-3 | |||
| 5 | 12:01:53.16 | -18:53:08.81 | -1.4 | ||||
| 6 | 12:01:53.30 | -18:53:08.12 | -1.6 | ||||
| 7 | 12:01:54.20 | -18:53:08.95 | -0.7 | ||||
| 8 | 12:01:55.04 | -18:53:11.36 | -1.4 | ||||
| 9 | 12:01:54.95 | -18:53:05.97 | -0.9 | WS80, NU2-1 | |||
| 10 | 12:01:54.83 | -18:53:07.76 | -1.5 | ||||
| 11 | 12:01:54.77 | -18:53:06.29 | -1.3 | ||||
| 12 | 12:01:54.68 | -18:53:05.68 | -1.0 | ||||
| 13 | 12:01:54.59 | -18:53:03.01 | -1.3 | Companion, NU2-6 | |||
| 14 | 12:01:55.36 | -18:53:02.65 | -1.4 | ||||
| 15 | 12:01:55.21 | -18:53:03.19 | -1.1 | ||||
| 16 | 12:01:55.44 | -18:53:00.74 | -0.9 | ||||
| 17 | 12:01:55.36 | -18:53:01.86 | -1.1 | ||||
| 18 | 12:01:55.31 | -18:53:01.50 | -1.4 | ||||
| 19 | 12:01:55.21 | -18:53:01.25 | -1.1 | ||||
| 20 | 12:01:54.93 | -18:52:58.59 | -1.4 | ||||
| 21 | 12:01:54.92 | -18:52:58.19 | -1.8 | ||||
| 22 | 12:01:55.21 | -18:52:44.58 | -1.0 | ||||
| 23 | 12:01:54.89 | -18:52:44.98 | -0.9 | ||||
| 24 | 12:01:54.59 | -18:52:43.97 | -1.1 | ||||
| 25 | 12:01:55.32 | -18:52:40.01 | -1.1 | ||||
| 26 | 12:01:55.07 | -18:52:39.50 | -1.4 | ||||
| 27 | 12:01:55.34 | -18:52:37.96 | -0.8 | ||||
| 28 | 12:01:55.15 | -18:52:37.96 | -1.0 | ||||
| 29 | 12:01:56.05 | -18:52:34.97 | -1.5 | ||||
| 30 | 12:01:54.74 | -18:52:31.37 | -1.1 | NU4A-6 | |||
| 31 | 12:01:54.94 | -18:52:29.28 | -1.7 | ||||
| 32 | 12:01:54.96 | -18:52:28.85 | -1.4 | ||||
| 33 | 12:01:54.51 | -18:52:28.78 | -1.0 | ||||
| 34 | 12:01:54.85 | -18:52:25.32 | -1.3 | ||||
| 35 | 12:01:54.59 | -18:51:56.55 | -1.5 | NU6-1 | |||
| 36 | 12:01:54.50 | -18:51:46.19 | -0.8 | ||||
| 37 | 12:01:55.18 | -18:51:41.08 | -1.7 | ||||
| 38 | 12:01:55.16 | -18:51:40.43 | -1.3 | ||||
| 39 | 12:01:53.13 | -18:51:38.23 | -1.2 | ||||
| 40 | 12:01:52.16 | -18:51:38.81 | -1.4 | ||||
| 41 | 12:01:52.10 | -18:51:40.36 | -1.1 | ||||
| 42 | 12:01:51.97 | -18:51:38.12 | -1.4 | ||||
| 43 | 12:01:51.05 | -18:51:58.28 | -1.3 | ||||
| 44 | 12:01:50.80 | -18:52:15.10 | -1.6 | ||||
| 45 | 12:01:50.94 | -18:52:28.09 | -1.1 |

As mentioned earlier, embedded cluster candidates are selected to be broader than the PSF in the F360M filter, since many are faint at m but brighter at 3.6m. Following Thilker et al. (2022), we measure a set of multiple concentration indices (MCI) to determine if a source is broader than the PSF, where a concentration index is simply the difference in magnitude measured in two apertures. MCI is defined for pairs of radii , , and as the average: , where NCI is the concentration index ’normalized’ relative to a fiducial cluster. We calculate an inner and outer value using radii of 1.0, 1.5, 2.0, and 2.5 pixels (2.5, 3.0, 4.0, 5.0 pixels) as for MCIin (MCIout). The results in Figure 5 show that the embedded cluster candidates have higher MCI values than a hand-selected training set of stars, indicating they are more extended than the PSF. These overlap with the structural parameters measured for a new catalog of F150W-selected clusters, although the embedded clusters tend to have somewhat less extended outskirts than older clusters (i.e., they have slightly lower MCIout for a given MCIin), consistent with expectations that these very young clusters will expand as they age; Chandar et al. 2016).

We emphasize that our 45 embedded cluster candidates are not the full sample of clusters in the Antennae, just some of the youngest and most extinguished ones. In an upcoming work (M. Caputo et al.), we will present a new catalog of star clusters selected to be broader than the PSF in the F150W JWST image. This catalog includes clusters which are both obscured and unobscured in V band images taken with HST. Figure 5 shows that the embedded clusters selected here (black circles) have similar structural parameters to the 1.5 m selected clusters (gray circles).
III.2 An Assessment of Different Infrared Tracers for Identifying Embedded Clusters
A number of recent works have used different combinations of high-resolution Pa, Br, and 3.3 m JWST imaging to identify embedded star clusters in nearby galaxies (e.g., Rodríguez et al., 2023, 2025; Gregg et al., 2024; Knutas et al., 2025; Graham et al., 2025). The FEAST collaboration has defined embedded candidates (designated as emerging young star clusters or ’eYSCI’) as sources with a Br and 3.3m PAH peak within 4 pixels () of a Pa emission peak. Their selection results in 737 sources in the spiral galaxy NGC 628 that have an average reddening mag or extinction A mag (Gregg et al., 2024), and in 946 sources in M83 with a median mag or A mag (Knutas et al., 2025) for a Milky Way-like extinction curve. They suggest that clusters with peaked Pa and Br emission but diffuse (and weaker) 3.3m PAH emission (designated ’eYSCII’) are somewhat older (by Myr) than the eYSCI sources.
As part of the PHANGs collaboration, Rodríguez et al. (2023, 2025) selected embedded cluster candidates which may be missed in optically-selected samples in spiral galaxies through their 3.3m PAH emission. While they did not estimate extinction, they found that % of the 3.3m sources detected in NGC 7469 were not selected as clusters at optical wavelengths (Rodríguez et al., 2023).
While identifying embedded cluster candidates in the Antennae based on the selection criteria used by the FEAST and PHANGS collaborations is beyond the scope of this paper, we offer a qualitative assessment of the source catalogs that would result from applying these selection criteria to our Antennae data. We can easily count a few hundred sources with overlapping Pa, Br, and 3.3m emission, including our embedded clusters. These sources have significantly lower Br/H and Pa/H ratios than the thresholds adopted here, and therefore almost certainly experience less extinction. Most of these sources are identifiable in the HST V-band image, supporting the idea that they are young, line-emitting clusters with low extinction AV. We conclude that combinations of Pa (Br), and 3.3m emission provide an excellent way to identify very young clusters regardless of the amount of extinction they experience. The method used here of identifying clusters based on their high Pa/H and Br/H line ratios preferentially selects the subset of very young clusters with higher extinction, most of which are not identifiable as clusters from their broad-band optical emission.
IV Deriving the Properties of Embedded Clusters
IV.1 SED Fitting
In this section we estimate the age, reddening, and mass of each embedded cluster by fitting its observed SED with predictions from cluster evolution models that extend to infrared wavelengths and include emission from both stars and ISM.
In preparation for SED fitting, we perform aperture photometry using the photutils package (Bradley et al., 2024) using a measurement radius of 0155 uniformly across all HST and JWST/NIRCam images. The sky background is measured in an annulus with radii between 050 and 062 from the source centers. The shape of the SED is affected by the age of the cluster stars and the amount and condition of the ISM, and its normalization is tied to cluster mass. We estimate the amount of light missing in the aperture by measuring the magnitude difference of each source between 0155 and 0465 in the F360W filter (difference between 5 and 15 pixel radii). The median aperture correction is mag, and the values measured for each cluster are listed in column 7 of Table 2. In a future paper we will present size-dependent aperture corrections for a full catalog of optically obscuredunobscured star clusters in the Antennae, but curves of growth for the embedded clusters suggest that the simple approach adopted here gives results within % of the total flux.
For the SED fitting, we adopt the flexible stellar population synthesis (FSPS) code (Conroy et al., 2009, 2010) to determine the best fit combination of age and reddening. The models include dust extinction and emission, nebular line and continuum emission, and circumstellar emission around AGB stars. Full details of the fitting procedure will be provided along with the total sample of clusters at all ages in an upcoming work (M. Caputo et al., in preparation); here we summarize the basic assumptions and method. We use the Python package python-FSPS (Johnson et al., 2024) to create integrated-light spectra of single-age stellar populations (SSPs) with solar metallicity and a Kroupa (2001) initial mass function (IMF). The synthetic cluster spectra are placed at the redshift of the Antennae ( = 0.0055, cf. NED). For the age range, we choose in steps of 0.1 dex. For extinction, we allow the range mag in steps of 0.1 mag, assuming a Milky Way-like value for of 3.1, but find very similar age-AV results if we adopt the Calzetti et al. (2010) extinction law instead. We select models from the PARSEC isochrone family (Bressan et al., 2012; Nguyen et al., 2022) and the MILES spectral library (Sánchez-Blázquez et al., 2006; Vazdekis et al., 2010, 2016).
To create predicted cluster photometry, the spectra are integrated over the HST/ACS, HST/WFC3, and JWST/NIRCam passbands by incorporating throughput tables downloaded from the STScI website into the FSPS package. Predicted magnitudes are derived based on an assumed distance to the Antennae of = 31.66 (Riess et al., 2011).
The best-fit age and reddening for each cluster are determined as follows. For each cluster, we first normalize the model magnitudes by subtracting the weighted mean offset between the model grid and observed cluster magnitudes, using inverse variance weighting. After this normalization, we determine values for each predicted combination of age and reddening:
|
where is the number of filter passbands being fitted, and represents the observational uncertainty (in magnitudes) for the filter.
Uncertainties for log (age/yr) and are determined as the values within 34 percentile of the lowest value, equivalent to for a normal distribution. The log (age/yr) vs. grid is oversampled by a factor 10 in this step, using linear interpolation. The mass and associated uncertainty is calculated from the extinction-corrected F360W magnitude and best fit, plus uncertainties for log (age) and . The best-fit age, AV, mass and associated uncertainties are listed for each cluster in Columns 4-6 of Table 2.
IV.2 Age, Extinction, Mass Results


In Figure 7 we show results from the SED fitting described above for 12 clusters from our sample. We show the photometry measured in all 11 HSTJWST filters (data points) and the best fit results (solid line) based on the procedure described above. Photometric uncertainties are included, but are mostly smaller than the data points. The panels show examples of similar-age clusters with high AV ( mag, top panel), moderate AV ( mag, middle panel), and low AV ( mag, bottom panel) from our sample.
Overall, the fits look quite good. As expected, all clusters in the sample are very young with a best-fit age of Myr or younger, and the shape of the SED is mainly driven by extinction. We see that none of the Antennae clusters with the highest extinction (including WS80) are detected in the F275W/NUV or F336W/U filters, and that their measured and best-fit continuum slopes drop sharply towards short (blue) wavelengths. Despite experiencing high extinction, H emission is detected from massive clusters with mag. Clusters with moderate extinction have shallower slopes (decrease less) towards short wavelengths and have strong emission lines, and those with low extinction have SEDs that are flat or increase towards the near-ultraviolet.
In Figure 8 (central panel) we plot the best fit mass vs. AV for each embedded cluster in our sample. The clusters have a range of extinction AV between mag. The histogram along the right side shows a predominant value of A mag. The embedded clusters have estimated masses (listed in Column 6 of Table 2) that range from to . Overall, we see there are fewer high-mass clusters (the distribution of embedded cluster masses will be discussed in Section 5.3) and fewer clusters with high extinction.
IV.3 Comparison with Published Cluster Properties
Our estimates of the age, extinction, and mass for the most massive embedded cluster in the Antennae, WS80, agree well with many previously published results. We find this cluster has an age log , A mag (the highest in our sample) and an estimated mass of at least log (M (for this cluster and its neighbor, the aperture corrections are lower-limits). Our age compares well with published estimates of log (e.g., Whitmore et al., 2010). Published values of extinction include A mag (Whitmore et al., 2010) and mag (Gilbert et al., 2000), and the published range of masses is between and (Whitmore and Schweizer, 1995; Whitmore et al., 2010; Gilbert and Graham, 2007; Herrera and Boulanger, 2017).
The companion to WS80 is also quite young with a best fit age of log , A mag, and log . Previously, Whitmore et al. (2010) estimated log , A mag, and log from optical photometry alone. Our embedded cluster # 30 has best-fit values of log , A mag, and log , in good agreement with the Whitmore et al. (2010) results of log , A mag, and log .
He et al. (2022) estimated the optical extinction towards several clusters including WS80 and its neighbor, from high resolution continuum observations at 100 GHz and 345 GHz taken with ALMA. They derived extinction values from estimates of the gas surface density, and found A mag and mag for WS80 and its neighbor, respectively, significantly higher than the estimates presented here, although their calculations rely on assuming the shape of the thermal dust and free-free spectral indices. It is possible that the frequency coverage of their radio observations are insufficient to constrain cluster extinction.
V Discussion
V.1 Nowhere Left to Hide
Some of the most intense star formation in the nearby universe is happening in merging galaxies. Since star formation takes place in dense, dusty molecular clouds, the earliest stages of star and cluster formation are obscured at optical wavelengths. However it still is not known whether most sites of cluster formation are optically obscured and embedded in thick layers of dust with A mag (e.g., Stanford et al., 1990; Kunze et al., 1996; Mirabel et al., 1998; Klaas et al., 2010), or if most (massive) clusters have A mag and have already been detected at optical wavelengths (Whitmore and Zhang, 2002). With our deep, high resolution infrared JWST images we are now in a position to directly answer this question by uncovering the deeply embedded, recently formed cluster population in the Antennae.
We believe there are no massive clusters with A mag in the Antennae, and that we have uncovered essentially all clusters with and extinction A mag. One key clue is that we did not find any sources that have Br but no Pa emission; Pa emission generally indicates that a source must have extinction AV less than 20 mag. More quantitatively, we can estimate the range of detectable AV for a given mass by scaling the observed parameters of WS80, which has a mass , extinction A mag, and is mag brighter than the detection limit in the Pa filter. Since A, if WS80 experienced no extinction it would be mag brighter than the detection limit. Simple scaling arguments indicate that our Pa observations are sufficiently deep to detect () clusters with extinction AV up to mag ( mag). All but 13 of the embedded clusters have masses , so the Antennae has formed plenty of massive clusters, we just do not detect any with extinction higher than A mag.
We estimate the fraction of very young clusters missing from optical surveys by combining our new embedded cluster list with the HST-based cluster catalog published by Whitmore et al. (2010). We adopt a mass limit of , the approximate completeness limit for the embedded cluster catalog (see Section 5.3). Our new catalog has 38 clusters above this mass limit, but four are included in the optical catalog, so there are 34 unique new clusters above the completeness limit. The Whitmore et al. (2010) catalog has 156 clusters younger than Myr and more massive than , suggesting their optical study is missing % () by number of these very young clusters in the Antennae. If we consider the 306 (788) optically-selected clusters above this mass that have estimated ages Myr ( Myr) this percentage drops to % (%), which represents a small fraction of the total number of clusters in the Antennae. While the embedded population is just a few percent of the total cluster population, it emits the majority (%) of the total ionizing photon luminosity in the Antennae, with WS80 alone emitting % of the ionizing photons based on estimates from the ages and masses of the embedded and optically-detected clusters. This is consistent with the 15% of the total 12.5-18m luminosity measured for WS80 (Mirabel et al., 1998).
Figure 9 illustrates that star formation, traced in pink by H (left) and Pa (right), is on-going throughout much of the overlap region, with no obvious pattern from east to west. However, little star-formation is taking place in a number of optically dark, dusty regions. The yellow contours highlight dark regions in the B band image. It is clear that there are very few embedded clusters forming in these dusty regions (cyan stars), or clusters of any age, since there are almost no small green circles (candidate star clusters selected in the JWST/F150W image) within the contours. The most likely explanation for the dust lanes and clusters having different spatial distributions is that the dust is cold and in the foreground of any optically emitting material. In fact, the brightest clusters in our Br and 3.6m infrared images do not coincide with the most prominent dark, dust-affected areas in the optical HST images, indicating that much of the dust/ISM in the overlap region is not hiding any significant amount of star formation.

V.2 The Embedded Cluster Population in the Antennae

Massive stars formed in very young Myr clusters ionize the gas in their immediate vicinity but live inside a larger, surrounding cloud of neutral and molecular gas. Pre-supernova stellar feedback (stellar winds, photoionization, and radiation pressure) can carve channels in the ISM through which the starlight and ionizing radiation can escape (e.g., Whelan et al., 2011; Howard et al., 2017), although the timescale for this process is not well constrained.
We assess the multi-wavelength contributions of ionized gas, stellar continuum, and dust emission from the embedded clusters based on the JWSTHST images and their measured photometry. All embedded clusters have compact Pa and Br emission, but nine of them (#2, 3, 4, 7, 10, 24, 31, 36, 37) have no detectable or very weak H emission. All have detected stellar continuum emission at 1.5m and all have strong 3.6m emission. We also detect compact 3.3m PAH emission from all of the embedded clusters except for #4, which is the closest source to the southern nucleus and has a strange SED; 3.3m PAH emission has been shown to decrease towards the nucleus of at least one nearby Seyfert galaxy (NGC 7469; Lai et al. 2023).
He et al. (2022) suggested that the near-infrared and radio emission from embedded clusters might originate from slightly different parts of the dense molecular cloud, as predicted by the ’blister’ model, as a possible explanation for the high extinction values they derived (Section 4.3). In Figure 10 we present the spatial offsets in arcseconds measured between Pa (ionized gas) and 1.5m (stellar continuum) emission where each cluster was centered individually in each image. The dashed square represents the size of a NIRCAM pixel. The figure shows that the stellar continuum and ionized gas emission peak at similar locations, as expected for massive clusters with A mag. Quantitatively, we find that the embedded cluster locations in Pa and 1.5m are consistent with zero mean offset, with RA, and Dec. All of the embedded clusters in our new catalog have estimated ages of 2.5 Myr and younger, with the majority being dated to ages of just 1 Myr or less. The fact that we detect starlight (even if faint) at 1.5m from the embedded clusters from these very young clusters indicates that pre-supernova feedback carves channels in the dense ISM within Myr, allowing recombination line emission and starlight to escape the parent molecular cloud (e.g., Kim et al., 2021; Ramambason et al., 2025), and essentially rules out the blister model for the sources studied here. And it is not just the most massive clusters that have such short emergence timescales. Starlight (1.5m emission) is detected from clusters over the full observed mass range, suggesting this timescale does not have a strong dependence on cluster mass in the Antennae.
We checked for differences in cluster properties based on location within the Antennae, considering clusters in the south galaxy (mostly near the nucleus, sources # 1-6), the overlap region between the two galaxies (# 7-34), and the north galaxy disk (# 35-45). The estimated mass vs. AV for clusters in the three locations are shown in Figure 8. Clusters with masses higher than a few are forming throughout the Antennae, but the most massive clusters only form in the overlap region. Clusters with the highest extinction (A mag) are in the overlap region (black circles) and in the star-forming arc around the southern nucleus (purple triangles), while embedded clusters in the disk of the north galaxy (green squares) have systematically lower extinction, all with A mag. There is no obvious variation in the age estimates with location.
V.3 Embedded (Initial) Cluster Mass Function
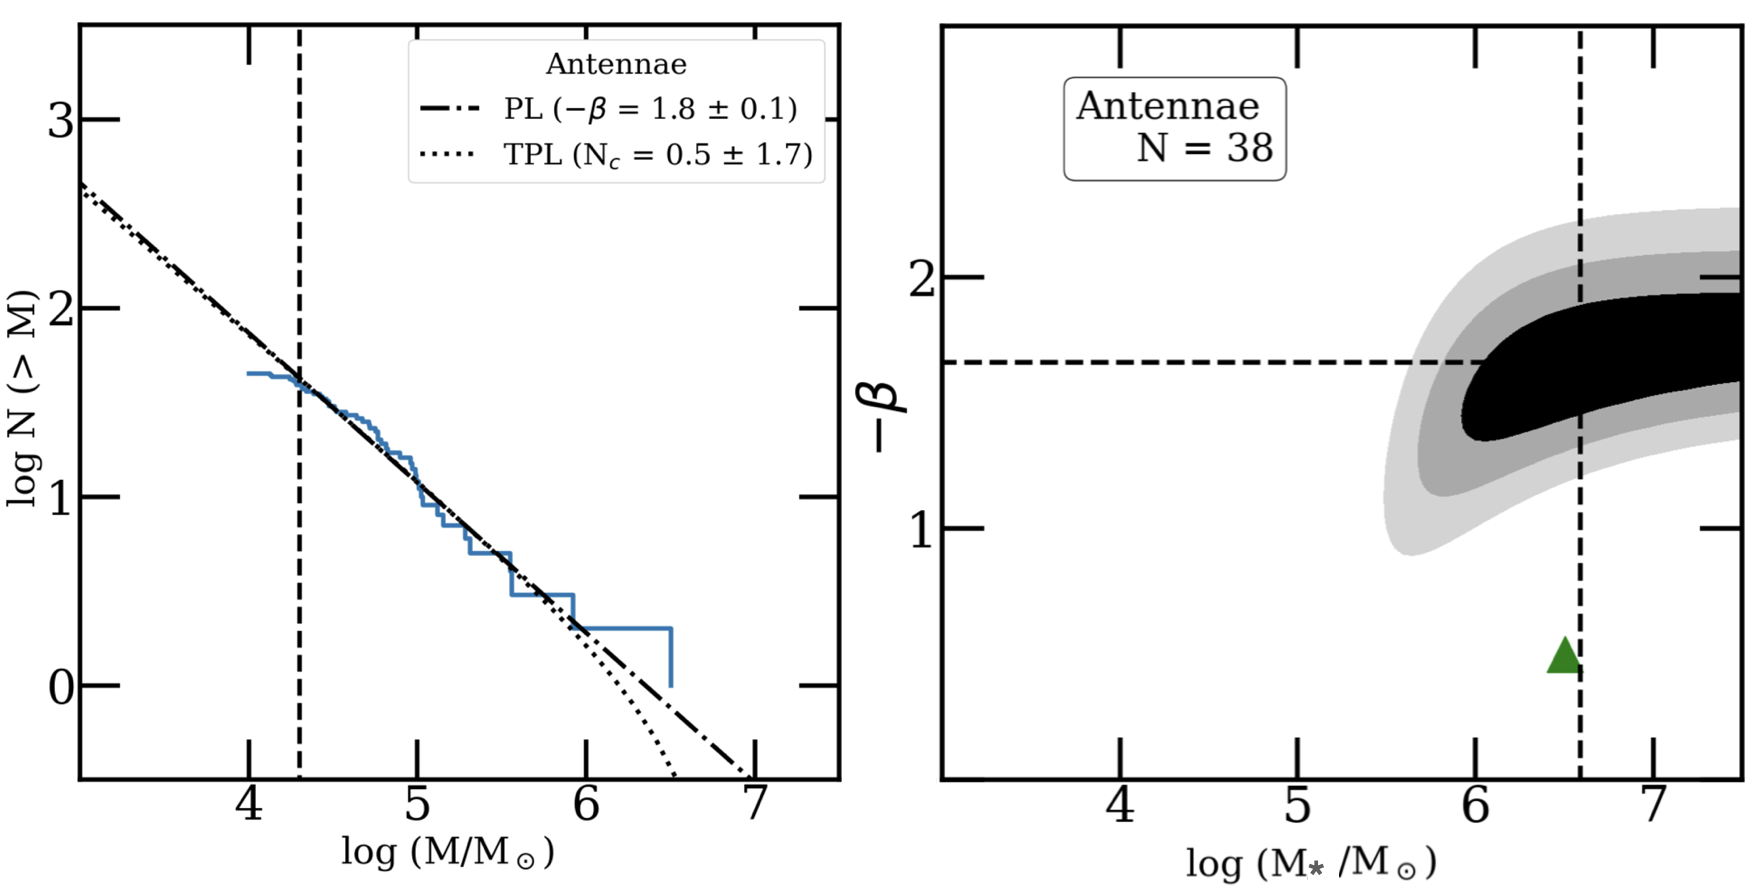
The recent formation of massive clusters in the Antennae make it an ideal system to assess the shape of the initial cluster mass function. The cumulative mass distribution of the embedded clusters in the Antennae clearly extends above , as shown in Figure 11 (left panel). A lower mass limit of log( (dashed vertical line) is determined from the deviation (flattening) of the distribution from a power-law. A power law, , is a good representation of the data, and we find a best-fit value of , shown by the dash-dotted line in the figure. This result is similar to the power-law index of found for the mass function of young clusters in many other nearby star-forming galaxies (e.g., Zhang and Fall, 1999; Bik et al., 2003; McCrady and Graham, 2007). While a pc-scale simulation of an Antennae-like system suggests that the mass function of the gas flattens in regions of very high pressure (Li et al., 2020), we do not find strong evidence for this. It is worth noting that nearly all previous works include clusters with ages between 1 and 10 Myr in their fits, which may already have experienced some evolution, whereas our distribution includes only the very youngest ( Myr) clusters and is therefore a better representation of the ’initial’ cluster mass function.
To assess whether the high-mass end of the embedded cluster distribution shows any hint of a downturn or cutoff, we first fit a truncated power law (TPL) to the cumulative distribution using the MSPECFIT software (Rosolowsky, 2005). The results are shown by the dotted line in the left panel of Figure 11. The NC value of , the number of embedded clusters above the truncation mass, indicates there is no statistically significant truncation found in the distribution. Because binned distributions can hide weak features at the ends of the distribution, we also fit a Schechter function, with power-law index and exponential cutoff using the maximum likelihood method developed in Mok et al. (2019). The resulting 1-, 2-, and 3- contours for and are shown in the right panel of Figure 11. The green triangle indicates the most massive embedded cluster in the sample, and the dashed lines show the best formal fit to and . However, all of the contours remain open to the highest mass allowed in the fit, indicating this value of cutoff mass is essentially a lower limit. This preliminary result suggests that the initial cluster mass function continues as a power law to masses above in galaxies with intense star formation, and that the exponential-like downturn observed in the high-end of the globular cluster mass function may result from evolution rather than be imprinted during formation (Fall and Zhang, 2001).
V.4 No Infrared-Dark Thermal Radio Sources in the Antennae
Radio observations are considered the gold standard for identifying deeply embedded star clusters, since they detect thermal free-free continuum emission from gas ionized by recently formed massive stars (Kobulnicky and Johnson, 1999; Johnson et al., 2001, 2004, 2009; Johnson and Kobulnicky, 2003; Aversa et al., 2011; Kepley et al., 2014) and are unaffected by high extinction caused by large amounts of dust (Murphy et al., 2011). In the Appendix we identify the infrared counterparts to 6 cm sources catalogued by Neff and Ulvestad (2000) and a subset of seven sources identified by He et al. (2022) at 100, 200, 345 GHz, and summarize the results of that investigation here.
We identify four and possibly five of the radio sources as embedded clusters from their high Pa/H and Br/H flux ratios. These include WS80 (#9), its neighbor (#13), and two other sources in the overlap region (#30, #35). One near the southern nucleus (#4) may also have radio emission. These sources have a range of extinction, with three having among the highest in our sample with A mag and two with more moderate values of A mag. The clusters associated with these radio sources are the most massive in our sample (red circles in Figure 8), with . Two of the sources (4-4 and 8-4 from Neff and Ulvestad 2000) have bright Pa, optical, and near-infrared emission with low Pa/H and Br/H flux ratios, and appear to be optically bright star clusters with low extinction. We did not find any published radio properties (e.g., spectral index or flux ratios) which appear to correlate with extinction, although there are only a few clusters and the published radio properties are incomplete. The remaining 10 non-nuclear radio sources listed in the Appendix do not appear to be associated with clusters at all and may be non-thermal (e.g., supernova remnants). Some of these show a bubble-like Pa morphology with no obvious counterpart in the broad-band JWST images, and include two sources in the Firecracker region (3-5A and 3-5B).
We find no thermal radio sources that are infrared-dark, since all are detected in the 1.5m through 4.05m JWST images. The thermal radio sources are detected in all of our infrared filters, but 40 of the 45 embedded clusters discovered here have no radio counterpart. These ’radio-dark’ clusters mostly have estimated masses less than . Thermal radio sources in the Antennae include deeply embedded clusters ( up to mag), but also clusters that are optically bright and experiencing little extinction. Regardless of the amount of extinction, only the most massive clusters () are identified in current radio surveys of the Antennae.
The estimated depth of the two radio surveys discussed above are consistent with the cluster mass limits we have found here. In particular, He et al. (2022) find that 100 GHz continuum point sources detected with ALMA at a correspond to star clusters with a derived stellar mass of several. Given the much lower number of 100 GHz detections (17) compared with expectations from existing optically surveys (), He et al. (2022) conclude they detect so few embedded clusters because of their high mass limit plus the short-lived phase when embedded clusters are bright at submillimeter wavelengths. The Neff and Ulvestad (2000) radio survey has a point-source detection limit of 50 Jy at 4 and 6 cm, which corresponds to a luminosity of . We calculate an ionizing photon rate of from this luminosity using Equation 10 in Murphy et al. 2011 (for an assumed thermal fraction of 50% at 5 GHz), which is expected from very young clusters with masses (Emig et al., 2020). Free-free absorption could potentially suppress the 6 cm thermal flux from embedded clusters, which would effectively raise this mass threshold further. Our infrared line-ratio based selection method therefore detects embedded clusters that are less massive than current radio surveys in the Antennae.
V.5 Constraints on the Formation of Very Massive Clusters


Now that we have identified all of the obscured clusters more massive than a few, we are confident that WS80 and its companion, both with masses , are the two most massive recently formed clusters in the Antennae. This massive cluster pair have formed in a special location, at the edge of a super-giant molecular cloud very close to the southern edge where the two galaxies overlap, which may offer clues to the specific processes responsible for their formation.
Diffuse, soft x-ray emission is observed just to the south of the clusters in Chandra X-ray Observatory images (Fabbiano et al., 2001), suggesting there is shock-heated gas nearby. However, previous infrared-based studies have reached different conclusions about the presence of shocked gas. Haas et al. (2005) concluded that strong H2 S(3) emission observed in an ISO spectrum covering most of the Antennae (including the overlap region and both nuclei), likely originated from large-scale shocks due to the collision between HI clouds. Conversely, Brandl et al. (2012) found from Spitzer spectra that the H2 emission in the overlap region agrees well with active star formation and that far ultraviolet photons and local shocks from supernovae are likely responsible for exciting the molecular hydrogen rather than shocks from the large-scale interaction of the two galaxies. They did not, however, specifically extract spectra from regions surrounding WS80 and its companion.
Here, we revisit the H2 emission near this remarkable pair of massive star clusters. We use SIMLA cubes (see Donnelly et al. 2025, Section 2.4) to extract Spitzer spectra for WS80, its companion, three regions just south of the massive cluster pair (overlapping the diffuse x-ray emission), and a control region in the northern disk using a 25 aperture radius (smallest reasonable aperture for the observations), although the main results are not sensitive to the exact aperture size or location. Extracted spectra are shown in Figure 12, and their apertures are indicated as the larger white circles in Figure 6. Key diagnostic features in the spectra are highlighted in Figure 12, including the main PAH bands (pink), low and high ionization metal lines (light blue), and H2 rotational lines (light green). The PAH bands at 6.2, 7.7, and 11.3m are strong in the spectrum of both WS80 and its companion cluster, and WS80 in particular shows a significant amount of absorption. Figure 12 also shows a spectrum (in red) of region 3, located south of the clusters. PAH features and nebular emission lines are observed in the spectrum. One key difference, however, is that the H2 lines in region 3 are clearly stronger than that associated with the clusters themselves. In an upcoming work we will present a detailed analysis of the Spitzer spectra for of the brightest young clusters throughout the Antennae and tens of regions between them.
Observations and radiation modeling have shown that the H2/PAH ratio can be used as a diagnostic to identify regions heated primarily by star-formation and those with additional heating from shocked gas (e.g., Ogle et al., 2010; Guillard et al., 2012). PAH molecules are excited primarily by UV photons but H2 molecules will experience additional heating if shocks are present, so the ratio of H2 to PAH emission is higher in regions with additional mechanical heating than in normal star-forming regions. We measure the strengths of the 7.7m PAH feature and the four H2 S(0), S(1), S(2), and S(3) lines, which are summed together to produce H2 S(0-3). The strength of these features are determined from PAHFIT, which models the mid-infrared spectrum as a combination of blackbodies of fixed temperature, Gaussian emission lines, Drude profiles for PAH sub-feature emission, and a power law describing silicate extinction with features at 9.7 and m. PAHFIT is also used to combine sub-features and propagate uncertainties to derive the intensity of the m complex (see Smith et al. 2007 for more details).
The ratio measured for the six extracted regions is plotted in Figure 13. The dashed line at 0.04 represents the near-constant ratio between the H2 S(0-3) line and the m PAH feature determined for normal star-forming regions with a large range of infrared luminosities (Ogle et al., 2010). The star-forming region in the northern disk and the companion to WS80 both have measured H2/PAH ratios which are consistent with . Meanwhile, the three regions just below the massive cluster pair (designated 3, 4, 5) have significantly higher H2/PAH ratios, . These regions are unlikely to be excited by an AGN in the nucleus of NGC 4039, since the ratio is strongest for region 6 which is the furthest away. The H2/PAH ratio for WS80 is somewhat higher than those found for normal star-forming regions in nearby galaxies as part of the SINGS sample (gray points; Whitcomb et al. 2023), but it is possible that some shocked-heated gas is included in the aperture. These results support a picture where shocks are responsible for the elevated H2/PAH ratios measured in areas just surrounding WS80 and its companion. Higher spatial resolution observations would help map out the strength and spatial distribution of the shocks in this region.
All of the clues discussed in this section for the massive cluster pair are consistent with the picture of massive cluster formation in merging galaxies suggested by Jog and Solomon (1992). In their analytical models, they separately followed atomic and molecular hydrogen during a merger between two galaxies, and found that typically HI clouds collide but molecular clouds, which have smaller volume filling factors, do not. The collisions between HI clouds result in radiative shock compression of the outer layers of nearby, pre-existing GMCs that then trigger the formation of massive clusters. Similarly, the fully hydrodynamic simulations of galaxy mergers performed by Maji et al. (2017) found that massive star clusters (with masses ) preferentially form in the highly-shocked regions found in galaxy interactions. Consistent with these predictions, WS80 and its companion cluster have formed near the southern edge of a super-giant molecular cloud (WS80 is still embedded in weak CO emission while its companion is not; He et al. 2022) which is adjacent to the shocked gas identified in regions 3, 4, 5 studied here.
VI Summary & Conclusions
In this work we presented new images of the merging Antennae galaxies taken with JWST in the F150W, F187N (Pa), F335M (m PAH), F360M, and F410M (Br) NIRCam filters and the F770W (m PAH) MIRI filter. These observations, particularly when combined with archival images taken with HST in the F275W (near ultraviolet), F336W (U), F435W (B), F555W (V), F658N (H), and F814W (I) filters, give a new view of the star clusters and interstellar medium in this iconic merging system. The JWST images penetrate even the dustiest portions of the overlap region, allowing us to identify and study the most recently formed and deeply embedded star clusters.
We discovered a population of 45 embedded cluster candidates in the Antennae with high Br and/or Pa flux ratios which are broader than the point-spread function at m. We did not identify any sources with Br but no Pa emission; if such a source was detected, it would have extremely high extinction in the V-band (A mag). The embedded clusters are detected at all wavelengths between 1.5m and m. Most of the embedded cluster population (28/45 or %) is located in the region where the two galaxies overlap and most current star formation is taking place, with 11/45 or % forming in the northern disk and 6/45 or % near the southern nucleus.
We estimated the age, V-band extinction, and mass of each embedded cluster by fitting its measured 0.275-4.1m spectral energy distributions (SEDs) with predictions from the FSPS models of Conroy et al. (2009). These models include dust extinction and emission, nebular continuum and line emission and fit the observed SEDs well. All embedded clusters have best-fit ages of 2.5 Myr and younger, with nearly 80% having best-fit ages consistent with 1 Myr or less. Estimates of extinction AV range between and 10 mag, and mass between . The embedded cluster mass function can be described by a single power law with a formal best-fit index of , and shows no evidence for a downturn at the high-mass end.
The observations are sufficiently deep that we believe we have detected all clusters in the Antennae galaxies more massive than with A mag. Previous suggestions that clusters deeply embedded in dusty cocoons with A mag dominate the infrared emission from the Antennae likely resulted from poorer resolution observations.
We compared the locations of the embedded clusters with those of thermal radio sources identified by Neff and Ulvestad (2000) and He et al. (2022), and with optically-selected clusters in the Whitmore et al. (2010) catalog. The spatial analysis reveals:
-
•
Four and possibly five of the embedded clusters in our catalog are also thermal radio sources (#8, 12, 29, 34, and possibly #3), including the well-known massive cluster pair WS80 (#8), which is highly embedded, and its nearby more moderately extinguished massive companion cluster (#12). The remaining 40 sources are newly identified star clusters.
- •
-
•
We were unable to identify a cluster associated with three other potential thermal radio sources in the JWST or HST images. There is Pa emission from these sources, but it has a different morphology than from the embedded clusters, with shells rather than a compact structure. These radio sources may be supernova remnants.
-
•
None of the currently known bright thermal radio sources are infrared-dark, and all are detected from 1.5 through 4.1m, suggesting they have moderate extinction.
-
•
Based on the derived properties, we found that current radio observations identify only the most massive clusters, including ones that are optically-bright and have low extinction. It appears challenging to isolate the embedded phase of cluster evolution with only radio measurements.
-
•
When added to optically selected catalogs, the embedded sources provide a complete census of obscured and unobscured clusters. We estimated that optical studies are missing % of very young ( Myr) clusters in the Antennae. The newly discovered embedded cluster population is important for studying the earliest phases of cluster evolution, but represents a very small fraction (%) of the observable cluster population in the Antennae galaxies.
We found that using a combination of H, Pa, and Br line ratios is an excellent method of identifying the youngest, most embedded clusters which are missing from optically-based cluster catalogs, and reach clusters that are times less massive than the limits of current radio survey of the Antennae.
References
- Star cluster formation in the most extreme environments: insights from the HiPEEC survey. MNRAS 499 (3), pp. 3267–3294. External Links: Document, 2008.12794 Cited by: §I.
- Bound star clusters observed in a lensed galaxy 460 Myr after the Big Bang. Nature 632 (8025), pp. 513–516. External Links: Document, 2401.03224 Cited by: §I.
- Very Large Array and ATCA Search for Natal Star Clusters in Nearby Star-forming Galaxies. AJ 141 (4), pp. 125. External Links: Document, 1102.0412 Cited by: §V.4.
- PHANGS-JWST First Results: Multiwavelength View of Feedback-driven Bubbles (the Phantom Voids) across NGC 628. ApJ 944 (2), pp. L22. External Links: Document, 2212.00812 Cited by: 3rd item.
- Clusters in the inner spiral arms of M 51: The cluster IMF and the formation history. A&A 397, pp. 473–486. External Links: Document, astro-ph/0210594 Cited by: §V.3.
- Astropy/photutils: 2.0.2 External Links: Document, Link Cited by: §IV.1.
- High resolution IR observations of the starburst ring in NGC 7552. One ring to rule them all?. A&A 543, pp. A61. External Links: Document, 1205.1922 Cited by: §III.1, §V.5.
- Spitzer-IRS Study of the Antennae Galaxies NGC 4038/39. ApJ 699 (2), pp. 1982–2001. External Links: Document, 0905.1058 Cited by: §II.4.
- PARSEC: stellar tracks and isochrones with the PAdova and TRieste Stellar Evolution Code. MNRAS 427 (1), pp. 127–145. External Links: Document, 1208.4498 Cited by: §IV.1.
- The Calibration of Monochromatic Far-Infrared Star Formation Rate Indicators. ApJ 714, pp. 1256–1279. External Links: 1003.0961, Document Cited by: §IV.1.
- The Dust Content and Opacity of Actively Star-forming Galaxies. ApJ 533 (2), pp. 682–695. External Links: Document, astro-ph/9911459 Cited by: §III.1.
- Evaporation, Tidal Disruption, and Orbital Decay of Star Clusters in a Galactic Halo. ApJ 464, pp. 765. External Links: Document Cited by: §I.
- The Age, Mass, and Size Distributions of Star Clusters in M51. ApJ 824, pp. 71. External Links: Document Cited by: §III.1.
- A Tale of Three Dwarfs: No Extreme Cluster Formation in Extreme Star-forming Galaxies. ApJ 949 (2), pp. 116. External Links: Document, 2304.02450 Cited by: §I.
- Star formation at the smallest scales: a JWST study of the clump populations in SMACS0723. MNRAS 520 (2), pp. 2180–2203. External Links: Document, 2208.10450 Cited by: §I.
- The Propagation of Uncertainties in Stellar Population Synthesis Modeling. I. The Relevance of Uncertain Aspects of Stellar Evolution and the Initial Mass Function to the Derived Physical Properties of Galaxies. ApJ 699 (1), pp. 486–506. External Links: Document, 0809.4261 Cited by: §IV.1, §VI.
- The Propagation of Uncertainties in Stellar Population Synthesis Modeling. II. The Challenge of Comparing Galaxy Evolution Models to Observations. ApJ 708 (1), pp. 58–70. External Links: Document, 0904.0002 Cited by: §IV.1.
- On the origin of globular clusters in a hierarchical universe. MNRAS 530 (3), pp. 2760–2777. External Links: Document, 2307.02530 Cited by: §I.
- SIMLA: The Spitzer Infrared Spectrograph Mapping Legacy Archive. arXiv e-prints, pp. arXiv:2512.12434. External Links: Document, 2512.12434 Cited by: §II.4, §V.5.
- The Globular Cluster Mass Function as a Remnant of Violent Birth. ApJ 712 (2), pp. L184–L188. External Links: Document, 1003.0798 Cited by: §I.
- Super Star Clusters in the Central Starburst of NGC 4945. ApJ 903 (1), pp. 50. External Links: Document, 2009.05154 Cited by: §V.4.
- Chandra Observations of “The Antennae” Galaxies (NGC 4038/9). ApJ 554 (2), pp. 1035–1043. External Links: Document, astro-ph/0102256 Cited by: §V.5.
- The Age Distribution of Massive Star Clusters in the Antennae Galaxies. ApJ 631, pp. L133–L136. External Links: astro-ph/0509293, Document Cited by: §I.
- Survival and disruption of galactic substructure. MNRAS 181, pp. 37P–42P. External Links: Document Cited by: §I.
- Dynamical Evolution of the Mass Function of Globular Star Clusters. ApJ 561, pp. 751–765. External Links: Document Cited by: §I, §I, §I, §V.3.
- New Insights into the Physical Conditions and Internal Structure of a Candidate Proto-globular Cluster. ApJ 874 (2), pp. 120. External Links: Document, 1903.08669 Cited by: §III.1.
- Molecular Gas and the Modest Star Formation Efficiency in the “Antennae” Galaxies: Arp 244=NGC 4038/9. ApJ 548 (1), pp. 172–189. External Links: Document, astro-ph/0010128 Cited by: §I.
- Infrared Spectroscopy of a Massive Obscured Star Cluster in the Antennae Galaxies (NGC 4038/9) with NIRSPEC. ApJ 533 (1), pp. L57–L60. External Links: Document, astro-ph/9912369 Cited by: §IV.3.
- Feedback in the Antennae Galaxies (NGC 4038/9). I. High-Resolution Infrared Spectroscopy of Winds from Super Star Clusters. ApJ 668 (1), pp. 168–181. External Links: Document, 0706.3935 Cited by: §IV.3.
- One Relation for All Wavelengths: The Far-ultraviolet to Mid-infrared Milky Way Spectroscopic R(V)-dependent Dust Extinction Relationship. ApJ 950 (2), pp. 86. External Links: Document, 2304.01991 Cited by: §II.3.
- Evolution of the Mass and Luminosity Functions of Globular Star Clusters. ApJ 833 (1), pp. 8. External Links: Document, 1611.09876 Cited by: §I.
- Hubble Space Telescope observations of globular cluster systems along the Hubble sequence of spiral galaxies. MNRAS 343 (2), pp. 665–678. External Links: Document, astro-ph/0304195 Cited by: §I.
- PAH Marks the Spot: Digging for Buried Clusters in Nearby Star-forming Galaxies. arXiv e-prints, pp. arXiv:2511.11920. External Links: Document, 2511.11920 Cited by: §III.1, §III.2.
- Feedback in Emerging Extragalactic Star Clusters, FEAST: The Relation between 3.3 m Polycyclic Aromatic Hydrocarbon Emission and Star Formation Rate Traced by Ionized Gas in NGC 628. ApJ 971 (1), pp. 115. External Links: Document, 2405.09667 Cited by: §III.2.
- Turbulent Molecular Gas and Star Formation in the Shocked Intergalactic Medium of Stephan’s Quintet. ApJ 749 (2), pp. 158. External Links: Document, 1202.2862 Cited by: §V.5.
- Exceptional H2 emission in the Antennae galaxies: Pre-starburst shocks from the galaxy collision. A&A 433 (2), pp. L17–L20. External Links: Document Cited by: §V.5.
- Embedded Young Massive Star Clusters in the Antennae Merger. ApJ 928 (1), pp. 57. External Links: Document, 2202.08077 Cited by: Appendix A, §IV.3, §V.2, §V.4, §V.4, §V.5, §VI.
- The impact of a massive star cluster on its surrounding matter in the Antennae overlap region. A&A 600, pp. A139. External Links: Document, 1701.00835 Cited by: §I, §III.1, §IV.3.
- Ultraviolet Escape Fractions from Giant Molecular Clouds during Early Cluster Formation. ApJ 834 (1), pp. 40. External Links: Document, 1611.02708 Cited by: §V.2.
- Recombination-line intensities for hydrogenic ions - I. Case B calculations for H I and He II.. MNRAS 224, pp. 801–820. External Links: Document Cited by: §III.1.
- A Triggering Mechanism for Enhanced Star Formation in Colliding Galaxies. ApJ 387, pp. 152. External Links: Document Cited by: §V.5.
- Dfm/python-fsps: v0.4.7 External Links: Document, Link Cited by: §IV.1.
- The Physical Conditions in a Pre-super Star Cluster Molecular Cloud in the Antennae Galaxies. ApJ 806 (1), pp. 35. External Links: Document, 1503.06477 Cited by: §III.1.
- Probing Star Formation at Low Metallicity: The Radio Emission of Super Star Clusters in SBS 0335-052. AJ 137 (4), pp. 3788–3799. External Links: Document, 0902.0796 Cited by: §V.4.
- Revealing the Young Starburst in Haro 3 with Radio and Infrared Imaging. AJ 128 (2), pp. 610–616. External Links: Document, astro-ph/0406493 Cited by: §V.4.
- A Sample of Clusters of Extragalactic Ultracompact H II Regions. ApJ 559 (2), pp. 864–877. External Links: Document, astro-ph/0107181 Cited by: §V.4.
- The Spectral Energy Distributions of Infant Super-Star Clusters in Henize 2-10 from 7 Millimeters to 6 Centimeters. ApJ 597 (2), pp. 923–928. External Links: Document, astro-ph/0308303 Cited by: §V.4.
- A comparison of the globular cluster luminosity functions of the inner and outer halo of the Milky Way and M31. MNRAS 285 (4), pp. L31–L34. External Links: Document, astro-ph/9608191 Cited by: §I.
- High Resolution Radio and Optical Observations of the Central Starburst in the Low-metallicity Dwarf Galaxy II Zw 40. AJ 147 (2), pp. 43. External Links: Document, 1312.4988 Cited by: §V.4.
- On the duration of the embedded phase of star formation. MNRAS 504 (1), pp. 487–509. External Links: Document, 2012.00019 Cited by: §V.2.
- Tracing the sites of obscured star formation in the Antennae galaxies with Herschel-PACS. A&A 518, pp. L44. External Links: Document, 1005.2290 Cited by: §V.1.
- FEAST: JWST uncovers the emerging timescales of young star clusters in M83. arXiv e-prints, pp. arXiv:2505.08874. External Links: Document, 2505.08874 Cited by: §III.2.
- Signatures of the Youngest Starbursts: Optically Thick Thermal Bremsstrahlung Radio Sources in Henize 2-10. ApJ 527 (1), pp. 154–166. External Links: Document, astro-ph/9907233 Cited by: §V.4.
- On the variation of the initial mass function. MNRAS 322 (2), pp. 231–246. External Links: Document, astro-ph/0009005 Cited by: §IV.1.
- SWS spectroscopy of the colliding galaxies NGC4038/39.. A&A 315, pp. L101–L104. Cited by: §I, §V.1.
- GOALS-JWST: Small Neutral Grains and Enhanced 3.3 m PAH Emission in the Seyfert Galaxy NGC 7469. ApJ 957 (2), pp. L26. External Links: Document, 2307.15169 Cited by: §V.2.
- Star Cluster Formation in Cosmological Simulations. I. Properties of Young Clusters. ApJ 834, pp. 69. External Links: 1608.03244, Document Cited by: §I.
- The effects of subgrid models on the properties of giant molecular clouds in galaxy formation simulations. MNRAS 499 (4), pp. 5862–5872. External Links: Document, 2001.07214 Cited by: §V.3.
- GOALS-JWST: Revealing the Buried Star Clusters in the Luminous Infrared Galaxy VV 114. ApJ 944 (2), pp. L55. External Links: Document, 2210.05763 Cited by: §I, §I.
- The Formation and Evolution of Star Clusters in Interacting Galaxies. ApJ 844 (2), pp. 108. External Links: Document, 1606.07091 Cited by: §V.5.
- Super Star Cluster Velocity Dispersions and Virial Masses in the M82 Nuclear Starburst. ApJ 663 (2), pp. 844–856. External Links: Document, 0704.0478 Cited by: §V.3.
- Looking for Obscured Young Star Clusters in NGC 1313. ApJ 909 (2), pp. 121. External Links: Document, 2011.09392 Cited by: §III.1.
- Properties of the brightest young stellar clumps in extremely lensed galaxies at redshifts 4 to 5. MNRAS 529 (3), pp. 2162–2179. External Links: Document, 2402.14920 Cited by: §I.
- The Star Cluster System of the Merger Remnant NGC 7252. AJ 114, pp. 2381. External Links: Document Cited by: §I.
- The dark side of star formation in the Antennae galaxies. A&A 333, pp. L1–L4. External Links: Document, astro-ph/9802176 Cited by: §I, §I, §V.1, §V.1.
- Constraints on Upper Cutoffs in the Mass Functions of Young Star Clusters. ApJ 872 (1), pp. 93. External Links: Document, 1806.11192 Cited by: §V.3.
- The Sparkler: Evolved High-redshift Globular Cluster Candidates Captured by JWST. ApJ 937 (2), pp. L35. External Links: Document, 2208.02233 Cited by: §I.
- Calibrating Extinction-free Star Formation Rate Diagnostics with 33 GHz Free-free Emission in NGC 6946. ApJ 737 (2), pp. 67. External Links: Document, 1105.4877 Cited by: §V.4, §V.4.
- VLA Observations of the Nearby Merger NGC 4038/4039: H II Regions and Supernova Remnants in the “Antennae”. AJ 120 (2), pp. 670–696. External Links: Document Cited by: Appendix A, Appendix A, Appendix A, §I, §I, §I, §V.4, §V.4, §V.4, 2nd item, §VI.
- PARSEC V2.0: Stellar tracks and isochrones of low- and intermediate-mass stars with rotation. A&A 665, pp. A126. External Links: Document, 2207.08642 Cited by: §IV.1.
- Jet-powered Molecular Hydrogen Emission from Radio Galaxies. ApJ 724 (2), pp. 1193–1217. External Links: Document, 1009.4533 Cited by: §V.5, §V.5.
- Mass and Environment as Drivers of Galaxy Evolution in SDSS and zCOSMOS and the Origin of the Schechter Function. ApJ 721, pp. 193–221. External Links: 1003.4747, Document Cited by: §I.
- Duration and properties of the embedded phase of star formation in 37 nearby galaxies from PHANGS-JWST. arXiv e-prints, pp. arXiv:2507.01508. External Links: Document, 2507.01508 Cited by: §V.2.
- A parsec-resolution simulation of the Antennae galaxies: formation of star clusters during the merger. MNRAS 446 (2), pp. 2038–2054. External Links: Document, 1410.5754 Cited by: §I.
- A 3% Solution: Determination of the Hubble Constant with the Hubble Space Telescope and Wide Field Camera 3. ApJ 730 (2), pp. 119. External Links: Document, 1103.2976 Cited by: §I, §IV.1.
- Tracing the Earliest Stages of Star and Cluster Formation in 19 Nearby Galaxies with PHANGS-JWST and HST: Compact 3.3 m Polycyclic Aromatic Hydrocarbon Emitters and Their Relation to the Optical Census of Star Clusters. ApJ 983 (2), pp. 137. External Links: Document, 2412.07862 Cited by: 2nd item, §III.2, §III.2.
- PHANGS-JWST First Results: Dust-embedded Star Clusters in NGC 7496 Selected via 3.3 m PAH Emission. ApJ 944 (2), pp. L26. External Links: Document Cited by: §III.2, §III.2.
- The Mass Spectra of Giant Molecular Clouds in the Local Group. PASP 117, pp. 1403–1410. External Links: astro-ph/0508679, Document Cited by: §V.3.
- Emission-Line Intensities and Radial Velocities in the Interacting Galaxies NGC 4038-4039. ApJ 160, pp. 801. External Links: Document Cited by: §III.1.
- Stellar populations of early-type galaxies in different environments. II. Ages and metallicities. A&A 457 (3), pp. 809–821. External Links: Document, astro-ph/0604568 Cited by: §IV.1.
- Remnant of a “Wet” Merger: NGC 34 and Its Young Massive Clusters, Young Stellar Disk, and Strong Gaseous Outflow. AJ 133 (5), pp. 2132–2155. External Links: Document, astro-ph/0702645 Cited by: §I.
- GN-z11 in Context: Possible Signatures of Globular Cluster Precursors at Redshift 10. ApJ 966 (1), pp. 92. External Links: Document, 2303.04179 Cited by: §I.
- The Mid-Infrared Spectrum of Star-forming Galaxies: Global Properties of Polycyclic Aromatic Hydrocarbon Emission. ApJ 656 (2), pp. 770–791. External Links: Document, astro-ph/0610913 Cited by: §V.5.
- CO Aperture Synthesis of NGC 4038/39 (Arp 244). ApJ 349, pp. 492. External Links: Document Cited by: §V.1.
- PHANGS-HST: new methods for star cluster identification in nearby galaxies. MNRAS 509 (3), pp. 4094–4127. External Links: Document, 2106.13366 Cited by: §III.1.
- The formation of the young massive cluster B1 in the Antennae Galaxies (NGC 4038/NGC 4039) triggered by cloud-cloud collision. PASJ 73 (2), pp. 417–430. External Links: Document, 2005.04075 Cited by: §I.
- High star cluster formation efficiency in the strongly lensed Sunburst Lyman-continuum galaxy at z = 2.37. A&A 659, pp. A2. External Links: Document, 2106.10280 Cited by: §I.
- An extremely metal-poor star complex in the reionization era: Approaching Population III stars with JWST. A&A 678, pp. A173. External Links: Document, 2305.14413 Cited by: §I.
- UV-extended E-MILES stellar population models: young components in massive early-type galaxies. MNRAS 463 (4), pp. 3409–3436. External Links: Document, 1612.01187 Cited by: §IV.1.
- Evolutionary stellar population synthesis with MILES - I. The base models and a new line index system. MNRAS 404 (4), pp. 1639–1671. External Links: Document, 1004.4439 Cited by: §IV.1.
- The Infrared Properties of Embedded Super Star Clusters: Predictions from Three-dimensional Radiative Transfer Models. ApJ 729 (2), pp. 111. External Links: Document, 1101.3324 Cited by: §V.2.
- Discovery of Ancient Globular Cluster Candidates in The Relic, a Quiescent Galaxy at z=2.5. arXiv e-prints, pp. arXiv:2501.07627. External Links: Document, 2501.07627 Cited by: §I.
- Star Formation and Molecular Gas Diagnostics with Mid- and Far-infrared Emission. ApJ 948 (2), pp. 88. External Links: Document, 2212.00180 Cited by: §V.5.
- The Antennae Galaxies (NGC 4038/4039) Revisited: Advanced Camera for Surveys and NICMOS Observations of a Prototypical Merger. AJ 140, pp. 75–109. External Links: 1005.0629, Document Cited by: 3rd item, §I, §IV.3, §IV.3, §V.1, 2nd item, §VI.
- ALMA Observations of the Antennae Galaxies. I. A New Window on a Prototypical Merger. ApJ 795 (2), pp. 156. External Links: Document, 1410.4473 Cited by: §III.1.
- Hubble Space Telescope Observations of Young Star Clusters in NGC 4038/4039, “The Antennae” Galaxies. AJ 109, pp. 960. External Links: Document Cited by: §IV.3.
- The Luminosity Function of Young Star Clusters in “the Antennae” Galaxies (NGC 4038-4039). AJ 118 (4), pp. 1551–1576. External Links: Document, astro-ph/9907430 Cited by: §I.
- What Fraction of the Young Clusters in the Antennae Galaxies Are “Missing”?. AJ 124 (3), pp. 1418–1434. External Links: Document, astro-ph/0207100 Cited by: Appendix A, §I, §V.1.
- The Mass Function of Supergiant Molecular Complexes and Implications for Forming Young Massive Star Clusters in the Antennae (NGC 4038/4039). ApJ 599 (2), pp. 1049–1066. External Links: Document, astro-ph/0308545 Cited by: §I.
- The Mass Function of Young Star Clusters in the “Antennae” Galaxies. ApJ 527, pp. L81–L84. External Links: astro-ph/9911229, Document Cited by: §V.3.
Appendix A Identifying Infrared Counterparts to Radio Sources
Radio sources with a thermal component are likely to be the youngest, most massive clusters forming in the Antennae. In this Appendix, we investigate the infrared counterparts to radio sources in the high-resolution 6 cm and 4 cm catalog compiled by Neff and Ulvestad (2000), which is the largest, high-resolution catalog of radio sources in the Antennae currently available. He et al. (2022) published properties for a subset of these sources which are identified at 100, 200, and 345 GHz (from ALMA observations) from their cold dust emission.
Typically, objects with a spectral index , defined as , with are more likely to have a thermal component and hence to be an embedded star cluster, whereas non-thermal sources () are typically supernova remnants. In Table 3, we compile the coordinates, 6 cm flux, and spectral index (if available) for the 19 sources brighter than 200 Jy from Neff and Ulvestad (2000). Whitmore and Zhang (2002) previously found that % (11/13) of the bright, thermal radio sources in the Neff and Ulvestad (2000) catalog can be detected in the HST -band image, but did not study the objects individually or in the infrared.
| Region | RA | Dec | 6 cm Flux | Spectral | Notes |
|---|---|---|---|---|---|
| Name | (J2000) | (J2000) | (Jy) | Index () | |
| 1-2 | 12:01:53.52 | -18:53:10.5 | … | Nucleus-S | |
| 1-3 | 12:01:53.12 | -18:53:09.7 | bright Pa source, possible match with embedded #4 | ||
| 1-4 | 12:01:53.35 | -18:53:07.9 | bright, Pa source | ||
| 2-1 | 12:01:54.96 | -18:53:06.1 | WS80, brightest Pa source, embedded #9, He22 #1 | ||
| 2-2 | 12:01:54.52 | -18:53:05.4 | non-thermal, no Pa source | ||
| 2-6 | 12:01:54.58 | -18:53:03.4 | … | WS80 neighbor, bright Pa source, embedded #13, He22 #2 | |
| 3-5A | 12:01:54.78 | -18:52:51.1 | … | Firecracker region, Pa shell, no counterpart | |
| 3-5B | 12:01:54.71 | -18:52:51.4 | … | Firecracker region, Pa shell, no counterpart | |
| 4-2A | 12:01:55.34 | -18:52:49.2 | … | bright Pa, optical-NIR continuum source | |
| 4-2B | 12:01:55.38 | -18:52:48.0 | … | Pa shell, no obvious counterpart, He22 #6 | |
| 4-4 | 12:01:55.47 | -18:52:45.9 | Pa source, no 3.3m, He22 #7 | ||
| 4-5 | 12:01:55.71 | -18:52:42.8 | non-thermal, Pa shell, no counterpart | ||
| 4-7 | 12:01:55:14 | -18:52:40.6 | … | Pa shell, no counterpart, He22 #8 | |
| 4A-6 | 12:01:54.74 | -18:52:31.7 | bright Pa source embedded #30, He22 #9 | ||
| 4A-16 | 12:01:55.41 | -18:52:24.3 | … | Pa shell, no counterpart | |
| 6-1 | 12:01:54.58 | -18:51:56.7 | bright Pa source, embedded #35, He22 #13 | ||
| 7-8 | 12:01:53.02 | -18:52:02.3 | … | Nucleus-N | |
| 11-2B | 12:01:50.45 | -18:52:13.1 | … | Pa shell, no counterpart | |
| 8-4 | 12:01:52.13 | -18:52:21.1 | bright Pa, optical-NIR continuum source |

Figure 14 shows regions around each of the bright radio sources, including the southern and northern nuclei (regions 1-2 and 7-8), WS80 (2-1) and its neighbor (2-6). The color images are created from the m image (blue), m (green), and continuum subtracted Pa (red). The green cross shows the source coordinates from Neff and Ulvestad (2000). The circles in each stamp have radii of and , corresponding to the and radio positional uncertainties, respectively. The source identifiers correspond to those in Table 3. Three of these radio sources (2-2, 4-5, and 6-1) have spectral indices , which may indicate they are dominated by non-thermal emission, although with only two measurements the published values should be viewed with some caution. Eight other sources do not have published spectral indices at all. Below is our summary of infrared counterparts to each radio source listed in the Table.
-
•
Clusters with High Extinction: In addition to WS80 (2-1), radio sources 1-3 and 4A-6 have Pa emission and high Br/H and Pa/H flux ratios, and high A mag from our SED fitting. These three sources are fainter at 1.5m than at longer wavelengths, and are included in our embedded cluster catalog.
-
•
Clusters with Moderate Extinction: WS80’s neighbor (2-6) and radio source 6-1 has Pa emission and moderate Pa/H flux ratios. Both are included in our embedded cluster catalog, have best-fit extinction A mag, and are visible at all infrared and optical wavelengths covered by our images. Despite the low published spectral index of , which suggests that source 6-1 might be non-thermal, this radio source is clearly associated with a young star cluster.
-
•
Clusters with Little Extinction: Radio sources 4-2A and 8-4 both have Pa emission but low Br/H and Pa/H flux ratios. They have counterparts that are extended and bright at optical wavelengths, and were included in the HST-based cluster catalog of Whitmore et al. (2010). The radio emission is from very young clusters with little extinction.
-
•
Non-Thermal: Source 2-2 has no obvious Pa emission and source 4-5 shows diffuse Pa with a shell morphology. the spectral indices of these sources suggest they are dominated by non-thermal emission.
-
•
No obvious counterpart: We do not find an obvious peaked infrared source that could be a potential counterpart to radio sources 1-4, 3-5A, 3-5B, 4-2B, 4-4, 4-7, 4A-16, or 11-2B. Most of these have a partial Pa shell near the radio position. Sources 1-4 and 4-4 have a spectral index that suggests they have a thermal component while the rest do not have published spectral indices.
-
•
South and North Galaxy Nuclei: The nuclei of the south and north galaxies are radio sources 1-2 and 7-8, respectively.
The bright 6 cm radio sources in the Antennae appear to be somewhat heterogeneous in nature and include very young star clusters with a range of extinction, including some of the most highly extinguished sources in our embedded cluster sample. Most of the bright 6 cm sources however, are likely non-thermal and not associated with a stellar cluster.