Are Tools All We Need? Unveiling the Tool-Use Tax in LLM Agents
Abstract
Tool-augmented reasoning has become a popular direction for LLM-based agents, and it is widely assumed to improve reasoning and reliability. However, we demonstrate that this consensus does not always hold: in the presence of semantic distractors, tool-augmented reasoning does not necessarily outperform native CoT. To explain this performance gap, we propose a Factorized Intervention Framework that isolates the cost of prompt formatting, the overhead of the tool-calling protocol, and the actual gain from executing tools. Our analysis reveals a critical tradeoff: under semantic noise, the gains from tools often fail to offset the "tool-use tax", which is the performance degradation introduced by the tool-calling protocol itself. To address this, we introduce G-STEP, a lightweight inference-time gate to mitigate protocol-induced errors. While this yields partial recovery, our findings suggest that more substantial improvements still require strengthening the model’s intrinsic reasoning and tool-interaction capabilities.
gray!20
Are Tools All We Need? Unveiling the Tool-Use Tax in LLM Agents
Kaituo Zhang1 Zhen Xiong2,3 Mingyu Zhong1 Zhimeng Jiang4 Zhouyuan Yuan5 Zhecheng Li5 Ying Lin1 1University of Houston 2University of Southern California 3New York University 4Texas A&M University 5University of California, San Diego
1 Introduction
In recent years, augmenting large language models (LLMs) with external tools has become a central paradigm for extending reasoning and real-world task-solving capabilities. Function calling, search augmentation, and tool-augmented agents are widely regarded as effective ways to provide models with up-to-date information, precise computation, and access to external services (Zhang et al., 2026; Chen et al., 2023; Liu et al., 2025; Chen et al., 2025; Patil et al., 2025). Across recent progress in tool-use training and evaluation, a common assumption has emerged: tool use should improve performance and reliability.
However, this assumption has mostly been established under relatively clean input conditions. In realistic settings, model inputs often contain semantically related but reasoning-irrelevant context: information that is topically relevant, linguistically natural, and superficially plausible, yet unhelpful or misleading for the target reasoning chain. Recent studies show that such distractors can substantially disrupt reasoning-path selection and final accuracy, and that noisy external information may even amplify failures in reasoning and search-augmented systems (Xiong et al., 2025; Yang et al., 2025; Lee et al., 2026; Pham et al., 2026). These findings suggest that semantic distractors are a particularly revealing stress test for tool-conditioned reasoning, because they simultaneously challenge evidence selection, tool invocation, and the integration of external results.
At the same time, existing evaluations provide limited insight into this failure mode. Tool-use benchmarks mainly measure whether models can successfully call tools, while recent work on reasoning and agent evaluation increasingly argues that final-answer accuracy alone is insufficient for diagnosing intermediate failures (Chen et al., 2025; Lee and Hockenmaier, 2025; Zhou et al., 2025; Hwang et al., 2025; Ou et al., 2025; Winston and Just, 2025). Yet these lines of work still stop short of explaining a basic question that arises in noisy semantic settings: why can native chain-of-thought (CoT) outperform a full tool-augmented protocol, even when tools are available in principle? This gap is especially important for deployment, since failures in tool-augmented systems may stem not only from missing capabilities, but also from the mechanics of tool invocation and interaction itself (Cheng et al., 2026; Wang et al., 2026c).
In this work, we study the CoT–Tool gap under semantic distractors through four sequential research questions: whether the gap emerges, where the expected gains from tool use are lost, what mechanism explains when tool use helps or hurts, and whether such failures can be mitigated by lightweight inference-time control. To answer these questions, we construct two benchmark datasets, GSM8K-Sem-Distractor and HotPotQA-Sem-Distractor, propose a factorized intervention framework that decomposes the gap into style cost (), function-calling protocol overhead (), and computation gain (), introduce the capability overlap principle to explain why tool gains are often redundant with capabilities already present in native CoT, and validate this account with a lightweight G-STEP intervention. Rather than arguing that tools are broadly ineffective, our goal is to identify when tool augmentation breaks down under semantically noisy conditions and to explain why, complementing recent work on inference-time correction and robustness (Tie et al., 2025).
We summarize our contributions as follows:
-
•
We introduce a CoT-centered view of tool-use tax, using native CoT as the reference point to analyze when tool augmentation provides marginal benefit or incurs additional cost under semantic distractors.
-
•
We propose a factorized intervention framework that decomposes the CoT–Tool gap into Function Calling (FC)-style formatting cost, tool-use protocol overhead, and real tool-execution gain.
-
•
We identify a capability-overlap pattern behind the CoT–Tool gap: many apparent tool gains occur on cases already solvable by native CoT, so redundant tool benefits may fail to offset protocol-induced failures.
2 Methodology
2.1 Problem Setting: Semantic Distractor Stress Test
Most prior work evaluates models on clean benchmarks, whereas real-world inputs often contain semantically related noise. To better reflect this setting, we build a controllable augmentation pipeline that injects semantically relevant context into benchmark samples; we call the resulting data Sem-Distractor.
We consider four distractor types (examples in Appendix E): Thematic Background (TB), which adds topic-related but logically unhelpful background; Semantic Paraphrase (SP), which paraphrases evidence while preserving meaning; Parallel Entity Distractor (PED), which introduces semantically similar but entity-confounding hard negatives; and Hedged Uncertainty (HU), which adds hedging cues such as “reportedly” to simulate uncertain information sources.
Rather than treating semantic distractors as generic data augmentation, we use them as a controlled stress test to probe whether tool-conditioned reasoning remains beneficial under semantically relevant but logically unhelpful noise. This setting allows us to study not only whether tool use helps, but also when the protocol itself becomes a source of degradation.
2.2 A Factorized Intervention Framework
We begin by comparing standard CoT and Agent-Full on the semantic distractor benchmarks, and define their end-to-end performance gap as the difference in final-answer accuracy. The direction and magnitude of this gap are determined empirically. However, this comparison only captures the net accuracy difference and doesn’t reveal which components of the agentic pipeline drive the observed change. To disentangle these effects, we introduce the factorized intervention framework in Figure 1.

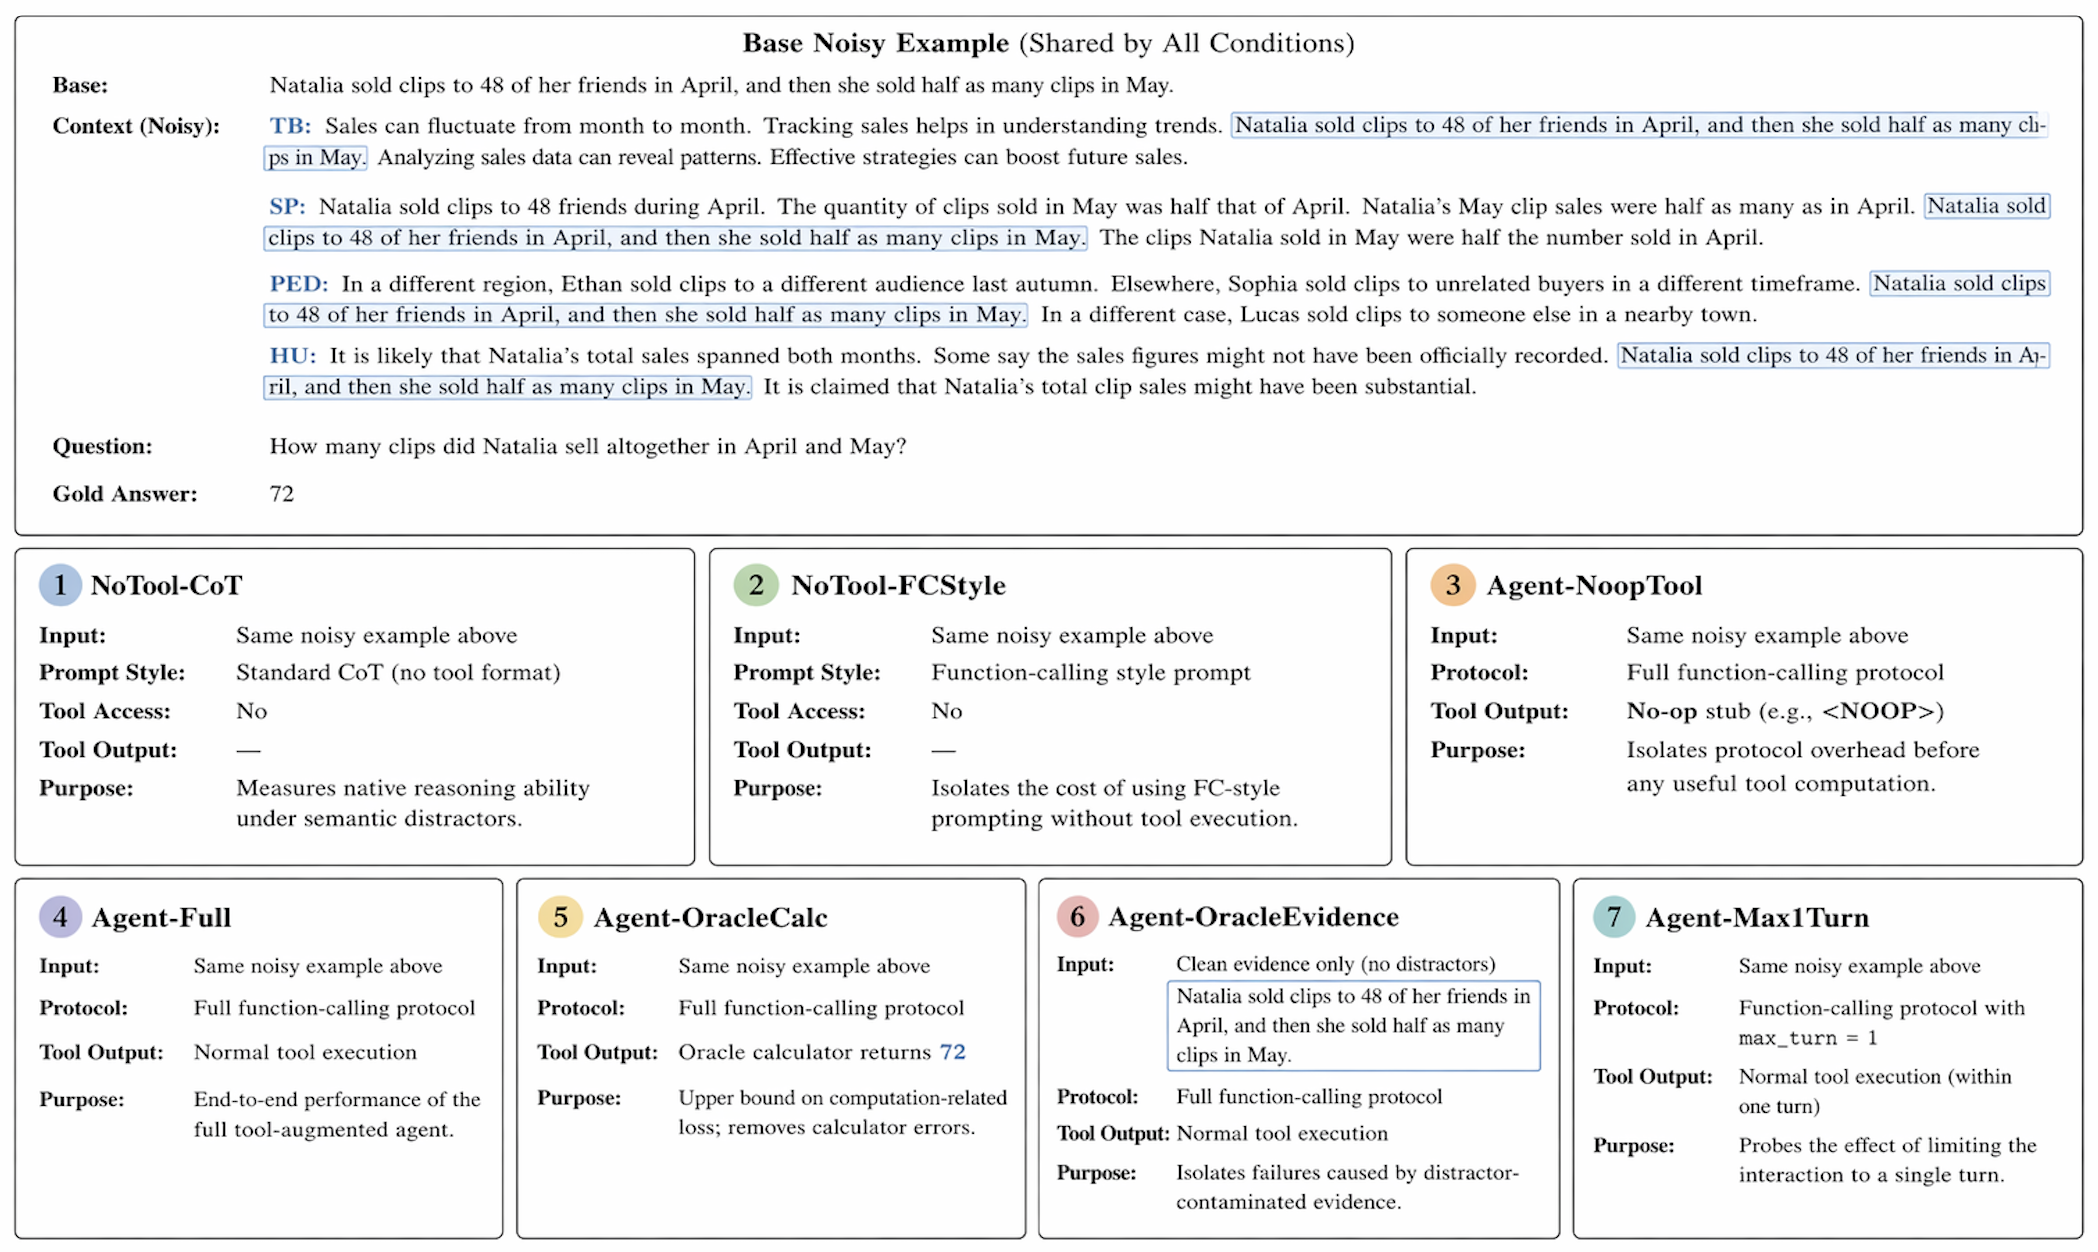
Figure 1 summarizes our seven-condition intervention framework. It consists of a primary decomposition chain from native reasoning to full tool-augmented reasoning: NoTool-CoT NoTool-FCStyle Agent-NoopTool Agent-Full. Each transition adds one component of the tool-use pipeline: NoTool-FCStyle isolates the cost of adopting the function-calling prompt format without tool access; Agent-NoopTool adds the tool-use interaction protocol while replacing tool outputs with a no-op stub, estimating protocol overhead before useful tool execution; and Agent-Full restores real tool execution, measuring the gain from actual tool logic.
The remaining conditions serve as diagnostic probes around Agent-Full. Agent-OracleCalc replaces tool outputs with the gold answer to bound computation-related losses; Agent-OracleEvidence provides clean evidence to isolate distractor-sensitive evidence-selection failures; and Agent-Max1Turn restricts the agent to a single FC turn to assess whether additional turns help or mainly add protocol overhead. Detailed definitions of all seven conditions are provided in Appendix C.
2.3 Gap Decomposition Metrics
Degradation chain and decomposition.
We define a degradation chain over four conditions that share the same noisy context but differ in protocol complexity:
| (1) |
Here, denotes Accuracy. isolates the performance cost of strict FC-style prompt formatting in the absence of actual tool access. measures the function-calling protocol overhead incurred before useful tool execution can provide any gain. Finally, captures the net impact of executing real tool logic. Together, these components yield a strict additive decomposition of the total performance gap:
| (2) |
We additionally define two auxiliary oracle probes for later bottleneck localization: , which upper-bounds computation-related losses, and , which isolates distractor-sensitive evidence-selection losses.
2.4 Analytical Protocol for Root-Cause Diagnosis
We move from aggregate decomposition to finer-grained diagnosis of individual failures through two complementary views: a trajectory-level view, which characterizes how a failure manifests in the execution trajectory, and a sample-level view, which identifies where it first arises on the degradation chain. We therefore introduce a three-stage analytical protocol: (i) a trajectory-level failure taxonomy that identifies the dominant symptom of each failed trajectory, (ii) a sample-level attribution scheme that maps each failure to its earliest degradation point on the chain, and (iii) a capability-overlap analysis that measures whether tool-derived gains are redundant with the model’s native reasoning ability.
Trajectory-Level Failure Taxonomy.
For each incorrect Agent-Full trajectory, we assign a primary failure label under a fixed priority order:
-
•
Type A (Under-computation): too few successful tool steps to complete the gold computation.
-
•
Type B (Tool-execution error): at least one tool call fails or returns invalid output.
-
•
Type C (Evidence drift): Evidence-F1 , indicating substantial reliance on irrelevant context.
-
•
Type D (Integration failure): the final tool output is correct, but the final prediction is not.
-
•
Type E (No successful output): no tool call produces a usable result.
-
•
Type F (Planning mismatch): the model follows a coherent but incorrect computation plan despite adequate evidence and functioning tools.
This taxonomy captures the observable symptom of a failed trajectory rather than its root cause.
Sample-Level Attribution.
While Types A–F characterize the surface symptom of a failed trajectory, they do not by themselves identify the principal source of degradation. We therefore further attribute each incorrect Agent-Full case to the earliest stage at which the sample becomes unsolved along the degradation chain in Eq. (1). This yields four mutually exclusive categories:
-
•
Genuine: the sample is already incorrect under CoT;
-
•
: the sample first becomes incorrect in FCStyle;
-
•
: the sample first becomes incorrect in NoopTool;
-
•
: the sample remains correct up to NoopTool but becomes incorrect only in Agent-Full.
This attribution scheme complements the A–F taxonomy by separating failure symptom from degradation source. The former describes how an execution trace fails; the latter identifies where the failure is introduced in the sequence of controlled interventions.
Capability Overlap Analysis.
To quantify the extent to which tool-derived gains provide capability beyond the model’s native reasoning path, we identify tool-benefited samples—cases where Agent-Full succeeds but the corresponding NoopTool control fails—and measure the fraction of such samples that are also solved by CoT. Let , , and denote binary correctness indicators for sample under the corresponding settings. We define
and compute the overlap ratio as
A high overlap ratio indicates that many samples apparently helped by real tool execution are also solvable through the model’s native reasoning path, suggesting substantial overlap between realized tool gains and the model’s internal capability. This quantity therefore serves as a diagnostic signal for whether tool use contributes unique external capability or primarily recovers performance already achievable without external calls.
2.5 Gate-Augmented Inference
Building on the analysis from Section 2.4, we hypothesize that for tasks dominated by protocol-induced failures, especially premature termination or under-computation within the FC loop, a lightweight gate may help mitigate these errors.
Gate Design.
We introduce G-STEP, a lightweight binary gate inserted at the termination point of the FC loop. When the model attempts to produce a final answer with no further tool calls, G-STEP decides whether to continue tool-conditioned interaction or commit to the current answer. The gate is trained to capture protocol-induced failures using CoT-fixability as the primary supervision signal: cases where the FC agent fails but standard CoT succeeds are treated as instances where additional protocol-level intervention may still help. If the gate predicts continue, the system injects a continuation prompt and requires one additional tool-conditioned step before re-attempting the answer. We also evaluate a +critic variant, inspired by CRITIC (Gou et al., 2024), which adds an explicit reflection step after calculator calls before the next tool action. This is motivated by our earlier finding that computation-chain errors dominate on GSM8K. Full details are provided in Appendix I.
3 Result & Analysis
3.1 Experiment Settings
This section summarizes the common experimental settings include the models, datasets, tool environments, and evaluation metrics. All prompts are provided in Appendix K.
Models.
We evaluate Qwen3-4B, Qwen3-32B, and GPT-4.1-mini as tool-enabled LLMs, covering open-source models at different scales and a closed-source counterpart. All models follow the same CoT, tool-augmented, and intervention protocols under a unified function-calling setup.
Datasets
Using the method in Section 2.1, we augment GSM8K (Cobbe et al., 2021) and HotpotQA (Yang et al., 2018) with GPT-4o-mini-generated distractors, yielding GSM8K-Sem-Distractor and HotpotQA-Sem-Distractor. For brevity, we refer to these two augmented benchmarks as GSM8K and HotpotQA in the rest of the paper, unless otherwise specified. Details are provided in Appendix F.
Tools & Metrics
We use task-specific toolsets. For GSM8K-Sem-Distractor benchmark, the agent is equipped only with a calculator. For HotpotQA-Sem-Distractor benchmark, the agent is equipped with search sentences, read sentences, compare values, and calculator.
We evaluate performance with Accuracy and Evidence-F1.
3.2 Semantic Distractor Stress Test
We evaluate Qwen3-4B, Qwen3-32B, and GPT-4.1-mini on GSM8K-Sem-Distractor under two settings: Agent-Full, which solves problems with tool use, and CoT, which relies on direct chain-of-thought reasoning. Implementation details of tool use are provided in Appendix G.
| Model | Setting | Base | TB | PED | HU | SP | Overall |
|---|---|---|---|---|---|---|---|
| GPT-4.1-mini | AF | 75.40 | 76.00 | 76.60 | 77.80 | 77.20 | 76.60 |
| GPT-4.1-mini | CoT | 93.20 | 91.00 | 89.20 | 90.40 | 89.80 | 90.72 |
| Qwen3-4B | AF | 51.20 | 54.20 | 48.00 | 57.40 | 49.60 | 52.08 |
| Qwen3-4B | CoT | 91.00 | 86.80 | 81.40 | 83.60 | 84.40 | 85.44 |
| Qwen3-32B | AF | 77.60 | 76.60 | 73.80 | 73.20 | 77.60 | 75.76 |
| Qwen3-32B | CoT | 94.00 | 92.80 | 89.40 | 89.80 | 91.00 | 91.40 |
Table 1 shows a consistent pattern across all three models: CoT substantially outperforms Agent-Full on GSM8K-Sem-Distractor. The overall gaps are 14.12, 33.36, and 15.64% for GPT-4.1-mini, Qwen3-4B, and Qwen3-32B, respectively. This result indicates that, in the presence of semantic distractors, adding tool use and multi-step agent protocols does not automatically improve robustness and can instead lead to substantial degradation.
Among distractor variants, PED is consistently one of the most challenging settings, particularly for CoT and the Qwen models. This indicates that entity-level semantic confusion is especially disruptive to evidence selection and downstream reasoning. Other distractor types show milder and less consistent effects, with only occasional small gains under Agent-Full for Qwen3-4B.
Overall, the CoT–Tool gap persists across models and distractor variants, indicating that tool-augmented reasoning can become vulnerable when semantic noise interacts with the tool-use protocol. We therefore turn to controlled interventions and mechanism-level analysis to explain where this degradation arises.
3.3 Identify the CoT-Tool Gap from the Intervention Framework
| Condition | GSM8K | HotPotQA | ||||
|---|---|---|---|---|---|---|
| Qwen3-4B | Qwen3-32B | GPT-4.1-mini | Qwen3-4B | Qwen3-32B | GPT-4.1-mini | |
| NoTool-CoT | 85.44 | 91.40 | 90.72 | 74.79 | 84.15 | 87.06 |
| NoTool-FCStyle | 84.84 | 78.56 | 86.76 | 70.92 | 83.98 | 85.66 |
| Agent-NoopTool | 30.64 | 50.92 | 48.84 | 56.69 | 82.07 | 84.87 |
| Agent-Full | 52.08 | 75.76 | 76.60 | 72.32 | 83.03 | 86.44 |
| Agent-Max1Turn | 47.72 | 75.88 | 72.88 | 69.97 | 83.19 | 86.22 |
| Agent-OracleCalc | 89.20 | 93.40 | 82.24 | 93.05 | 90.70 | 91.71 |
| Agent-OracleEvid | 52.48 | 79.72 | 76.00 | 74.40 | 84.82 | 86.67 |
Based on the Factorized Intervention Framework, Table 2 reports overall Accuracy and Evidence-F1 across the seven experimental conditions. We analyze the average performance across all noisy variants. Detailed results for individual noise conditions are provided in Appendix L.
Three observations emerge from Table 2. First, NoTool-CoT achieves the best non-oracle accuracy across all task–model pairs, confirming that tool augmentation does not automatically improve robustness under semantic distractors. Second, the oracle probes suggest that the main bottleneck lies in the computation and tool-interaction chain rather than in evidence quality alone. For example, Agent-OracleCalc yields large gains over Agent-Full on Qwen3-4B, improving accuracy from 52.08% to 89.20% on GSM8K and from 72.32% to 93.05% on HotPotQA, whereas Agent-OracleEvid changes performance only marginally in comparison. Third, the degradation is strongly task-dependent: on GSM8K, Agent-Full trails CoT by 14.12–33.36% across models, while on HotPotQA the gap is only 0.62–2.47%. This contrast suggests that tool-use tax is amplified in sequential computation tasks, where errors introduced by the function-calling protocol can propagate through the reasoning chain, but is milder in retrieval-oriented QA settings where partial evidence or parametric knowledge may help compensate for imperfect tool interaction.
Decomposing the Performance Gap.
Table 3 factorizes the aggregate CoT-to-Tool gap into its three components: , , and .
| Task | Model | Net | |||
|---|---|---|---|---|---|
| GSM8K | 4B | +21.44 | 54.20 | 0.60 | 33.36 |
| 32B | +24.84 | 27.64 | 12.84 | 15.64 | |
| GPT | +27.76 | 37.92 | 3.96 | 14.12 | |
| HotPotQA | 4B | +15.63 | 14.23 | 3.87 | 2.47 |
| 32B | +0.96 | 1.91 | 0.17 | 1.12 | |
| GPT | +1.57 | 0.78 | 1.40 | 0.62 |
This decomposition sharpens the counterintuitive finding: real tool execution can provide measurable gains, yet these gains may still be insufficient to offset the cost of entering the tool-use protocol. On GSM8K, is consistently positive, but is the dominant negative component; for Qwen3-4B, for example, the protocol penalty is more than twice the tool-execution gain. This indicates that the problem is not the absence of useful computation, but that protocol overhead can corrupt more performance than tool execution recovers. HotPotQA presents a milder regime, where protocol costs are smaller and more easily offset by tool gains, leading to a much smaller CoT–Tool gap. Together, these results suggest that tool augmentation is not automatically beneficial: its value depends on whether realized tool gains are sufficiently complementary to overcome the surrounding protocol cost.
Bottleneck Localization.
The oracle conditions show that computation quality—rather than evidence noise—is the primary limiting factor. Oracle computation yields large gains, whereas oracle evidence brings only modest improvements (Appendix A). This motivates a closer examination of how errors arise within individual execution traces, which we address next.
3.4 Decompose the CoT-Tool Gap
We next apply the diagnosis protocol from Section 2.4 to distinguish genuine capability gaps from protocol-induced degradation. Each incorrect Agent-Full prediction is attributed to its earliest failure point along Eq. (1). Table 4 summarizes the sample-level attribution, and Table 5 cross-tabulates these sources with the A–F failure taxonomy on GSM8K.
| Task | Model | Gen. | Proto. | ||||
|---|---|---|---|---|---|---|---|
| GSM8K | 4B | 1198 | 20.6 | 11.4 | 58.7 | 9.3 | 79.4 |
| GSM8K | 32B | 606 | 24.1 | 24.9 | 45.5 | 5.4 | 75.8 |
| GSM8K | GPT | 585 | 30.3 | 12.1 | 44.6 | 13.0 | 69.7 |
| HotPotQA | 4B | 494 | 77.3 | 8.5 | 7.1 | 7.1 | 22.7 |
| HotPotQA | 32B | 303 | 73.3 | 7.6 | 13.2 | 5.9 | 26.7 |
| HotPotQA | GPT | 242 | 62.8 | 28.5 | 2.9 | 5.8 | 37.2 |
| Model | Type | Gen. | ||||
|---|---|---|---|---|---|---|
| 4B | A Under-comp. | 700 | 20.0 | 10.7 | 61.4 | 7.9 |
| C Evid. drift | 281 | 23.5 | 13.2 | 54.1 | 9.3 | |
| D Integr. fail | 11 | 0.0 | 9.1 | 36.4 | 54.5 | |
| F Plan. mis. | 195 | 19.5 | 11.8 | 56.4 | 12.3 | |
| 32B | A Under-comp. | 423 | 22.9 | 23.9 | 47.8 | 5.4 |
| C Evid. drift | 94 | 31.9 | 23.4 | 40.4 | 4.3 | |
| D Integr. fail | 17 | 5.9 | 35.3 | 52.9 | 5.9 | |
| F Plan. mis. | 54 | 25.9 | 35.2 | 37.0 | 1.9 | |
| GPT | A Under-comp. | 297 | 35.7 | 11.1 | 42.4 | 10.8 |
| C Evid. drift | 120 | 37.5 | 10.8 | 39.2 | 12.5 | |
| D Integr. fail | 93 | 1.1 | 8.6 | 64.5 | 25.8 | |
| F Plan. mis. | 63 | 27.0 | 25.4 | 42.9 | 4.8 |
Table 4 reveals a robust task dichotomy. On GSM8K, a large majority of Agent-Full errors are protocol-induced: 79.4% for Qwen3-4B, 75.8% for Qwen3-32B, and 69.7% for GPT-4.1-mini. In all three cases, is the dominant source, accounting for 58.7%, 45.5%, and 44.6% of all failures, respectively. By contrast, HotPotQA is dominated by genuine failures under which both CoT and the agent fail, comprising 77.3% of errors for Qwen3-4B, 73.3% for Qwen3-32B, and 62.8% for GPT-4.1-mini. Protocol-induced errors therefore remain comparatively limited on HotPotQA, although GPT-4.1-mini exhibits a somewhat larger residual protocol component (37.2%), driven primarily by rather than .
Table 5 further shows that the A–F taxonomy captures failure symptoms rather than their underlying sources. On GSM8K, is the dominant attribution for Types A, C, and F across all models, suggesting that apparent under-computation, evidence drift, and planning mismatch often arise after entering the function-calling protocol rather than from intrinsic reasoning deficits. This pattern is not limited to the Qwen models: for GPT-4.1-mini, is also the largest contributor to Types A, C, and F, and even accounts for most Type D errors. These results highlight why trajectory-level symptoms alone can be misleading: failures that appear to be planning or integration errors may instead be downstream effects of protocol-induced degradation.
This distinction is consistent with the oracle analysis (Appendix B): OracleCalc largely removes Types A and F, OracleEvid suppresses Type C, and Type D remains the main residual bottleneck once computation errors are corrected. Overall, A–F categories describe how a trajectory fails, whereas the attribution identifies where that failure is introduced along the degradation chain.
The attribution analysis localizes where the losses arise, but it does not yet explain why the positive computation gain still fails to outweigh the protocol overhead in aggregate.
The Capability Overlap Principle.
This leads to a natural question: if real tool execution does provide useful computation, why does it still fail to offset the protocol tax? We answer this through capability overlap: the fraction of tool-benefited samples that are also solved by the model’s native CoT path.
| Task | Model | TB | CoT | Ovlp. (%) |
|---|---|---|---|---|
| GSM8K | 4B | 673 | 603 | 89.6 |
| 32B | 669 | 629 | 94.0 | |
| GPT | 780 | 744 | 95.4 | |
| HotPotQA | 4B | 332 | 292 | 88.0 |
| 32B | 58 | 39 | 67.2 | |
| GPT | 57 | 32 | 56.1 |
As shown in Table 6, capability overlap is extremely high on GSM8K across all three models: 89.6% for Qwen3-4B, 94.0% for Qwen3-32B, and 95.4% for GPT-4.1-mini. In other words, most samples that appear to benefit from real tool execution are already solvable by the model’s native CoT reasoning. Only 10.4%, 6.0%, and 4.6% of the tool-benefited GSM8K cases are genuinely tool-essential.Thus, can be positive yet insufficient to offset the tool-use tax, because much of the realized tool gain overlaps with native CoT while corrupts otherwise solvable examples.
HotPotQA exhibits a different pattern. Overlap remains high for Qwen3-4B (88.0%), but drops to 67.2% for Qwen3-32B and 56.1% for GPT-4.1-mini. This indicates that capability overlap alone does not determine degradation severity: GPT-4.1-mini still shows only a small Full–CoT gap on HotPotQA despite substantially lower overlap, implying that the net effect also depends on the absolute protocol cost imposed by the task.
We summarize this pattern as the Capability Overlap Principle: when tool-provided capability substantially overlaps with the model’s native reasoning ability, much of the realized tool gain becomes redundant with native CoT, while the tool-use protocol still incurs additional overhead. Under such conditions, a positive may still fail to offset the overall tool-use tax.
3.5 Cot-Tool Gap Mitigation
Table 7 reports the gate’s performance across all four configurations. The gate is trained and evaluated on disjoint question splits, and all reported scores are measured on held-out test sets.111Baselines in Table 7 are re-evaluated on the gate test split and may differ slightly from the full-dataset values reported in Table 2.
| Config | Full | Gate | +CRITIC | CoT | Gap | Cls. |
|---|---|---|---|---|---|---|
| GSM-4B | 50.64 | 69.12 | 74.88 | 82.64 | -32.00 | 75.75 |
| GSM-32B | 73.28 | 77.04 | 77.44 | 91.20 | -17.92 | 23.21 |
| GSM-GPT | 75.92 | 75.52 | 76.56 | 89.04 | -13.12 | 4.88 |
| Hot-4B | 73.18 | 74.97 | 74.53 | 76.87 | -3.69 | 48.51 |
| Hot-32B | 83.02 | 82.90 | 82.10 | 84.15 | -1.13 | — |
| Hot-GPT | 86.37 | 85.81 | 87.04 | 87.15 | -0.78 | 85.72 |
Analysis.
The gate’s effectiveness closely follows the task dichotomy revealed by the attribution analysis in Table 4: it yields substantial gains on GSM8K, where protocol-induced errors dominate, but only marginal or no benefit on HotPotQA, where most errors reflect genuine capability gaps. The strongest recovery appears on GSM8K-4B, where G-STEP improves accuracy from 50.64% to 69.12%, and the +critic variant further raises it to 74.88%, closing 75.75% of the Full-to-CoT gap. Gains are smaller on GSM8K-32B and HotPotQA-4B, and disappear on HotPotQA-32B, where errors are largely genuine rather than protocol-induced. This pattern suggests that gate-based intervention is most useful when failures are dominated by -type protocol errors, whereas settings dominated by genuine capability gaps require stronger model improvements rather than additional inference-time control. GPT-4.1-mini follows the same qualitative trend: +CRITIC slightly improves over Agent-Full on both tasks, but the gain is modest on GSM8K and largely reflects closure of an already small residual gap on HotPotQA. Detailed analysis is provided in Appendix I.7.
Robustness Across Distractor Types.
The effectiveness of gate-based control is broadly consistent across the four semantic distractor categories. In particular, the gains are more pronounced in fragile GSM8K settings and remain limited on HotPotQA, which is consistent with the protocol-vs-capability dichotomy in Table 4. Detailed variant-wise robustness results are provided in Appendix J.
4 Related Work
4.1 Tool-augmented reasoning and function calling
Recent research has explored tool augmentation and function calling as key directions for extending LLMs beyond language-only inference. ToolLLM (Qin et al., 2024) introduced large-scale tool-use data construction, training, and evaluation over real-world APIs, while later studies improved tool learning through high-quality synthetic data (Liu et al., 2025), structure-aware tool representation (Su et al., 2025), and token-level optimization with fine-grained error scoring (Huang et al., 2025). In parallel, recent benchmarks have shifted toward realistic and process-oriented evaluation, covering fine-grained tool-use abilities (Ye et al., 2024) and mobile-assistant function calling under multi-turn, imperfect, and shifting user instructions (Wang et al., 2025).
4.2 Fine-Grained Diagnosis of Reasoning and Agent Failures
Recent work increasingly argues that final-answer accuracy alone is insufficient for assessing reasoning quality. FineLogic (Zhou et al., 2025), Evaluating Step-by-step Reasoning Traces (Lee and Hockenmaier, 2025), Kim et al. (2025) all emphasize that intermediate reasoning traces reveal errors missed by outcome-only evaluation.
A similar shift has emerged in LLM agent evaluation. AgentDiagnose (Ou et al., 2025), Zhang et al. (2025), AgentFail (Ma et al., 2026), and PaperArena (Wang et al., 2026a) move beyond end-task success toward trajectory-level diagnosis, failure attribution, and root-cause analysis, a trend further summarized by recent survey work on LLM agent trajectory analysis (Wang et al., 2026b).
5 Conclusion
In this work, we studied the CoT–Tool gap under semantic distractors and showed that tool-augmented reasoning does not necessarily outperform native CoT. We analyzed this gap through a Factorized Intervention Framework, which decomposes tool gains and protocol costs into interpretable components, and further introduced the Capability Overlap Principle: many apparent tool gains arise on samples already solvable by native CoT, while the tool-calling protocol incurs broad additional overhead. We also showed that this analysis is actionable: a lightweight G-STEP intervention can partially mitigate protocol-induced failures, but its limited effect suggests that inference-time patching alone is insufficient for more substantial improvement. Overall, our findings suggest that tool augmentation is not universally beneficial: its value depends on whether tools provide genuinely complementary capability rather than redundant gains with added protocol burden.
References
- ACEBench: a comprehensive evaluation of LLM tool usage. In Findings of the Association for Computational Linguistics: EMNLP 2025, Suzhou, China. External Links: Link, Document Cited by: §1, §1.
- ChatCoT: tool-augmented chain-of-thought reasoning on chat-based large language models. External Links: 2305.14323, Link Cited by: §1.
- Investigating tool-memory conflicts in tool-augmented llms. External Links: 2601.09760, Link Cited by: §1.
- Training verifiers to solve math word problems. External Links: 2110.14168, Link Cited by: §3.1.
- CRITIC: large language models can self-correct with tool-interactive critiquing. External Links: 2305.11738, Link Cited by: §2.5.
- TTPA: token-level tool-use preference alignment training framework with fine-grained evaluation. In Findings of the Association for Computational Linguistics: EMNLP 2025, Suzhou, China. External Links: Link, Document Cited by: §4.1.
- Assessing llm reasoning steps via principal knowledge grounding. External Links: 2511.00879, Link Cited by: §1.
- Beyond the final answer: evaluating the reasoning trajectories of tool-augmented agents. External Links: 2510.02837, Link Cited by: §4.2.
- Evaluating step-by-step reasoning traces: a survey. External Links: 2502.12289, Link Cited by: §1, §4.2.
- Lost in the noise: how reasoning models fail with contextual distractors. External Links: 2601.07226, Link Cited by: §1.
- ToolACE: winning the points of llm function calling. External Links: 2409.00920, Link Cited by: §1, §4.1.
- Demystifying the lifecycle of failures in platform-orchestrated agentic workflows. External Links: 2509.23735, Link Cited by: §4.2.
- AgentDiagnose: an open toolkit for diagnosing LLM agent trajectories. In Proceedings of the 2025 Conference on Empirical Methods in Natural Language Processing: System Demonstrations, Suzhou, China. External Links: Link, Document Cited by: §1, §4.2.
- The berkeley function calling leaderboard (BFCL): from tool use to agentic evaluation of large language models. In Forty-second International Conference on Machine Learning, External Links: Link Cited by: §1.
- SealQA: raising the bar for reasoning in search-augmented language models. External Links: 2506.01062, Link Cited by: §1.
- ToolLLM: facilitating large language models to master 16000+ real-world APIs. In The Twelfth International Conference on Learning Representations, External Links: Link Cited by: §4.1.
- Toolscaler: scalable generative tool calling via structure-aware semantic tokenization. In Findings of the Association for Computational Linguistics: EMNLP 2025, Suzhou, China. External Links: Link, Document Cited by: §4.1.
- Can llms correct themselves? a benchmark of self-correction in llms. External Links: 2510.16062, Link Cited by: §1.
- PaperArena: an evaluation benchmark for tool-augmented agentic reasoning on scientific literature. External Links: 2510.10909, Link Cited by: §4.2.
- HammerBench: fine-grained function-calling evaluation in real mobile device scenarios. External Links: 2412.16516, Link Cited by: §4.1.
- A survey for llm agent trajectory analysis: from failure attribution to enhancement. Cited by: §4.2.
- AgentNoiseBench: benchmarking robustness of tool-using llm agents under noisy condition. External Links: 2602.11348, Link Cited by: §1.
- A taxonomy of failures in tool-augmented llms. In 2025 IEEE/ACM International Conference on Automation of Software Test (AST), Vol. , pp. 125–135. External Links: Document Cited by: §1.
- Mapping the minds of llms: a graph-based analysis of reasoning llm. External Links: 2505.13890, Link Cited by: §1.
- How is llm reasoning distracted by irrelevant context? an analysis using a controlled benchmark. External Links: 2505.18761, Link Cited by: §1.
- HotpotQA: a dataset for diverse, explainable multi-hop question answering. External Links: 1809.09600, Link Cited by: §3.1.
- ToolEyes: fine-grained evaluation for tool learning capabilities of large language models in real-world scenarios. External Links: 2401.00741, Link Cited by: §4.1.
- The llm data auditor: a metric-oriented survey on quality and trustworthiness in evaluating synthetic data. External Links: 2601.17717, Link Cited by: §1.
- Which agent causes task failures and when? on automated failure attribution of LLM multi-agent systems. In Forty-second International Conference on Machine Learning, External Links: Link Cited by: §4.2.
- Dissecting logical reasoning in llms: a fine-grained evaluation and supervision study. External Links: 2506.04810, Link Cited by: §1, §4.2.
Appendix A Bottleneck Localization: Oracle Bounds and Multi-Turn Utility.
The oracle conditions explicitly identify where the remaining performance potential resides (Table 8).
| Task | Model | |||
|---|---|---|---|---|
| GSM8K | 4B | +37.1 | +0.4 | +4.4 |
| 32B | +17.6 | +4.0 | 0.1 | |
| HotPot | 4B | +20.7 | +2.1 | +2.4 |
| 32B | +7.7 | +1.8 | 0.2 |
For GSM8K–4B, the potential oracle gain () is much larger than the context gain (), indicating that the main bottleneck lies in the computation chain rather than in evidence quality. For the 32B model, remains substantial (+17.6%), while increases to +4.0%, suggesting that evidence noise becomes more visible but still remains a secondary source of loss.
On HotPotQA, is also non-negligible (+20.7% for 4B and +7.7% for 32B), showing that even in a retrieval-centric setting, tool-mediated answer production remains an important bottleneck. Across configurations, is consistently larger than , suggesting that improving tool execution and computation quality is likely more beneficial than only denoising evidence.
Finally, multi-turn interaction exhibits a scale-dependent pattern: the 4B model benefits from additional interaction turns (+4.4% on GSM8K and +2.4% on HotPotQA), whereas the 32B model gains little ( on both tasks). This suggests that additional turns are useful mainly for weaker models, while for stronger models they may introduce protocol overhead without substantial information gain.
Appendix B A–F Distribution and Oracle Validation.
Table 9 reports the A–F distribution under Agent-Full and the two oracle conditions for GSM8K.
| Agent-Full | OracleCalc | OracleEvid | ||||
| Type | 4B | 32B | 4B | 32B | 4B | 32B |
| A | 58.4 | 69.8 | 0 | 0 | 77.8 | 78.3 |
| C | 23.5 | 15.5 | 34.1 | 23.0 | 0 | 0 |
| D | 0.9 | 2.8 | 65.6 | 73.9 | 2.4 | 7.1 |
| F | 16.3 | 8.9 | 0 | 0 | 18.9 | 11.6 |
Under Agent-Full, Type A is the dominant failure mode (58–70%), followed by Type C (16–24%) and Type F (9–16%). A surface reading would attribute these errors to insufficient computation and motivate larger reasoning budgets. The oracle conditions show a different picture. OracleCalc eliminates Types A and F while leaving Type C intact; OracleEvid eliminates Type C while leaving Types A and F intact. Meanwhile, Type D rises sharply under OracleCalc (66–74%), indicating that once computation is made reliable, the remaining bottleneck is integration: the agent fails to correctly consume and report tool outputs. This dissociation suggests that the A–F categories capture structurally distinct failure mechanisms.
Appendix C Detailed Condition Definitions
The seven experimental conditions differ in the specific component of the tool-use pipeline that is retained or intervened on.
In Agent-OracleCalc, the tool is still invoked, but directly returns the ground-truth answer, eliminating errors caused by malformed expressions or faulty tool use; the agent must still reason over the returned result and decide whether to output it. Agent-OracleEvidence provides an unperturbed, noise-free context to isolate the impact of distractors. Agent-Max1Turn does not impose a hard limit of one tool call; instead, it restricts the agent to a single protocol turn while still allowing multiple tool calls within that turn.
And we provide the example in Figure 2.
Appendix D Secondary Patterns in the Decomposition Analysis
Two secondary patterns further clarify these dynamics. First, the styling penalty is negligible for the 4B model on GSM8K (%) but moderate on HotPotQA (%), and becomes substantial for the 32B model on GSM8K (%). This highlights a task-dependent interaction with model scale: on GSM8K, the 32B model’s stronger reasoning chain is more vulnerable to FC formatting disruption (% vs. % for 4B), whereas on HotPotQA, where answers are shorter factoid spans, both models show minimal style sensitivity (%), with the 32B model being nearly unaffected (%).
Second, the contrast in across tasks is informative: on GSM8K, tools provide substantial but largely redundant computational gains (+21 to +25%) given the models’ intrinsic mathematical ability; on HotPotQA, tools offer smaller but more genuine information-acquisition utility, which helps explain the divergent net outcomes.
Appendix E Sem-Distractor Example
In this section, we provide the examples of Sem-Distractor in Table 10.
| Variant Type (Abbr.) | Perturbation Mechanism | Example from GSM8K |
|---|---|---|
| Base | The original, unmodified evidence sentence extracted directly from the dataset, serving as the ground truth. | “Natalia sold clips to 48 of her friends in April, and then she sold half as many clips in May.” |
| Thematic Background (TB) | Injects domain-relevant background knowledge using keywords from the question, providing contextually related but logically useless information. | “Clips are commonly sold in bulk during seasonal events.” |
| Semantic Paraphrase (SP) | Restates the original evidence to maintain semantic equivalence while altering the syntactic structure and vocabulary. | “In April, Natalia’s clip sales reached 48 units.” |
| Parallel Entity Distractor (PED) | Introduces an alternative entity (person or scenario) performing a similar action to serve as a hard negative distractor. | “Marcus sold clips to a different group of customers last summer.” / “Sarah sold clips during a separate event.” |
| Hedged Uncertainty (HU) | Wraps the evidence in epistemic markers (e.g., reportedly, some say) to simulate an unreliable or unverified information source. | “Natalia reportedly sold clips to a number of friends in April.” / “Some say the May sales might be about half.” |
Appendix F The Details of Semantic Distractors Dataset
F.1 The workflow of generating noisy dataset
To demonstrate the workflow more clearly, we give the pseudo-code in Algorithm 1.
F.2 The Examples of Noisy Dataset
In this section, we present a set of examples from the generated noisy dataset, as illustrated in Figure 3. In our work, the real dataset contains 22 distractor sentences. Therefore, the noise distribution is independent of the position.
Appendix G Tool-calling Agent Implementation Details
For all evaluated models, including GPT-4.1-mini and the Qwen series, we adopt the same function-calling(tool-calling) pipeline. GPT-4.1-mini is accessed through the OpenAI API, while Qwen models are served through vLLM. In both cases, the overall workflow remains the same:
-
1.
Model layer: The model decides whether to call a function and generates the corresponding call arguments.
-
2.
Service layer: The OpenAI API or vLLM chat.completions interface converts the model output into structured tool_calls.
-
3.
Execution layer: Python code executes the actual function (e.g., a local calculator), and the returned result is fed back to the model for subsequent reasoning.
This implementation therefore follows a unified and standard function-calling setup across different model families.
Appendix H Why high overlap leads to smaller degradation on HotPotQA
HotPotQA also exhibits substantial capability overlap. For Qwen3-4B, 88.0% of tool-benefited cases are also solved by CoT, indicating that retrieval often returns information already recoverable from the model’s parametric knowledge. However, despite this overlap, the net degradation on HotPotQA remains much smaller than on GSM8K (Table 3). One likely reason is task structure. GSM8K requires multi-step sequential computation, where disrupting a single intermediate step can invalidate the entire reasoning chain. HotPotQA, by contrast, relies more on factoid retrieval and evidence aggregation, allowing the model to recover from imperfect tool interaction through partial evidence or parametric knowledge. Thus, overlap alone does not determine degradation severity; it interacts with the task’s tolerance to protocol noise.
Appendix I G-STEP Design and Per-Configuration Analysis
I.1 Stage 1: Data Collection
The initial stage aims to obtain the raw performance data necessary to construct training labels. For each question (including multiple noise variants), the target Large Language Model (LLM) is evaluated under two independent conditions:
-
•
Tool-Augmented Baseline (): The model operates under the full function-calling (FC) protocol. For controlled intervention, the interaction is initialized with a required tool-use step, after which the model proceeds under a predefined maximum number of tool interactions. The model interacts with the environment to produce a final prediction.
-
•
Chain-of-Thought Baseline (): The identical model receives the same question context but without access to any external tools. The model relies purely on internal CoT reasoning to produce a final prediction.
Both conditions operate on the exact same question set, enabling a per-sample comparison to identify instances where the model possesses the intrinsic reasoning capacity to solve a problem (via CoT) but fails when utilizing the tool-use protocol.
In this work, the gate is trained on a disjoint question set (GSM8K: 250 train / 250 test; HotPotQA: 178 train / 179 test), and performance metrics are reported strictly on the held-out test split.
I.2 Stage 2: Label Construction and Feature Engineering
I.2.1 Label Construction
For each sample, a binary label (continue or commit) is assigned. This label indicates whether the model should have continued utilizing tools after its initial tool call, based on hindsight knowledge derived from the gold answer and CoT performance. The priority rules for label assignment are detailed in Table 11.
| Priority | Condition | Label | Rationale |
|---|---|---|---|
| 1 | answered correctly | commit | No intervention is required. |
| 2 | wrong, but correct | continue | Model reasoning is sufficient; the tool protocol caused the failure. |
| 3 | wrong, tool calls | continue | Under-compute heuristic: premature stopping without sufficient exploration. |
| 4 | wrong, none of the above | commit | Genuine reasoning failure; further continuation is unhelpful. |
I.2.2 Feature Engineering
The intermediate state of the model after its first tool call is abstracted into a 120-dimensional, inference-safe numeric vector. The feature set comprises two main categories:
-
•
Numeric Features (24 dimensions): Captures execution progress (e.g., budget remaining), output stability, consistency between predictions and reasoning, reasoning signals (e.g., uncertainty indicators), evidence proxy, and tool trace properties.
-
•
Hashed Text Features (96 dimensions): Captures textual patterns via the hashing trick (MD5 mapping to bin indices followed by normalization). The reasoning text yields a 64-dimensional vector, and the last tool output yields a 32-dimensional vector.
I.3 Stage 3: Gate Training
A binary classifier is trained to predict the probability of continuation, , given the 120-dimensional feature vector.
-
•
Model Architecture: Input features are standardized to zero-mean and unit-variance. The classifier is a two-layer Multilayer Perceptron (MLP) with 128 and 64 hidden units, utilizing ReLU activation functions.
-
•
Optimization Strategy: The model is optimized using Adam with a learning rate of and regularization (). Early stopping is applied using a 10% validation split with a patience of 20 epochs.
-
•
Sample Weighting: Labels are weighted by confidence levels derived from evidence specificity: strong (), medium (), and weak (), with additional boosts applied for targeted error heuristics.
-
•
Cross-Validation: A 5-fold GroupKFold validation is employed, grouped by question ID to strictly prevent information leakage across noise variants.
I.4 Stage 4: Gate-Augmented Inference
During the online inference phase, the trained gate is deployed dynamically inside the function-calling loop. When the model generates a final text without tool calls (attempting to submit), the gate evaluates the current state:
-
1.
Extract the 120-dimensional feature vector using the identical feature engineering protocol established during training.
-
2.
The MLP classifier outputs the probability .
-
3.
If (where the threshold is empirically set to ), the gate triggers a continue decision. A continuation prompt (e.g., a CRITIC prompt forcing natural language reasoning prior to the next action) is injected into the context, forcing the model to initiate at least one additional tool call.
-
4.
If , the gate decides to commit, and the model’s current answer is accepted as final.
To ensure robustness, safety mechanisms including a maximum limit on extra turns (e.g., 3 extra turns), no-progress detection, and duplicate expression detection are implemented to prevent infinite generation loops.
I.5 Training of Gate
In this section, we provide the pseudocode for the training workflow of the gate in Algorithm 2.
I.6 Inference with Gate
In this section, we provide the pseudocode for the inference workflow with the gate in Algorithm 3.
I.7 Per-Configuration Analysis of Gate Effectiveness
The gate’s behavior varies substantially across task–model settings, in ways that closely match the decomposition-based attribution analysis.
GSM8K-4B.
GSM8K-4B is the most favorable setting for the gate, as it combines the largest performance gap (%) with the highest share (58.7% of all errors; Table 4). G-STEP alone improves accuracy from 50.64% to 69.12% (+18.48%). Adding critic prompts further raises accuracy to 74.88%, closing 75.75% of the gap. This additional gain (+5.76%) supports our earlier finding that GSM8K errors are primarily computation-chain failures (Types A and F): explicit reflection helps the weaker model identify arithmetic mistakes and produce better corrective tool-use strategies.
GSM8K-32B.
GSM8K-32B provides a revealing contrast. Although protocol-induced errors remain prevalent overall (75.8%; Table 4), gap closure reaches only 23.21%. Two factors likely explain this. First, a much larger share of the 32B model’s protocol-induced errors comes from (24.9% vs. 11.4% for 4B), i.e., format-sensitivity errors that additional tool turns cannot repair because the degradation occurs at the prompting stage rather than during iterative tool use. Second, even within the targeted errors, the 32B model appears less able to generate genuinely new corrective strategies in later turns. The minimal critic gain (+0.40%) is consistent with this interpretation and with the observation in §2.4 that larger models are more sensitive to rigid format constraints than to invocation mechanics.
HotPotQA-4B.
HotPotQA-4B presents a much narrower gap (%), and 77.3% of Agent-Full errors are genuine capability gaps (Table 4). The gate improves accuracy from 73.18% to 74.97%, a modest +1.79% gain. Although this corresponds to 48.51% gap closure, the absolute improvement is limited by the small protocol-induced error budget (22.7%). The critic variant (74.53%) performs slightly worse than the base gate, suggesting that on retrieval-heavy tasks, direct tool re-engagement is more useful than interleaved verbal reflection.
HotPotQA-32B.
HotPotQA-32B is the most constrained setting: the gap is only %, and 73.3% of errors are genuine. Accordingly, the gate provides no measurable improvement (83.02% 82.90%), while critic further reduces accuracy to 82.10%. This directly supports our decomposition: when most errors arise from a genuine inability to synthesize information across passages, additional tool turns offer little help. The bottleneck lies in underlying reasoning capability rather than protocol execution.
Appendix J Variant-wise Robustness Under Semantic Distractors

Figure 4 reports accuracy across the four semantic distractor categories (TB, SP, PED, HU) for Qwen3-4B and Qwen3-32B on GSM8K and HotPotQA. Across variants, Gate and Gate+CRITIC consistently improve over Agent-Full, indicating that gate-based control mitigates part of the degradation introduced by semantic distractors. The effect is most pronounced in fragile GSM8K settings; for example, on GSM8K-4B under PED, accuracy increases from 44.4% to 70.4% with Gate+CRITIC. This suggests that dynamic routing is not only an average-case improvement, but also a robustness mechanism against semantically relevant noise.
At the same time, CoT remains the strongest overall reference under distractors. Across variants, gated tool use narrows but does not eliminate the gap to CoT, suggesting that multi-turn tool interaction remains more vulnerable to distractor amplification than internal reasoning. This limitation is especially visible on HotPotQA-32B, where all methods remain tightly clustered, indicating that when the dominant bottleneck is genuine information synthesis rather than protocol execution, robustness gains from gate-based control are inherently limited.
Overall, the variant-wise results support the same qualitative conclusion as the main text: semantic distractors consistently expose the CoT–Tool gap, while gate-based control provides partial but not complete mitigation, with larger benefits in protocol-dominated settings than in capability-dominated ones.
Appendix K Prompt
K.1 The Prompt for Generating Sem-Distractor
In this section, we provide the prompts for generating distractors in Figure 5, Figure 6, Figure 7 and Figure 8.
K.2 The Prompt for Intervention Framework
K.3 The Prompt for Gate Mitigation
In this section, we provide the prompts for Gate and Gate+Critic.
The Original Gate prompt is in Figure 11.
The difference between original gate prompt and critic gate is the critic-style prompt tends to perform explicit verbal reasoning first, and then decides whether to re-trigger the tool.
Appendix L Results in Noisy Condition
In this section, we provide the full detailed results for GSM8K and HotPotQA across all conditions, variants, and metrics. The results are shown in Table 12, Table 13 and Table 14.
| Condition | Metric | Qwen3-4B | Qwen3-32B | ||||||||||
|---|---|---|---|---|---|---|---|---|---|---|---|---|---|
| Base | TB | PED | HU | SP | Overall | Base | TB | PED | HU | SP | Overall | ||
| NoTool-CoT | Acc (%) | 91.00 | 86.80 | 81.40 | 83.60 | 84.40 | 85.44 | 94.00 | 92.80 | 89.40 | 89.80 | 91.00 | 91.40 |
| Ev-F1 (%) | 89.78 | 89.72 | 89.99 | 78.15 | 19.44 | 73.41 | 92.48 | 93.35 | 95.24 | 85.89 | 35.00 | 80.39 | |
| AvgCalls | 0.00 | 0.00 | 0.00 | 0.00 | 0.00 | 0.00 | 0.00 | 0.00 | 0.00 | 0.00 | 0.00 | 0.00 | |
| NoTool-FCStyle | Acc (%) | 85.80 | 85.80 | 82.20 | 86.60 | 83.80 | 84.84 | 80.00 | 80.40 | 75.40 | 76.40 | 80.60 | 78.56 |
| Ev-F1 (%) | 85.70 | 90.80 | 92.12 | 82.01 | 19.53 | 74.03 | 89.45 | 95.14 | 96.71 | 88.53 | 33.34 | 80.63 | |
| AvgCalls | 0.00 | 0.00 | 0.00 | 0.00 | 0.00 | 0.00 | 0.00 | 0.00 | 0.00 | 0.00 | 0.00 | 0.00 | |
| Agent-NoopTool | Acc (%) | 34.40 | 29.40 | 29.80 | 30.40 | 29.20 | 30.64 | 53.40 | 50.40 | 50.40 | 49.20 | 51.20 | 50.92 |
| Ev-F1 (%) | 84.13 | 87.92 | 87.60 | 82.57 | 20.56 | 72.56 | 89.31 | 93.21 | 95.44 | 87.97 | 30.00 | 79.18 | |
| AvgCalls | 1.07 | 1.17 | 1.22 | 1.25 | 1.38 | 1.22 | 1.00 | 1.02 | 1.02 | 1.03 | 1.05 | 1.02 | |
| Agent-Full | Acc (%) | 51.20 | 54.20 | 48.00 | 57.40 | 49.60 | 52.08 | 77.60 | 76.60 | 73.80 | 73.20 | 77.60 | 75.76 |
| Ev-F1 (%) | 84.78 | 87.81 | 88.77 | 83.11 | 19.45 | 72.78 | 89.01 | 93.02 | 95.26 | 87.42 | 30.03 | 78.95 | |
| AvgCalls | 1.26 | 1.35 | 1.39 | 1.43 | 1.59 | 1.41 | 1.03 | 1.04 | 1.04 | 1.04 | 1.12 | 1.05 | |
| Agent-Max1Turn | Acc (%) | 47.40 | 50.80 | 44.40 | 53.00 | 43.00 | 47.72 | 78.60 | 76.20 | 73.20 | 73.80 | 77.60 | 75.88 |
| Ev-F1 (%) | 69.85 | 72.82 | 76.74 | 69.36 | 15.73 | 60.90 | 87.96 | 91.57 | 94.52 | 87.02 | 29.74 | 78.16 | |
| AvgCalls | 1.26 | 1.36 | 1.36 | 1.42 | 1.59 | 1.40 | 1.01 | 1.04 | 1.03 | 1.03 | 1.06 | 1.03 | |
| Agent-OracleCalc | Acc (%) | 87.20 | 92.60 | 91.40 | 88.80 | 86.00 | 89.20 | 94.40 | 91.80 | 95.00 | 93.00 | 92.80 | 93.40 |
| Ev-F1 (%) | 84.09 | 88.08 | 89.24 | 83.47 | 20.13 | 73.00 | 89.17 | 93.38 | 95.18 | 87.75 | 30.19 | 79.13 | |
| AvgCalls | 1.20 | 1.28 | 1.34 | 1.37 | 1.55 | 1.35 | 1.00 | 1.02 | 1.02 | 1.03 | 1.10 | 1.03 | |
| Agent-OracleEvid | Acc (%) | 50.00 | 53.00 | 53.00 | 53.20 | 53.20 | 52.48 | 78.80 | 79.80 | 80.00 | 80.00 | 80.00 | 79.72 |
| Ev-F1 (%) | 84.17 | 85.20 | 85.23 | 85.19 | 85.19 | 84.99 | 89.08 | 90.47 | 90.45 | 90.45 | 90.45 | 90.18 | |
| AvgCalls | 1.28 | 1.24 | 1.24 | 1.24 | 1.24 | 1.25 | 1.02 | 1.03 | 1.03 | 1.03 | 1.03 | 1.03 | |
| Condition | Metric | Qwen3-4B | Qwen3-32B | ||||||||||
|---|---|---|---|---|---|---|---|---|---|---|---|---|---|
| Base | TB | PED | HU | SP | Overall | Base | TB | PED | HU | SP | Overall | ||
| NoTool-CoT | Acc (%) | 75.63 | 76.19 | 73.95 | 74.23 | 73.95 | 74.79 | 83.75 | 83.19 | 84.87 | 84.87 | 84.03 | 84.15 |
| Ev-F1 (%) | 59.72 | 60.03 | 60.70 | 56.07 | 28.62 | 53.03 | 56.86 | 58.51 | 59.10 | 55.41 | 25.05 | 50.99 | |
| AvgCalls | 0.00 | 0.00 | 0.00 | 0.00 | 0.00 | 0.00 | 0.00 | 0.00 | 0.00 | 0.00 | 0.00 | 0.00 | |
| NoTool-FCStyle | Acc (%) | 71.15 | 71.99 | 69.75 | 69.75 | 71.99 | 70.92 | 85.15 | 84.87 | 82.91 | 83.19 | 83.75 | 83.98 |
| Ev-F1 (%) | 48.56 | 59.30 | 57.75 | 49.65 | 26.15 | 48.28 | 54.53 | 57.64 | 58.52 | 53.81 | 25.22 | 49.95 | |
| AvgCalls | 0.00 | 0.00 | 0.00 | 0.00 | 0.00 | 0.00 | 0.00 | 0.00 | 0.00 | 0.00 | 0.00 | 0.00 | |
| Agent-NoopTool | Acc (%) | 49.30 | 59.10 | 52.66 | 57.42 | 64.99 | 56.69 | 84.03 | 81.79 | 80.39 | 80.95 | 83.19 | 82.07 |
| Ev-F1 (%) | 10.89 | 20.68 | 17.30 | 22.23 | 16.01 | 17.42 | 51.10 | 54.58 | 55.54 | 49.88 | 21.79 | 46.58 | |
| AvgCalls | 1.06 | 1.08 | 1.09 | 1.06 | 1.07 | 1.07 | 1.07 | 1.12 | 1.20 | 1.13 | 1.16 | 1.13 | |
| Agent-Full | Acc (%) | 74.51 | 73.67 | 70.87 | 71.43 | 71.15 | 72.32 | 84.59 | 83.75 | 80.11 | 83.47 | 83.19 | 83.03 |
| Ev-F1 (%) | 47.01 | 52.19 | 49.44 | 46.25 | 32.74 | 45.53 | 48.34 | 50.70 | 51.19 | 48.89 | 27.86 | 45.40 | |
| AvgCalls | 1.06 | 1.08 | 1.09 | 1.06 | 1.08 | 1.07 | 1.06 | 1.11 | 1.17 | 1.14 | 1.15 | 1.13 | |
| Agent-Max1Turn | Acc (%) | 71.99 | 70.03 | 68.91 | 69.47 | 69.47 | 69.97 | 84.03 | 84.03 | 80.67 | 83.47 | 83.75 | 83.19 |
| Ev-F1 (%) | 45.51 | 49.40 | 46.26 | 43.23 | 31.28 | 43.14 | 49.48 | 51.15 | 51.87 | 47.97 | 27.91 | 45.68 | |
| AvgCalls | 1.00 | 1.00 | 1.00 | 1.00 | 1.00 | 1.00 | 0.97 | 0.97 | 0.96 | 0.97 | 0.97 | 0.97 | |
| Agent-OracleCalc | Acc (%) | 93.00 | 93.56 | 92.16 | 93.28 | 93.28 | 93.05 | 92.16 | 91.32 | 89.08 | 91.60 | 89.36 | 90.70 |
| Ev-F1 (%) | 38.60 | 44.04 | 45.09 | 39.62 | 21.78 | 37.82 | 50.71 | 53.83 | 53.94 | 50.32 | 22.18 | 46.19 | |
| AvgCalls | 1.07 | 1.08 | 1.09 | 1.06 | 1.07 | 1.07 | 1.04 | 1.10 | 1.19 | 1.12 | 1.14 | 1.12 | |
| Agent-OracleEvid | Acc (%) | 74.51 | 73.95 | 74.51 | 74.51 | 74.51 | 74.40 | 84.87 | 83.75 | 85.15 | 85.15 | 85.15 | 84.82 |
| Ev-F1 (%) | 47.01 | 47.39 | 47.82 | 47.82 | 47.82 | 47.57 | 49.17 | 49.60 | 49.77 | 49.81 | 49.81 | 49.63 | |
| AvgCalls | 1.06 | 1.09 | 1.08 | 1.08 | 1.08 | 1.08 | 1.07 | 1.06 | 1.10 | 1.10 | 1.10 | 1.08 | |
| Condition | Metric | GSM8K | HotPotQA | ||||||||||
|---|---|---|---|---|---|---|---|---|---|---|---|---|---|
| Base | TB | PED | HU | SP | Overall | Base | TB | PED | HU | SP | Overall | ||
| NoTool-CoT | Acc (%) | 93.20 | 91.00 | 89.20 | 90.40 | 89.80 | 90.72 | 87.96 | 87.96 | 87.96 | 87.68 | 83.75 | 87.06 |
| Ev-F1 (%) | 90.99 | 94.44 | 95.62 | 86.86 | 25.91 | 78.76 | 49.47 | 52.26 | 53.10 | 50.07 | 22.48 | 45.48 | |
| AvgCalls | 0.00 | 0.00 | 0.00 | 0.00 | 0.00 | 0.00 | 0.00 | 0.00 | 0.00 | 0.00 | 0.00 | 0.00 | |
| NoTool-FCStyle | Acc (%) | 88.20 | 85.20 | 86.20 | 87.60 | 86.60 | 86.76 | 86.55 | 84.59 | 86.27 | 85.15 | 85.71 | 85.66 |
| Ev-F1 (%) | 88.60 | 96.40 | 96.44 | 88.52 | 25.49 | 79.09 | 60.10 | 66.01 | 65.97 | 62.04 | 27.38 | 56.30 | |
| AvgCalls | 0.00 | 0.00 | 0.00 | 0.00 | 0.00 | 0.00 | 0.00 | 0.00 | 0.00 | 0.00 | 0.00 | 0.00 | |
| Agent-NoopTool | Acc (%) | 48.20 | 48.00 | 46.00 | 49.80 | 52.20 | 48.84 | 85.43 | 84.87 | 84.59 | 84.87 | 84.59 | 84.87 |
| Ev-F1 (%) | 89.42 | 95.78 | 96.39 | 88.28 | 24.80 | 78.93 | 55.77 | 65.32 | 65.05 | 58.82 | 23.74 | 53.74 | |
| AvgCalls | 1.18 | 1.11 | 1.11 | 1.05 | 1.65 | 1.22 | 1.17 | 1.55 | 1.68 | 1.62 | 1.45 | 1.49 | |
| Agent-Full | Acc (%) | 75.40 | 76.00 | 76.60 | 77.80 | 77.20 | 76.60 | 87.11 | 85.99 | 87.11 | 86.55 | 85.43 | 86.44 |
| Ev-F1 (%) | 89.77 | 95.52 | 95.27 | 88.83 | 23.73 | 78.63 | 58.21 | 60.25 | 60.37 | 56.75 | 33.76 | 53.87 | |
| AvgCalls | 1.30 | 1.29 | 1.32 | 1.21 | 2.15 | 1.45 | 1.17 | 1.45 | 1.59 | 1.67 | 1.69 | 1.51 | |
| Agent-Max1Turn | Acc (%) | 72.00 | 74.20 | 70.80 | 73.60 | 73.80 | 72.88 | 86.55 | 85.99 | 85.71 | 85.99 | 86.83 | 86.22 |
| Ev-F1 (%) | 77.15 | 83.93 | 83.99 | 80.98 | 13.69 | 67.95 | 58.35 | 62.06 | 61.28 | 56.84 | 32.42 | 54.19 | |
| AvgCalls | 1.22 | 1.23 | 1.20 | 1.13 | 2.10 | 1.37 | 1.00 | 1.00 | 1.00 | 1.00 | 1.00 | 1.00 | |
| Agent-OracleCalc | Acc (%) | 84.20 | 85.40 | 82.60 | 82.60 | 76.40 | 82.24 | 91.88 | 92.16 | 91.04 | 92.72 | 90.76 | 91.71 |
| Ev-F1 (%) | 89.47 | 95.62 | 95.68 | 88.16 | 25.17 | 78.82 | 54.14 | 62.84 | 62.91 | 58.29 | 23.04 | 52.24 | |
| AvgCalls | 1.27 | 1.26 | 1.24 | 1.19 | 2.15 | 1.42 | 1.17 | 1.41 | 1.49 | 1.47 | 1.30 | 1.37 | |
| Agent-OracleEvid | Acc (%) | 74.00 | 77.20 | 76.80 | 76.40 | 75.60 | 76.00 | 87.39 | 86.27 | 86.55 | 86.55 | 86.55 | 86.67 |
| Ev-F1 (%) | 100.00 | 100.00 | 100.00 | 100.00 | 100.00 | 100.00 | 100.00 | 100.00 | 100.00 | 100.00 | 100.00 | 100.00 | |
| AvgCalls | 1.28 | 1.28 | 1.28 | 1.28 | 1.26 | 1.28 | 1.22 | 1.23 | 1.20 | 1.17 | 1.23 | 1.21 | |
Limitations
This document does not cover the content requirements for ACL or any other specific venue. Check the author instructions for information on maximum page lengths, the required “Limitations” section, and so on.