Double-Peaked Ly Emission during Reionization Requires
Nearby Voids and a Favorable Local Ionizing Background
Abstract
Several Lyman-alpha (Ly) emitters deep into the reionization era exhibit double-peaked Ly emission profiles, raising the question of how the intergalactic medium can transmit photons blueward of the Ly resonance at such high redshifts. To investigate this, we compute Ly transmission along sightlines originating from galaxies in the Cosmic Dawn III simulation and identify cases that closely reproduce the observed double-peaked emission. In these cases, the sightlines intersect highly underdense voids located a few comoving megaparsecs from the source galaxy. These voids allow photons emitted blueward of Ly to redshift through resonance without scattering while traversing them. The low opacity arises because the neutral hydrogen density scales with the square of the underlying gas density under ionization equilibrium, making sufficiently underdense regions with of cosmic mean density highly transmissive. Such voids naturally occur in the fluctuating cosmic density field, even in the vicinity of galaxies, and can also be associated with transmissive spikes in the Ly forest. We find that the global probability of observing double-peaked emission is during reionization at an 80% global ionization fraction, while no cases are found at 60% ionization. We also find that this probability depends sensitively on the local ionizing background intensity, increasing by a factor of for a tenfold increase in intensity. Recent accretion episodes of supermassive black holes can further increase this probability. These results suggest that double-peaked Ly emission in high- galaxies can serve as a sensitive probe of the ionizing background during the late stages of cosmic reionization.
Keywords: reionization — intergalactic medium — galaxies: high-redshift
#1\NAT@spacechar\@citeb\@extra@b@citeb\NAT@date \@citea\NAT@nmfmt\NAT@nm\NAT@spacechar\NAT@@open#1\NAT@spacechar\NAT@hyper@\NAT@date
I Introduction
The first billion years of cosmic history is emerging as a promising laboratory for testing our understanding of astrophysics. During this epoch, the impact of complex baryonic processes on observables is relatively limited compared to later epochs, allowing the Universe to be simulated with high fidelity and compared directly with observations (Barkana and Loeb, 2001; Loeb and Furlanetto, 2013; Bromm, 2013).
One of the most distinctive phenomena of this early Universe is cosmic reionization, during which the intergalactic medium (IGM) is gradually photoionized by radiation from the first luminous sources. While radiation from star-forming galaxies is widely believed to have been the dominant driver of reionization (e.g., Robertson et al., 2015; Hassan et al., 2018; Parsa et al., 2018; Finkelstein et al., 2019; Naidu et al., 2020; Yeh et al., 2023), radiation from non-stellar sources such as active galactic nuclei and compact binaries has also been considered to make a non-negligible contribution (e.g., Baek et al., 2010; Fragos et al., 2013; Mesinger et al., 2013; Madau and Haardt, 2015; Eide et al., 2020; Robertson, 2022; Dayal et al., 2025).
Reionization is thought to have begun in the overdensities of early galaxies (Jung et al., 2022b, a; Saxena et al., 2023; Martin et al., 2026) and progressed outward into underdense regions (Hayes and Scarlata, 2023), eventually ionizing most of the neutral hydrogen in the IGM by (McGreer et al., 2015; Umeda et al., 2025). The evolving geometry of the ionization field encodes critical information about the nature of the ionizing sources, including their spatial distribution, spectral properties, and relative contributions across cosmic time (e.g., Furlanetto et al., 2004; Iliev et al., 2006, 2012; Neyer et al., 2024, 2026). Consequently, probing the ionization structure of the IGM is a central goal of modern astronomy.
Lyman-alpha (Ly) emission from star-forming galaxies provides a powerful probe of the IGM ionization state (see e.g., Miralda-Escudé, 1998; Mesinger et al., 2015; Ouchi et al., 2020, for reviews). Extensive efforts have been devoted to constraining reionization using the damping-wing opacity imprinted redward of the Ly resonance in galaxy spectra (e.g., Jung et al., 2020; Wold et al., 2022; Larson et al., 2022; Bolan et al., 2022; Morishita et al., 2023; Nakane et al., 2024; Park et al., 2025a; Mason et al., 2026). In this work, however, we focus on the resonant opacity experienced by photons emitted slightly blueward of the Ly resonance.
Observations at , where IGM opacity is negligible, show that a substantial fraction of intrinsic Ly emission emerges on the blue side of the Ly resonance (e.g., Erb et al., 2014; Trainor et al., 2015). With increasing redshift, the fraction of Ly emitters (LAEs) exhibiting blue-side emission steadily declines as the IGM progressively attenuates blueward photons, becoming nearly absent above (Stark et al., 2011; Jung et al., 2020; Jones et al., 2024; Tang et al., 2024a, b; Kageura et al., 2025; Mukherjee et al., 2026). Even though the IGM is mostly ionized after the end of reionization (), trace amounts of residual neutral hydrogen within ionized regions can still produce significant opacity to blue-wing photons as they redshift through the Ly resonance (Laursen et al., 2011). This behavior is closely analogous to the steeply declining transmission observed in the Ly forest toward higher redshifts (e.g., Fan et al., 2006; Becker et al., 2015; Eilers et al., 2018; Yang et al., 2020; Bosman et al., 2022).
Interestingly, several unusual cases exhibiting double-peaked Ly emission profiles have been identified at . Two such objects have been discovered at (COLA1 and NEPLA4; Hu et al., 2016; Matthee et al., 2018; Songaila et al., 2018) and one at (A370p_z1; Meyer et al., 2021). None of these objects show evidence for active galactic nuclei in or around them or existence of highly clustered neighboring galaxies. Although the lack of precise systemic velocity measurements previously left open the possibility that both peaks lay on the red side of the Ly resonance (Matthee et al., 2018), recent observations have revealed that COLA1 and NEPLA4 have systemic redshifts located precisely between their two peaks. This confirms that the blue peak indeed originates from wavelengths shorter than the rest-frame Ly line (Torralba et al., 2024; Meyer et al., 2026).
These high-redshift double-peaked LAEs raise the question of how the IGM during the reionization era could transmit photons emitted on the blue side of the Ly resonance without unusually strong radiation sources. The HII region surrounding the source galaxy must be sufficiently large ( physical Mpc) for blueward photons to redshift into resonance before encountering neutral gas (Torralba et al., 2024). This condition can be readily satisfied in the late stages of reionization, when ionized bubbles overlap to form giant HII regions up to physical Mpc, as seen in many previous studies (e.g., Furlanetto et al., 2004; Iliev et al., 2006; McQuinn et al., 2007; Trac and Cen, 2007; Ocvirk et al., 2016).
However, having a large HII region alone is not sufficient to allow transmission of blue wing photons. During reionization, the IGM is expected to remain highly opaque at the Ly resonance due to the high mean density of the Universe and the weaker ionizing background radiation. This is supported by declining Ly forest transmission toward higher redshift from , prior to the onset of reionization.
Notably, Iliev et al. (2008) reported a significant fraction of sightlines in their reionization simulation exhibiting double-peaked Ly emission. However, their assumed ionizing efficiency of galaxies was much higher ( at ) than values typically adopted today ( at ), based on recent observations (Fan et al., 2002; Calverley et al., 2011; Becker and Bolton, 2013; D’Aloisio et al., 2018; Becker et al., 2021; Bosman et al., 2022; Gaikwad et al., 2023). This difference arises from earlier constraints on the electron-scattering optical depth from the Wilkinson Microwave Anisotropy Probe, which allowed for significantly earlier reionization than is currently favored (Page et al., 2007).
Recently, Meyer et al. (2026) reported that COLA1 and NEPLA4 host supermassive black holes (SMBHs) with masses of , inferred from the H and H line widths observed by the James Webb Space Telescope. They proposed that a recent AGN episode, during which these SMBHs accreted near the Eddington limit less than a million years ago, could have reduced the neutral hydrogen density of the surrounding IGM. Because the IGM would not yet have returned to ionization equilibrium, this scenario could enable the transmission of blue-wing photons.
In this work, we analyze the state-of-the-art reionization simulation Cosmic Dawn III (CoDaIII) to search for analogs of the observed double-peaked LAEs. We note that Gronke et al. (2021) previously investigated this question using the predecessor simulation, Cosmic Dawn II. They showed that of sightlines exhibit significant transmission on the blue side of Ly, but did not identify any sightlines capable of reproducing the observed double-peaked profiles from a typical intrinsic emission line of a galaxy. By improving the Ly transmission calculation by more accurately estimating the halo peculiar velocities and substantially increasing the number of sampled sightlines, we now identify a significant population of sightlines exhibiting blue-side transmission that resembles the observed double-peaked LAEs. Building on these results, we examine the physical conditions required for such transmission and discuss the implications for current and future observations.
The rest of the paper is as follows. In Section II, we describe the simulation used in this study and how we find double-peaked LAE cases from the data. In Section III, we present the main results of this paper. In Section IV, we summarize our results with discussions. Throughout this paper, distances are given in comoving units and are expressed in ckpc or cMpc unless stated otherwise.
II Methods
II.1 Cosmic Dawn III simulation


A reliable calculation of Ly opacity in the IGM requires accurate modeling of the relevant physical quantities with a spatial resolution of over a cosmological volume (Lukić et al., 2015). The Cosmic Dawn III (CoDaIII) simulation provides a suitable mock Universe for the reionization era, in a cubic volume of size on a uniform grid of cells, with an equal number of dark matter particles of mass . This setup resolves baryonic structures with a uniform spatial resolution of across the entire simulation volume. We use the baryon density, baryon velocity, hydrogen ionization fraction, temperature, and photoionization rate fields from the simulation in our analysis.
CoDaIII self-consistently models structure formation and radiative transfer using fully coupled radiation hydrodynamics implemented in the RAMSES-CUDATON code (Ocvirk et al., 2016). RAMSES-CUDATON employs graphical processing units to track ionization fronts at the full speed of light, thereby avoiding reduced-speed-of-light artefacts (Ocvirk et al., 2019; Deparis et al., 2019). Subgrid prescriptions are used to convert gas into stars, represented by collisionless star particles of mass , and to estimate the ionizing radiation produced by these stars. The star-formation prescription is detailed in Section 2.2.1 of Ocvirk et al. (2020) describing the predecessor simulation Cosmic Dawn II (CoDaII), and the modifications made in CoDaIII is described in Section 2.1.2 of Lewis et al. (2022).
These prescriptions are calibrated to reproduce several observables of the Epoch of Reionization: the observed galaxy ultraviolet luminosity function at , the evolution of the neutral fraction of the IGM and the ionization rate, the Thomson scattering optical depth measured in the CMB. The simulation also produces an ionizing photon mean free path evolution in remarkable agreement with observations Lewis et al. (2022). Cosmic Dawn III’s dust model is also calibrated against REBELS and ALPINE dust masses (Lewis et al., 2023), and the impact of dust on ultraviolet luminosity function and galaxy morphology is studied in Ocvirk et al. (2025).
Compared to its predecessor CoDaII, CoDaIII improves on spatial and mass resolution by a factor 2 and 8, respectively. Moreover, a temperature criterion has been added to the star-formation prescription, which results in a greater sensitivity of low-mass galaxies to radiative feedback. This in turn moderates the growth of the ionizing background intensity and brings the simulation into agreement with observational constraints (Ocvirk et al., 2021; Lewis et al., 2022). Reionization in CoDaIII ends at , instead of in CoDaII, providing better agreement with recent reionization constraints (Davies et al., 2026). We present double-peaked LAE cases identified in the snapshot of CoDaIII and our corresponding analysis. In CoDaIII, of the simulation volume is ionized at this redshift, marking a late stage of reionization.
From the snapshot data, the HI density is computed using the gas density () and ionization mesh () from the simulation as , where is the hydrogen mass fraction in the Universe and is the proton mass. The CoDa simulations do not account for ionization of helium, which is typically expected to be singly ionized when hydrogen is ionized during the reionization era. To correct for the underestimated recombination rate due to the missing free electrons from helium, we increase by a factor of in highly ionized regions ().
We visualize the HI density in a slice of this snapshot in the left panel of Figure 1. The figure shows that ionized bubbles are merging into a single giant HII region (shown mostly red), leaving neutral regions (shown mostly blue) isolated. At this stage, most of the volume lies several cMpc away from the nearest neutral regions, and the damping-wing opacity therefore has limited contribution to opacity in most locations.
CoDaIII provides mesh data for the photoionization rate due to the ionizing background (), as a natural outcome of solving the ionizing radiative transfer throughout the simulation. We visualize in the right panel of Figure 1 for the same slice shown in the left panel. The figure shows that varies smoothly over large () scales, consistent with results from other recent simulations (e.g., Davies and Furlanetto, 2016; D’Aloisio et al., 2018), before declining abruptly near neutral regions. A comparison of and shows that the typical value of lies in the range – within ionized regions. exceeds in the central parts of the ionized regions, where a larger number of galaxies contribute to , and falls below near neutral regions, where fewer galaxies contribute.
We have also analyzed the snapshot, in which of the simulation volume is ionized. This redshift is closer to that of the highest-redshift observed double-peaked LAEs; however, we find no sightlines exhibiting double-peaked emission. This may indicate that such systems arise in extremely rare regions that are not statistically captured within the CoDaIII simulation volume, that the reionization history adopted in CoDaIII is delayed relative to reality, or that the simulated ionization topology differs substantially from that of the real Universe, which could also result in significantly different Ly opacity (McQuinn et al., 2007). Nevertheless, we believe that our results at provide useful insight into the observed double-peaked LAEs at .
Our galaxy identification method is described in detail in Ocvirk et al. (2025). We identify galaxies using a Friends-of-Friends (FoF) algorithm with a linking length of times the mean inter-particle separation. This choice yields a FoF mass function that better reproduces the halo mass function defined by a spherical overdensity of 200 at than the conventional linking length of (Watson et al., 2013).
The intrinsic UV magnitude is first computed from the ages and metallicities of halo star particles using the BPASS V2.2.1 (Eldridge and Stanway, 2022) stellar population models. We then apply a dust correction to galaxies with by taking , bringing the resulting UV luminosity function into agreement with observations. This prescription leaves galaxies with unchanged and makes brighter galaxies () fainter, with the correction increasing toward higher intrinsic UV luminosity. The prescription is based on the empirical calibration of dust attenuation in CoDaIII galaxies by Ocvirk et al. (2025), which was chosen so that the resulting bright end of the UV luminosity function agrees with observations. We use 938 identified galaxies with in this snapshot for our analysis. The galaxies are numbered in decreasing order of UV brightness. For example, galaxy #337 corresponds to the UV-brightest galaxy in our sample.
II.2 Ly Emission Line Calculation
While in real observations a galaxy can be viewed from only a single line of sight, simulated universes allow us to calculate emission along numerous hypothetical sightlines, giving a large statistical sample of mock observations. To identify sightlines that exhibit double-peaked emission profiles, we first compute the Ly opacity along multiple directions and then apply the resulting transmission to an assumed intrinsic line profile to obtain the transmitted spectrum. We then apply a set of criteria to classify whether each spectrum is double-peaked.
We generally follow the procedure described in Park et al. (2021) to calculate the IGM opacity. The optical depth, , is obtained by integrating the product of the neutral hydrogen number density, , and the Ly absorption cross section, , along each sightline. For photons emitted by the source at an initial frequency , the opacity is given by
| (1) |
where denotes a comoving position along a line-of-sight (LOS) direction and is the scale factor to convert the comoving distance to a physical one. The cross section follows a Voigt profile as a function of photon frequency , whose Gaussian core is determined by the local gas temperature . Here, is measured in the rest frame of the IGM along the LOS and is given by
| (2) |
where is the frequency of a Ly photon, and is the speed of light. The above equation accounts for the cosmological redshift through the Hubble expansion rate, , and the Doppler shift induced by the peculiar velocity of the IGM, . We evaluate the integral from the virial radius of the galaxy () to half the box size (), thereby capturing the IGM opacity while excluding contributions from the interstellar medium (ISM) and circumgalactic medium (CGM). Damping-wing opacity from neutral regions beyond is expected to contribute minimally at the late stage of reionization considered in this work (Smith et al., 2022). We compute by the IGM for 360 sightlines separated by on the -plane for each galaxy, yielding in total of Ly transmission for sightlines111Ideally, the sightlines need to be distributed uniformly throughout the full 3D volume to maximize the statistical sampling of the data. However, for computational convenience, we restrict the sightlines to a 2D plane in this work. While our current sample size is sufficient to support the key conclusions of this study, we plan to improve this aspect in future work..
The opacity in the ISM and CGM is generally very high (), and Ly photons typically undergo numerous scatterings with complex trajectories before escaping into the IGM (Dijkstra, 2014; Garel et al., 2021; Smith et al., 2022). These photons would still constitute emission from the target galaxies unless they are absorbed by dust because they have not traveled far away from the source galaxy. In the case of photons scattered in the IGM, dust absorption is highly unlikely; however, the photons have traveled far enough from the galaxy that change in their propagation direction would likely remove them from the direct sightline toward the galaxy, causing them to appear as diffuse emission outside the galaxies.
In this work, we focus on how the IGM opacity reshapes the emission that escapes the ISM and CGM by scattering photons off the sightline. We define the intrinsic emission as the radiation escaping the galaxy at the virial radius after being processed by the ISM and CGM. For the intrinsic spectral shape, we assume a Gaussian profile with a fixed standard deviation of for all galaxies in the simulation:
| (3) |
where is the wavelength offset relative to the Ly wavelength , expressed in units of velocity. Then, the transmitted profile is given by
| (4) |
The normalization of this profile is arbitrary, as the double-peak classification criteria applied in the subsequent step are independent of its intrinsic amplitude.
The assumed profile is admittedly highly simplified. Observations show that intrinsic Ly emission profiles can be double-peaked or exhibit more complex structures (Henry et al., 2018; Blaizot et al., 2023), and that the spectral extent of the emission correlates with the UV luminosity of the source galaxy (Endsley et al., 2022). However, our current understanding of the connection between galactic properties and Ly line formation remains insufficient to generate realistic intrinsic emission profiles directly from large-volume simulations with limited resolutions at ISM scales such as CoDaIII. Moreover, allowing the intrinsic profile to vary with galaxy properties would complicate the interpretation of our results, which will focus on the IGM physics. We therefore adopt this simplified prescription in the present analysis (See e.g., Jensen et al., 2013; Weinberger et al., 2019; Byrohl and Gronke, 2020; Xu et al., 2023; Neyer et al., 2026, for studies exploring alternative intrinsic emission profiles.). Nevertheless, our choice of yields a Ly emission profile whose wavelength extent is roughly comparable to that of green pea galaxies in the local Universe (Yang et al., 2016).
We classify a sightline as exhibiting double-peaked emission based on the intrinsic and observed blue- and red-side fluxes, defined as
We consider a sightline as showing double-peaked emission if the following conditions are satisfied:
| (5) |
The first criterion requires that at least 5% of the intrinsic red-side flux be transmitted, while the second requires that the blue-side flux exceed 10% of the red-side flux.
We note that above criteria can falsely classify a single red peak with a broad blueward extension as a double peak in the case of single broad-peak intrinsic emission profile assumed here. To exclude such cases, we impose an additional requirement that the flux between the resonance and the red peak falls below 50% of the peak flux:
| (6) |
where is the velocity offset of the red peak in the emergent emission. Visual inspection of the emergent profiles confirms that these criteria correctly identify genuine double-peaked Ly emission.
III Results


We find that 1858 out of 337,680 sightlines exhibit double-peaked emission, corresponding to a fraction of 0.55%. This low occurrence rate is consistent with observations that double-peaked LAEs are highly rare cases. We also find that the number of double-peaked cases depends sensitively on the adopted selection criteria. For example, tightening the requirement of to decreases the number of double-peaked cases to 798 or 0.24%. Consequently, we do not place strong emphasis on the absolute value of the probability from our calculation. We shall instead focus on how it depends on other environmental factors.
Figures 2 and 3 show two examples among the double-peaked Ly emission cases found in our calculation along with the HI density maps of the surrounding region. The case illustrated in Figure 2 is associated with a bright galaxy with similar to COLA1. In this case, the blue and red peaks are separated by nearly . The case illustrated in Figure 3 exhibits double peaks with smaller separation () more similar to the double-peaked profile of COLA1. Instead, this sightline is associated with a much fainter galaxy () than COLA1.
We note that the blue side of the red peak appears sharper than in the observations. As for observed line profiles, the line-spread function of spectrographs introduces spectral smoothing on scales of , broadening the observed profile. As for the theoretical line profiles calculated here, the Ly opacity is computed using an integration that begins abruptly at (Eq. (1)), causing photons blueward of the red peak to be sharply attenuated by resonant opacity. In reality, some photons scattered near are not completely removed and may still contribute to the observed line flux after undergoing additional scatterings within , resulting in a less sharply defined red peak than predicted here. However, we expect that these issues have negligible impact on the integrated flux, .
The cases shown in Figures 2 and 3 are representative of the double-peaked profiles in our sample and share a common physical origin. We therefore focus on these examples throughout this paper. In Section III.1, we describe how underdense regions surrounding the source enable blue-side transmission. In Section III.2, we examine the relationship between the local and the occurrence of the blue peak. Finally, in Section III.3, we show that the blue-peak occurrence exhibits little dependence on either the UV magnitude or the local density.
III.1 Underdense Void in the Vicinity of the Source

In the right panels of Figures 2 and 3, the blue shading extending outward from the galaxy marks the directions along which the Ly emission appears double-peaked to hypothetical observers. In both cases, the blue-shaded directions intersect regions of exceptionally low HI density (), shown in dark red. These highly underdense voids are the primary cause of the double-peaked profiles, which we examine in detail in this section. In Figure 4, we show various physical quantities along the sample sightline from Figure 3 for detailed investigation.
In the typical IGM with at , photons traverse the thermally broadened Ly resonance line within approximately the Sobolev length,
| (7) |
Because is much shorter than a cMpc, the resonance opacity can be estimated from the HI density at the location where photons redshift into resonance on large scales in the IGM (Park et al., 2025b). Equation (A6) of Park et al. (2025b) gives the opacity as
| (8) | |||
where denotes the location relative to the Ly source. Here is the radial peculiar velocity along the sightline direction , and pMpc denotes the physical megaparsec. Using and along the sightline, gaussian-smoothed over , we identify transmissive locations (panel of Figure 4) that are responsible for the blue-side emission in the left panel of Figure 3. Panel of Figure 4 shows that the radial velocity gradient is typically positive near the source galaxy because the gravitational infall velocity decreases with increasing distance from the source222Panel of Figure 4 also shows a strong outflow within due to pressurized gas from supernovae, and a mild outflow beyond due to large-scale expansion around the void. The former does not affect the transmission of the blueward photons of interest, while the latter further increases , thereby enhancing their transmission. (see Sec. 3.1 of Park et al., 2021). This velocity gradient effect produces an order-unity increase in the transmission, as illustrated in panel of Figure 4.
For simplicity in the explanation, we reduce Equation (8) by dropping the term and substituting the cosmological parameters, while ignoring the dark energy contribution (where is the matter density today) in (valid for ):
| (9) |
where . This expression indicates that the IGM permits significant transmission when . This is consistent with our finding in Figure 4 that regions with significant transmission () coincide with locations where .
In addition to low density, the spatial location of the void relative to the galaxy is also important. For our assumed intrinsic emission profile, most blueward photons are emitted at . The underdense region must therefore lie within the distance over which such photons redshift into the Ly resonance. This distance can be obtained by solving for along each direction that satisfies
| (10) |
We show these locations for , , , and as contours on the HI density maps in Figures 2–4. The contours are approximately circular and increase in radius for more negative , as a larger distance is required to redshift the photons into the Ly resonance. Deviations from perfect circular shapes arise from spatial fluctuations in the peculiar velocity field associated with the inhomogeneous large-scale structure.333As illustrated by the red contour, photons emitted at the Ly resonance in the galaxy frame () must still travel a finite distance before reaching resonance in the IGM frame. This offset arises because gravitational infall motions around galaxies blueshift the photons in the IGM frame (Santos, 2004; Iliev et al., 2008; Dijkstra et al., 2011; Park et al., 2021, 2022). Panel of Figure 4 shows that the sightlines of interest intersect the underdense voids with shown in dark red between the red contour corresponding to and the blue contour corresponding to , allowing significant blueward Ly flux to escape.
How can regions with such low HI density exist at ? In HII regions, ionization equilibrium gives the HI density as
| (11) | |||||
where , is the case B recombination coefficient, and is the hydrogen density normalized by its cosmic mean . In HII regions we assume and that helium is singly ionized giving .
As shown in panel of Figure 4, quickly approaches the background value () outside the virial radius, making the primary factor controlling . The scaling implies that baryon density fluctuations are strongly amplified in the neutral hydrogen distribution. Substituting Equation (11) into Equation (9) yields
| (12) |
Thus, the ionized IGM at the cosmic mean density () remains highly opaque at the Ly resonance () for a typical ionized gas temperature of and a moderately strong ionizing background with . However, in sufficiently underdense regions with (see panel ), falls to a few or below, with an additional boost in transmission due to a positive radial peculiar velocity gradient (), permitting significant Ly transmission, as shown in panel .
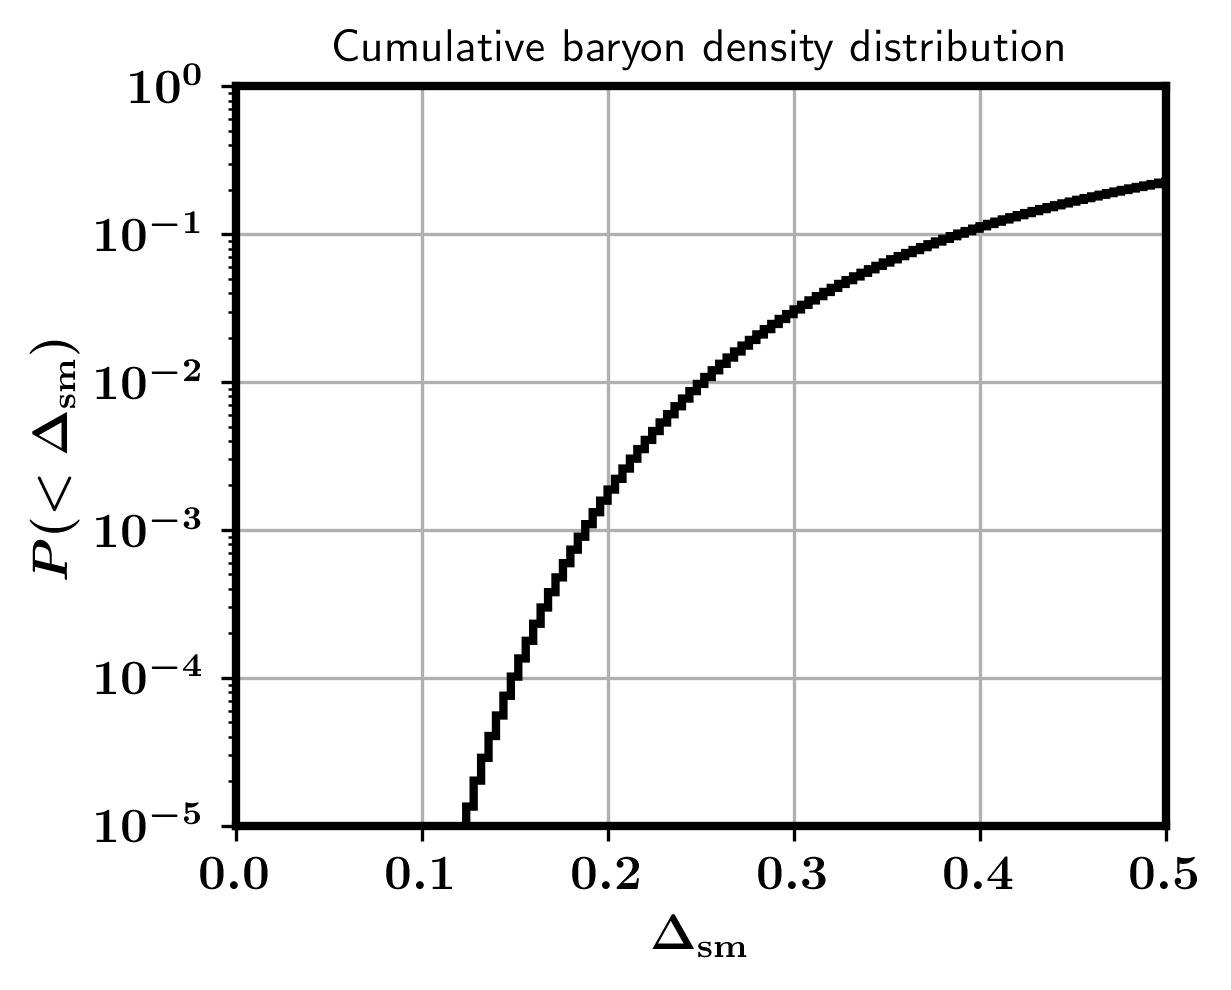
Therefore, a small () pocket of such underdensity located at – from the galaxy is sufficient to produce significant blue-side transmission; the surrounding environment need not be globally underdense. Because density fluctuations on scales are already nonlinear by , such voids are expected to be common in the IGM. The cumulative distribution of the normalized density, Gaussian-smoothed over the Sobolev length (Figure 5), shows that of the simulation volume is expected to host such transmissive regions with densities below of the cosmic mean. Although galaxies reside in overdense nodes of the cosmic web—where such underdense regions are less likely to be—voids can still occur between sheets and filaments at these distances, as in the cases demonstrated in Figures 2 and 3.


Clearly, the location of the underdense void required for significant blueward transmission depends on the emergent line profile from the source, . For example, if the blueward flux of the emergent profile were distributed mostly between and , as found in some galaxies in the low-redshift Universe, the underdense void shown in this section would not allow meaningful transmission of the blueward flux, because most of the flux would redshift into resonance only after passing through that void. Sightlines from such galaxies would therefore require underdense voids at greater distances to allow a transmission of blue-wing photons.
III.1.1 Analogy to the Ly Forest
The physical mechanism that allows blue-side Ly peaks to be transmitted through the IGM is the same as that responsible for transmission in the Ly forest. Thus, the underdense voids that give rise to double-peaked LAEs are also expected to produce Ly forest transmission spikes along sightlines that intersect them. Although transmission becomes nearly zero above , some sightlines have been observed to exhibit transmission spikes up to (e.g., Bosman et al., 2022).
In the left panels of Figure 6, we show two-dimensional Ly transmission maps for the same slice shown in the HI density map of Figure 3, assuming that the LOS direction is parallel to the - and - axes for each map. That is, any sightline sampled parallel to these axes corresponds to a hypothetical normalized Ly forest spectrum along that sightline. As expected at , the transmission is nearly zero throughout most of the volume, with only small, localized pockets of nonzero transmission. The locations of these transmissive pockets coincide with low-HI-density regions (), which appear dark red in the HI density map.
The extended transmission pockets marked by the dashed circles in the left panels of Figure 6 are associated with the same void that gives rise to the blue peak in Figure 3. The transmissive regions appear slightly different for different LOS directions due to the change in redshift-space distortion along the line of sight. The right panels of Figure 6 show the Ly forest along two sightlines intersecting this void in the and directions, extending across the entire simulation box, with the transmission spikes associated with the underdense void marked by dashed lines. Our results here clearly show that underdense voids result in both rare double-peaked emission in LAEs and rare transmission spikes in the high- Ly forest. It is, therefore, expected that these two observables would spatially correlate with each other.
The statistical properties of the Ly forest at these redshifts are an important and extensive topic in their own right; however, they are beyond the scope of this paper. A full analysis based on calculations performed on the complete mesh for multiple CoDaIII snapshots will be presented in a forthcoming paper.
III.2 Ionizing Background Intensity

The ionizing background intensity, quantified by , is another key factor governing the IGM opacity. As described in Equation (8), the Ly opacity, , scales as , such that a higher (lower) leads to a higher (lower) threshold density for the transmission of blue-side Ly photons. As shown in Figure 5, the probability that the density falls below this threshold varies steeply around . This steep dependence leads to a substantial difference in the probability of observing double-peaked emission (, hereafter) for a moderate change in .
The COLA1-like case shown in Figure 3 supports this intuition. The galaxy lies near the centre of a large ionized region, where the ionizing intensity is relatively high, with (see Figure 1). In such environments, even moderately underdense regions with can become sufficiently transparent to allow blue-side Ly transmission. In contrast, a region with , for instance, would require more extreme underdensities, such as , which are times less likely to occur (see Figure 5).
For a statistical analysis, we compute the local average of the ionizing intensity, , for each galaxy by taking the median value of between the virial radius and . This quantity serves as a proxy for the characteristic ionizing background that regulates blue-side Ly transmission. Figure 7 shows a strong dependence of on : increases by nearly an order of magnitude as increases from to .
To further illustrate this sensitivity, we show in Figure 7 as a dotted line an approximate estimate for a twofold increase in of the sample galaxies with the same ionization morphology. This estimate is obtained by recalculating after reducing the HI density by a factor of two at highly ionized regions (), motivated by the ionization-equilibrium relation . The resulting curve provides an approximate extrapolation of the – relation toward higher .
The extrapolated – relation remains broadly consistent with the fiducial result. It overshoots the fiducial result in the lowest bin, at , by nearly a factor of ten. However, the discrepancy decreases to a factor of two at , indicating convergence toward higher , where the extrapolation is useful. The larger discrepancy in the lowest bin arises because the sample galaxies lie near neutral regions, where can be highly inhomogeneous within (see the brown regions in the right panel of Figure 1). These galaxies can have in the neutral regions but much higher than in the ionized regions, yielding a much elevated compared to the fiducial case at the same , where is more homogeneous within .
Combining the extrapolated and fiducial results, we find that a tenfold increase in , from to , increases by nearly three orders of magnitude, from to . Although the exact values of depend on the assumptions adopted in the calculation, this result demonstrates that is extremely sensitive to .
III.2.1 Transmissivity Boost by recent AGN activity

AGNs are extremely powerful sources of ionizing radiation that can reduce the HI density in the IGM to levels that are highly transmissive at the Ly resonance within their proximity zones. Most quasar proximity zones at extend well beyond the distance required for blue-wing photons emitted a few hundred blueward of the Ly resonance to redshift into resonance. However, quasars become increasingly rare at , with the number density of objects brighter than falling below one per cubic gigaparsec (Romano et al., 2019), and no such sources have been observed in the vicinity of the two known double-peaked LAEs at , COLA1 and NEPLA4. Nevertheless, the recent discovery of SMBHs in these galaxies by Meyer et al. (2026) suggests that the surrounding IGM may have been affected by strong AGN radiation, which was turned off recently. If these SMBHs experienced an AGN phase sufficiently recently, the IGM may not yet have returned to its ionization-equilibrium HI density and could therefore exhibit enhanced transmissivity to Ly photons.
Assuming that was sufficiently high during a recent AGN phase to suppress to nearly zero, and that the AGN ceased its activity a time ago, after which the photoionization rate returned to , the subsequent evolution of can be described by substituting for in Equation (3). Based on this, Figure 8 shows how the IGM transmissivity within HII regions, , evolves at different gas densities (, 0.5, 0.33, 0.25, and 0.2) at , assuming .
The figure shows that underdense regions () can remain transmissive for substantially longer than regions at the mean density (). For example, if we adopt as the threshold above which the IGM transmits a significant fraction of blue-wing photons, gas at the mean density remains transmissive for only 0.012 megayears (Myr, hereafter), as it approaches its equilibrium value of on a timescale of Myr. In contrast, this transmissive phase lasts 0.05, 0.13, 0.27, and 0.69 Myr for lower gas densities of 0.5, 0.33, 0.25, and 0.2, respectively, as the equilibrium value of decreases to 36, 8, 4.5, and 2.8 (Eq. (3)).
Given that regions with is much more common than those with , the short-lived () Ly transmissivity boost following AGN activity can still have a substantial impact on the transmission of blue peaks in mean density regions. However, it is also notable that AGN activity can enable transmission through mildly underdense regions, whose equilibrium opacity can marginally suppress blue peaks, for even longer periods. This analysis suggests that the recent AGN activity and underdense voids can act as complementary effects in producing double-peaked LAEs.
III.3 UV Magnitude and Local Density Around the Source
In contrast to , neither nor the local density appears to be an important factor for double-peaked Ly emission. We compute by averaging the normalized density between the virial radius and from the source galaxy. Figure 9 shows that neither nor exhibits a clear correlation with .
At first glance, this result may seem counterintuitive, as brighter galaxies in higher-density regions would naturally produce a stronger and a lower . However, we note that the IGM responsible for producing double-peaked emission is located at least away from the source galaxy, where the radiation from the galaxy itself contributes only minimally to , as shown in panel of Figure 4. Additionally, higher local densities make the presence of underdense voids less likely, potentially offsetting the effects of an increased galaxy density.
We note that the size of our simulation may not be sufficient to capture a large number of bright galaxies to obtain reliable statistics for . For example, the number of galaxies decreases steeply toward higher UV brightness in our sample, and for the UV-brightest bin in the left panel of Figure 9 is computed by averaging over 120 galaxies with . A much larger simulation volume is therefore required to obtain robust statistics for these galaxies, as double-peaked emission is intrinsically rare.
Finally, any dependence of the intrinsic Ly line profile on —which is not included in this work—could introduce a corresponding dependence in . For example, UV-brighter galaxies are generally more massive and are known to produce more extended emergent profiles both in the blue and red directions. A more extended blueward profile might increase the likelihood of flux transmission because the photons enter the Ly resonance at larger distances from the overdense environments of the source galaxies. Since we use the flux ratio between the blue and red peaks in our double-peak criteria in this work, changes in the redward profile would also affect in our calculation. However, these effects are unlikely to produce variations comparable to the strong dependence on seen in Figure 7.


IV Summary and Discussion
In this paper, we analyzed Ly opacity along sightlines originating from simulated galaxies in the CoDaIII simulation to investigate the physical conditions that give rise to double-peaked Ly emitters observed in recent surveys. We identify several cases that closely resemble the observed systems and use them to isolate the key conditions required for double-peaked Ly emission.
Physical conditions for double-peaked LAEs: Double-peaked Ly emission requires the presence of a highly underdense pocket, with a characteristic size of a few hundred ckpc, located at the distance where the blueward flux from the source galaxy redshifts into resonance, typically one to a few cMpc. These small voids enable a significant fraction of photons emitted blueward of Ly to be transmitted through the IGM as they redshift through resonance. Although such underdense regions are rare, they can arise naturally in the vicinity of galaxies, forming in the gaps between sheets and filaments of the cosmic web as a consequence of inhomogeneous structure formation.
The intensity of local ionizing background is another critical factor enabling double-peaked emission. The threshold density required for voids to transmit blue-side photons lies in the extreme low-density tail of the density distribution. Increasing (decreasing) the intensity therefore leads to a steep increase (decrease) in the number of voids capable of transmitting blue-side photons. We find that a factor-of-two change in the ionizing background intensity results in nearly an order-of-magnitude change in the probability of seeing double-peaked emission (). This strong dependence implies that even small variations in the ionizing background during the late stages of reionization can produce large changes in the abundance of observable double-peaked LAEs.
In contrast, shows no significant dependence on the UV luminosity or local density of the source galaxy. This indicates that the dominant factor governing double-peaked emission is the UV radiation from other galaxies within the mean free path of ionizing photons, rather than radiation from the source galaxy itself. This interpretation is consistent with observations of COLA1 by Torralba et al. (2024), where the source galaxy is neither particularly UV-bright nor located in an extreme galaxy overdensity.
Another possibility is a supermassive black hole that was accreting until recently ( ago). Extreme ionization in the proximity zone can leave the region transmissive even after the active galactic nucleus (AGN) has turned off, as recently suggested by Meyer et al. (2026). In this case, mildly underdense pockets whose equilibrium opacity is only marginally high enough to scatter blue-wing photons can remain transmissive for , while the mean-density IGM would become opaque within . Thus, recent AGN activity and underdense pockets can act as complementary factors in explaining double-peaked LAEs.
Implications for reionization scenarios: The steep dependence of on photoionization rate () suggests that double-peaked LAEs can serve as a sensitive probe of reionization models. For example, the absence of double-peaked emission in the snapshot of CoDaIII may indicate that reionization was more advanced at than assumed in the simulation, which adopts a global ionized fraction of . In our analysis, double-peaked emission is predominantly found near the centres of ionized regions, where , at , when the Universe is approximately ionized. At this stage, ionized regions grow to tens of comoving megaparsecs through the overlap of smaller bubbles, leading to enhanced ionizing backgrounds near their centres. Equation (12) shows that the IGM opacity increases by for a fixed and when going from to , and the probability of finding highly underdense voids also decreases slightly. However, regions with could still allow a small fraction of sightlines to exhibit double-peaked emission. The observation of double-peaked LAEs at may therefore indicate that reionization had already entered this late-stage percolation phase by that redshift.
Depending on the mean free path of ionizing photons and the halo-mass dependence of ionizing efficiency, reionization may be dominated either by numerous small HII bubbles or by rare, large bubbles, resulting in different ionization geometries (see, e.g., Furlanetto et al., 2004; McQuinn et al., 2007; Gnedin and Madau, 2022). For a fixed global ionization fraction, the latter (i.e., the large HII bubble scenario) would be more favorable for double-peaked LAEs, as would be higher on average in HII regions.
Relation to the Ly forest: Double-peaked LAEs are closely related to transmission spikes in the high-redshift Ly forest, as the physical conditions required for both phenomena—underdense pockets and a strong ionizing background—are essentially the same (Zhu et al., 2024, 2026). Because the ionizing background radiation field traces the ionization topology of the IGM (see the right panel of Figure 1), large-scale spatial correlations between these two observables are expected. This implies that environments favorable for double-peaked Ly emission should coincide with those that give rise to unusually Ly-transmissive sightlines near the end of reionization.
Caveats: The sightlines identified as exhibiting double-peaked Ly emission are subject to several assumptions adopted in this work. In particular, we assume a fixed intrinsic Ly emission profile for all galaxies, owing to the limited understanding of the detailed Ly radiative transfer processes within simulated galaxies. In addition, the criteria used to identify double-peaked emission is somewhat arbitrary, as no standardized definition currently exists in the literature. For instance, one could instead employ topological persistence in the line shape, rather than the integrated flux used in this work. Consequently, the inferred number of double-peaked sightlines depends on the specific definition adopted. Despite these limitations, our central result—that double-peaked Ly emission serves as a sensitive probe of the ionizing background intensity —remains robust, as all assumptions are applied consistently throughout the analysis.
The volume of CoDaIII is not large enough to sample large HII bubbles spanning tens of cMpc that form from the percolation of smaller bubbles toward the end of reionization (see Figure 1). Since most double-peaked LAEs are found in the central regions of these bubbles, the limited volume likely imposes statistical uncertainties on our results.
CoDaIII also does not include AGNs, which can substantially reduce the Ly opacity in their surroundings. The probability is therefore likely to be higher in regions near AGNs. However, observed double-peaked LAEs at do not show evidence for AGN activity within or around their host galaxies, suggesting that their surrounding environments may be similar to those represented in CoDaIII. As mentioned above, recently ceased AGN activity could be another factor that further increases the occurrence of double-peaked LAEs.
Future prospects: Upcoming spectroscopic surveys with JWST, existing facilities (e.g., X-shooter on the Very Large Telescope, Vernet et al. 2011; FOCAS on the Subaru telescope, Greene et al. 2022), and next-generation ground-based telescopes (e.g., GMACS on the Giant Magellan Telescope, DePoy et al. 2018; MOSAIC on the Extremely Large Telescope, Pelló et al. 2024) will substantially increase the samples of high-redshift LAEs and Ly forest spectra with well-resolved line profiles. Joint analyses of LAEs and the Ly forest—such as measurements of their two-point correlation—may provide additional constraints on the ionizing background intensity and the reionization history during its late stages. Ultimately, these probes could complement traditional approaches, such as Ly equivalent-width measurements and Ly damping-wing analyses, providing new insights into the ionizing sources during the reionization era.
Acknowledgments
We thank the referee for constructive feedback that has improved the quality of this work. This work used resources of the Oak Ridge Leadership Computing Facility, in particular the Frontier supercomputer, under project AST031. H.P. thanks the organizers of the Cosmic Dawn at High Latitude conference held in Stockholm, Sweden between June 24–28, 2024, which allowed helpful discussion with the participants. H.P. was supported in part by NSF grant PHY-2309135 to the Kavli Institute for Theoretical Physics (KITP). H.P. is supported by IBS under the project code IBS-R018-D3. H.Y. is supported by MEXT/JSPS KAKENHI grant No. 21H04489, 26H02061 and JST FOREST Program, grant No. JP-MJFR202Z. L.C. is supported by STFC consolidated grant ST/X000982/1. J.S. is supported by the University of Lille via the Welcoming Internationals to Lille initiative for the UNIVERSITWINS project. KA is supported by the National Research Foundation of Korea (NRF) RS-2021-NR058956, RS-2025-16302968 and the Korea Astronomy and Space Science Institute under the R&D program (Project No. 2025-9-844-00) supervised by the Korea AeroSpace Administration.
Data Availability
The CoDaIII simulation data used in this study are available from P. Ocvirk upon reasonable request. Derived data products generated in this work are available from the first author, H. Park, upon reasonable request.
References
- Reionization by UV or X-ray sources. A&A 523, pp. A4. External Links: Document, 1003.0834 Cited by: §I.
- In the beginning: the first sources of light and the reionization of the universe. Phys. Rep. 349 (2), pp. 125–238. External Links: Document, astro-ph/0010468 Cited by: §I.
- Reionisation and High-Redshift Galaxies: The View from Quasar Absorption Lines. PASA 32, pp. e045. External Links: Document, 1510.03368 Cited by: §I.
- New measurements of the ionizing ultraviolet background over 2 ¡ z ¡ 5 and implications for hydrogen reionization. MNRAS 436 (2), pp. 1023–1039. External Links: Document, 1307.2259 Cited by: §I.
- The mean free path of ionizing photons at 5 ¡ z ¡ 6: evidence for rapid evolution near reionization. MNRAS 508 (2), pp. 1853–1869. External Links: Document, 2103.16610 Cited by: §I.
- Simulating the diversity of shapes of the Lyman- line. MNRAS 523 (3), pp. 3749–3772. External Links: Document, 2305.10047 Cited by: §II.2.
- Inferring the intergalactic medium neutral fraction at z 6-8 with low-luminosity Lyman break galaxies. MNRAS 517 (3), pp. 3263–3274. External Links: Document, 2111.14912 Cited by: §I.
- Hydrogen reionization ends by z = 5.3: Lyman- optical depth measured by the XQR-30 sample. MNRAS 514 (1), pp. 55–76. External Links: Document, 2108.03699 Cited by: §I, §I, §III.1.1.
- Formation of the first stars. Reports on Progress in Physics 76 (11), pp. 112901. External Links: Document, 1305.5178 Cited by: §I.
- Variations in shape among observed Lyman- spectra due to intergalactic absorption. A&A 642, pp. L16. External Links: Document, 2006.10041 Cited by: §II.2.
- Measurements of the ultraviolet background at 4.6 ¡ z ¡ 6.4 using the quasar proximity effect. MNRAS 412 (4), pp. 2543–2562. External Links: Document, 1011.5850 Cited by: §I.
- Large fluctuations in the high-redshift metagalactic ionizing background. MNRAS 473 (1), pp. 560–575. External Links: Document, 1611.02711 Cited by: §I, §II.1.
- Updated dark pixel fraction constraints on reionization’s end from the Lyman-series forests of XQR30. MNRAS 545 (2), pp. staf1862. External Links: Document, 2510.25829 Cited by: §II.1.
- Large fluctuations in the hydrogen-ionizing background and mean free path following the epoch of reionization. MNRAS 460 (2), pp. 1328–1339. External Links: Document, 1509.07131 Cited by: §II.1.
- UNCOVERing the contribution of black holes to reionization. A&A 697, pp. A211. External Links: Document, 2401.11242 Cited by: §I.
- Impact of the reduced speed of light approximation on ionization front velocities in cosmological simulations of the epoch of reionization. A&A 622, pp. A142. External Links: Document, 1803.01634 Cited by: §II.1.
- GMACS: a wide-field, moderate-resolution spectrograph for the Giant Magellan Telescope. In Ground-based and Airborne Instrumentation for Astronomy VII, C. J. Evans, L. Simard, and H. Takami (Eds.), Vol. 10702, pp. 107021X. External Links: Document, Link Cited by: §IV.
- The detectability of Ly emission from galaxies during the epoch of reionization. MNRAS 414 (3), pp. 2139–2147. External Links: Document, 1101.5160 Cited by: footnote 3.
- Ly Emitting Galaxies as a Probe of Reionisation. PASA 31, pp. e040. External Links: Document, 1406.7292 Cited by: §II.2.
- Large-scale simulations of H and He reionization and heating driven by stars and more energetic sources. MNRAS 498 (4), pp. 6083–6099. External Links: Document, 2009.06631 Cited by: §I.
- The Opacity of the Intergalactic Medium Measured along Quasar Sightlines at z 6. ApJ 864 (1), pp. 53. External Links: Document, 1807.04229 Cited by: §I.
- New Insights into the Evolution of Massive Stars and Their Effects on Our Understanding of Early Galaxies. ARA&A 60, pp. 455–494. External Links: Document, 2202.01413 Cited by: §II.1.
- The REBELS ALMA Survey: efficient Ly transmission of UV-bright z ≃ 7 galaxies from large velocity offsets and broad line widths. MNRAS 517 (4), pp. 5642–5659. External Links: Document, 2202.01219 Cited by: §II.2.
- The Ly Properties of Faint Galaxies at z ~2-3 with Systemic Redshifts and Velocity Dispersions from Keck-MOSFIRE. ApJ 795 (1), pp. 33. External Links: Document, 1408.3638 Cited by: §I.
- Evolution of the Ionizing Background and the Epoch of Reionization from the Spectra of z~6 Quasars. AJ 123 (3), pp. 1247–1257. External Links: Document, astro-ph/0111184 Cited by: §I.
- Constraining the Evolution of the Ionizing Background and the Epoch of Reionization with z~6 Quasars. II. A Sample of 19 Quasars. AJ 132 (1), pp. 117–136. External Links: Document, astro-ph/0512082 Cited by: §I.
- Conditions for Reionizing the Universe with a Low Galaxy Ionizing Photon Escape Fraction. ApJ 879 (1), pp. 36. External Links: Document, 1902.02792 Cited by: §I.
- X-Ray Binary Evolution Across Cosmic Time. ApJ 764 (1), pp. 41. External Links: Document, 1206.2395 Cited by: §I.
- The Growth of H II Regions During Reionization. ApJ 613 (1), pp. 1–15. External Links: Document, astro-ph/0403697 Cited by: §I, §I, §IV.
- Measuring the photoionization rate, neutral fraction, and mean free path of H I ionizing photons at 4.9 z 6.0 from a large sample of XShooter and ESI spectra. MNRAS 525 (3), pp. 4093–4120. External Links: Document, 2304.02038 Cited by: §I.
- Ly as a tracer of cosmic reionization in the SPHINX radiation-hydrodynamics cosmological simulation. MNRAS 504 (2), pp. 1902–1926. External Links: Document, 2104.03339 Cited by: §II.2.
- Modeling cosmic reionization. Living Reviews in Computational Astrophysics 8 (1), pp. 3. External Links: Document, 2208.02260 Cited by: §IV.
- The Prime Focus Spectrograph Galaxy Evolution Survey. arXiv e-prints, pp. arXiv:2206.14908. External Links: Document, 2206.14908 Cited by: §IV.
- Lyman- transmission properties of the intergalactic medium in the CoDaII simulation. MNRAS 508 (3), pp. 3697–3709. External Links: Document, 2004.14496 Cited by: §I.
- Constraining the contribution of active galactic nuclei to reionization. MNRAS 473 (1), pp. 227–240. External Links: Document, 1705.05398 Cited by: §I.
- On the Sizes of Ionized Bubbles Around Galaxies During the Reionization Epoch. The Spectral Shapes of the Ly Emission from Galaxies. ApJ 954 (1), pp. L14. External Links: Document, 2303.03160 Cited by: §I.
- A Close Relationship between Ly and Mg II in Green Pea Galaxies. ApJ 855 (2), pp. 96. External Links: Document, 1803.10243 Cited by: §II.2.
- An Ultraluminous Ly Emitter with a Blue Wing at z = 6.6. ApJ 825 (1), pp. L7. External Links: Document, 1606.03526 Cited by: §I.
- Simulating cosmic reionization at large scales - I. The geometry of reionization. MNRAS 369 (4), pp. 1625–1638. External Links: Document, astro-ph/0512187 Cited by: §I, §I.
- Can 21-cm observations discriminate between high-mass and low-mass galaxies as reionization sources?. MNRAS 423 (3), pp. 2222–2253. External Links: Document, 1107.4772 Cited by: §I.
- The effect of the intergalactic environment on the observability of Ly emitters during reionization. MNRAS 391 (1), pp. 63–83. External Links: Document, 0711.2944 Cited by: §I, footnote 3.
- On the use of Ly emitters as probes of reionization. MNRAS 428 (2), pp. 1366–1381. External Links: Document, 1206.4028 Cited by: §II.2.
- JADES: The emergence and evolution of Ly emission and constraints on the intergalactic medium neutral fraction. A&A 683, pp. A238. External Links: Document, 2306.02471 Cited by: §I.
- Texas Spectroscopic Search for Ly Emission at the End of Reionization. III. The Ly Equivalent-width Distribution and Ionized Structures at z ¿ 7. ApJ 904 (2), pp. 144. External Links: Document, 2009.10092 Cited by: §I, §I.
- New Lyman-alpha Emitters in EGS: Evidence of an Extended Ionized Structure at . arXiv e-prints, pp. arXiv:2212.09850. External Links: Document, 2212.09850 Cited by: §I.
- CLEAR: Boosted Ly Transmission of the Intergalactic Medium in UV-bright Galaxies. ApJ 933 (1), pp. 87. External Links: Document, 2111.14863 Cited by: §I.
- Census of Ly Emission from 600 Galaxies at z = 5–14: Evolution of the Ly Luminosity Function and a Late Sharp Cosmic Reionization. ApJS 278 (2), pp. 33. External Links: Document, 2501.05834 Cited by: §I.
- Searching for Islands of Reionization: A Potential Ionized Bubble Powered by a Spectroscopic Overdensity at z = 8.7. ApJ 930 (2), pp. 104. External Links: Document, 2203.08461 Cited by: §I.
- Intergalactic Transmission and Its Impact on the Ly Line. ApJ 728 (1), pp. 52. External Links: Document, 1009.1384 Cited by: §I.
- DUSTiER (DUST in the Epoch of Reionization): dusty galaxies in cosmological radiation-hydrodynamical simulations of the Epoch of Reionization with RAMSES-CUDATON. MNRAS 519 (4), pp. 5987–6007. External Links: Document, 2204.03949 Cited by: §II.1.
- The short ionizing photon mean free path at z = 6 in Cosmic Dawn III, a new fully coupled radiation-hydrodynamical simulation of the Epoch of Reionization. MNRAS 516 (3), pp. 3389–3397. External Links: Document, 2202.05869 Cited by: §II.1, §II.1, §II.1.
- The First Galaxies in the Universe. Princeton University Press. Cited by: §I.
- The Lyman forest in optically thin hydrodynamical simulations. MNRAS 446 (4), pp. 3697–3724. External Links: Document, 1406.6361 Cited by: §II.1.
- Cosmic Reionization after Planck: Could Quasars Do It All?. ApJ 813 (1), pp. L8. External Links: Document, 1507.07678 Cited by: §I.
- Galaxy Protoclusters as Drivers of Cosmic Reionization: I. Bubble Overlap at Redshift z 7 in LAGER-z7OD1. ApJ 997 (1), pp. 102. External Links: Document, 2510.13140 Cited by: §I.
- Constraints on the z 613 intergalactic medium from JWST spectroscopy of Lyman-alpha damping wings in galaxies. A&A 705, pp. A114. External Links: Document, 2501.11702 Cited by: §I.
- Confirmation of double peaked Ly emission at z = 6.593. Witnessing a galaxy directly contributing to the reionisation of the Universe. A&A 619, pp. A136. External Links: Document, 1805.11621 Cited by: §I.
- Model-independent evidence in favour of an end to reionization by z 6. MNRAS 447 (1), pp. 499–505. External Links: Document, 1411.5375 Cited by: §I.
- The morphology of HII regions during reionization. MNRAS 377 (3), pp. 1043–1063. External Links: Document, astro-ph/0610094 Cited by: §I, §II.1, §IV.
- Can the intergalactic medium cause a rapid drop in Ly emission at z ¿ 6?. MNRAS 446 (1), pp. 566–577. External Links: Document, 1406.6373 Cited by: §I.
- Signatures of X-rays in the early Universe. MNRAS 431 (1), pp. 621–637. External Links: Document, 1210.7319 Cited by: §I.
- Double-peaked Lyman emission at z = 6.803: a reionization-era galaxy self-ionizing its local H II bubble. MNRAS 500 (1), pp. 558–564. External Links: Document, 2010.06241 Cited by: §I.
- Life After the Quasar: Overmassive Black Holes and Remnant Ionised Bubbles in and Around Two z~6.6 Galaxies. arXiv e-prints, pp. arXiv:2605.00763. External Links: Document, 2605.00763 Cited by: §I, §I, §III.2.1, §IV.
- Reionization of the Intergalactic Medium and the Damping Wing of the Gunn-Peterson Trough. ApJ 501 (1), pp. 15–22. External Links: Document, astro-ph/9708253 Cited by: §I.
- Early Results from GLASS-JWST. XIV. A Spectroscopically Confirmed Protocluster 650 Million Years after the Big Bang. ApJ 947 (2), pp. L24. External Links: Document, 2211.09097 Cited by: §I.
- A census of double-peaked Lyman- emitters in MAGPI: Classification, global characteristics, and spatially resolved properties. PASA 43, pp. e021. External Links: Document, 2510.18398 Cited by: §I.
- Rapid Reionization by the Oligarchs: The Case for Massive, UV-bright, Star-forming Galaxies with High Escape Fractions. ApJ 892 (2), pp. 109. External Links: Document, 1907.13130 Cited by: §I.
- Ly Emission at z = 7─13: Clear Evolution of Ly Equivalent Width Indicating a Late Cosmic Reionization History. ApJ 967 (1), pp. 28. External Links: Document, 2312.06804 Cited by: §I.
- The THESAN project: connecting ionized bubble sizes to their local environments during the Epoch of Reionization. MNRAS 531 (3), pp. 2943–2957. External Links: Document, 2310.03783 Cited by: §I.
- The THESAN project: Lyman-alpha emitters as probes of ionized bubble sizes. The Open Journal of Astrophysics 9, pp. 60756. External Links: Document Cited by: §I, §II.2.
- Impact of the reduced speed of light approximation on the post-overlap neutral hydrogen fraction in numerical simulations of the epoch of reionization. A&A 626, pp. A77. External Links: Document, 1803.02434 Cited by: §II.1.
- Cosmic Dawn II (CoDa II): a new radiation-hydrodynamics simulation of the self-consistent coupling of galaxy formation and reionization. MNRAS 496 (4), pp. 4087–4107. External Links: Document Cited by: §II.1.
- Cosmic Dawn (CoDa): the First Radiation-Hydrodynamics Simulation of Reionization and Galaxy Formation in the Local Universe. MNRAS 463 (2), pp. 1462–1485. External Links: Document, 1511.00011 Cited by: §I, §II.1.
- Dust-UV offsets in high-redshift galaxies in the Cosmic Dawn III simulation. A&A 703, pp. A98. External Links: Document, 2409.05946 Cited by: §II.1, §II.1, §II.1.
- Lyman-alpha opacities at z = 4-6 require low mass, radiatively-suppressed galaxies to drive cosmic reionization. MNRAS 507 (4), pp. 6108–6117. External Links: Document, 2105.01663 Cited by: §II.1.
- Observations of the Lyman- Universe. ARA&A 58, pp. 617–659. External Links: Document, 2012.07960 Cited by: §I.
- Three-Year Wilkinson Microwave Anisotropy Probe (WMAP) Observations: Polarization Analysis. ApJS 170 (2), pp. 335–376. External Links: Document, astro-ph/0603450 Cited by: §I.
- Crucial Factors for Ly Transmission in the Reionizing Intergalactic Medium: Infall Motion, H II Bubble Size, and Self-shielded Systems. ApJ 922 (2), pp. 263. External Links: Document, 2105.10770 Cited by: §II.2, §III.1, footnote 3.
- Constraining Reionization with Ly Damping-wing Absorption in Galaxy Spectra: A Machine Learning Model Based on Reionization Simulations. ApJ 983 (2), pp. 91. External Links: Document, 2410.07377 Cited by: §I.
- Scattering of Ly Photons through the Reionizing Intergalactic Medium: I. Spectral Energy Distribution. ApJ 931 (2), pp. 126. External Links: Document, 2202.06277 Cited by: footnote 3.
- Analytical model for scattered Ly emission in the post-reionization intergalactic medium. MNRAS 544 (4), pp. 4246–4255. External Links: Document, 2509.11268 Cited by: §III.1.
- No evidence for a significant AGN contribution to cosmic hydrogen reionization. MNRAS 474 (3), pp. 2904–2923. External Links: Document, 1704.07750 Cited by: §I.
- MOSAIC at the ELT: a unique instrument for the largest ground-based telescope. In Ground-based and Airborne Instrumentation for Astronomy X, J. J. Bryant, K. Motohara, and J. R. D. Vernet (Eds.), Vol. 13096, pp. 1309615. External Links: Document, Link Cited by: §IV.
- Cosmic Reionization and Early Star-forming Galaxies: A Joint Analysis of New Constraints from Planck and the Hubble Space Telescope. ApJ 802 (2), pp. L19. External Links: Document, 1502.02024 Cited by: §I.
- Galaxy Formation and Reionization: Key Unknowns and Expected Breakthroughs by the James Webb Space Telescope. ARA&A 60, pp. 121–158. External Links: Document, 2110.13160 Cited by: §I.
- Lyman continuum escape fraction and mean free path of hydrogen ionizing photons for bright z 4 QSOs from SDSS DR14. A&A 632, pp. A45. External Links: Document, 1910.02775 Cited by: §III.2.1.
- Probing reionization with Lyman emission lines. MNRAS 349 (3), pp. 1137–1152. External Links: Document, astro-ph/0308196 Cited by: footnote 3.
- JADES: Discovery of extremely high equivalent width Lyman- emission from a faint galaxy within an ionized bubble at z = 7.3. A&A 678, pp. A68. External Links: Document, 2302.12805 Cited by: §I.
- The THESAN project: Lyman- emission and transmission during the Epoch of Reionization. MNRAS 512 (3), pp. 3243–3265. External Links: Document, 2110.02966 Cited by: §II.2, §II.2.
- Complex Ly Profiles in Redshift 6.6 Ultraluminous Ly Emitters. ApJ 859 (2), pp. 91. External Links: Document, 1805.00490 Cited by: §I.
- Keck Spectroscopy of Faint 3¿z¿7 Lyman Break Galaxies: A High Fraction of Line Emitters at Redshift Six. ApJ 728 (1), pp. L2. External Links: Document, 1009.5471 Cited by: §I.
- Ly emission in galaxies at z ≃ 5-6: new insight from JWST into the statistical distributions of Ly properties at the end of reionization. MNRAS 531 (2), pp. 2701–2730. External Links: Document, 2402.06070 Cited by: §I.
- JWST/NIRSpec Observations of Lyman Emission in Star-forming Galaxies at 6.5 z 13. ApJ 975 (2), pp. 208. External Links: Document, 2408.01507 Cited by: §I.
- Anatomy of an ionized bubble: NIRCam grism spectroscopy of the z = 6.6 double-peaked Lyman- emitter COLA1 and its environment. A&A 689, pp. A44. External Links: Document, 2404.10040 Cited by: §I, §I, §IV.
- Radiative Transfer Simulations of Cosmic Reionization. I. Methodology and Initial Results. ApJ 671 (1), pp. 1–13. External Links: Document, astro-ph/0612406 Cited by: §I.
- The Spectroscopic Properties of Ly-Emitters at z 2.7: Escaping Gas and Photons from Faint Galaxies. ApJ 809 (1), pp. 89. External Links: Document, 1506.08205 Cited by: §I.
- SILVERRUSH. XIV. Ly Luminosity Functions and Angular Correlation Functions from 20,000 Ly Emitters at z 2.2─7.3 from up to 24 deg2 HSC-SSP and CHORUS Surveys: Linking the Postreionization Epoch to the Heart of Reionization. ApJS 277 (2), pp. 37. External Links: Document, 2411.15495 Cited by: §I.
- X-shooter, the new wide band intermediate resolution spectrograph at the ESO Very Large Telescope. A&A 536, pp. A105. External Links: Document, 1110.1944 Cited by: §IV.
- The halo mass function through the cosmic ages. MNRAS 433 (2), pp. 1230–1245. External Links: Document, 1212.0095 Cited by: §II.1.
- Modelling the observed luminosity function and clustering evolution of Ly emitters: growing evidence for late reionization. MNRAS 485 (1), pp. 1350–1366. External Links: Document, 1902.05077 Cited by: §II.2.
- LAGER Ly Luminosity Function at z 7: Implications for Reionization. ApJ 927 (1), pp. 36. External Links: Document, 2105.12191 Cited by: §I.
- The THESAN project: Lyman- emitter luminosity function calibration. MNRAS 521 (3), pp. 4356–4374. External Links: Document, 2210.16275 Cited by: §II.2.
- Green Pea Galaxies Reveal Secrets of Ly Escape. ApJ 820 (2), pp. 130. External Links: Document, 1506.02885 Cited by: §II.2.
- Measurements of the z 6 Intergalactic Medium Optical Depth and Transmission Spikes Using a New z ¿ 6.3 Quasar Sample. ApJ 904 (1), pp. 26. External Links: Document, 2009.13544 Cited by: §I.
- The THESAN project: ionizing escape fractions of reionization-era galaxies. MNRAS 520 (2), pp. 2757–2780. External Links: Document, 2205.02238 Cited by: §I.
- On the Physical Nature of Ly Transmission Spikes in High-redshift Quasar Spectra. ApJ 975 (1), pp. 115. External Links: Document, 2401.04762 Cited by: §IV.
- Galaxy Underdensities Host the Clearest Intergalactic Medium Ly Transmission and Indicate Anisotropic Reionization. ApJ 1002 (1), pp. 93. External Links: Document, 2510.09568 Cited by: §IV.