
StateScribe: Towards Accessible Change Awareness Across Real-World RevisitsConference: ; April; 2026
Abstract.
Real-world environments evolve continuously, yet blind and low-vision (BLV) individuals often have limited access to understanding how they change over time. Unexpected or relocated objects, layout modifications, and content updates (e.g., price changes) can introduce safety risks and cognitive burden. While existing visual assistive technologies can describe immediate surroundings, they operate as one-off interactions and lack mechanisms to surface meaningful changes across revisits. Informed by a survey of 33 BLV individuals, we develop StateScribe, a system that supports accessible awareness of real-world changes across revisits. StateScribe employs a dual-layer memory architecture that integrates episodic scene memory and object-centric temporal memory to enable scalable and structured change tracking. It provides both live descriptions of the current scene, and descriptions of what has changed, when and where it occurred across revisits, such as “The shop on your right has a “CLOSED” sign; it was open at this time last week.” Our evaluation shows that StateScribe maintains high accuracy (-score = 83.1%) across 11 revisits, while remaining low-latency (mean¡1.42s) and memory-efficient (¡55MB) across 110 revisits. A user study with nine BLV participants demonstrates that StateScribe improves change awareness across revisits in three real-world locations. Finally, we discuss implications for long-term AI-assisted companions that support broader change observation using multimodal sensing, extend beyond changes to other memory capabilities, and adapt to individual users, intents, and contexts.
1. Introduction
Real-world environments evolve continuously with many unanticipated changes, yet blind and low-vision (BLV) individuals often have limited access to information that helps them understand how familiar spaces transform over time. For example, newly introduced obstacles, relocated objects in shared spaces, content changes (e.g., price updates), or layout modifications can pose safety risks and increase cognitive burden. Despite these challenges, there remains a limited understanding of what constitutes meaningful real-world changes for BLV individuals, and how to convey them effectively.
While existing human-powered services (e.g., Be My Eyes (bemyeyes), Aira (aira)), AI-powered visual assistive technologies (e.g., Seeing AI (seeingai) Be My AI (bemyai), WorldScribe (WorldScribe)), or live video AI (e.g., ChatGPT Live Video (gpt_live), Gemini Live (gemini_live)) can describe immediate surroundings, they typically operate as one-off sessions that retain only within-session memory. As a result, they lack persistent 3D spatial memory of a location (Chang2025probing) and mechanisms for surfacing meaningful changes across revisits. Enabling such longitudinal assistance poses several challenges: (i) Maintaining longitudinal memory in 3D space is difficult, as systems must identify and store the most relevant observations from the 3D real world without overloading with redundant information. (ii) Scaling memory storage and retrieval over extended use is difficult, as spatial and temporal data grow continuously, increasing retrieval latency and confusion. (iii) Incorporating change-awareness into real-time interactions can easily overwhelm users, especially if updates are frequent and noisy.
Based on a survey of 33 BLV individuals, we identified categories of changes that are difficult to perceive yet significantly affect daily life, such as newly introduced obstacles (e.g., scattered packages in shared apartments), changes to signage along routine commuting routes (e.g., removed or added signage), and updated pricing or layout during grocery shopping. To address these challenges, we present StateScribe, a system designed to support accessible awareness of real-world changes by using a smartphone interface and sensor data. StateScribe employs a dual-layer memory architecture that integrates Episodic Scene Memory (ESM) and Object-centric Temporal Memory (OTM). Specifically, ESM continuously updates information from recent visits within a bounded context window, archiving older data to maintain an up-to-date representation of the scene over time. In contrast, OTM selectively maintains key objects, tracking their states and spatial locations across visits while recording meaningful changes. This design enables scalable, structured, and efficient storage and retrieval.
Using these memory structures and smartphone 3D data (e.g., RGB-D images and camera intrinsics), StateScribe retrieves ESM and OTM by querying the current camera pose to identify the most recent frames from prior visits and detect significant changes. Based on 3D data and spatial correspondences, it generates descriptions that clearly communicate what has changed, and when and where the change occurred. For example, a user revisiting the market (Figure 1b) a week later might hear: “The fruit stand at your 10 o’clock is selling watermelon and guava; it sold apples and oranges last week,” “The bakery on your right now shows a ‘CLOSED’ sign; it was open at this time last week,” or “A construction site is at your 1 o’clock, 10 feet away.” Beyond change descriptions, StateScribe also provides live descriptions (Figure 1a) to support real-time scene understanding. StateScribe also enables interactive exploration of how their environment has evolved, where users can query via speech, e.g., “Has it blossomed now?”, with responses: “Yes, the trees have blossomed; they had not last week”(Figure 1b).
In a technical evaluation against two baselines, a Live model that actively prompts for change detection and a Offline video model that processes full-visit videos, StateScribe achieved an -score of 83.1% across 11 visits (291 changes), outperforming the Live model (40.1%) and Offline video model (27.4%). It also showed higher spatial accuracy, with lower clock-direction errors (in hour units; M=0.24 vs. 1.98 and 1.86) and smaller distance estimation errors (in feet; M=0.68 vs. 5.29 and 6.49). Additionally, StateScribe remained low-latency (mean¡1.42s) and memory-efficient (¡55MB) across 110 revisits to simulate long-term use. A user study with nine BLV participants demonstrated that StateScribe enhanced change awareness across revisits in three real-world locations (e.g., office, grocery store, outdoor courtyard). Finally, we discuss implications for long-term AI-assisted companions that support broader change observation using multimodal sensing, extend beyond changes to other memory capabilities, and adapt to individual users, intents, and contexts.
2. Related Work
StateScribe builds on prior work to provide BLV people with visual descriptions for real-world understanding, as well as traditional and AI-enabled memory-augmented systems. In what follows, we describe our motivation from prior related work and research gaps.
2.1. Describing Visual Information for BLV People
Textual descriptions are essential for making digital and physical information accessible to BLV people. Recent advances in VLMs enabled automated image descriptions and conversational interaction, reducing reliance on human-authored alt text. These capabilities allowed BLV users to quickly obtain visual summaries and interactively explore details, which are increasingly integrated into social network platforms (e.g., Facebook (Wu2017Facebook)) and assistive apps (e.g., Seeing AI (seeingai), Be My AI (bemyai)). In addition, prior work has explored integrating VLMs into systems that provided continuous, live visual descriptions. Such systems dynamically adapt the level and content of information based on user behavior, including camera motion (WorldScribe) and hand movements (TouchScribe).
Beyond visual descriptions, prior work in computer vision developed models for detecting and summarizing visual changes across images (jhamtani2018learning; forbes2019neural). In parallel, HCI researchers explored systems that describe visual differences between image pairs to support an accessible collaborative slide editing (Diffscriber), image editing (VizXpress; EditScribe; GenAssist), and graphics and 3D geometry editing (A11yBoard; A11yShape). However, support for detecting and describing real-world visual changes remains limited. Environments change continuously and unpredictably, which can impact BLV individuals’ daily lives. For instance, unexpected barriers in outdoor environments (cushley2023unseen; Williams2023; el2023survey), relocated objects in indoor shared spaces (turkstra2025assistive; patil2025designing), or seasonal product rearrangements and price updates in retail environments (Lee2021Product; khattab2015understanding; yu2015retail; tullio2021you) could potentially introduce safety risks and cognitive burdens for BLV individuals. To close these gaps, we first categorized meaningful changes through a formative study and developed StateScribe, a system that possesses spatial and temporal memory to detect and describe meaningful changes across visits on familiar routes or locations, beyond live descriptions of immediate surroundings.
2.2. Human Memory-Augmented Interactions
Early work in human memory-augmented interactions (lamming1994design) took the form of lifelogging systems, enabling applications such as social or audio reminders (hayes2004personal), contextual suggestions (rhodes1997wearable), sharing everyday moments (hayes2004personal), and support for people with memory impairments (Lee2007; Lee2008; hodges2006sensecam). While effective, these systems faced key challenges related to capturing meaningful data, managing storage constraints, and enabling timely retrieval of past data.
First, they typically relied on continuously capturing large portions of everyday experiences across modalities, including photos (hodges2006sensecam; Gemmell2004; mann2005designing; Footprint), videos (mann1998wearcam; sawahata2003wearable; Hori2003), audio signals (rhodes1997wearable; vemuri2004audio; hayes2004personal; Memoro), GPS data (Gemmell2004; Hori2003; rhodes1997wearable; Footprint), and physiological signals (Hori2003; healey1998startlecam; Chan2020Biosignal; Memento; Prospero; Prompto). However, such continuous recording imposed substantial storage demands, limiting long-term usability. To mitigate this, some systems adopted selective capture strategies, such as manual recording (lamming1994design), biosignal-based triggers (e.g., startle responses (healey1998startlecam) or emotional changes (Memento)), and spatial triggers (Footprint) (e.g., remaining within a 50-meter radius for over five minutes). Beyond storage, accessing and making use of captured data remained challenging. Traditional interfaces are primarily supported browsing by time (Cooper2005), location (toyama2003geographic), or both (chen2006browsing; Gemmell2004; Footprint), offering limited support for efficient navigation and retrieval of relevant past information.
Recent advances in multi-modal large language models (MLLMs) and retrieval-augmented generation (RAG) have improved how memory is captured, stored, and retrieved. Prior computer vision work explored memory structures for embodied agents across tasks such as spatial reasoning (zhu2025struct2d), robot navigation (hu20253dllmm), and persistent 3D scene understanding (fan2025embodied), but these were optimized for offline accuracy rather than real-time human-AI interaction. In contrast, systems like Memoro (Memoro) store conversational snippets as lightweight memory units for efficient live retrieval, while OmniQuery (omniquery) extracts semantic signals from images and videos for structured indexing. Memory Reviver further organizes photo collections into hierarchical representations to support conversational retrieval for BLV users (MemoryReviver). However, these largely text-based approaches remain limited in dynamic real-world settings, where rich visual information cannot be fully captured through text alone.
To address this, StateScribe employs a novel memory architecture that captures visual information from camera frames and selectively retains meaningful object changes in both visual and textual modalities across recent visits, while archiving outdated data to maintain lightweight storage for extended use. StateScribe also has an efficient memory storage and retrieval pipeline that leverages camera poses and visual analysis, enabling it to proactively announce changes in real-time and across visits.

3. Formative Study: Understanding Real-World Changes Meaningful to BLV People
To address a key question, What constitutes meaningful real-world changes for BLV people?, we conducted a survey (Appendix Formative Study Questionnaire) with 33 BLV people (10 male, 21 female, 2 non-binary; mean age=45.1, SD=15.9), including 16 blind and 17 low-vision individuals (Table 1).
3.1. Results
Reported below are our findings on common real-world changes and their impact on the everyday life of these BLV individuals.
3.1.1. Changes during daily commutes
Participants frequently reported temporary barriers near construction sites (N=28), such as fences, traffic cones, scaffolding, tape, and detours, which obstructed their usual routes. The construction sites also sometimes removed or obscured key landmarks (N=7), including signage, pedestrian signals, and tactile paving. In addition, natural changes, such as snowbanks, flooding (N=23), and fallen or overhanging tree branches, further disrupted familiar routes. Furthermore, the replacement of familiar landmarks caused confusion, as F15 noted: “A bus stop that used to be just a bench was replaced with a metal shelter. I didn’t expect it and bumped into it.” While some high-level changes can be anticipated (e.g., via weather or transit updates), pedestrian-level changes remained difficult to detect, with little warning (F20: “no commotion or construction noise”). Participants often noticed them only after collisions, cane detection, or others’ alerts.
3.1.2. Changes during grocery shopping
Beyond temporary barriers (e.g., carts or displays blocking aisles), participants reported spatial changes during grocery shopping, including product relocations (N=24) and aisle rearrangements (N=21). These unexpected changes caused frustration (F18: “The chip aisle became canned food that I had to find someone to locate it.”). Also, price changes and sales signage (N=19) often went unnoticed, leading to surprise at checkout (F6: “I defaulted to the old price.”). To cope with these changes, some participants used human assistance (e.g., Aira (aira)) or AI-powered apps (e.g., Seeing AI (seeingai)), occasionally scanning the environment to locate items (F28). However, most relied on nearby shoppers or store staff and expressed a desire for advance awareness of such changes.
3.1.3. Changes within the home
Participants frequently encountered temporary obstacles or clutter (N=26), including blocked pathways (N=16), furniture rearrangements (N=11), and seasonal decorations (N=9). Such changes stemmed from both participants (N=9) and other household members, with most living with family (N=14) or roommates (N=7). For example, F20 noted that everyday household behaviors (e.g., leaving boxes on the floor) introduced disruptive clutter. These disruptions were particularly challenging as many participants did not use a cane in familiar home environments, leading to collisions (F28: “A chair left in my walking path caused me to fall.”). While a few low-vision participants could detect changes under good lighting, most became aware only through physical contact, often resulting in frustration or minor injuries.
3.2. Summary of Meaningful Visual Changes
In sum, participants mainly relied on memory or direct encounters to navigate familiar environments, occasionally using assistive tools (e.g., white canes, mobile AT) to manage unexpected changes. However, awareness remained largely reactive, highlighting the need for proactive information and advance alerts to reduce navigation difficulties, hazards, and frustration. Based on these insights, we categorize meaningful changes as follows:
-
(i)
Object-Level Changes: Changes involving the presence or the identity of individual objects at a location.
-
–
Appeared: Newly introduced objects not previously present (e.g., construction barriers, clutter).
-
–
Removed: Previously existing objects that are no longer present (e.g., missing landmarks or signage).
-
–
Replaced: Objects substituted by different ones at the same location (e.g., a bench replaced by a bus shelter).
-
–
-
(ii)
Spatial Changes: Changes that alter the arrangement or navigability of the environment.
-
–
Relocated: Objects moved to new locations (e.g., product relocations in stores).
-
–
Layout Changes: Modifications to spatial layout that affect navigation (e.g., aisle rearrangements, blocked pathways).
-
–
-
(iii)
Attribute Changes: Changes in the properties or state of existing objects without altering their identity or position (e.g., price changes, signage updates, on/off status).
4. StateScribe
StateScribe is a system with spatial and temporal memory that observes and describes real-world changes across visits, going beyond live descriptions of the current scene.
For example, when a BLV user explores a new market (Figure 1), StateScribe provides live descriptions for scene understanding, such as “I see a fruit stand with apples and oranges” or “I see a bakery with an ‘OPEN’ sign on its door.” Meanwhile, it continuously builds a memory from captured frames. Upon revisiting the market a week later, StateScribe compares the current view with stored memory and announces changes during navigation, e.g., “The fruit stand at your 10 o’clock is selling watermelon and guava; it sold apples and oranges last week,” “The bakery on your right now shows a ‘CLOSED’ sign; it was open at this time last week,” or “A construction site is at your 1 o’clock, 10 feet away.” Users can also query temporal changes via speech, e.g., “Has it blossomed now?”, receiving responses such as “Yes, the trees have blossomed; they had not last week.” Below, we describe how StateScribe achieves this experience with different system modules.
4.1. Memory Construction Module
In this module, StateScribe streams essential sensor data from the smartphone to the backend for processing and storage within a novel dual-layer memory architecture: (i) an Episodic Scene Memory and (ii) an Object-Centric Temporal Memory. These memory structures are informed by our formative study, which shows that observed changes primarily fall into three categories: single-object changes, spatial changes (e.g., multi-object rearrangement), and attribute changes within an object. However, this design may be limited in capturing fast motion or activity-based changes, which may require additional sensors or computational resources. We leave these extensions to future work and discuss them in Section 7.
Episodic Scene Memory (ESM). To capture the user’s visual context in real time, we design ESM to retain full observations within a configurable temporal context window (e.g., the last 10 days, 5 hours, or single visit), while archiving older data (Figure 2a). ESM serves as the primary memory retrieval source, storing data streamed from the mobile app to the backend at one data frame per second (FPS), including RGB-D frames, confidence maps, camera poses, and associated metadata. Upon receipt, the backend resizes images, refines depth using confidence maps, generates visual embeddings, and asynchronously compresses and stores each instance as a scene object on local disk.
Object-centric Temporal Memory (OTM). To enable persistent tracking of key objects, we introduce OTM, an object-centric memory layer that maintains long-term object dynamics beyond ESM’s temporal window. Specifically, OTM maintains a collection of tracked real-world objects, each represented as a chronological sequence of discrete snapshots. Each snapshot captures the object’s state at a specific moment, including its status relative to the previous scene (e.g., appeared, disappeared, replaced), description, visual embedding, and a world-anchored 3D bounding box (Figure 3f,g). A new OTM entry is created when a change is detected for an object (e.g., it appears, disappears, or is replaced). A new snapshot is appended to an existing entry when a changed object shares a similar 3D location with a prior OTM object, which we detail next.

4.2. Change Detection and Memory Update Module
In this module, StateScribe identifies changes when a user revisits a location by comparing the current frame with its ESM and OTM constructed from prior visits. The process involves: (i) selecting a reference frame from ESM, (ii) comparing reference and current frames to detect changes, and (iii) updating OTM. We develop algorithms and integrate lightweight VLMs to balance accuracy and latency for live interactions (Section 4.7).
Step 1: Selecting a reference frame from ESM. The key challenge is to develop a scalable pipeline to efficiently identify the appropriate reference frame from the ESM as it grows over time. To address this, StateScribe utilizes a hierarchical frame retrieval technique. First, the current camera pose is used as a query to filter and retrieve scene objects in the ESM with similar poses, where the differences lie within translation () and rotation () thresholds. Each candidate ESM object is then evaluated against the current camera pose using a bidirectional visibility score . Specifically, let denote the set of valid 3D points back-projected from a reference ESM object using its RGB-D data and camera intrinsics, where each represents a 3D point in the reference camera coordinate frame. Let denote the projection function that maps a 3D point from the reference camera coordinate to the current camera frame . The resulting projection onto the current frame is referred to as the visibility map (Figure 3f, right). We define the coverage ratio of the visibility map over the current frame as:
| (1) |
where denotes the valid image domain of the current frame. Similarly, is computed in the reverse direction. The final bidirectional visibility score is defined as the harmonic mean of the two directional coverage ratios:
| (2) |
Second, candidates that satisfy the overlap thresholds are grouped into temporal clusters via DBSCAN (dbscan) based on their timestamps (Figure 3c). Specifically, clustering is performed with a temporal radius of seconds and a minimum cluster size of frames. StateScribe then scans the clusters in chronological order, discards those whose changes have already been announced, and selects the reference frame with the highest visibility score from the first valid cluster. In our setup, we set meters, , , and .
Step 2: Comparing reference and current frames to detect changes. Once a reference frame is selected, StateScribe identifies scene changes by prompting a VLM with both the reference and current frames to highlight changed objects using bounding boxes (Prompt# 8). It returns the type of change for each detected object, including appeared, removed, or content changed, along with a textual description and a confidence score. StateScribe then rejects bounding boxes whose overlap with their corresponding visibility masks (described in step 1) falls below a threshold (Figure 3f). The remaining 2D bounding boxes are further filtered by confidence and size, then passed to a segmentation model to extract object masks and generate visual embeddings. These masks are subsequently projected into 3D space to estimate the objects’ 3D locations. Our current setup processes at 1 FPS, and we empirically set the temporal clustering parameters to .
Step 3: Updating OTM. Each detected change, along with its 2D mask, 3D bounding box, and the associated change type and description, is then updated in OTM. We determine if a detected object is new or corresponds to an existing OTM entry by computing the 3D Intersection over Union (IoU) between the detected 3D bounding box and a prior 3D bounding box :
| (3) |
where denotes the intersection volume of the two boxes. StateScribe iterates over existing objects in OTM and retains candidate prior boxes whose IoU with exceeds a minimum threshold . For the remaining candidates, StateScribe computes the cosine similarity between the visual embeddings of the new and prior objects. If the similarity exceeds a threshold , the object is treated as the same instance and recorded as a new snapshot in the corresponding OTM entry; otherwise, it is stored as a new OTM entry. Identified change snapshots, including change type, descriptions, reference, and current images, are then queued in the scheduling module to present (Section 4.5). We set and .
4.3. Live Description Generation Module
In this module, StateScribe generates live visual descriptions to support the scene understanding. Unlike prior systems that use multiple VLMs and adaptive prompting for context-aware descriptions (WorldScribe; TouchScribe), StateScribe adopts a simplified approach using frame filtering and a single VLM with a fixed prompt (Prompt# 8). To detect new scenes, it computes visual embeddings for incoming frames and compares them with the most recently described frame using cosine similarity; frames exceeding a threshold () are treated as redundant and skipped. To further reduce repetition, generated descriptions are also compared via text embeddings with prior outputs, and those exceeding a threshold () are discarded. The remaining descriptions are queued for presentation (Section 4.5). We empirically set and by default.
4.4. Interactive Q&A Module
In this module, StateScribe allows users to interrupt ongoing descriptions and issue queries. It supports change-related queries over single or multiple objects across time, within specified intervals, and their spatial variations. This is achieved by a Q&A agent that interprets each query and invokes tools over ESM, OTM, and spatial data (Prompt# 8): (i) ESM retrieval for current scene queries, returning the most recent frames; (ii) OTM retrieval for temporal changes, returning recent object snapshots with distance and direction; and (iii) Spatial information retrieval for spatial queries, returning object locations (e.g., “11 o’clock, 5 feet away”). These tools are composed based on query intent. For example, “Where is the cone?” uses ESM retrieval and Spatial information retrieval, while “What changed since my last visit?” uses OTM retrieval.
4.5. Description Scheduling & Delivery Module
In this module, StateScribe coordinates change snapshots, live descriptions, and interactive Q&A. Visual queries are prioritized, after which live and change descriptions resume. StateScribe maintains a buffer () of recent live descriptions and change snapshots. Live descriptions that persist beyond a time threshold (e.g., 6 seconds) are considered outdated and discarded, while change snapshots (e.g., appeared, removed, content changed), along with their images and 3D locations, are retained. Using this aggregated context in a single prompt (# 8), StateScribe employs a VLM to infer higher-level events, such as object replacement (via overlapping 3D positions) or movement (via disappearance and reappearance across locations).

4.6. Mobile User Interface
StateScribe provides a mobile app interface (Figure 2a). The home screen displays visits as cards, each with a thumbnail and an AI-generated title. When returning to a location, users can select the corresponding card to open a live camera view for relocalization and resume StateScribe’s memory for that place. For new locations, they can create a visit using the “Add” button. Users can also rename or delete visits. While the current interface requires users to manually recall and select past visits, future iterations could incorporate GPS or indoor localization data to automatically cluster visits or create a new visit upon arrival at a new location.
4.7. Implementation Details
To enable StateScribe’s spatial and temporal memory capabilities, we use a smartphone as the primary device to access depth information, which is not available on the current smartglasses that typically rely on monocular cameras. We also adopt a low frame rate (i.e., 1 FPS) to support long-term use and scalability for memory storage, retrieval, and live interaction, in contrast to the higher frame rates used in prior systems (WorldScribe; TouchScribe). Our StateScribe mobile app is deployed on an iPhone 17 Pro and relies on camera poses and RGB-D images are continuously captured via Apple’s ARKit framework. These data streams are transmitted to the backend at one FPS over a TCP connection. StateScribe leverages ARKit’s built-in geometric relocalization to align the current camera coordinates with those from prior visits to the same location. Each location is assigned a unique identifier by the mobile application. Upon successful relocalization, the backend uses this identifier to load the corresponding ESM and OTM. The backend is hosted on a MacBook M4 Max for our user study, while the technical evaluation is conducted on a desktop with an AMD Ryzen Threadripper PRO 7965WX CPU and an NVIDIA RTX 6000 Ada GPU. We set the ESM context window to a single visit, meaning it retains and retrieves data only from the last visit for both the user and technical evaluation.
We adopt lightweight VLMs for live interactions to balance latency and accuracy. Specifically, live descriptions are generated using Gemini 3.1 Flash-Lite Preview, while change detection, Q&A, and buffered description summarization are handled by Gemini 3 Flash Preview. FastSAM (zhao2023fast) is used for 2D mask segmentation. Visual embeddings are extracted using a pre-trained DINOv3 model (simeoni2025cijo), and text embeddings are generated with all-MiniLM-L12-v2.
5. Technical Evaluation
We conducted a technical evaluation to assess whether StateScribe (i) captures and preserves longitudinal memory across repeated visits, (ii) scales efficiently as stored data grows over extended use, and (iii) improves real-time awareness of changes in 3D physical environments during interactive use.
5.1. Datasets
To simulate extended use, we constructed a dataset of repeated visits to the same environments over time. The dataset includes three environments (Figure 7): (i) a shared office with varying objects on tables, (ii) a grocery store with densely arranged items across shelves, and (iii) an outdoor courtyard featuring signs and barriers. Each scenario contains 11 recorded visits (around 2–4 minutes per visit), including a video, RGB-D frames, camera intrinsics, and poses, capturing observations at different time points. We systematically introduced object changes based on the spatial layout of the shared office, 104 for the grocery, and 83 for the outdoor scenario. In total, the dataset contains 291 annotated changes, labeled by three researchers with 3D world locations, object identities, and change categories.
5.2. Baseline Conditions and Evaluation Metrics
To evaluate the effectiveness of StateScribe’s design, we compared it against two VLM-only baselines: a Live model and a Offline video model. For both baselines, we concatenated the recorded videos from multiple visits in the same scenario and sampled them at 1 FPS. In the Live model, we prompted the VLM (i.e., gemini-3-flash- preview) at 1 FPS to approximate real-time interaction similar to StateScribe (Prompt# 8). This baseline examines whether StateScribe improves over a direct VLM-only real-time pipeline. In the Offline video model condition, we provided the concatenated 1 FPS video to gemini-3.1-pro as a single input for detecting changes within or across visits (Prompt# 8). This baseline evaluates StateScribe against an offline setting that processes all observations jointly rather than sequentially. In this baseline comparison evaluation, we used the same Gemini model family as in StateScribe to isolate the effect of system design rather than differences across model families.
We adopted an LLM-as-judge approach using Gemini 3.1 Pro to evaluate predictions, including object, location, change type, and descriptions (e.g., “The white Milano cookie box has been removed from the shelf.”), against ground truth. We reported overall performance using -score, recall, and precision. We further analyzed the raw number of outputs to assess repetitiveness and coverage, and then evaluated spatial accuracy, including clock and distance errors, under each condition. We repeated the same evaluation on data collected from BLV participants in our user study. Finally, to assess scalability, we simulated extended use by concatenating 11 visits 10 times (110 visits in total), to measure storage and latency.
5.3. Results
We first reported the overall performance across models on both our collected dataset (Figure 4) and data captured by BLV participants in our user study (Figure 11). We then evaluated the performance of StateScribe under extended use (Figure 5).
5.3.1. Overall Performance
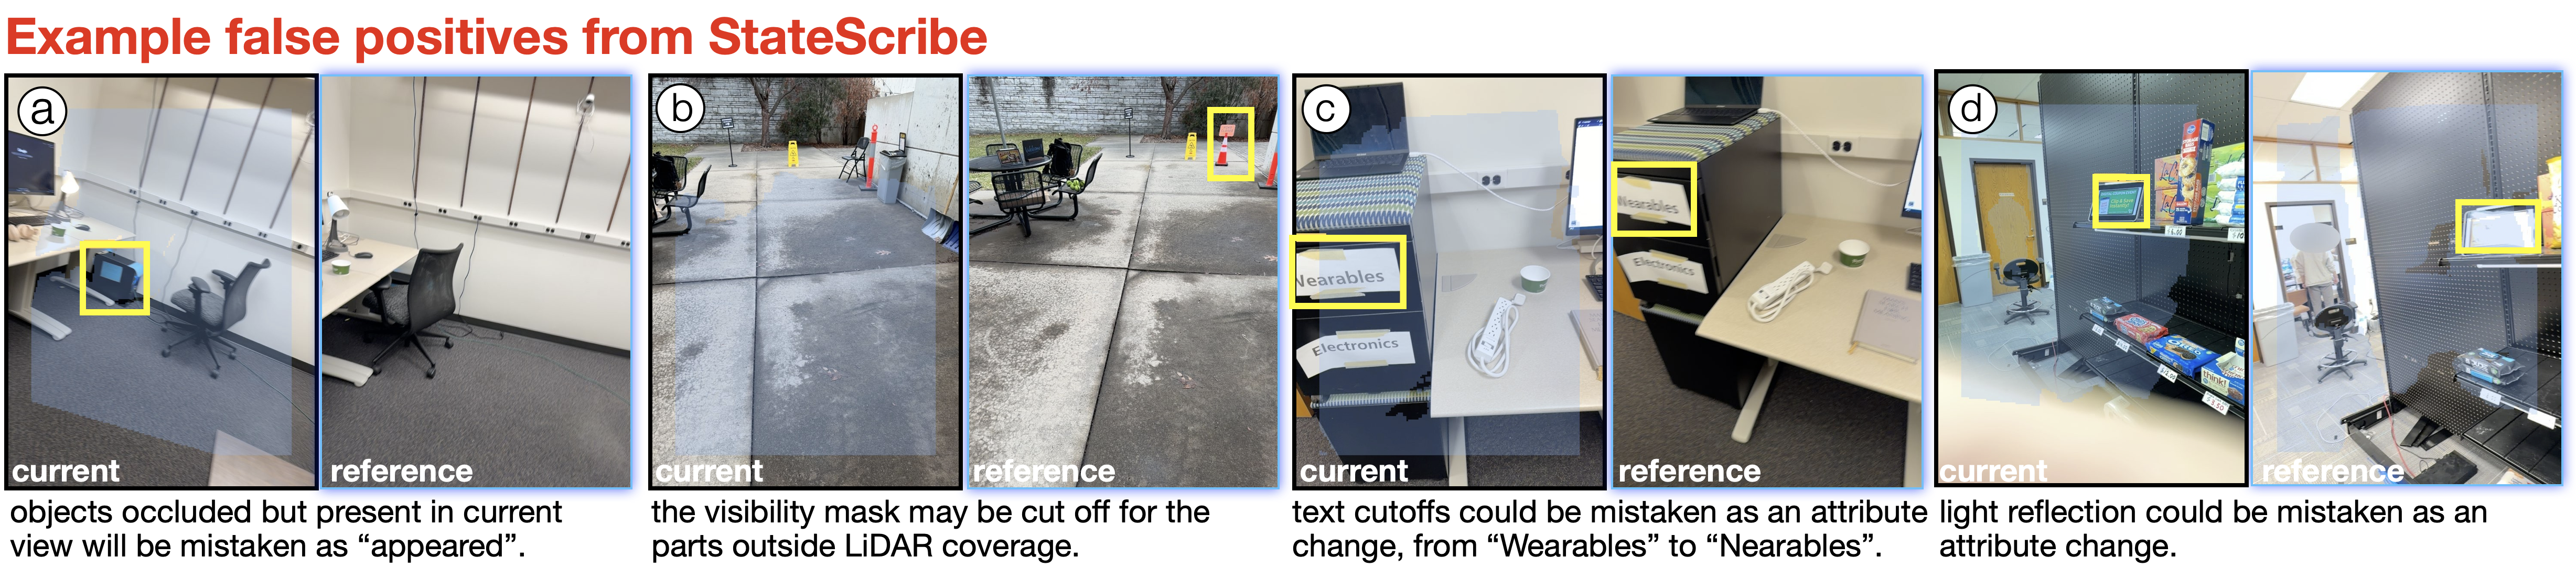
We reported the overall performance across all 291 ground-truth instances collected from three scenarios, each with 11 visits. StateScribe outperformed both baselines in change detection (Figure 4a). It achieved an -score of 83.1%, substantially higher than the Live model (40.1%) and the Office video model (27.4%). This performance was driven by both high recall (84.9%) and precision (81.3%), indicating that StateScribe captures most changes while avoiding excessive false positives. In contrast, the Live model achieved moderate recall (70.1%) but low precision (28.0%), resulting in many incorrect predictions. The Offline video model, while achieving moderate precision (67.1%), exhibited low recall (17.2%), missing detecting most changes that lead to poor overall performance. Most false positives in both models occurred when objects appeared near the image edge without prior visibility (Figure 8). Likewise, objects misclassified as removed had merely left the camera’s view while still existing (Figure 8), whereas StateScribe mitigated this using visibility masks (Figure 9). Errors in StateScribe mainly arose for distant objects beyond LiDAR coverage and from hallucinations caused by text cutoffs or light reflections (Figure 10).
When examining the Prediction Distribution across models, including counts of correct, incorrect, and repetitive predictions, we observed a wide variance in output behavior (Figure 4b). StateScribe produced 444 predictions, including 81.13% correct (N=361, including 126 repetitive), and 18.7% incorrect outputs (N=82). In contrast, the Live model produced a large number of predictions (N=1558), despite only 291 true changes in the dataset. As a result, the majority of its outputs were incorrect (72.0%, N=1121), while 28.1% were correct (N=437, including 233 repetitive), reflecting both a high error rate and considerable redundancy. Furthermore, the Offline video model generated far fewer predictions (N=82), comprising 61% correct (N=50, including 5 repetitive), and 32.9% incorrect outputs (N=27). This aligns with its previously observed high precision and low recall, suggesting conservative behavior or limited ability to capture all changes.
In terms of spatial accuracy (Figure 4c), StateScribe outperformed both models, achieving lower clock-direction errors (in hour units; M=0.24, SD=0.52) than the Live model (M=1.98, SD=1.41) and the Offline video model (M=1.86, SD=0.69). A similar trend was observed for distance estimation: StateScribe yielded smaller errors (in feet; M=0.68, SD=1.63) than the Live model (M=5.29, SD=3.50) and the Offline video model (M=6.49, SD=1.89).
Overall, StateScribe achieved a better balance between coverage and accuracy, identifying more changes than both models while having substantially fewer errors and repetitive outputs than the Live model. This trend also extended to spatial accuracy, with StateScribe showing lower clock-direction and distance estimation errors.
5.3.2. StateScribe’s performance in user study
Next, we used the same evaluation metrics on the data collected from our user study (see Section 6.2 for data details), where camera frames from BLV participants may differ due to camera aiming. Overall, StateScribe showed similar trends (Figure 11), outperforming both baselines across 269 tasks. It achieved an -score of 76.5%, higher than the Live model (29.4%) and the Offline video model (53.0%). This performance is driven by both high recall (79.1%) and precision (74.0%), indicating effective change detection with limited false positives. In comparison, the Live model achieved similar recall (79.3%) but very low precision (18.1%), leading to many false positives. The Offline video model showed moderate precision (65.3%) but low recall (44.7%), missing many changes. Similar trends were observed in spatial accuracy. StateScribe achieved lower clock-direction error (in hours; M=0.27, SD=0.70) than the Live model (M=2.58, SD=1.60) and the Offline video model (M=1.56, SD=1.46). It produced smaller distance errors (in feet; M=0.53, SD=1.35) compared to the Live model (M=2.21, SD=2.80) and the Offline video model (M=3.45, SD=3.32).

5.3.3. StateScribe’s latency and memory footprint over extended use
To model long-term usage and characterize latency and memory growth, we repeated 11 visits 10 times, yielding 110 visits per scenario. This yields 17,350 frames for Office, 17,460 for Grocery, and 18,360 for Outdoor; each corresponds to approximately 5 hours of data at 1 FPS. In terms of latency, it remains low across all scenarios, including Grocery (Median=0.37s, Mean=1.42s), Office (Median=0.21s, Mean=1.32s), and Outdoor (Median=0.14s, Mean=1.11s), which reflected long-tailed distributions with occasional outliers. This indicated that most interactions were processed quickly, with only rare spikes. To further examine latency contributions, we decomposed processing time into system components. Across all scenarios, VLM inference dominated latency (Grocery: M=1.02s; Office: M=1.08s; Outdoor: M=0.91s). In contrast, frame queuing for processing (M=0.11s, 0.10s, 0.09s), reference matching for retrieving past frame data (M=0.27s, 0.12s, 0.07s), and post-processing for updating OTM (M=0.01s across all scenarios) contributed relatively minor overhead. Notably, reference matching was higher in Grocery (M=0.27s) than in Office (M=0.12s) and Outdoor (M=0.07s), likely due to the denser scenes increasing matching complexity. Overall, these results suggest that StateScribe maintains stable performance over extended use, with latency primarily bounded by VLM inference rather than system-level overhead.
Over extended use for 110 visits, StateScribe maintained a bounded memory footprint that scales proportionally with the number of visits. The final OTM size across 110 visits was 49.4 MB (Grocery), 54.6 MB (Office), and 39.4 MB (Outdoor). The Office scenario exhibited the largest memory due to more change snapshots (N=1,517) of tracked objects (N=204), while Grocery showed moderate growth with moderate snapshots (N=1,107) of tracked objects (N=192), and Outdoor remained smaller due to fewer snapshots (N=999) of tracked objects (N=174).
Overall, latency did not increase with OTM size, as our memory architecture reads only prior- visit data from ESM, discards outdated information, and stores only essential object changes in OTM. The current scale of OTM (110 visits) also remains computationally manageable during retrieval.
6. User Study
Next, we conducted a user study with 9 BLV participants to understand: (i) How effectively does StateScribe support users in perceiving and understanding changes in different environments? (ii) How do participants perceive the user experience of StateScribe?
6.1. Participants
We recruited 9 BLV participants (6 Male and 3 Female) using email lists for local accessibility organizations, prior contacts, and snowball sampling (Table 2). Participants aged from 25 to 74 (avg. 49.7) and described their visual impairment as blind (N=6) or having low vision (N=3). Most participants had prior experiences using remote sighted assistance (e.g., Be My Eyes (bemyeyes), Aira (aira)) and AI-enabled services (e.g., Seeing AI (seeingai), Be My AI (bemyai)).
6.2. Procedure, Tasks and Analysis
The study consisted of three sessions: (i) a onboarding session, where participants learned to use StateScribe; (ii) a main task session, where participants were asked to identify changes in three different scenarios, including a shared office, a grocery store, and an outdoor courtyard; and (iii) an interview session, where participants reflected on their experiences and responded to Likert-scale questions.
For each scenario in the main task session, participants first explored the environment and then revisited it. During each visit, researchers introduced within-visit changes by moving objects in real time to simulate common dynamics in shared or public spaces (e.g., placing or removing items; Table 3). Examples included placing a bottle on a shared table, taking items in the grocery store, or removing outdoor obstacles by workers (Table 3). Between visits, the researcher introduced cross-visit changes to simulate longer-term rearrangements (e.g., days or weeks). These included moving chairs in the shared office, price changes in the grocery store, and removing signage in the outdoor walkway. These changes approximated everyday dynamics within the time constraint of a two-hour study. In total, the shared office and grocery store scenarios each included 13 changes (8 within-visit, 5 cross-visit), while the outdoor scenario included 12 changes (8 within-visit, 4 cross-visit).
During the study, participants independently explored the indoor environments (e.g., a shared office and grocery store). In the outdoor scenario, a researcher accompanied participants for safety, while the participants retained full control over their exploration. In total, we collected 18 visit records for the shared office (117 tasks = 9 participants × 13 changes), 16 for the grocery store (104 tasks = 8 participants × 13 changes; P9 excluded due to corrupted data), and 8 for the outdoor courtyard (48 tasks = 4 participants × 12 changes), as only four participants completed the outdoor condition due to extreme weather. In total, this yielded 269 tasks.
During the visit, participants were asked to think aloud when noticing changes. Tasks were marked as successful if participants accurately described the changes, and incomplete otherwise. We analyzed task completion rates, subjective Likert-scale ratings, and their qualitative feedback. We also evaluated the data using the same pipeline as in our technical evaluation, since camera frames captured by BLV participants may differ due to camera aiming issues (WorldScribe; TouchScribe; gurari2018vizwiz) (see results in Section 5.3.2).

6.3. Results
6.3.1. How effectively does StateScribe support users in perceiving and understanding changes in different environments?
Overall, participants successfully completed most tasks within around 10 minutes, achieving completion rates of 82.9% (shared office), 82.7% (grocery), and 89.6% (outdoor). In the shared office scenario, issues were mainly due to camera aiming: some regions (e.g., parts of desks) were not captured, leading to incomplete memory, and subtle view changes, such as slightly pulled-out chairs, were hard to detect (4/9 misses). In the grocery scenario, removing the cart from the aisle had a lower completion rate (50%) than in other tasks, as participants focused the camera on nearby shelf items, and often missed objects at the periphery of the scene. Consequently, the shopping cart, positioned near the edge of the scene, was often partially or not captured at all. Additionally, sparkling water boxes on the upper shelves introduced visual ambiguity, leading to missed detections of Lay’s chips (3/8 misses). In contrast, the outdoor scenario yielded higher performance, as the larger space and sparser object layout made changes easier to capture and detect.
6.3.2. How do participants perceive the user experience of StateScribe?
Participants rated StateScribe as easy to learn and use (M=5.8, SD=0.8), noting that automatic descriptions and the hold-to-ask interaction were intuitive. However, some found manually retrieving prior visits cumbersome, suggesting solutions by “using GPS and auto-relocalization when the camera is always on, like smartglasses” (P1). Participants perceived the descriptions as accurate (M=6.0, SD=1.0) and expressed high trust in StateScribe (M=5.7, SD=1.4), supported by temporal and directional details (also evidenced by our technical evaluation at Section 5.3.2). For instance, P8 noted “it was cool how it could say 7 minutes ago was this, 5 minutes ago was that,” while P3 emphasized that “exact directionality makes me confident to trust the system.” These perceptions were corroborated by low-vision users (P1, P6, P8), who could verify details at close range, and blind users, who found descriptions consistent over time (e.g., P4: “when it matches what it said before, that gives me confidence that it’s accurate.”). Although participants reported reasonable coverage of the objects of interest (M=5.2, SD=1.6), they desired richer contextual interactions from StateScribe. For example, P4 wanted descriptions tailored to intent (“narrowly focused if I am only interested in chips”), while P1 preferred a more human-like tone, such as reminders that “You were here two days ago and did [X], and [Y] was present at that time.”
Participants were impressed by StateScribe’s memory capabilities, which are not supported by current off-the-shelf visual assistive technologies. For example, P5 described it as a “promising integration with Seeing AI scan function,” while P3 noted, “I’m astounded at how well it remembers and describes differences as you move. That’s not something Be My AI can do.” Participants also found the descriptions helpful (M=5.9, SD=1.2) and expressed willingness to use StateScribe in real-world settings (M=5.6, SD=1.4). For example, P8 described a bus navigation experience, noting that StateScribe could be helpful: “Maps told me to stand in one place to catch the bus today, but it was relocated by a couple of hundred feet, so I had to walk around to find it. This [StateScribe] could help me find the relocation out more quickly.” P2, who was a mental health counselor, suggested “it could be helpful to know the person’s attire, like in military manner or slovenly from time to time, and if their facial expression changes during conversation.” Despite positive feedback, some participants reported information overload and wanted more control over the information delivered, especially when using other aids. For example, P6 suggested omitting changes, like “A chair appeared in front of you. It was not there before,” when already perceived with a cane. We discuss potential improvements further in later sections.
7. Discussion and Future Work
We discuss our lessons learned and design implications for extending StateScribe to broader use cases in the long term.
Device choices and interface constraints. Camera-based ATs face persistent challenges, including object aiming (Guo2018Cursor; Vazquez2012; HandsHoldingClues; LastMeter; Manaswi2019; Lee2019ASSETS), content coverage (VisPhoto), and social acceptability (Koelle2019; Profita2016; Akter2022). StateScribe currently relies on sensory inputs from a smartphone (RGB-D images and camera poses) to construct spatial memory. However, a depth camera requires an RGB camera with a standard FoV for alignment, limiting coverage and demanding more precise aiming. This may explain higher performance outdoors (89.6%) than in denser indoor settings (82.7% grocery, 82.9% office). Some participants also raised usability concerns about continuous handheld use. We envision that StateScribe can generalize to such wearables with RGB-D input and camera pose tracking to offer hands-free interaction (TouchScribe), though privacy and social concerns could remain (Akter2022). Finally, StateScribe required manual selection of prior visits. Future work could enable automatic relocalization (e.g., via GPS) to streamline revisits.
Detecting more types of changes with additional sensors. As noted in Section 4.1, StateScribe focuses on object-level changes, enabling effective real-time detection and across revisits. However, at 1 FPS, it may miss fast or transient changes (e.g., moving cars, flashing lights, or human activities). Although increasing frame rate could help, it may introduce trade-offs in computation, storage, and retrieval. An alternative is to augment StateScribe with additional sensors. For instance, event cameras can capture high-frequency motion and light changes asynchronously, while infrared cameras can detect otherwise invisible changes such as temperature variations (e.g., heating or cooling objects). Integrating these modalities could expand the range of detectable changes and improve robustness by referencing different sensor outputs.
Integrating different information cursors to deliver the right information timely. StateScribe uses the user’s 3D location (from camera pose) as an information cursor, a mechanism to indicate information of interest, to retrieve memory, and detect changes across revisits. However, our study showed that user needs extended beyond change detection and vary by context, and StateScribe does not always surface the most relevant information in time. For example, participants often held items and sought visual details (e.g., color or flavor) in grocery settings, or needed detailed information (e.g., whether stairs go up or down) and signage texts in outdoor settings. These needs could be better supported by prior systems that use different user activities as information cursors, such as leveraging hand-object interactions as intent cues (TouchPhoto; HandsHoldingClues; Lee2019ASSETS), or using camera motion to obtain adaptive visual details (WorldScribe). Together, these works shift visual assistance from reactive question answering to proactive interaction. However, effectively integrating multiple information cursors and delivering the right information at the right time remains an open challenge. Future work should explore how to model user context, select appropriate information cursors, and map user intent to timely descriptions.
Towards a long-term assistive AI companion. To our best knowledge, StateScribe is the first AI-driven live description system with memory for change detection, outperforming both a VLM-only Live model and an Offline video model (Section 5.3.1). It also scales to extended use across three scenarios with low latency and memory overhead (Section 5.3.3). However, challenges remain in making it a reliable long-term assistive companion. Participants expected StateScribe to account for their assistive context (e.g., using a white cane) or information preference to reduce redundant information, and to provide richer contextual reminders when revisiting locations, similar to a human companion (Section 6.3). Furthermore, memory should extend beyond object-level changes to capture semantic relationships and structured knowledge within environments. For example, participants wondered if StateScribe’s memory could extend beyond individual object changes to a more holistic, global understanding (e.g., store layout, aisle-level organization). This could be enabled by integrating structured scene memory as an additional layer (zhu2025struct2d; hu20253dllmm; fan2025embodied), potentially augmented by community-contributed data collected over time. Future work could explore designing AI companions that better model human-like guidance, adapt to users’ evolving contexts, and integrate more global, structured representations of space for meaningful interactions.
8. Conclusion
In this paper, we introduced StateScribe, a system that enables accessible awareness of real-world changes across revisits. Informed by a formative study, we identified meaningful change categories for BLV people and developed a dual-layer memory architecture comprising Episodic Scene Memory and Object-centric Temporal Memory. This architecture supports real-time change detection, persistent tracking across revisits, and enhanced scene understanding through accurate spatial descriptions, live descriptions, and queries over current and past changes. Our technical evaluation shows that StateScribe detected changes more accurately than the VLM-only live model or offline video model while remaining low-latency and memory-efficient for extended use. A user study further showed that StateScribe helped BLV people effectively identify changes across revisits in different locations. Through this work, we also recognized that enabling an AI-assisted companion requires broader observation of changes, reasoning over those changes, and adapting information to individual users, intents, and contexts.



| PID | Gender | Age | Level of Vision | Cause of Impairment | Visual Onset | Other Impairments |
|---|---|---|---|---|---|---|
| F1 | Male | 19 | Low vision | Stargardt’s disease | Congenital | No |
| F2 | Female | 50 | Low vision | Unknown | Acquired | Balance problem |
| F3 | Female | 23 | Fully blind | Microphthalmia | Congenital | No |
| F4 | Female | 55 | Low vision | Retinitis pigmentosa | Congenital | No |
| F5 | Female | 67 | Low vision | Cataracts | Acquired | No |
| F6 | Male | 19 | Low vision | Stargardts | Congenital | No |
| F7 | Female | 64 | Low vision | Congenital Cataracts | Congenital | Hearing loss on left ear |
| F8 | Female | 63 | Low vision | Ocular Melanoma | Acquired | Hard of hearing on left ear |
| F9 | Female | 52 | Fully blind | Retinitis Pigmentosa, Macular Degeneration, Atrophied Optic Nerve, Open-angle glaucoma | Acquired | No |
| F10 | Female | 33 | Low vision | Glaucoma | Congenital | No |
| F11 | Female | 59 | Low vision | Unknown | Acquired | Hip, Knee & Lower back pain |
| F12 | Female | 71 | Fully blind | Retinopathy of Prematurity. | Congenital | Mild hearing loss |
| F13 | Male | 70 | Low vision | Retinitis Pigmentosa | Acquired | Unknown |
| F14 | Male | 31 | Fully blind | Norrie | Congenital | Hearing loss |
| F15 | Male | 34 | Low vision | Retinopathy of Prematurity | Congenital | No |
| F16 | Male | 31 | Fully blind | Unknown | Congenital | No |
| F17 | Non-binary | 35 | Legally blind | Pathologic Myopia | Congenital | No |
| F18 | Female | 22 | Low vision | Macular Degeneration rod; Dystrophy | Acquired | No |
| F19 | Male | 38 | Fully blind | Retnal Blastoma | Congenital | No |
| F20 | Female | 32 | Legally blind | Cone-rod Retinal Dystrophy | Acquired | No |
| F21 | Male | 57 | Fully blind | Sclateral Cornea | Congenital | Unknown |
| F22 | Female | 39 | Fully blind on left eye; low vision on right eye | Severe Proliferative Diabetic Retinopathy and Double Vision | Acquired | No |
| F23 | Female | 30 | Fully blind | Retinopathy of Prematurity | Congenital | Unknown |
| F24 | Non-binary | 43 | Legally blind on one eye; fully blind on other eye | Retinopathy of Prematurity | Congenital | Attention Deficit Hyperactivity Disorder (ADHD) |
| F25 | Female | 70 | Low vision | Retinitis Pigmentosa | Congenital | No |
| F26 | Male | 45 | Low vision | Stargardt’s disease | Acquired | Spinal Cord Injury / Tetraplegia |
| F27 | Female | 44 | Legally blind | Leber Congenital Amaurosis | Congenital | Autism |
| F28 | Male | 42 | Low vision | Optic Nerve Atrophy | Acquired | Mild hearing loss |
| F29 | Female | 65 | Legally blind | Ocular Albinism | Congenital | No |
| F30 | Female | 52 | Legally blind | MAK-1 Retinitis Pigmentosa | Congenital | No |
| F31 | Female | 62 | Fully blind | Congenital cataracts, Scarred corneas and small eyes | Congenital | Mild hearing loss |
| F32 | Female | 34 | Low vision | Senior-Loekins Syndrome Type 5 | Congenital | No |
| F33 | Female | 38 | Legally blind | Aniridia | Congenital | Unknown |
Formative Study Questionnaire
Section 1: Vision Information
-
(1)
How would you describe your level of vision?
-
(2)
When did you lose your vision?
-
•
Congenital (since birth)
-
•
Acquired (later in life)
-
•
-
(3)
Please describe your vision onset and how it has progressed over time.
-
(4)
What is the cause or diagnosis of your visual impairment?
-
(5)
Which assistive tools do you use? (Select all that apply)
-
•
White cane
-
•
Guide dog
-
•
Magnifier
-
•
Screen reader (desktop)
-
•
Screen reader (mobile)
-
•
Orcam
-
•
Ray-Ban Meta Smart Glasses
-
•
Other: _____
-
•
-
(6)
Which mobile apps do you use for visual access?
-
•
Seeing AI
-
•
ChatGPT
-
•
Be My Eyes
-
•
Be My AI
-
•
Aira
-
•
Other: _____
-
•
-
(7)
Which apps do you use for navigation?
-
•
SoundScape
-
•
BlindSquare
-
•
Google Maps
-
•
RightHear
-
•
Clew
-
•
Lazarillo
-
•
Seeing Eye GPS
-
•
NavCog
-
•
Other: _____
-
•
-
(8)
Do you have any additional impairments (e.g., hearing)?
Section 2: Changes During Daily Commutes
Focus: Outdoor navigation and route changes.
-
(1)
How often do you commute?
-
•
Daily (5+ days/week)
-
•
Most days (3–4 days/week)
-
•
Occasionally (1–2 days/week)
-
•
Rarely
-
•
Special events only
-
•
Fully remote
-
•
Other: _____
-
•
-
(2)
How do you typically commute? (Select all that apply)
-
•
Driving
-
•
Carpooling
-
•
Public transportation
-
•
Bicycle
-
•
Walking
-
•
Ride-hailing
-
•
Other: _____
-
•
-
(3)
What changes have you encountered on familiar routes?
-
•
Construction or detours
-
•
Traffic pattern changes
-
•
New traffic signals or signs
-
•
Changes in landmarks
-
•
Weather-related obstacles
-
•
Other: _____
-
•
-
(4)
Describe a time when a route change surprised you.
-
(5)
How do you usually learn about route changes?
-
(6)
What changes would you like to be alerted about, and how?
Section 3: Grocery Shopping
Focus: Indoor navigation in retail environments.
-
(1)
How often do you shop for groceries?
-
•
Multiple times per week
-
•
Weekly
-
•
Every 2–3 weeks
-
•
Monthly
-
•
As needed
-
•
Delivery/pickup
-
•
Other: _____
-
•
-
(2)
What store changes have you encountered?
-
•
Aisle rearrangements
-
•
Blocked paths
-
•
Product relocations
-
•
Pricing/signage changes
-
•
Crowding
-
•
Other: _____
-
•
-
(3)
Describe a time when a change surprised you.
-
(4)
How do you learn about these changes?
-
(5)
What alerts would improve your experience?
Section 4: Home Environment
Focus: Navigation and organization at home.
-
(1)
What is your living situation?
-
•
Alone
-
•
With family
-
•
With roommates
-
•
Other: _____
-
•
-
(2)
What navigation-related changes occur at home?
-
•
Furniture rearrangement
-
•
Temporary obstacles
-
•
Lighting changes
-
•
Blocked pathways
-
•
Smart device changes
-
•
Seasonal decor
-
•
Other: _____
-
•
-
(3)
Describe a surprising moment caused by these changes.
-
(4)
How do you become aware of these changes?
-
(5)
What object-related changes affect you?
-
•
Items moved
-
•
Items stored away
-
•
Seasonal swaps
-
•
Storage changes
-
•
Label changes
-
•
Other: _____
-
•
-
(6)
Describe a surprising object-related change.
-
(7)
How do you become aware of object changes?
-
(8)
What home changes would you want alerts about?
Section 5: Overall Environment
-
(1)
How do you prepare for navigating familiar spaces?
-
(2)
How do you handle unexpected changes?
-
(3)
How do you use memory and tools when navigating?
-
(4)
What makes environmental changes easy or difficult to adapt to?
| PID | Gender | Age | Level of Vision | Cause of Impairment and Residual Vision | Vision Onset |
|---|---|---|---|---|---|
| P1 | Male | 27 | Legally blind | ELOVL4-associated Autosomal Dominant Stargardt Disease | Acquired |
| P2 | Female | 74 | Fully blind | blind but some light perception | |
| P3 | Female | 62 | Legally blind | Left Vision ranges between 20/500 and 20/800. No vision in right eye. | Acquired |
| P4 | Male | 62 | Low vision | light perception and can sometimes spot differences in color/shade | Acquired |
| P5 | Male | 42 | Fully blind | blind but have light perception | Conginetal |
| P6 | Male | 36 | Legally blind | Retinitis Pigmentosa | Conginetal |
| P7 | Female | 25 | Legally blind | Viral Encephalitis | Acquired |
| P8 | Male | 56 | Legally blind | 20/400 | Acquired |
| P9 | Male | 63 | Fully blind | blind and no light perception | Conginetal |
| Changes | Shared Office | Grocery Store | Outdoor |
|---|---|---|---|
| Initial Setup | Table 1: - Monitor display showing the Amazon page - A lamp (turned off) - A pair of sunglasses - A black keyboard - A black mouse - A pair of black headphones - A black chair on the right side of the table Table 2: - A white flower pot - A beige colored book, titled “Man’s Search for Meaning.” - A pair of blue scissors - A black stapler - A white pen holder (with multiple stationery items inside) | - A shopping cart - Price tags for each item Bottom shelf: - Pink good wipes - Chips Ahoy - Original Oreo - Three boxes of Think! Protein bars - Three boxes of One Biscuit Bars - Six cans of Coke - Four cans of Sprite - Cheetos mini in canister Top shelf: - A box of Cascade Platinum dishwasher pods - Five flushable wipes - A box of sandwich bags - Digital display tablet showing a pizza advertisement - Six boxes of La Croix Sparkling Water (distractors) | - A “Reception” signage - A blue garbage bin - A blue shovel - A tennis racket on the chair - A yellow caution sign - A digital display on the table - A chalkboard says “Enjoy” |
| within-visit Changes 1 | - Add a green cup to Table 1 - Remove the flower pot from Table 2 - Replace the beige book with a blue book - Change the monitor display to Google Maps | - Add Lay’s chips to the top shelf - Replace pink wipes with black wipes on the bottom shelf - Change the display tablet to a pet promotion - Remove Chips Ahoy from the bottom shelf | - Remove the yellow sign - Replace the blue shovel with the gray shovel - Change the display on the tablet - Add a foldable chair |
| cross-visit changes | Table 1: - Replace the black headphones with pink headphones - Remove sunglasses - Move the chair to the left side of the table - The lamp is turned on Table 2: - Add a plastic water bottle | - Remove shopping cart Bottom Shelf: - Replace the Original Oreo with Caramel Coconut Oreo - Add a box of Sour Patch next to Sprite Top Shelf: - Remove Cascade Platinum dishwasher pods - Change the price tags (Flushable wipes, Brownie Think! Bar, Caramel Macchiato One Biscuit Bar) | - Replace the foldable black chair with a traffic cone with a “Road Closed” sign - Add the blue shovel - Remove the “Reception” sign - Information chalkboard changed to “Welcome” |
| within-visit Changes 2 | - Add a flower pot to Table 1 - Remove the blue scissors - Replace the blue book with the beige book - Change the monitor display to the Google Search page | - Add Chips Ahoy back to the bottom shelf - Remove Lay’s chips from the top shelf - Replace the sandwich bags with a storage bag on the top shelf - Change the monitor display to a promotional coupon | - Remove the gray shovel - Replace the tennis racket with a pickleball paddle - Add the yellow sign back - Change the “Road Closed” sign to “Detour” |
