Characterizing the GD-1 Stream with DESI DR2 Data: Thin Stream and Hot Cocoon
Abstract
GD-1 is among the longest, coldest stellar streams in the Milky Way, making it an ideal target for probing dark matter substructure through dynamical heating. We present a catalog of 608 spectroscopically confirmed GD-1 members from the first three years of Dark Energy Spectroscopic Instrument (DESI) observations. This constitutes the largest homogeneous spectroscopic sample of GD-1, doubling the number of members previously available only through heterogeneous compilations combining multiple surveys with different systematics. Using these data, we derive updated stream tracks in sky position, proper motion, and radial velocity that extend over of the stream. We apply a Gaussian mixture model to decompose the stream into a dynamically cold thin component ( km s-1, width ) and a kinematically hot cocoon ( km s-1, width ). The cocoon contains of members and its velocity dispersion is consistent with Gyr of heating by cold dark matter subhalos. We also detect a large proper motion dispersion ( km s-1) along the stream direction in the cocoon component. This feature indicates a significant line-of-sight distance spread in the cocoon, and its origin will be further explored in a forthcoming paper. These measurements demonstrate the power of DESI spectroscopy for characterizing the multi-component phase-space structure of stellar streams and constraining small-scale dark matter substructure.
I Introduction
The formation and evolution of galaxies are shaped by a continuous process of hierarchical assembly wherein smaller systems merge to form larger structures over cosmic time (Press and Schechter, 1974; White and Rees, 1978). Galaxies like the Milky Way are expected to grow through the accretion and disruption of dwarf galaxies and globular clusters. This process is expected to leave behind tidal tails known as stellar streams (Lynden-Bell and Lynden-Bell, 1995). As a globular cluster is accreted onto a larger galaxy, the tidal field of the galaxy pulls stars away from the globular cluster into leading and trailing stellar streams (Toomre and Toomre, 1972; Binney and Tremaine, 2008). The streams are thin and dynamically cold and will remain that way in a smooth potential with some increase in width due to orbital variations (Erkal et al., 2016b). However, structure within the galactic potential, such as the visible disk, bar, and dwarf galaxies, as well as invisible dark-matter subhalos, perturb the orbits of stream stars to increase the velocity spread and induce density perturbations and gaps in the stream (Ibata et al., 2002; Siegal-Gaskins and Valluri, 2008; Carlberg and Grillmair, 2013). Therefore, streams are useful probes of dark matter (Johnston et al., 2002).
There are several ways in which stellar streams can provide constraints on the properties of small-scale dark matter structures. For example, power spectra can be used to analyze density variations in streams by comparing the measured variations to those expected by baryonic structures in order to determine the contribution of dark matter subhalos to the density variations (Banik et al., 2021). Similarly, dynamical modeling of a single subhalo perturber can be done to model the size and morphology of individual gaps along a stream (Erkal et al., 2016a). More recently, attention has shifted to the kinematic signatures of substructure: the cumulative effect of many subhalo encounters heats streams and drives their velocity distributions away from a single cold Gaussian, producing non-Gaussian wings and enhanced radial velocity dispersions (Carlberg and Agler, 2023; Carlberg et al., 2024). As a result, measurements of the velocity distribution along observed streams, such as GD-1, can then be combined with perturbative models to infer the abundance and compactness of low-mass subhalos, providing a direct probe of the small-scale dark-matter distribution (Nibauer et al., 2025; Carlberg, 2025).

Large scale surveys, such as Gaia, have led to the discovery of more than 100 stellar streams surrounding the Milky Way (Mateu, 2023; Bonaca and Price-Whelan, 2025). Among these streams, GD-1 is one of the most prominent and well-studied. First discovered in 2006 using photometry from the Sloan Digital Sky Survey (Grillmair and Dionatos, 2006), GD-1 is located in the Milky Way’s halo and is believed to originate from a disrupted globular cluster due to its metallicity, width (), and stellar mass (2 M⊙). The stream is very long, spanning at least at a heliocentric distance of 10 kpc, and has a retrograde orbit (Koposov et al., 2010). GD-1 also has many noticeable density variations and deviations along its trajectory in the sky (de Boer et al., 2018). For these reasons, it is an ideal target to study interactions with dark matter subhalos (Banik et al., 2021; Carlberg, 2025) or to constrain the Milky Way halo potential (Koposov et al., 2010; Malhan and Ibata, 2019; Nibauer and Bonaca, 2025).
Carlberg (2025) shows that an evolving Cold Dark Matter (CDM) subhalo population acting for Gyr is able to heat GD-1 to radial velocity dispersions of 6.2 km s-1, matching the velocity dispersion measurement previously obtained using DESI EDR data (Valluri et al., 2025). While other theoretical mechanisms, such as interactions with giant molecular clouds, have been suggested to induce similar perturbations, simulations indicate that they do not match observed density variations in GD-1 (Carlberg and Grillmair, 2013). Similarly, past encounters with known globular clusters have been ruled out as orbital integrations show that none have come close enough to GD-1 to produce its observed features (Bonaca et al., 2019; Doke and Hattori, 2022). Resonant interactions with the Galactic bar can also induce perturbations, but such effects primarily influence prograde orbits (Pearson et al., 2017; Dillamore and Sanders, 2025). For streams that orbit outside the disk, the effect of the disk and bar is weaker (particularly for a counter-rotating stream like GD-1), and encounters with dwarf galaxies are rare (Bonaca et al., 2019). Since GD-1 follows a retrograde orbit relative to the bar (Price-Whelan and Bonaca, 2018), the interaction is expected to be minimal.
It has been well established that GD-1 contains many deviations from a thin stream track. In particular, Price-Whelan and Bonaca (2018) identify a “spur” of stars extended away from the main stream track that is co-moving with the main stream. This spur has been shown to be consistent with a perturbation from a low-mass and compact dark matter subhalo (Bonaca et al., 2020). A “blob” of stars has also been identified below the main stream track (Price-Whelan and Bonaca, 2018; Bonaca et al., 2019; Tavangar and Price-Whelan, 2025). An alternative picture of these off-track components of GD-1 includes an extended distribution in called a “cocoon” (Malhan et al., 2019; Valluri et al., 2025). This cocoon is a diffuse structure of stars surrounding the thin stream. Valluri et al. (2025) find that this structure has a width of pc, a velocity dispersion of km s-1, and that it extends over at least of the stream. Ibata et al. (2024) also find evidence of this cocoon-like envelope.
Studying these features of the stream requires a carefully constructed list of high-confidence member stars. Recent work has determined the membership probability and density of stars along the GD-1 stream. 811 GD-1 members were identified with the STREAMFINDER algorithm for Gaia Data Release 2 (DR2) (Ibata et al., 2020) and 1468 for Gaia Data Release 3 (DR3) (Ibata et al., 2024). Using data from Gaia and Pan-STARRS, Starkman et al. (2025) identify 734 stars belonging to the main stream. More recently, Tavangar and Price-Whelan (2025) identify 1689 high-probability GD-1 members. With data from the Dark Energy Spectroscopic Instrument (DESI) early data release observations (DESI Collaboration et al., 2024), Valluri et al. (2025) spectroscopically confirm 115 new member stars. Tavangar and Price-Whelan (2025) also identify 353 high-probability members with radial velocities by combining data from several different spectroscopic surveys.
While current photometric studies have revealed off-track components in GD-1, the full picture of this stream remains incomplete. Additional spectroscopic observations are essential to identify members, precisely study the velocity distribution, and distinguish between the competing explanations for GD-1’s off-stream features. With more kinematic data, we can more precisely calculate the velocity dispersion along the stream and place stronger constraints on the nature of dark matter subhalos and the role they play in perturbing stellar streams.
In this paper, we introduce the spectroscopically identified stars associated with the GD-1 stellar stream from the first three years of DESI observations. In Section II we describe the DESI data in the observed GD-1 region. In Section III we discuss our initial selection of GD-1 members based on cuts in the stellar color-magnitude diagram (CMD), in Gaia proper motions as well as in DESI radial velocities, and metallicities [Fe/H]. In Section IV we study the thin and broad (“cocoon”) components of the stream. In Section V we discuss our results. Finally, in Section VI we summarize our findings.
II DESI observations and DR2 Data
The Dark Energy Spectroscopic Instrument (DESI) is a robotic, fibre-fed, highly-multiplexed spectrograph installed on the Mayall 4-m telescope at Kitt Peak National Observatory (DESI Collaboration et al., 2022). DESI uses 5,000 robotic fibre positioners over a -diameter field of view to obtain optical spectra for millions of targets (DESI Collaboration et al., 2016a, b; Miller et al., 2024; Poppett et al., 2024). The DESI survey is an eight-year program (Schlafly et al., 2023) covering of sky and is designed to obtain spectra for million galaxies and quasars (Guy et al., 2023) and more than million Milky Way stars. Early results from DESI have already set exciting constraints on dark energy (Collaboration et al., 2024, 2025).
DESI observations are organized into surveys (e.g. commissioning/CMX, Survey Validation SV1–SV3, main, and special) and programs (primarily dark, bright, and backup) that correspond to different weather conditions and science goals (DESI Collaboration et al., 2024; Koposov et al., 2024). The main cosmological DESI survey is conducted in the dark program, while the bright program is used primarily for the Bright Galaxy Survey (BGS; Hahn et al. 2023) and the Milky Way Survey (MWS; Cooper et al. 2023). The backup program is a separate DESI survey that operates in poor conditions, targeting bright stars () over an extended footprint using Gaia-based selection (Dey et al., 2025). All three programs are carried out during each survey phase, and spectra are coadded and catalogued separately for every combination of survey and program in the DESI data releases (DESI Collaboration et al., 2025; Koposov et al., 2026).
Within the MWS, targets are selected into a set of well-defined classes encoded in the bitmasks DESI_TARGET, MWS_TARGET, and SCND_TARGET (Myers et al., 2023; Cooper et al., 2023; Koposov et al., 2024). For the main survey, the dominant MWS classes in bright time are the magnitude-limited main sample and several higher-priority categories. The main sample is subdivided primarily into MWS_MAIN_BLUE, MWS_MAIN_RED, and MWS_BROAD, which together form a largely magnitude-limited selection in the range (in extinction-corrected DESI Legacy Survey band). Additional high-priority classes include white dwarfs, blue horizontal branch (BHB) stars, nearby stars within pc, and various secondary target categories observed in both bright and dark time (Koposov et al., 2024, 2026). During Survey Validation, the MWS target definitions evolved and additional experimental target classes were introduced; a comprehensive description is given in Allende Prieto et al. (2020); Cooper et al. (2023); Koposov et al. (2024).
The DESI Early Data Release (EDR; DESI Collaboration et al. 2024) comprises commissioning and survey validation data obtained between December 2020 and June 2021. The EDR MWS Value-Added Catalogue (MWS VAC) (Koposov et al., 2024) provides a homogeneous set of radial velocities and stellar parameters for Milky Way targets, including the initial DESI GD-1 sample analyzed by Valluri et al. (2025). The first full DESI data release (DR1; DESI Collaboration et al. 2025) extends this to 13 months of observations, including reprocessed SV data and early main-survey spectra. The DR1 stellar catalogue (Koposov et al., 2026) describes the combined stellar sample across all surveys and programs, including the growing contribution from the Milky Way Backup Program (Dey et al., 2025). In this work we use the DR1 data together with additional Year 2 and Year 3 DESI observations (which will form part of DR2, to be released in Spring 2027), processed with the same pipelines and MWS VAC infrastructure.
Figure 1 compares the DESI GD-1 coverage from the EDR (as analysed by Valluri et al. 2025), from DR1 (catalog publicly available with detailed description in Koposov et al. 2026), and from DR2 (Years 1–3) used in this work. The progression from EDR to DR2 substantially increases the spatial extent, sampling density, and program diversity (bright, dark, and backup) of DESI spectroscopy along GD-1, enabling the more detailed chemodynamical analysis presented in the following sections. In Appendix B we provide further details on the DESI survey coverage of GD-1 across different programs and characterize the spectroscopic completeness of our sample. Figure 1 is in a coordinate system where is the angle along the stream and is the angle perpendicular to it. The transformation from equatorial coordinates to follows the great-circle rotation defined in Koposov et al. (2010). Most targets in the GD-1 region were originally selected from the DESI Legacy Surveys (Dey et al., 2019), from which we adopt the extinction-corrected - and -band photometry using the values from Schlegel et al. (1998). These photometric catalogues were cross-matched with Gaia DR3 (Lindegren et al., 2021b; Gaia Collaboration et al., 2023) to obtain parallaxes and proper motions. Parallaxes were zero-point corrected following the prescriptions in Lindegren et al. (2021b).
We correct the Gaia DR3 proper motions for solar reflex motion using the Galactocentric frame from astropy (Collaboration et al., 2022) with the v4.0 parameter set, which adopts a Galactocentric distance of kpc, and a solar velocity of km s-1. The reflex correction is applied assuming an initial distance track for GD-1 from Valluri et al. (2025), and then updated using the refined distance track derived in this work (Section III.2). The proper motions are rotated into the stream-aligned frame to obtain , and the corresponding uncertainties and covariances are propagated through the transformation.
Radial velocities and stellar atmospheric parameters for all DESI spectra are measured with the RVSpecFit pipeline (Koposov, 2019), which fits model spectra to the coadded DESI data in each survey/program combination; see more details in Koposov et al. (2024, 2026). Distances to individual stars are estimated using the rvsdistnn method (Koposov et al., in prep.), a neural network that maps the spectroscopic parameters from RVSpecFit with photometric information to distance estimates. We do not use these individual stellar distances directly in our dynamical modelling; instead, we employ them as an independent consistency check on our spectroscopic membership selection.
III Stream Membership Selection
In the following section, we describe our criteria for selecting member stars of GD-1. This is done with kinematic, color-magnitude and metallicity cuts to the stars in the region of GD-1. To perform these cuts, we derive new empirical distance (Section III.2) and CMD tracks (Section III.3). We then fit new proper motion (Section III.4.1) and (Section III.4.2) stream tracks using Gaia stars and derive a new track (Section III.4.3) using the radial velocities of stars in DESI DR2.



III.1 Initial Selections
We begin our identification of GD-1 members with a spatial selection in the GD-1 region by limiting our search to stars within and . Our initial DESI quality cuts are RR_SPECTYPE == STAR which ensures the spectroscopic type of the source is a star as classified by REDROCK, RVS_WARN == 0 to ensure there are no warnings during the RVS fit, and PRIMARY == TRUE, which chooses the observation with the largest signal-to-noise, if a star has been observed more than once as a part of different surveys and programs. We limit the selection to stars with a radial velocity error of km s-1. We also limit the selection to stars with [Fe/H] because the metallicity boundary is at [Fe/H] and stars found at the metal-poor boundary of the catalog are often the result of poor spectroscopic fits.
We also impose a Gaia parallax cut such that
| (1) |
where is the parallax, is the distance to the stream at a given value of , is the uncertainty on the Gaia parallax for each star, and = 0.05 mas is the systematic error on the parallax (Lindegren et al., 2021a). For the initial parallax selection, the distances were obtained using the distance track from Valluri et al. (2025), but the final member list of DESI members uses the distance track in Section III.2 to obtain the distance of each star for this parallax selection.
In order to derive new kinematic stream tracks, we make an initial cut to the sample of stars using the proper motion and tracks as a function of from Valluri et al. (2025). We subtract each track to compute , and , relative to their respective stream tracks. We also include a CMD selection, which we will further describe in Section III.3. We define this initial strict cut of member stars as a “Gaia high purity” selection given by:
-
•
-
•
mas yr-1
-
•
mas yr-1
-
•
-
•
There are 916 Gaia stars that meet all of these high purity selections. We note that this is a selection using Gaia DR3 and DESI Legacy Survey data, i.e. no DESI spectroscopic data is used. Using an iterative approach, we start with these selected stars to then obtain improved tracks described in Section III.4 and then use these new tracks to determine the final member list.
III.2 The distance stream track
The distance to the GD-1 stream varies along . To calibrate the distance gradient along the stream, we use the subgiant and dwarf stars. We separate the two populations with a magnitude cut at , and the subgiants and dwarfs from DESI and Gaia DR3 are plotted in the left and right panels of Figure 2, respectively. Both panels include proper motion selections of mas yr-1 and . For the subgiant sample (left panel), we additionally require km s-1, where is the radial velocity deviation from the stream track (Section III.4.3), initially adopted from Valluri et al. (2025) and subsequently updated through the iterative procedure described in Section III.4. This additional velocity cut is necessary because the subgiant sample is smaller and more susceptible to foreground contamination, and the DESI radial velocities provide the extra discriminating power needed to obtain a clean selection.
We define an empirical distance track by hand-picking node locations along that trace the peak density of the subgiant and dwarf sequences in distance moduli, and interpolate between the nodes using a cubic spline (shown in Figure 2), with the node values presented in Table 1. This new distance track is then used to obtain the new CMD selection of stars, described in Section III.3. The primary difference between the track derived in this work and that used in Valluri et al. (2025) is the addition of the dwarf stars, and the improved track for the stream at .
We also identify 7 blue horizontal branch (BHB) stars from their location on the CMD (see Figure 3). A catalog of GD-1 BHB member stars is available in Table 8. We obtain their distance using the relation from Byström et al. (2025)
| (2) | ||||
The BHB stars identified from the CMD closely follow the distance track, providing an independent check on our distance estimates.
| [deg] | [kpc] | |
| -90 | 14.80 | 9.12 |
| -70 | 14.60 | 8.32 |
| -50 | 14.45 | 7.76 |
| -35 | 14.40 | 7.59 |
| -20 | 14.60 | 8.32 |
| 0 | 14.95 | 9.77 |
| 25 | 15.80 | 14.45 |
| 40 | 16.50 | 19.95 |
III.3 Color-Magnitude Diagram Selection
With the updated distance track, we next define a color-magnitude selection for GD-1 members. The CMD distribution is not well matched by a theoretical isochrone, so we construct an empirical CMD track that traces the observed stream population (see Figure 3). To do this, we hand-pick node locations along the range of values on the 2D histogram of the CMD, selecting the value that maximizes the stellar density at each node. This track is derived from the Gaia stars that satisfy our high-purity kinematic selection (Section III.1), and the node locations are presented in Table 2.
For the Gaia high-purity sample (Section III.1), we adopt a tighter cut of (left panel of Figure 3) to ensure a clean sample for deriving the stream tracks, while for the full DESI sample we use a broader cut of (right panel of Figure 3; see Section III.5 for the complete DESI selection criteria) to maximize completeness for the subsequent analysis. An isochrone cut of in around this empirical track has been shown in mock stream modeling to capture 80% of stream stars while minimizing background contamination (Holm-Hansen et al., 2025). The resulting empirical track closely follows the low-metallicity stellar population of the GD-1 stream.
| 0.85 | |
| 0 | 0.59 |
| 2 | 0.49 |
| 2.5 | 0.47 |
| 3 | 0.38 |
| 3.5 | 0.25 |
| 4 | 0.24 |
| 5 | 0.32 |
| 7 | 0.80 |
III.4 Stream track derivation
To perform selections in , , and we fit empirical stream tracks and perform cuts around them. These tracks are used to isolate likely stream members from the broader Milky Way foreground/background stellar population. The stream tracks in , , and from Valluri et al. (2025) were determined by manually selecting node locations and fitting splines through them, without a statistical model to simultaneously account for the background population or to estimate the intrinsic stream dispersion. Only the track in Valluri et al. (2025) was derived using a probabilistic mixture model. In this work, we derive all four tracks (, , , and ) using a unified probabilistic framework based on a spline Gaussian mixture model (described below), which self-consistently separates the stream from the background and provides robust estimates of both the stream track and its dispersion as a function of .
To ensure uniform sampling along the length of the stream, we use stars from Gaia DR3 for the , , and tracks rather than the DESI sample, which has uneven coverage along (see Figure 15).
The derivation of our new tracks follows an iterative approach, beginning with the preliminary stream tracks from Valluri et al. (2025) as an initial starting point. We select Gaia stars using a CMD selection as described in Section III.3, followed by spatial and kinematic cuts around these initial tracks – specifically, stars within mas yr-1 in proper motion and within from the track (i.e. the Gaia high purity selection). We then fit new tracks using the probabilistic model described below and update the selections accordingly in the refit, as detailed in Section III.4.1.
III.4.1 Proper motion selection
To refine our kinematic selections, we derive updated stream tracks for the proper motion components and using a probabilistic model. We use a truncated Gaussian mixture model, modified from that used in Koposov et al. (2023). We construct a model of the stream proper motions as a function of . We model the stream component as a truncated Gaussian mixture where the center and dispersion of the Gaussian are allowed to vary with and are represented by a spline with 12 evenly spaced nodes along the length of the stream. A second Gaussian represents the background contamination where the mean and dispersion are fitted parameters, and the mean can vary linearly along . The likelihood function for this model is given by
| (3) |
where is the stream fraction at each value of , and define the background mean as a linear function of , is the background dispersion, and and are the stream mean and dispersion, respectively.
We implement the model using the Stan programming language (Carpenter et al., 2017) and sample it using the CMDstanpy111https://mc-stan.org/cmdstanpy/ package. The splines were implemented using the stan-splines package (Koposov et al., 2023; Koposov, 2024), following the approach described in the supplementary material of Koposov et al. (2023). We account for the proper motion errors by adding them in quadrature to the intrinsic proper motion dispersions when computing the likelihoods of individual stars.
For the spline-based Gaussian mixture model used to derive proper motion tracks, we adopt weakly informative priors on all parameters. The spline node values that define the proper motion mean as a function of are assigned normal priors centered near the expected stream motion. Similarly, the dispersions are also assigned normal priors with large widths. The priors on all the background model parameters are also assigned normal distributions.
We then perform an iterative approach to obtain the new proper motion tracks. To begin, we fit an initial track after we select stars in CMD, , and using the tracks from Valluri et al. (2025). Similarly, we fit a new track by selecting stars in CMD, and . Next, we apply the new distance track from this work (see Section III.2) to recalculate the reflex correction for the proper motion values. With these updated values, we use the new track to select stars in and fit the final track. Finally, we reapply the selection with this updated track to fit our final track. The node locations of the final proper motion tracks are given in Table 3.
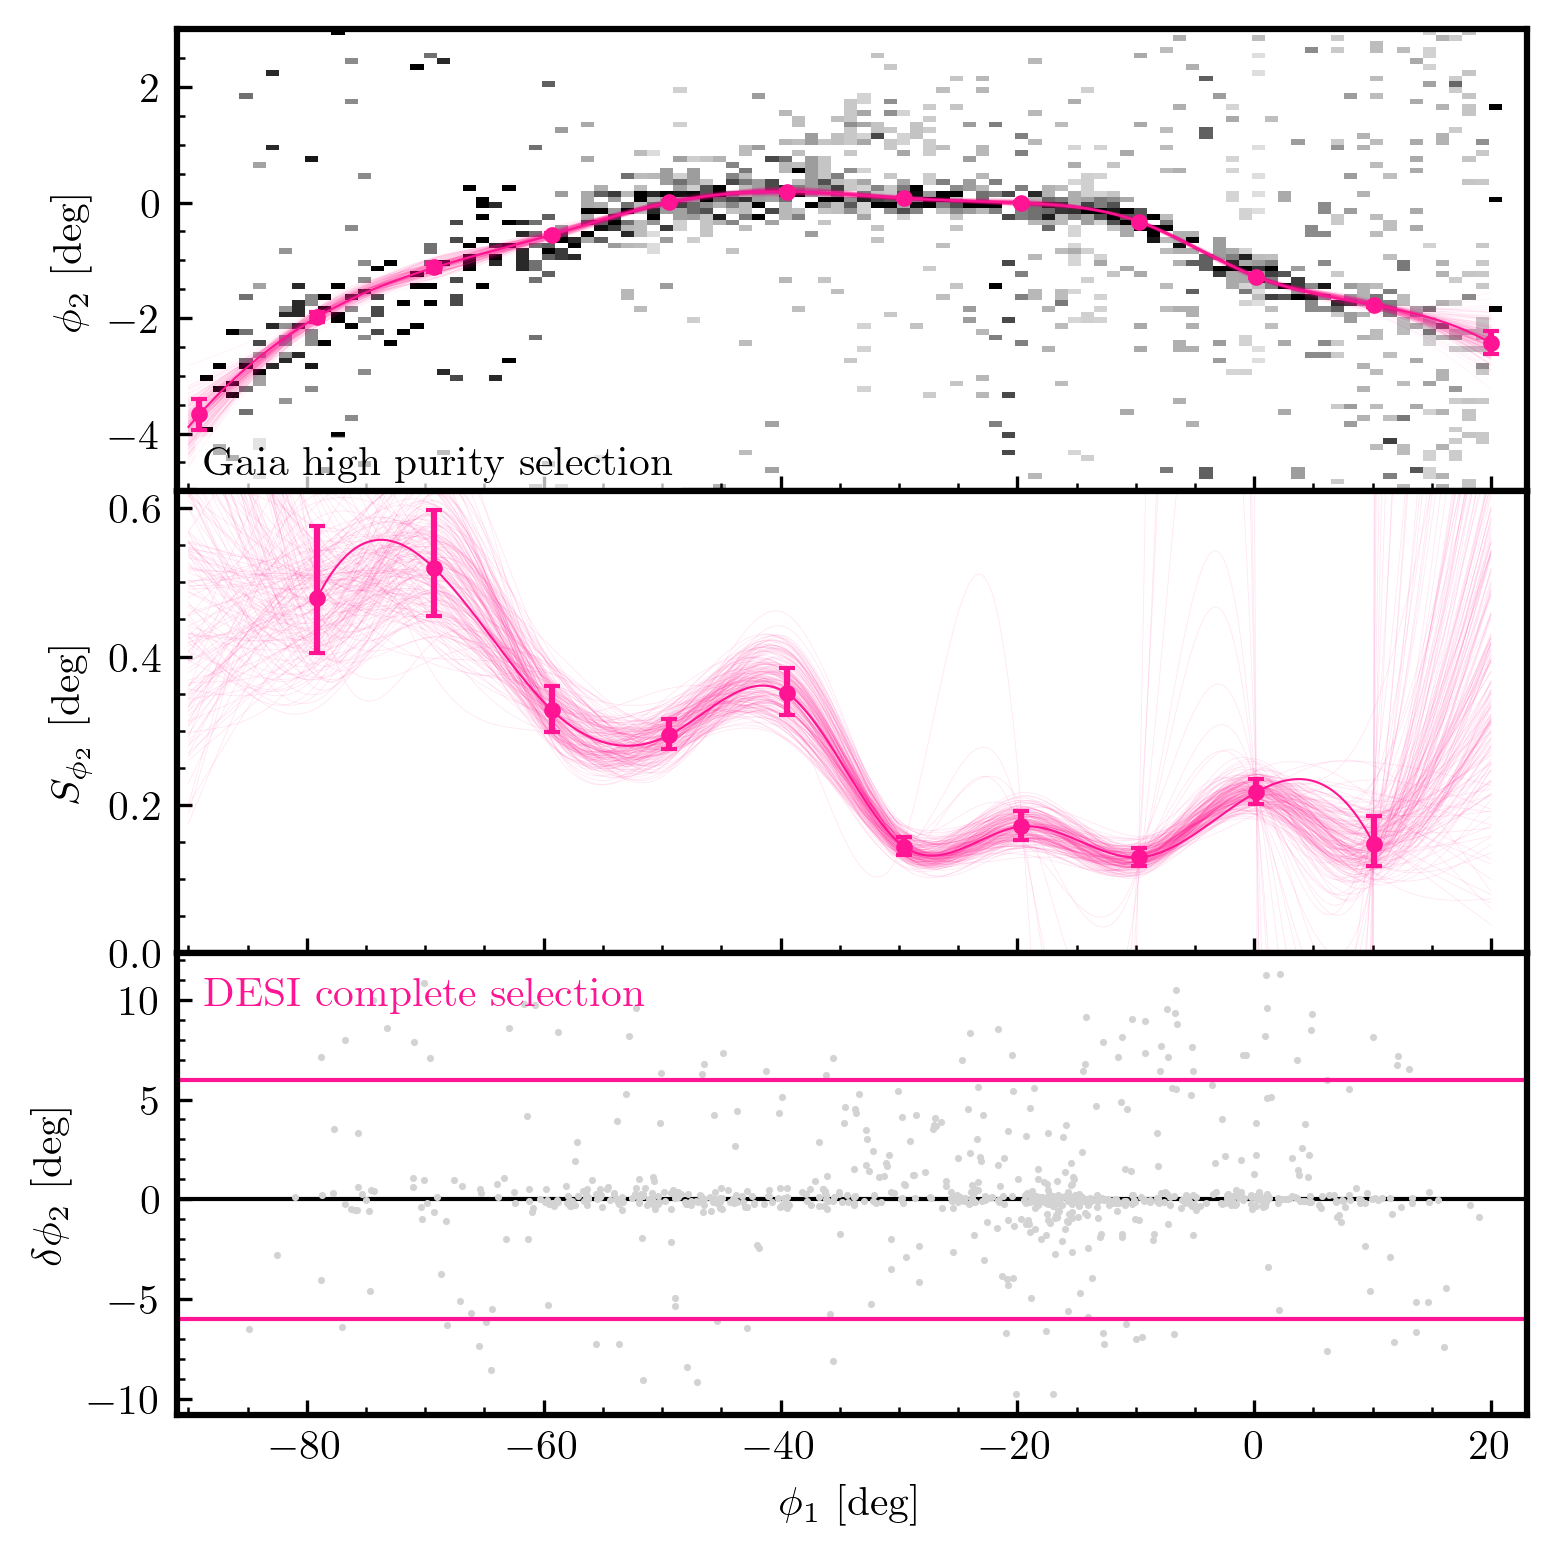
Figure 4 depicts the results of the final Stan model for both and . The top panel shows a 2D histogram of the Gaia stars used to obtain the track. Overlaid are the nodes and the cubic spline through these nodes which we define as the track. The middle panel shows the dispersion along the stream in mas yr-1. The bottom panel shows the DESI stars that contain the CMD selection as well as the and selections (see Sections III.4.2 and III.4.3).
III.4.2 selection
We use the same approach as described in Section III.4.1 to obtain an improved stream track in . We use the likelihood function defined in Equation 3 to select Gaia stars within mas yr-1 of the final proper motion stream tracks derived in Section III.4.1. The same Gaia high purity CMD selection is applied as well. We then fit the spline to the stars that pass these cuts. The priors on model parameters are again normal distributions with large standard deviations. Figure 4 depicts the results of this Stan model. The node locations of this track are given in Table 3. For our DESI member selection, we keep all stars within from the track.
III.4.3 Radial velocity selection
We use DESI radial velocities to obtain a new track for GD-1, where is the solar reflex-motion corrected line-of-sight velocity in the Galactic Standard of Rest frame. Using our newly derived proper motion and tracks described in Sections III.4.1 and III.4.2, we select stars with mas yr-1 and . We further apply our DESI complete CMD selection, a cut of [Fe/H], and the initial selections described in Section III.1 to derive the track. These cuts leave a total of 1314 DESI stars prior to cuts in radial velocity.
To derive the radial velocity track, we use the same model as described in Section III.4.1, using the likelihood function defined in Equation 3. The priors on model parameters are normal distributions with large standard deviations. Figure 4 depicts the results of this mixture model. Finally, we select stars within km s-1 from the derived track as the GD-1 members.
III.5 Summary of DESI complete selection
Using the tracks derived in Section III.4, we obtain , , , and for the member stars by subtracting the stream track from each star and these values are used to impose selections to the stars. To summarize, our initial GD-1 DESI membership selection meets the following cuts, on top of the primary cuts described in Section III.1, which we define as the “DESI complete selection”:
-
•
-
•
km s-1
-
•
-
•
mas yr-1
-
•
mas yr-1
-
•
-
•
km s-1
-
•
[Fe/H]
We obtain 679 DESI stars that meet these initial selections. Without including any [Fe/H] selection, there would be 736 member candidates and without the selection, this membership criteria would yield 3355 member candidates.
IV Characterizing the stream components
With our new catalog of DESI GD-1 stars obtained using the membership selection described in Section III.5, we then analyze the components of the stream, in particular we separate the thin stream and cocoon components of GD-1 as defined in Valluri et al. (2025).
IV.1 Gaussian mixture model analysis
To characterize the components of the stream, we model the observed phase-space properties using a Gaussian mixture model. We fit the data with two Gaussian components representing the “thin stream” and the “cocoon” along with a uniform background distribution to account for residual contamination not associated with GD-1. For this analysis, we restrict our sample of stars to within , corresponding to the portion of the stream most densely covered by DESI observations (see Figure 1). Outside of this range, we have a less complete sample of member stars. With this cut, 545 stars remain for this analysis.
| Parameter | Stream Prior | Cocoon Prior |
The likelihood function for the mixture model is expressed as:
| (4) |
| 1 Component | 2 Components | ||
| Parameters | Stream | Thin Stream | Cocoon |
| Number of members () | 467 | 421 | 185 |
| Number of expected members () | 433 | 407 | 194 |
| Q | 0.70 ± 0.02 | 0.60 ± 0.02 | 0.30 ± 0.02 |
| [km/s] | –0.26 ± 0.22 | –0.29 ± 0.22 | 0.72 ± 0.62 |
| [km s-1] | 2.75 ± 0.31 | 2.49 ± 0.28 | 6.13 ± 0.75 |
| [km s-1] | 1.35 ± 0.33 | 0.27 ± 0.33 | –5.78 ± 4.10 |
| [km s-1] | 5.43 ± 0.89 | 2.65 ± 0.43 | 41.36 ± 4.98 |
| [km s-1] | 0.37 ± 0.28 | 0.39 ± 0.28 | –0.34 ± 0.52 |
| [km s-1] | 0.74 ± 0.35 | 0.68 ± 0.32 | 3.62 ± 0.65 |
| [deg] | 0.01 ± 0.01 | –0.01 ± 0.01 | 0.53 ± 0.19 |
| [deg] | 0.37 ± 0.02 | 0.23 ± 0.01 | 2.18 ± 0.17 |
where denotes the observed quantities with the stream track subtracted. These includes four variables: the line-of-sight velocity (), proper motions (, ), and . The terms and represent the fractional contributions of the thin stream and cocoon components, respectively, while denotes multivariate normal distributions parameterized by and for each component . The term represents the uniform distribution used to model the background and foreground population.
The proper motion measurements are given in angular units (mas yr-1), but the velocity dispersion of the GD-1 stream is more naturally expressed in km s-1, requiring a conversion that depends on distance as , with in mas yr-1 and in kpc. Since the distance to the stream varies along , the same proper motion dispersion in mas yr-1 corresponds to different transverse velocity dispersions in km s-1 at different positions along the stream. To account for this, we rescale the proper motion of each star to the distance at , roughly the midpoint of the stream, which corresponds to a distance of 7.75 kpc from the distance track derived in Section III.2. This allows us to fit the stream with a single velocity dispersion in km s-1 across the full range of , under the assumption that the intrinsic transverse velocity dispersion of GD-1 is constant along the length of the stream.
We initially estimate the model parameters with direct maximization of the likelihood function using scipy.optimize. We then use these estimates as the initial guess to generate the posterior distribution of the model parameters using the affine-invariant Markov Chain Monte Carlo (MCMC) ensemble sampler implemented in emcee (Foreman-Mackey et al., 2013). We adopt uniform priors for all parameters as detailed in Table 4. The posterior samples are generated with 64 walkers. We run 2000 steps and we discard the first 1000 steps as burn-in.
In Figure 5 we show the data compared with posterior predictive realizations of the model. We assess the robustness of the model with posterior predictive checks by comparing the cumulative distribution functions (CDFs) of the four observables generated by the model to the empirical CDFs. To do this, we draw 200 random realizations from the posterior distribution of model parameters, and for each realization we generate a mock dataset by sampling from the model and adding the measurement uncertainties for each star from the observations (e.g., Gaia uncertainties for proper motions, DESI uncertainties for velocities). The observed distributions lie within the 95% credible interval of the posterior predictive samples, indicating that once measurement errors are accounted for, our three-component mixture model provides an adequate description of the intrinsic populations.
Table 5 summarizes the results from the Gaussian mixture model. We report the parameter estimates as the 50th percentile of the marginalized posterior distributions. We report symmetric uncertainties as the average of the upper and lower deviations from the median to the 84th and 16th percentiles, respectively. The fraction of stars in the thin stream is and the fraction in the cocoon is which leaves a background fraction of . For all parameters, the mean value is close to zero. This is expected because the stream track has been subtracted. The only exception is the mean, which will be discussed in Section V.2. The standard deviation of the Gaussian fit to the thin and cocoon components are and , respectively. Assuming a mean distance to the stream of 7.75 kpc (the mean distance to the stream within ), this corresponds to a physical width of pc for the thin stream and pc for the cocoon.
For the , the cocoon component exhibits a broader dispersion ( km s-1) compared to the thin stream ( km s-1). The typical measurement uncertainty is km s-1 which means the thin stream’s velocity dispersion is only marginally resolved, while the cocoon’s is clearly broader. For the proper motion in the direction, the thin stream has a small dispersion ( km s-1) while the cocoon shows a much larger dispersion ( km s-1), which will be discussed further in Section V.2. A similar, though less pronounced, trend is seen in . The thin stream has a dispersion of km s-1 and the cocoon has slightly broader dispersion of km s-1. However, these values should be interpreted with caution. The typical proper motion uncertainty of mas yr-1 corresponds to km s-1 which is substantially larger than the fitted dispersions. Although our mixture model accounts for measurement uncertainties, when the intrinsic dispersion is much smaller than the measurement error, the inferred value is poorly constrained and may not be reliably resolved. We therefore do not draw physical conclusions from the dispersions.


IV.1.1 One Gaussian component model
As a comparison with the two-Gaussian model, we also consider a model consisting of a single Gaussian to represent the stream component, along with a uniform component for the background and foreground stars. The results of this model are presented in the first column of Table 5. With this model, we find a stream fraction of . We note that for the one component model, the values of the dispersion are typically between the values obtained from the two component model, although slightly closer to the thin stream value due to the higher fraction of stars in the thin stream. The values of the mean are also typically closer to zero for the one-component model.
To compare the selection of the two-Gaussian plus uniform model to the single-Gaussian plus uniform model, we use the Akaike Information Criterion (AIC; Akaike, 1974) and the Bayesian Information Criterion (BIC; Schwarz, 1978), where lower values indicate a better fit. Although the two-Gaussian model includes nine additional parameters relative to the one-Gaussian model, both criteria strongly favor it, with the two-Gaussian model yielding and relative to the one-Gaussian model. These large negative differences indicate a decisive preference for the two-component description of the stream, supporting the decomposition into a thin stream and cocoon.
IV.2 Membership probability


Using the four-dimensional space (, , , ), with a three-component mixture (two Gaussians representing the thin stream and cocoon, and a uniform term for the foreground and background) mixture model, we calculate the probability that each star belongs to each of the three components using
| (5) |
where correspond to the thin stream, cocoon, and background components, respectively. Here is the posterior membership probability of star belonging to component and we refer to this as the membership probability of the star belonging to each of the three components. For each star, , = 1. is the mixture fraction (prior weight) of that component. The quantity represents the observed variable for star (specifically , and ), and is the probability density of that variable under component . Figure 6 displays the thin stream membership probabilities of the stars within for the four parameters used in the Gaussian mixture model, along with [Fe/H] and distance.
We then extrapolate the results along to estimate membership probabilities for stars across the full extent of the stream (), assuming the model parameters remain unchanged over this extended range.222We caution that this assumption is generally invalid, particularly for the mixture fraction . Membership probabilities in the extended range should therefore be interpreted with care. This extrapolation is used solely to provide a complete visualization of GD–1 membership probabilities and is not used in any subsequent analysis. To obtain a high-purity catalog, we remove all stars with . With this cut, we obtain a final catalog of 608 highly probable GD-1 member stars. We assign stars to the thin stream if they have , and similarly, to the cocoon component if they have . With these criteria, we find 421 members of the thin stream, 185 members of the cocoon, and 73 background contaminants. As an alternative estimate, we sum the individual membership probabilities across all stars for each component, which provides a statistically expected number of members that accounts for stars with ambiguous classifications. This yields 407 thin stream members, 194 cocoon members, and 78 contaminants. The close agreement between these two approaches indicates that the model cleanly separates the three populations, with few stars having ambiguous membership assignments. In Figure 7 we show the , , , , [Fe/H] and distance of selected member stars (with removed), color-coded by thin stream probability . We clearly see a broad cocoon in and between with low . All thin stream and cocoon membership probabilities are included in Table 7.
IV.3 Metallicity of the thin stream and cocoon
We then examine the metallicity distribution of the stream components to further characterize their distinct properties. The left panel of Figure 8 shows the metallicity distribution of the thin stream, cocoon and background populations obtained from our Gaussian mixture model with the cut of [Fe/H] . To characterize the intrinsic metallicity of each population, we fit the member stars with a Gaussian distribution and use a Markov Chain Monte Carlo (MCMC) sampler with 50 walkers and 500 steps to obtain the posterior distribution of the mean and intrinsic dispersion, accounting for the individual [Fe/H] measurement uncertainties. For the highly-probable GD-1 member stars (), we find an intrinsic mean metallicity of dex and an intrinsic metallicity dispersion of dex. For the thin stream population (), we find dex and dex, and for the cocoon (), we find dex and dex. These values are consistent, within the uncertainties, with the metallicities reported by Valluri et al. (2025) based on the DESI EDR sample.


The measured metallicity dispersion of GD-1 is substantially larger than the typical dispersion of globular cluster streams (0.03–0.05 dex; Li et al. 2022), and is more consistent with the dispersions observed in dwarf galaxies ( dex; Li et al. 2022). This would favor a dwarf-galaxy-like progenitor for GD-1 over a classical globular cluster origin. However, we caution that the reported [Fe/H] uncertainties from the DESI pipeline are formal errors only and likely underestimate the true measurement uncertainty in the extremely metal-poor regime, where systematic effects in spectral modeling become significant. Since our method infers the intrinsic dispersion by deconvolving the measurement uncertainties, underestimated errors would lead to an overestimated intrinsic metallicity dispersion. Such systematics have been shown to artificially inflate the inferred intrinsic dispersion for chemically homogeneous systems: several well-studied, metal-poor globular clusters and streams in the DESI DR1 Stellar Catalogue (e.g., M 92, M 15, and NGC 5053, all with [Fe/H] dex) exhibit metallicity dispersions substantially larger than their literature values (see Table 7 and Appendix D of Koposov et al. 2026). A similar caveat has recently been discussed for the metal-poor C-19 stream analyzed with DESI (Mohammed et al., 2026). We therefore interpret our measured dispersion as an upper bound on the true intrinsic metallicity spread of GD-1, and while this value is consistent with a dwarf-galaxy-like progenitor, it alone is not conclusive.
To statistically test whether the metallicity distributions of the thin stream, cocoon, and background components originate from the same underlying distribution, we perform two-sample Kolmogorov-Smirnov tests. The result shows no statistical difference between the stream and cocoon components (p-value 0.31) which suggests that they share a similar underlying metallicity distribution. In contrast, both the stream and cocoon differ strongly from the background population, with p-values which allows us to reject the null hypothesis in both cases. These results show that stream and cocoon likely originate from the same progenitor, while background stars represent a distinct population of contaminants.
To test the robustness of our component separation, we also apply our three-component kinematic model to a selection of stars without any prior cut in [Fe/H]. As shown in the right panel of Figure 8, the model successfully isolates the majority of metal-rich background stars from the stream and cocoon components without any cut in [Fe/H]. The stream and cocoon remain relatively uncontaminated, with very few high-probability members at , while the background component captures the majority of metal-rich stars.
V Discussion
In this section, we discuss the results of the paper. First, in Section V.1, we compare our work with the previous studies of the GD-1 stream. Then, in Section V.2, we discuss the large observed dispersion in .
V.1 Comparison with previous GD-1 studies
This work dramatically increases the sample of spectroscopically confirmed GD-1 members. Using data from the DESI EDR, Valluri et al. (2025) identified 115 members of GD-1, but the EDR had minimal coverage of the GD-1 region, concentrated between and within of the track. The DR2 data offers substantially more complete coverage along the entire stream. Prior to this work, the largest spectroscopic sample was presented by Tavangar and Price-Whelan (2025), which compiled 353 high-probability GD-1 members with radial velocity measurements from multiple surveys including DESI (EDR), SDSS, LAMOST, and targeted follow-up programs. However, this compilation combines data with heterogeneous selection functions, velocity precisions, and systematic uncertainties. Our DESI DR2 catalog provides 608 spectroscopically confirmed members – the largest homogeneous sample of GD-1 to date, obtained from a single instrument with uniform target selection and consistent velocity precision. This represents a five-fold increase over the DESI EDR catalog and nearly doubles the total number of GD-1 members with spectroscopic measurements.
We cross match our catalog of likely GD-1 member stars with the catalogs from Ibata et al. (2024) and Tavangar and Price-Whelan (2025) using the Gaia DR3 source ID of each star, as presented in Table 6. Both of these catalogs identify high-probability GD-1 members primarily based on Gaia proper motions and parallaxes, without the benefit of radial velocity or metallicity information. The Tavangar and Price-Whelan (2025) catalog contains 1689 high-probability members, of which 442 match stars in our high-probability catalog (391 thin stream, 49 cocoon). Of their 353 stars with radial velocity measurements, 163 overlap with our sample (127 thin stream, 35 cocoon). The Ibata et al. (2024) catalog contains 1468 GD-1 members, of which 436 match our high-probability catalog (354 thin stream, 81 cocoon).
In our spectroscopic sample, the ratio of thin stream to cocoon members is roughly 2:1. However, among the matched stars from the Tavangar and Price-Whelan (2025) and Ibata et al. (2024) catalogs, the cocoon is significantly underrepresented: the stream-to-cocoon ratios are 8:1 and 4.4:1, respectively, far exceeding our measured 2:1. This deficit is not surprising, as proper-motion-based searches alone lack the sensitivity to efficiently identify cocoon members. The cocoon is a diffuse, kinematically hotter structure; radial velocities and metallicities – available in our DESI sample but absent from those photometric and astrometric catalogs – are critical for cleanly separating cocoon stars from contaminants. This implies that the true GD-1 population, particularly the cocoon component, is likely substantially larger than reported in those catalogs, and that spectroscopic surveys such as DESI are essential for obtaining a complete census of the stream and its surrounding structure.
| Catalog | Total stars | Matched to our catalog | ||
| This work | 679 | 608 | 421 | 185 |
| Tavangar & Price-Whelan (2025) | 1689 | 442 | 391 | 49 |
| Tavangar & Price-Whelan (2025) with RV | 353 | 163 | 127 | 35 |
| Ibata et al. (2024) GD-1 | 1468 | 436 | 357 | 77 |
Valluri et al. (2025) also perform a bivariate Gaussian mixture model analysis using and to characterize the thin stream and cocoon components of GD-1. With both the DESI-EDR and DR2 observations, a similar fraction of stars is found to be part of the thin stream ( and for the DR2 and EDR data, respectively), although Valluri et al. (2025) do not account for background contamination nor proper motion measurements in their model. For both data sets, a larger width and velocity dispersion are observed for the cocoon compared to the thin stream. The values of the thin stream and cocoon width are both larger for the DR2 data than the EDR data, likely because the EDR data used a narrower cut of (compared with in this work) and had sparser, less uniform coverage along the stream (see Figure 1). The velocity dispersions of both the thin stream and cocoon are smaller in our DR2 analysis compared with the EDR results. This difference can likely be attributed to the larger number of member stars obtained in this work as well as the inclusion of the proper motions in the Gaussian mixture model.
Several previous works have derived stream tracks for GD-1 (Tavangar and Price-Whelan, 2025; Valluri et al., 2025; de Boer et al., 2018). We compare our track with these studies in Figure 9. Our track closely matches that of Tavangar and Price-Whelan (2025) over most of the stream, with small deviations at where the member sample is sparse.

In Figure 10, we examine how the velocity dispersion varies along the stream. Both the line-of-sight velocity dispersion () and the transverse velocity dispersion perpendicular to the stream (, converted to km s-1 using our distance track) probe motion perpendicular to the stream’s orbit, so we expect them to trace similar dynamical heating. Indeed, our measurements of these two quantities show remarkably similar trends: both exhibit one peak at a similar location along the stream, near . These peaks coincide with the previously identified spur (Price-Whelan and Bonaca, 2018), suggesting a possible connection between spatial perturbations and localized kinematic heating.
To assess whether this structure is robust, we compare our measurements with those from Tavangar and Price-Whelan (2025). Since both analyses use Gaia proper motions, this provides an independent check on our methodology. The two measurements are consistent within , and show similar peak locations. In contrast, the track from Tavangar and Price-Whelan (2025) differs significantly from ours. This discrepancy likely arises because Tavangar and Price-Whelan (2025) compiled radial velocities from multiple surveys with heterogeneous systematics and velocity precisions, whereas our DESI sample provides homogeneous measurements with consistent uncertainties.
We caution that the amplitude of the dispersion variations is comparable to the measurement uncertainties, so the peak structure could be consistent with a constant dispersion at . Additionally, the precise locations of the peak depend on the placement of spline nodes in our model, and can shift slightly with different node choices. Nevertheless, the agreement between the line-of-sight and transverse velocity dispersions, combined with the spatial coincidence with the spur feature, hints at localized kinematic substructure that may be connected to past perturbations. Confirming these features will require larger spectroscopic samples from future DESI data releases and better proper motion measurements from future Gaia releases.


V.2 The cocoon dispersion
As shown in Section IV, we measure a large dispersion of km s-1 for the cocoon component of the GD-1 stream. Such a value is not typical for a dynamically cold stellar stream in a CDM halo, which usually has velocity dispersions of only a few km s-1 (e.g. Li et al., 2019; Malhan and Ibata, 2019; Malhan et al., 2022). We therefore must determine whether this measurement reflects a real property of GD-1 or is an artifact of contamination.
Figures 11 and 12 provide evidence that the stars contributing to this large dispersion are genuine GD-1 members. In Figure 11, we highlight stars with large deviations from the track ( mas yr-1), which contribute most to the measured dispersion. These stars occupy the same locus as the thin stream in , [Fe/H], and distance, and show no distinguishing features that would indicate contamination. Figure 12 reinforces this conclusion: stars with high follow the same isochrone as the rest of the stream population along the main sequence and subgiant branch. If these stars were contaminants, they would not trace the GD-1 sequence so precisely. This interpretation is further supported by our metallicity analysis (Section IV.3), which shows that the cocoon shares the same metallicity distribution as the thin stream. Apart from their large offset, there is no reason to distinguish these stars from genuine GD-1 members.
Since the mixture model analysis in Section IV is restricted to member candidates satisfying mas yr-1, the measured cocoon dispersion is limited by this selection boundary. To investigate whether additional members exist beyond this cut, we show the proper motion distribution of GD-1 stars in Figure 13, applying the complete selection in , , CMD, and [Fe/H], but extending the range. The left panels reveal a broad feature in , particularly between . Notably, this broadening is asymmetric: a “cloud” of stars lies systematically below the track (at smaller values, roughly ), extending beyond the mas yr-1 selection boundary. In contrast, the right panels show no such offset or broadening in , consistent with the much smaller cocoon dispersion measured in that direction. The bottom panels of Figure 13 show that stars with larger offsets also tend to have larger , indicating a connection between the spatial width and kinematic structure of the cocoon.
We defer a thorough study of this large dispersion, along with its origin and interpretation, to a forthcoming DESI publication, but briefly outline a likely explanation below. The quantities and here are proper motions corrected for solar reflex motion, which requires an assumed distance to each star. In this work, we adopt the mean stream distance at each (i.e. the distance track we build in Section III.2). However, if the cocoon has a significant spread in line-of-sight distance, stars at different distances will have their solar reflex corrections systematically biased: stars closer than assumed will appear to have smaller (negative ), while more distant stars will appear to have larger (positive ). This effect would manifest as an apparent dispersion even in the absence of true tangential velocity spread.
To estimate whether line-of-sight distance spread could account for the large dispersion, we recompute the solar-reflex-corrected proper motions after perturbing the observed distance track, thereby measuring the sensitivity of to the assumed distance. We find that a distance spread on the order of 15% is needed to produce the observed broadening through the reflex correction alone. For comparison, the on-sky cocoon width of corresponds to only kpc at the stream distance of 8 kpc, whereas a 15% distance spread implies a line-of-sight extent of kpc — roughly four times larger. This would indicate that the cocoon is substantially more extended along the line of sight than on the plane of the sky.
This interpretation is also supported by Figure 12, which shows a clear correlation between and position on the color-magnitude diagram. At the main-sequence turn-off, stars with negative (below the track) preferentially lie above the isochrone, indicating they are closer than the assumed stream distance, while stars with positive lie below the isochrone, indicating greater distances. The magnitude offset between these two populations at the turnoff is 0.3 mag, consistent with a distance difference of 10–15%, in broad agreement with the estimate above. The asymmetry of the “cloud”—predominantly at negative —is consistent with the cocoon being systematically closer than the thin stream along the line of sight.
We note that the solar reflex correction also affects , with a sensitivity to distance that is approximately half that of at the sky position of GD-1. A 15% distance spread would therefore predict an additional dispersion of 15–20 km s-1, which is not evident in our measured cocoon dispersion of km s-1. While the smaller amplitude of the distance-induced effect in makes it inherently harder to detect than in , the expected broadening still exceeds the typical proper motion uncertainties of the GD-1 members (0.15 mas yr-1 or 6 km s-1) and should in principle be measurable. This suggests that the large dispersion may not be entirely attributable to distance spread, but rather a combination of line-of-sight distance spread and some degree of intrinsic velocity dispersion. Alternatively, it may indicate a correlation between transverse velocity and distance among the cocoon stars that acts to suppress the apparent dispersion in but not in .
We therefore suggest that the large dispersion is at least partially a consequence of line-of-sight distance spread in the cocoon. If confirmed, this would imply that the cocoon’s spatial extent is three-dimensional, with significant depth along the line of sight. A detailed analysis disentangling the contributions of distance spread and intrinsic velocity dispersion, along with the possible origin of the “cloud,” will be presented in a forthcoming paper with a larger GD-1 sample from DESI (DESI Collaboration, in prep).
VI Summary
We have assembled the largest homogeneous spectroscopic sample of GD-1 stars to date using DESI DR2, doubling the number of spectroscopically confirmed members compared to previous compilations that combined data from multiple instruments with inhomogeneous systematics. We detect clear evidence of a narrow stream component and a broader population (cocoon) with 30% of stars in the broad component. The large sample of member stars has enabled tighter constraints on the width and velocity dispersion of both stream components. When combined with simulations, these measurements will be able to provide constraints on the distribution of dark matter subhalos in the Milky Way.
We summarize the results of our paper as follows:
-
1.
We present a spectroscopic analysis of the GD-1 stellar stream using the first three years of DESI observations (i.e., DESI DR2).
- 2.
- 3.
-
4.
We detect a large proper motion dispersion along the stream ( km s-1, or mas yr-1.) in the cocoon component (see Section V.2). We show that this is likely a consequence of line-of-sight distance spread rather than tangential velocity heating. The details of this interpretation and the associated “cloud” of stars offset from the track will be explored in a forthcoming paper.
-
5.
Our final catalog of highly probable GD-1 member stars contains 608 stars, including 421 stars in the thin stream and 185 stars in the cocoon component, providing the largest catalog of spectroscopically confirmed members of GD-1 to date. The final table of the member stars with the membership probability is included in Table 7 in Appendix A.
Our measured cocoon velocity dispersion of km s-1 is in excellent agreement with the km s-1 predicted by Carlberg (2025) for a stream heated by a cold dark matter subhalo population over Gyr. This consistency supports the interpretation that the cocoon represents dynamically heated stream material, though distinguishing between heating mechanisms requires detailed comparison with simulations (Carlberg et al., in prep).
We expect future DESI data releases to continue to increase the number of GD-1 members. With DR2, the average DESI completeness across the GD-1 region is 44% (see Figure 15). We therefore expect the number of GD-1 member stars to increase by a factor of when the DESI survey is complete. Expanding the analysis to include these new observations will further improve the characterization of the multiple components of the GD-1 stream, and improve our understanding of the origin of these components.
Data Availability
This work is supplemented by a preliminary Zenodo repository (DOI: 10.5281/zenodo.19258456), from which the data behind all figures and tables presented in this paper are included in machine readable format. Results are subject to change after the referee report.
Acknowledgments
E. J. acknowledges the support of the Natural Sciences and Engineering Research Council of Canada (NSERC) through a Canada Graduate Scholarship - Doctoral (CGS D) award. E. J. and T.S.L. acknowledge financial support from Natural Sciences and Engineering Research Council of Canada (NSERC) through grant RGPIN-2022-04794. S.K. acknowledges support from Science & Technology Facilities Council (STFC) (grant ST/Y001001/1). MV is supported by NASA-ATP grant 80NSSC24K0938 and NSF grant 2510879. LBeS acknowledges support from CNPq (Brazil) through a research productivity fellowship, grant no. [304873/2025-0]. C.A.P. is thankful for funding from the Spanish government through grants AYA2014-56359-P, AYA2017-86389-P and PID2020-117493GB-100.
This material is based upon work supported by the U.S. Department of Energy (DOE), Office of Science, Office of High-Energy Physics, under Contract No. DE–AC02–05CH11231, and by the National Energy Research Scientific Computing Center, a DOE Office of Science User Facility under the same contract. Additional support for DESI was provided by the U.S. National Science Foundation (NSF), Division of Astronomical Sciences under Contract No. AST-0950945 to the NSF’s National Optical-Infrared Astronomy Research Laboratory; the Science and Technology Facilities Council of the United Kingdom; the Gordon and Betty Moore Foundation; the Heising-Simons Foundation; the French Alternative Energies and Atomic Energy Commission (CEA); the National Council of Humanities, Science and Technology of Mexico (CONAHCYT); the Ministry of Science, Innovation and Universities of Spain (MICIU/AEI/10.13039/501100011033), and by the DESI Member Institutions: https://www.desi.lbl.gov/collaborating-institutions. Any opinions, findings, and conclusions or recommendations expressed in this material are those of the author(s) and do not necessarily reflect the views of the U. S. National Science Foundation, the U. S. Department of Energy, or any of the listed funding agencies.
The authors are honored to be permitted to conduct scientific research on I’oligam Du’ag (Kitt Peak), a mountain with particular significance to the Tohono O’odham Nation.
This research has made use of the SIMBAD database, operated at CDS, Strasbourg, France. This research has made use of NASA’s Astrophysics Data System Bibliographic Services.
This paper made use of the Whole Sky Database (wsdb) created by Sergey Koposov and maintained at the Institute of Astronomy, Cambridge by Sergey Koposov, Vasily Belokurov and Wyn Evans with financial support from the Science & Technology Facilities Council (STFC) and the European Research Council (ERC).
This work has made use of data from the European Space Agency (ESA) mission Gaia (https://www.cosmos.esa.int/gaia), processed by the Gaia Data Processing and Analysis Consortium (DPAC, https://www.cosmos.esa.int/web/gaia/dpac/consortium). Funding for the DPAC has been provided by national institutions, in particular the institutions participating in the Gaia Multilateral Agreement.
For the purpose of open access, the author has applied a Creative Commons Attribution (CC BY) licence to any Author Accepted Manuscript version arising from this submission.
The DESI Legacy Imaging Surveys consist of three individual and complementary projects: the Dark Energy Camera Legacy Survey (DECaLS), the Beijing-Arizona Sky Survey (BASS), and the Mayall z-band Legacy Survey (MzLS). DECaLS, BASS and MzLS together include data obtained, respectively, at the Blanco telescope, Cerro Tololo Inter-American Observatory, NSF’s NOIRLab; the Bok telescope, Steward Observatory, University of Arizona; and the Mayall telescope, Kitt Peak National Observatory, NOIRLab. NOIRLab is operated by the Association of Universities for Research in Astronomy (AURA) under a cooperative agreement with the National Science Foundation. Pipeline processing and analyses of the data were supported by NOIRLab and the Lawrence Berkeley National Laboratory (LBNL). Legacy Surveys also uses data products from the Near-Earth Object Wide-field Infrared Survey Explorer (NEOWISE), a project of the Jet Propulsion Laboratory/California Institute of Technology, funded by the National Aeronautics and Space Administration. Legacy Surveys was supported by: the Director, Office of Science, Office of High Energy Physics of the U.S. Department of Energy; the National Energy Research Scientific Computing Center, a DOE Office of Science User Facility; the U.S. National Science Foundation, Division of Astronomical Sciences; the National Astronomical Observatories of China, the Chinese Academy of Sciences and the Chinese National Natural Science Foundation. LBNL is managed by the Regents of the University of California under contract to the U.S. Department of Energy. The complete acknowledgments can be found at https://www.legacysurvey.org/acknowledgment/.
Appendix A Table of DESI DR2 Measurements in the GD-1 Area
Table 7 presents the 679 stars in the “DESI complete selection” sample defined in Section III.5. For each star, we list DESI DR2 measurements of and [Fe/H] with their 1 uncertainties, along with the Gaia DR3 SOURCE_ID, position, and membership probabilities from the Gaussian mixture model described in Section IV.1. In Table 8 we also provide a list of the 7 BHB stars identified in Section III.3.
| Gaia Source ID | R.A. | Dec | [Fe/H] | [Fe/H]err | ||||||
| 793716935624289536 | ||||||||||
| 802157439717465472 | ||||||||||
| 794522430972601600 |
| Gaia Source ID | R.A. | Dec. | [Fe/H] | [Fe/H]err | ||||
| 831434960462203904 | ||||||||
| 693659006674064768 | ||||||||
| 1612085914078414976 | ||||||||
| 1616913045002580992 | ||||||||
| 1613056920284943616 | ||||||||
| 1574576865170810880 | ||||||||
| 1566732502541484928 |
Appendix B DESI Observations of the GD-1 Stream and Sample Completeness
Because DESI observations of GD-1 span commissioning, survey validation, and the first three years of the main survey, the spectroscopic coverage of the stream is intrinsically heterogeneous. GD-1 extends over more than on the sky, and stars along the stream have been observed in multiple DESI surveys (SV1–SV3, main, and special) and programs (bright, dark, backup). Each survey–program combination corresponds to a different targeting strategy and set of observing conditions (Koposov et al., 2026). Although this complexity makes the selection function non-uniform on the sky, our main scientific conclusions do not rely on a uniform or volume-complete sample. In this Appendix we summarize the GD-1 coverage in various DESI survey programs in DR2, and quantify the completeness of our working sample.
Figure 14 shows the DESI tiles overlapping the GD-1 stream in the DR2 footprint. Among the 679 stars in the “DESI complete selection” sample defined in Section III.5, approximately were observed in the main bright program. This is expected: the bright program is the primary mode of the MWS and provides the majority of DESI stellar exposures. The top panel of Figure 14 displays the corresponding tiling pattern. Because DR2 corresponds to the mid-point of the five-year main survey, the nominal five-pass coverage is not yet achieved everywhere, and the bright-time completeness is visibly non-uniform along the stream.
Roughly of the GD-1 sample was observed as a part of the special programs. These include two sets of dedicated GD-1 observations. First, a deep tile with a long hr effective exposure time centered near was observed to test DESI performance at the faint end () in preparation for DESI-II. Second, a 16-tile GD-1 program with effective exposure times of min per tile was executed when only 4 of the 10 spectrographs were operational, resulting in the distinctive tiling geometry shown in the bottom panel of Figure 14. Together, these special tiles significantly increase the depth and local sampling of GD-1 near the central portion of the stream.
The middle panel of Figure 14 highlights the contribution from Survey Validation (SV1–SV3), which contributes of the final sample. These data include the GD-1 observations analyzed in the DESI Early Data Release (Valluri et al., 2025). Because SV programs span bright, dark, and “other” conditions, they help to fill in several regions along GD-1 that are incompletely covered by the main survey alone.
In addition, and of the sample were observed in the main dark and main backup programs, respectively. Although the main dark program is primarily designed for extragalactic targets, MWS stars are allocated low-priority fibers and thus a subset of GD-1 stars are observed in dark time. The backup program operates during twilight and poor weather and predominantly targets bright stars () (Dey et al., 2025), but still contributes a useful fraction of GD-1 members. The sum of these fractions exceeds because roughly two-thirds of the GD-1 stars in our catalog have multi-epoch DESI spectroscopy across different surveys and programs. A systematic analysis of binaries and radial-velocity variability using this multi-epoch information is beyond the scope of this paper and will be pursued in future work.
Our goal in this work is to construct the largest, cleanest spectroscopic catalog of GD-1 members available in DESI-DR2. To this end, we merge observations from all relevant surveys and programs and retain a single best measurement per star (i.e., entries with PRIMARY = TRUE). We then quantify the completeness of this merged sample in Figure 15. Here, the completeness at a given position along the stream is defined as
| (B1) |
where is the number of stars in the DESI complete selection sample and is the number of Gaia+DECaLS stars satisfying the same color–magnitude and proper-motion criteria, both restricted to 333We note, however, that in various programs such as main dark and special, targets fainter than are also observed, extending beyond the main MWS sample..
The completeness pattern closely follows the bright-program tiling: regions with multiple bright-time passes exhibit higher completeness, while gaps in the bright tiling map directly into lower spectroscopic sampling. The enhanced completeness around is driven by the overlap of SV observations and the dedicated special-survey tiles described above. Once the DESI main survey is completed in 2029, we expect the GD-1 spectroscopic sample in the range to at least double in size, and extended bright- and dark-time coverage will increase the number of faint GD-1 members with high-quality spectroscopy.


References
- A New Look at the Statistical Model Identification. IEEE Transactions on Automatic Control 19, pp. 716–723. External Links: Document Cited by: §IV.1.1.
- Preliminary Target Selection for the DESI Milky Way Survey (MWS). Research Notes of the American Astronomical Society 4 (10), pp. 188. External Links: Document, 2010.11284 Cited by: §II.
- Evidence of a population of dark subhaloes from Gaia and Pan-STARRS observations of the GD-1 stream. MNRAS 502 (2), pp. 2364–2380. External Links: Document, 1911.02662 Cited by: §I, §I.
- Galactic Dynamics: Second Edition. Cited by: §I.
- High-resolution Spectroscopy of the GD-1 Stellar Stream Localizes the Perturber near the Orbital Plane of Sagittarius. ApJ 892 (2), pp. L37. External Links: Document, 2001.07215 Cited by: §I.
- The Spur and the Gap in GD-1: Dynamical Evidence for a Dark Substructure in the Milky Way Halo. ApJ 880 (1), pp. 38. External Links: Document, 1811.03631 Cited by: §I, §I.
- Stellar streams in the Gaia era. New Astronomy Reviews 100, pp. 101713. Note: Publisher: Elsevier ADS Bibcode: 2025NewAR.10001713B External Links: ISSN 1387-6473, Link, Document Cited by: §I.
- Exploring the interaction between the MW and LMC with a large sample of blue horizontal branch stars from the DESI survey. MNRAS 542 (2), pp. 560–582. External Links: Document, 2410.09149 Cited by: §III.2.
- Gaps in the GD-1 Star Stream. ApJ 768 (2), pp. 171. External Links: Document, 1303.4342 Cited by: §I, §I.
- Subhalo Spreading of Thin Tidal Star Streams. ApJ 953 (1), pp. 99. External Links: Document Cited by: §I.
- Star Stream Velocity Distributions in Cold Dark Matter and Warm Dark Matter Galactic Halos. ApJ 975 (1), pp. 135. External Links: Document, 2405.18522 Cited by: §I.
- GD-1 and the Milky Way Starless Subhalos. Note: Publication Title: arXiv e-prints ADS Bibcode: 2025arXiv250313290C External Links: Link, Document Cited by: §I, §I, §I, §VI.
- Stan: a probabilistic programming language. Journal of Statistical Software 76 (1), pp. 1–32. External Links: Link, Document Cited by: §III.4.1.
- DESI dr2 results ii: measurements of baryon acoustic oscillations and cosmological constraints. Physical Review D 112 (8), pp. 083515. Note: arXiv:2503.14738 [astro-ph] External Links: ISSN 2470-0010, 2470-0029, Document Cited by: §II.
- DESI 2024 vii: cosmological constraints from the full-shape modeling of clustering measurements. arXiv e-prints, pp. arXiv:2411.12022. External Links: Document Cited by: §II.
- The astropy project: sustaining and growing a community-oriented open-source project and the latest major release (v5.0) of the core package*. The Astrophysical Journal 935 (2), pp. 167. External Links: Document Cited by: §II.
- Overview of the DESI Milky Way Survey. The Astrophysical Journal 947, pp. 37. Note: Publisher: IOP ADS Bibcode: 2023ApJ…947…37C External Links: ISSN 0004-637X, Link, Document Cited by: §II, §II.
- A deeper look at the GD1 stream: density variations and wiggles. MNRAS 477 (2), pp. 1893–1902. External Links: Document, 1801.08948 Cited by: §I, §V.1.
- A closer look at the spur, blob, wiggle, and gaps in GD-1. MNRAS 494 (4), pp. 5315–5332. External Links: Document, 1911.05745 Cited by: Figure 9.
- Overview of the Instrumentation for the Dark Energy Spectroscopic Instrument. AJ 164 (5), pp. 207. External Links: Document, 2205.10939 Cited by: §II.
- Data Release 1 of the Dark Energy Spectroscopic Instrument. arXiv e-prints, pp. arXiv:2503.14745. External Links: Document, 2503.14745 Cited by: §II, §II.
- The Early Data Release of the Dark Energy Spectroscopic Instrument. AJ 168 (2), pp. 58. External Links: Document, 2306.06308 Cited by: §I, §II, §II.
- The DESI Experiment Part I: Science,Targeting, and Survey Design. arXiv e-prints, pp. arXiv:1611.00036. External Links: Document, 1611.00036 Cited by: §II.
- The DESI Experiment Part II: Instrument Design. arXiv e-prints, pp. arXiv:1611.00037. External Links: Document, 1611.00037 Cited by: §II.
- The Backup Program of the Dark Energy Spectroscopic Instrument’s Milky Way Survey. arXiv e-prints, pp. arXiv:2505.17230. External Links: Document, 2505.17230 Cited by: Appendix B, §II, §II.
- Overview of the DESI Legacy Imaging Surveys. AJ 157 (5), pp. 168. External Links: Document, 1804.08657 Cited by: §II.
- Bar-driven dispersal of Galactic substructure. MNRAS 542 (2), pp. 1331–1346. External Links: Document, 2506.09117 Cited by: §I.
- Probability of Forming Gaps in the GD-1 Stream by Close Encounters of Globular Clusters. ApJ 941 (2), pp. 129. External Links: Document, 2203.15481 Cited by: §I.
- MESA Isochrones and Stellar Tracks (MIST) 0: Methods for the Construction of Stellar Isochrones. ApJS 222 (1), pp. 8. External Links: Document, 1601.05144 Cited by: Figure 3.
- The number and size of subhalo-induced gaps in stellar streams. MNRAS 463 (1), pp. 102–119. External Links: Document, 1606.04946 Cited by: §I.
- Stray, swing and scatter: angular momentum evolution of orbits and streams in aspherical potentials. Monthly Notices of the Royal Astronomical Society 461, pp. 1590–1604. Note: ADS Bibcode: 2016MNRAS.461.1590E External Links: ISSN 0035-8711, Document Cited by: §I.
- emcee: The MCMC Hammer. PASP 125 (925), pp. 306. External Links: Document, 1202.3665 Cited by: §IV.1.
- Gaia Data Release 3. Summary of the content and survey properties. A&A 674, pp. A1. External Links: Document, 2208.00211 Cited by: §II.
- Detection of a 63° Cold Stellar Stream in the Sloan Digital Sky Survey. ApJ 643 (1), pp. L17–L20. External Links: Document, astro-ph/0604332 Cited by: §I.
- The Spectroscopic Data Processing Pipeline for the Dark Energy Spectroscopic Instrument. AJ 165 (4), pp. 144. External Links: Document, 2209.14482 Cited by: §II.
- The DESI Bright Galaxy Survey: Final Target Selection, Design, and Validation. AJ 165 (6), pp. 253. External Links: Document, 2208.08512 Cited by: §II.
- Catalog of Mock Stellar Streams in Milky Way-Like Galaxies. arXiv e-prints, pp. arXiv:2510.09604. External Links: Document, 2510.09604 Cited by: §III.3.
- Uncovering cold dark matter halo substructure with tidal streams. MNRAS 332 (4), pp. 915–920. External Links: Document, astro-ph/0110690 Cited by: §I.
- Charting the Galactic Acceleration Field. II. A Global Mass Model of the Milky Way from the STREAMFINDER Atlas of Stellar Streams Detected in Gaia DR3. The Astrophysical Journal 967, pp. 89. Note: Publisher: IOP ADS Bibcode: 2024ApJ…967…89I External Links: ISSN 0004-637X, Link, Document Cited by: §I, §I, §V.1, §V.1.
- Detection of Strong Epicyclic Density Spikes in the GD-1 Stellar Stream: An Absence of Evidence for the Influence of Dark Matter Subhalos?. ApJ 891 (2), pp. 161. External Links: Document, 2002.01488 Cited by: §I.
- How Lumpy Is the Milky Way’s Dark Matter Halo?. ApJ 570 (2), pp. 656–664. External Links: Document, astro-ph/0111196 Cited by: §I.
- DESI Early Data Release Milky Way Survey value-added catalogue. MNRAS 533 (1), pp. 1012–1031. External Links: Document, 2407.06280 Cited by: §II, §II, §II, §II.
- S 5: Probing the Milky Way and Magellanic Clouds potentials with the 6D map of the Orphan-Chenab stream. MNRAS 521 (4), pp. 4936–4962. External Links: Document, 2211.04495 Cited by: §III.4.1, §III.4.1.
- Constraining the Milky Way Potential with a Six-Dimensional Phase-Space Map of the GD-1 Stellar Stream. ApJ 712 (1), pp. 260–273. External Links: Document, 0907.1085 Cited by: §I, §II.
- RVSpecFit: Radial velocity and stellar atmospheric parameter fitting Note: Astrophysics Source Code Library, record ascl:1907.013 Cited by: §II.
- DESI Data Release 1: Stellar Catalogue. The Open Journal of Astrophysics 9, pp. 55260. External Links: Document, 2505.14787 Cited by: Appendix B, §II, §II, §II, §II, §II, §IV.3.
- Segasai/stan-splines: updated stan-splines. Zenodo. Cited by: §III.4.1.
- The southern stellar stream spectroscopic survey (S5): Overview, target selection, data reduction, validation, and early science. MNRAS 490 (3), pp. 3508–3531. External Links: Document, 1907.09481 Cited by: §V.2.
- S 5: The Orbital and Chemical Properties of One Dozen Stellar Streams. ApJ 928 (1), pp. 30. External Links: Document, 2110.06950 Cited by: §IV.3.
- Gaia Early Data Release 3. Parallax bias versus magnitude, colour, and position. A&A 649, pp. A4. External Links: Document, 2012.01742 Cited by: §III.1.
- Gaia Early Data Release 3. The astrometric solution. A&A 649, pp. A2. External Links: Document, 2012.03380 Cited by: §II.
- Ghostly streams from the formation of the Galaxy’s halo. MNRAS 275 (2), pp. 429–442. External Links: Document Cited by: §I.
- Butterfly in a Cocoon, Understanding the Origin and Morphology of Globular Cluster Streams: The Case of GD-1. ApJ 881 (2), pp. 106. External Links: Document, 1903.08141 Cited by: §I.
- Constraining the milky way halo potential with the gd-1 stellar stream. Monthly Notices of the Royal Astronomical Society 486, pp. 2995–3005. Note: ADS Bibcode: 2019MNRAS.486.2995M External Links: ISSN 0035-8711, Document Cited by: §I, §V.2.
- New Constraints on the Dark Matter Density Profiles of Dwarf Galaxies from Proper Motions of Globular Cluster Streams. ApJ 941 (2), pp. L38. External Links: Document, 2201.03571 Cited by: §V.2.
- galstreams: A library of Milky Way stellar stream footprints and tracks. MNRAS 520 (4), pp. 5225–5258. External Links: Document, 2204.10326 Cited by: §I.
- The Optical Corrector for the Dark Energy Spectroscopic Instrument. AJ 168 (2), pp. 95. External Links: Document, 2306.06310 Cited by: §II.
- The kinematically hot, extremely metal-poor c-19 stellar stream in desi dr2. External Links: 2603.11171, Link Cited by: §IV.3.
- The Target-selection Pipeline for the Dark Energy Spectroscopic Instrument. AJ 165 (2), pp. 50. External Links: Document, 2208.08518 Cited by: §II.
- Measurement of Dark Matter Substructure from the Kinematics of the GD-1 Stellar Stream. arXiv e-prints, pp. arXiv:2510.02247. External Links: Document, 2510.02247 Cited by: §I.
- Galactic Accelerations from the GD-1 Stream Suggest a Tilted Dark Matter Halo. ApJ 985 (1), pp. L22. External Links: Document, 2504.07187 Cited by: §I.
- Gaps and length asymmetry in the stellar stream Palomar 5 as effects of Galactic bar rotation. Nature Astronomy 1, pp. 633–639. External Links: Document, 1703.04627 Cited by: §I.
- Overview of the Fiber System for the Dark Energy Spectroscopic Instrument. AJ 168 (6), pp. 245. External Links: Document Cited by: §II.
- Formation of Galaxies and Clusters of Galaxies by Self-Similar Gravitational Condensation. ApJ 187, pp. 425–438. External Links: Document Cited by: §I.
- Off the Beaten Path: Gaia Reveals GD-1 Stars outside of the Main Stream. ApJ 863 (2), pp. L20. External Links: Document, 1805.00425 Cited by: §I, §I, Figure 10, §V.1.
- Survey Operations for the Dark Energy Spectroscopic Instrument. AJ 166 (6), pp. 259. External Links: Document, 2306.06309 Cited by: §II.
- Maps of Dust Infrared Emission for Use in Estimation of Reddening and Cosmic Microwave Background Radiation Foregrounds. ApJ 500 (2), pp. 525–553. External Links: Document, astro-ph/9710327 Cited by: §II.
- Estimating the Dimension of a Model. Annals of Statistics 6 (2), pp. 461–464. Cited by: §IV.1.1.
- Signatures of CDM Substructure in Tidal Debris. ApJ 681 (1), pp. 40–52. External Links: Document, 0710.0385 Cited by: §I.
- Stream Members Only: Data-driven Characterization of Stellar Streams with Mixture Density Networks. ApJ 980 (2), pp. 253. External Links: Document, 2311.16960 Cited by: §I.
- Inferring the density and membership of stellar streams with flexible models: The GD-1 stream in Gaia Data Release 3. Note: Publication Title: arXiv e-prints ADS Bibcode: 2025arXiv250213236T External Links: Link, Document Cited by: §I, §I, Figure 10, Figure 9, §V.1, §V.1, §V.1, §V.1, §V.1.
- Galactic Bridges and Tails. ApJ 178, pp. 623–666. External Links: Document Cited by: §I.
- GD-1 Stellar Stream and Cocoon in the DESI Early Data Release. The Astrophysical Journal 980, pp. 71. Note: Publisher: IOP ADS Bibcode: 2025ApJ…980…71V External Links: ISSN 0004-637X, Link, Document Cited by: Figure 14, Appendix B, Figure 1, §I, §I, §I, §II, §II, §II, Figure 2, §III.1, §III.1, §III.2, §III.2, §III.4.1, §III.4, §III.4, §IV.3, §IV, Figure 9, §V.1, §V.1, §V.1.
- Core condensation in heavy halos: a two-stage theory for galaxy formation and clustering.. MNRAS 183, pp. 341–358. External Links: Document Cited by: §I.