Probing heartbeat oscillations from the black hole X-ray binary GRS 1915+105 using spectral-timing analysis
Abstract
GRS 1915+105 is a black hole X-ray binary whose -class (“heartbeat”) oscillations (50–100 s) are attributed to radiation-pressure instabilities in the inner accretion disk at near-Eddington luminosities. We present a phase-resolved spectral and timing analysis of 24 Swift XRT observations (1–10 keV) and broadband AstroSat SXT+LAXPC data (0.8–30 keV), dividing each cycle into five phases. The narrow-band XRT fits show an apparent anti-correlation between the inner disk temperature (– keV) and apparent radius (– km) across the cycle. The broadband AstroSat fits, however, are statistically consistent with a constant disk temperature: a joint fit with tied across all five phases gives keV (; for 4 added constraints), whereas tying the disk normalization as well is rejected (), leaving a 20% variation in apparent ( to km). The coronal electron temperature rises from 6 to 14.5 keV approaching the burst, with the photon index tracking it. We attribute the larger XRT disk swings to its limited bandpass, where coronal Comptonization is unconstrained and the disk parameters absorb coronal variability; the dominant variability is therefore coronal, consistent with Vadawale et al. (2001), and the residual change is plausibly a color-correction effect (Zoghbi et al., 2016). Hardness–intensity and color–color diagrams show clear spectral hysteresis. Our broadband coverage provides a phase-resolved test of disk constancy and favors coronal evolution as the driver of the spectral variability across the cycle.
Keywords: X-ray astronomy(1810) — Low-mass X-ray binary stars(939) — Accretion(14) — Stellar mass black holes(1611)
1 Introduction
GRS 1915+105 is a well-studied black hole X-ray binary in the Galaxy, distinguished by its persistent activity, superluminal jets, and complex X-ray variability (Castro-Tirado et al., 1992; Mirabel and Rodríguez, 1994). Located at 8.6 kpc and harboring a black hole (Reid et al., 2014), it has near-maximal spin (McClintock et al., 2006; Miller et al., 2013). At least twelve distinct variability classes have been identified (Belloni et al., 2000; Remillard and McClintock, 2006; Done et al., 2007); Figure 1 illustrates eight classes from our Swift XRT survey.
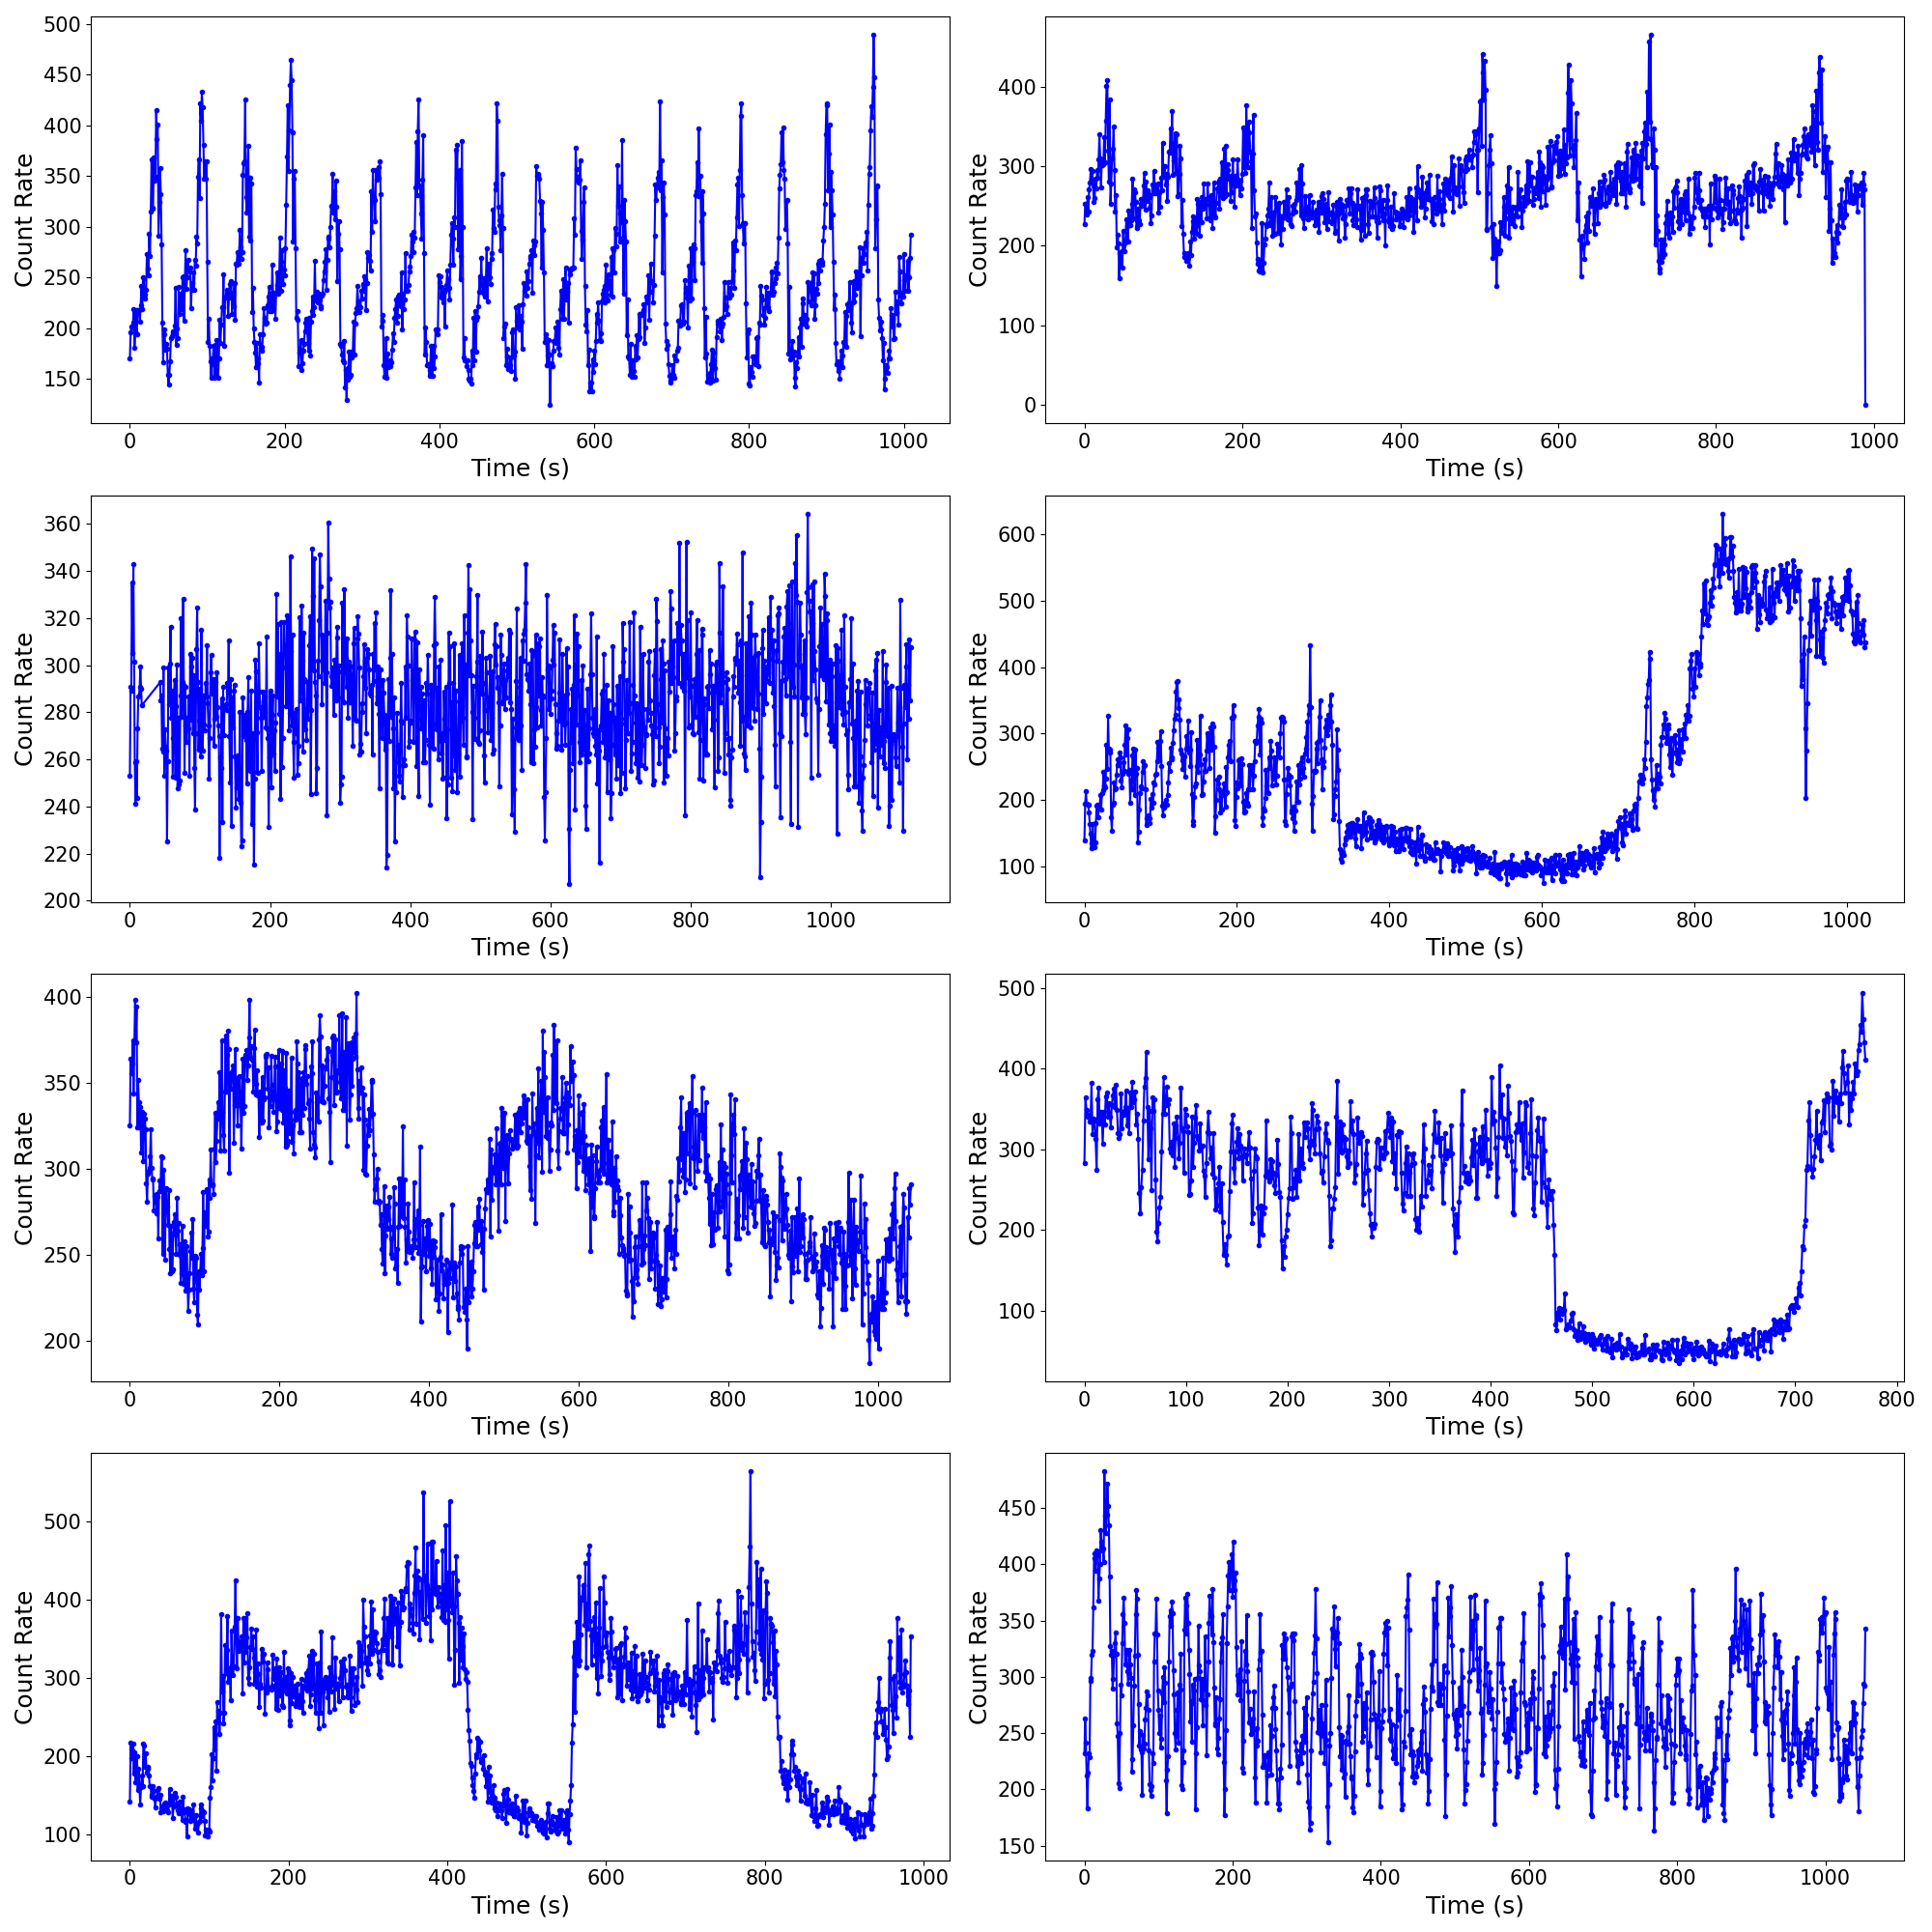
Among these, the -class (“heartbeat”) oscillation is characterized by quasi-periodic flux variations with typical periods of 50–100 s, believed to arise from radiation-pressure-driven instabilities in the inner accretion disk (Neilsen et al., 2011; Zoghbi et al., 2016), making it a valuable probe of near-Eddington accretion physics.
At high accretion rates approaching the Eddington limit, radiation pressure can exceed gas pressure support, producing a thermally and viscously unstable disk (Lightman and Eardley, 1974; Shakura and Sunyaev, 1976; Abramowicz et al., 1988). This instability manifests as a cyclic sequence: radiation pressure inflates the inner disk outward, local temperature drops, support eventually fails, infalling material heats as it reaches the innermost regions, and a burst is produced before the disk resets. This mechanism has been proposed to explain the -class oscillations in GRS 1915+105 (Neilsen et al., 2011).
Neilsen et al. (2011) provided the first detailed phase-resolved spectral analysis of the variability using Chandra HETGS and RXTE, establishing a causal link between the heartbeat oscillations and disk-wind interaction. Zoghbi et al. (2016) subsequently used simultaneous NuSTAR/Chandra observations to show that while the continuum inferred disk inner radius varies through the cycle, the reflection-inferred radius remains nearly constant, implicating changes in the spectral hardening factor. We note that while “heartbeat” and -class are often used interchangeably, Rawat et al. (2018) identified timing differences between the two, with heartbeat periods of 100–150 s compared to the canonical -class periods of 50–100 s. Despite these advances, broadband multi-instrument phase-resolved studies constraining both the disk and coronal continuum have remained limited.
In this paper, we present a phase-resolved spectral and timing analysis of the -class variability in GRS 1915+105 using Swift XRT and AstroSat LAXPC/SXT. Our primary goals are to characterize the systematic evolution of accretion disk parameters, inner disk temperature and apparent inner radius , across the five phases of the cycle through phase-resolved spectroscopy, to investigate spectral state transitions via Hardness–Intensity and Color–Color Diagrams, and to provide new multi-instrument, broadband observational constraints on the radiation-pressure instability model. Our analysis uses the complementary capabilities of these instruments: Swift XRT provides extensive temporal coverage across 24 observations from 2014 to 2016, while AstroSat’s broadband capability (0.3–80 keV) simultaneously constrains both the thermal disk and Comptonized coronal continuum, which is not achievable from soft X-ray data alone.
This paper is organized as follows: Section 2 describes the observations and data reduction procedures for both Swift XRT and AstroSat LAXPC/SXT. Section 3 details our phase-resolved analysis methodology. Section 4 presents the spectral fitting results and phase-resolved parameter evolution. Section 5 discusses the physical interpretation of our findings in the context of radiation-pressure instabilities. Finally, Section 6 summarizes our main conclusions.
2 Observations and Data Reduction
2.1 Swift XRT Observations and Data Reduction
All available Swift XRT observations of GRS 1915+105 were retrieved from the HEASARC archive111https://heasarc.gsfc.nasa.gov. In total, 702 observations spanning 2005–2024 (MJD 53300–59900) were downloaded. Because our analysis focuses on timing and spectroscopy rather than imaging, and Photon Counting (PC) mode data were sparse and of lower quality for this bright source, all processing was restricted to Windowed Timing (WT) mode. Event files were processed with xrtpipeline in HEASoft v6.29222https://heasarc.gsfc.nasa.gov/docs/software/lheasoft/ and barycenter-corrected using barycorr. Source spectra and light curves were extracted using 40 arcsec circular apertures with annular background regions.
Light curves were binned at 1 s and inspected to identify the 100 s flares characteristic of the -class, confirmed via power-spectral analysis (Neilsen et al., 2011; Belloni et al., 2000). Twenty-four observations from 2014–2016 (MJD 56600–57500) show the -class (“heartbeat”) oscillation. Spectra were combined on a phase-by-phase basis and grouped to a minimum of 20 counts per bin prior to spectral fitting. All XRT spectra were analyzed over the 1.0–10.0 keV band, where the WT mode response is well calibrated.
2.2 AstroSat LAXPC and SXT Observations and Data Reduction
All AstroSat observations of GRS 1915+105 were retrieved from the AstroBrowse archive333https://astrobrowse.issdc.gov.in/astro_archive/archive/Home.jsp. A total of 40 LAXPC and 49 SXT datasets were obtained. -class intervals were first identified in the 3–30 keV LAXPC light curves; only the corresponding SXT observations were retained for joint analysis. LAXPC spectra were used over the 3–30 keV range and grouped to a minimum of 30 counts per bin.
LAXPC data were processed using the LAXPCsoft pipeline444http://www.tifr.res.in/~astrosat_laxpc/LaxpcSoft.html to produce calibrated event files, good time intervals, and background-subtracted spectra and light curves. Dead-time corrections were applied at the pipeline level. SXT event files from -class intervals were merged using the SXTMerger tool555http://astrosat-ssc.iucaa.in/uploads/threadsPageNew_SXT.html, and spectra were extracted in the 0.3–7 keV band using standard grade filtering and the appropriate response and ancillary files. The SXT spectra were used over the 0.8–7 keV range for fitting, with the lower limit set to avoid calibration uncertainties below 0.8 keV. Light curves were binned at 1 s for both instruments.
Two LAXPC observations taken in 2017 (MJD 57856, 57857) show the -class oscillation. SXT coverage during these observations was shorter than the full LAXPC exposure, meaning the phase-combined SXT and LAXPC spectra are drawn from partially different subsets of heartbeat cycles. The cross-normalization constant in our joint fits accounts for mean flux offsets between instruments but cannot correct for phase-coherence differences arising from this non-simultaneous coverage.
| Mission | OBSID | Instrument | Exposure (s) | Start Time (MJD) |
|---|---|---|---|---|
| Swift | 00030333020 | XRT | 975 | 56778.21041 |
| 00030333021 | XRT | 955 | 56780.73192 | |
| 00030333022 | XRT | 979 | 56783.00971 | |
| 00030333023 | XRT | 960 | 56785.14791 | |
| 00030333026 | XRT | 954 | 56793.81943 | |
| 00030333028 | XRT | 689 | 56798.21943 | |
| 00030333029 | XRT | 1079 | 56800.39791 | |
| 00030333030 | XRT | 940 | 56803.66179 | |
| 00030333031 | XRT | 1080 | 56805.59513 | |
| 00030333109 | XRT | 1060 | 57070.06388 | |
| 00030333110 | XRT | 1099 | 57072.84513 | |
| 00030333112 | XRT | 1095 | 57080.24513 | |
| 00030333114 | XRT | 1085 | 57085.76735 | |
| 00030333118 | XRT | 265 | 57095.40554 | |
| 00030333119 | XRT | 1050 | 57097.20277 | |
| 00030333120 | XRT | 999 | 57099.59789 | |
| 00030333122 | XRT | 895 | 57102.59235 | |
| 00030333123 | XRT | 945 | 57105.00414 | |
| 00030333124 | XRT | 895 | 57107.51943 | |
| 00030333125 | XRT | 955 | 57110.57846 | |
| 00030333126 | XRT | 1120 | 57112.77498 | |
| 00030333127 | XRT | 1015 | 57115.04582 | |
| 00030333138 | XRT | 965 | 57142.46110 | |
| 00081433001 | XRT | 2008 | 57077.10692 | |
| AstroSat | G07_028T01_9000001166 | LAXPC | 9378 | 57857.0 (2017/04/15) |
| SXT | 3604 | |||
| G07_046T01_9000001162 | LAXPC | 15269 | 57856.0 (2017/04/14) | |
| SXT | 7898 |
3 Phase-Resolved Analysis
Phase-resolved analysis of the -class oscillations was carried out by segmenting each variability cycle into five discrete phases using barycenter-corrected, one-second binned light curves. The dominant oscillation period was determined via a Lomb–Scargle periodogram in the 20–200 s range. Local maxima and minima were identified to define phase boundaries: each trough-to-peak interval was divided into three equal phases (Phases 1–3, rise) and each peak-to-trough interval into two equal phases (Phases 4–5, decay). Phase-specific GTIs were then used to extract spectra and light curves for each instrument.
3.1 Identification of -Class Intervals
Figure 2 presents three representative examples of -class variability observed with Swift XRT, each paired with its corresponding power density spectrum. The characteristic quasi-periodic oscillations with periods of 100 s are visible in the light curves, and the power spectra show prominent peaks confirming the coherent nature of these oscillations. The recurrence and regularity of these “heartbeat” flares ensure stability for our phase-resolved analysis.

3.2 Swift XRT Phase-Resolved Analysis
One-second binned light curves were constructed from the event lists, with errors propagated in quadrature. A Lomb–Scargle periodogram in the 20–200 s period range identified the dominant oscillation frequency. Peaks and troughs were located with a minimum separation constraint equal to the measured period to suppress spurious detections. Phase boundaries were set at the identified extrema, yielding three rise phases and two decay phases per cycle, and phase-specific GTIs were used to extract spectra and light curves.
3.3 AstroSat LAXPC Phase-Resolved Analysis
The same phase-segmentation approach was applied to the LAXPC data. One-second binned light curves were produced from the Level-2 event data, and the oscillation period was determined via a Lomb–Scargle periodogram. A sliding-window algorithm identified successive peaks and troughs, partitioning each cycle into three rise phases and two decay phases. Phase-specific GTIs were applied to extract phase-resolved spectra and light curves for each observation.
Figure 3 illustrates our phase-segmentation scheme applied to a single -class cycle. The oscillation is divided into five phases: three rising phases (Phases 1–3) and two decay phases (Phases 4–5), with phase boundaries determined by the local maxima and minima in the light curve. Figure 4 shows the energy-resolved light curves of the heartbeat oscillations alongside their smoothed, normalized counterparts, highlighting the energy-dependent morphology and the phase offsets between bands.


Phase-resolved spectra from the 24 Swift XRT observations were combined on a phase-by-phase basis using xselect to maximize signal-to-noise, and grouped to a minimum of 20 counts per bin. For AstroSat LAXPC, phase-resolved spectra from the two -class observations were likewise combined per phase and grouped to a minimum of 30 counts per bin.
Power density spectra were computed with fractional-rms normalization using the Stingray package (Huppenkothen et al., 2019) over 1024 s segments. Light curves were binned at 1 s for Swift XRT and 0.01 s for LAXPC. Energy-dependent time lags were derived between a broad reference band (0.3–10 keV for XRT; 3–30 keV for LAXPC) and narrow energy bins, with uncertainties estimated via bootstrap resampling. Dead-time corrections were applied to LAXPC data prior to any timing computation.
4 Results
4.1 Detection and Characterization of -Class Oscillations
Power density spectra computed from the phase-resolved light curves show clear evidence of quasi-periodic oscillations. The Leahy-normalized power density spectra (shown alongside the light curves in Figure 2) exhibit prominent peaks at 0.01–0.02 Hz, corresponding to the characteristic 50–100 s period of the -class oscillations. The detection of this coherent periodicity in multiple observations from both Swift XRT and AstroSat LAXPC confirms the presence of -class behavior and supports our phase-segmentation approach.
The cross-correlation analysis presented in Figure 5 shows systematic time delays between energy bands, with the high-energy variability leading the softer bands by several seconds. This energy-dependent behavior is consistent with the inward propagation of accretion rate fluctuations (Uttley et al., 2014) and the outward propagation of the resulting disk structural changes from the inner to the outer disk regions.

4.2 Phase-Resolved Spectral Evolution
We fitted the phase-combined Swift XRT spectra (1–10 keV) using the model tbabs*(diskbb + bremss + powerlaw) in XSPEC666https://heasarc.gsfc.nasa.gov/docs/xanadu/xspec/, where tbabs accounts for interstellar absorption, diskbb represents the multi-temperature thermal disk emission (Mitsuda et al., 1984), bremss models thermal bremsstrahlung from a hot corona (Kellogg et al., 1975), and powerlaw accounts for a steep hard X-ray tail. The neutral hydrogen column density was left as a free parameter but remained consistent with Galactic values (– cm-2) across all phases. The power-law photon index was fixed at , as this component contributes negligibly to the total flux in the XRT band and consistently converged to this value across all phases.
The best-fit parameters for each phase are presented in Table 2. A representative unfolded spectrum for Phase 1 is shown in Figure 6, illustrating the dominance of the thermal disk component (red) with a modest contribution from thermal bremsstrahlung (green). All fits yielded acceptable reduced values ranging from 1.09 to 1.20, confirming the statistical adequacy of the model.
| Component | Parameter (Units) | Phase 1 | Phase 2 | Phase 3 | Phase 4 | Phase 5 |
|---|---|---|---|---|---|---|
| Swift XRT: tbabs*(diskbb + bremss + powerlaw) | ||||||
| TBabs | ( cm-2) | |||||
| Diskbb | (keV) | |||||
| (km) | ||||||
| Bremss | (keV) | |||||
| Norm | ||||||
| Powerlaw | ||||||
| Norm | ||||||
| Fit | Flux ( erg cm-2 s-1) | |||||
| AstroSat SXT+LAXPC: tbabs*const*(diskbb + nthcomp) | ||||||
| TBabs | ( cm-2) | |||||
| Constant | SXTf | |||||
| LAXPC | ||||||
| Diskbb | (keV) | |||||
| (km) | ||||||
| Nthcomp | ||||||
| (keV) | ||||||
| Norm | ||||||
| Fit | ||||||


4.2.1 Inner Disk Temperature and Radius Evolution from Swift XRT
Taken at face value, the Swift XRT fits show a systematic anti-correlation between the inner disk temperature and the apparent inner disk radius throughout the cycle. As listed in the XRT block of Table 2, decreases from 1.69 keV in Phase 1 through 1.59 keV in Phase 2 to a minimum of 1.53 keV in Phase 3, while increases from 22 km in Phase 1 to a maximum of 37.6 km in Phase 3. At Phase 4 (the burst peak), the apparent disk collapses inward ( km) and heats ( keV). In Phase 5, the post-burst disk contracts further ( km, keV). We show in Section 4.4 that the broadband AstroSat fits do not statistically require this disk-temperature variation, and we interpret the larger XRT swings as a consequence of the limited 1–10 keV bandpass (Section 5.4).
The total 1–10 keV flux remains nearly constant between Phase 3 ( erg cm-2 s-1) and Phase 4 ( erg cm-2 s-1) despite a 25% increase in , because the decrease in largely compensates for the increase in . This near-constant luminosity during the collapse is consistent with radiation-pressure driving, where the total energy output is set by the accretion rate rather than the disk geometry at the time (Frank et al., 2002; Abramowicz et al., 1988).
4.3 Broadband Spectral Analysis with AstroSat
To overcome the limited energy range of Swift XRT and to constrain the Comptonized continuum component, we performed joint spectral fitting of AstroSat SXT (0.8–7 keV) and LAXPC (3–30 keV) data using the model tbabs*const*(diskbb + nthcomp). Here, const accounts for cross-normalization between instruments, diskbb represents the thermal disk, and nthcomp models the Comptonized continuum from a hot corona (Zdziarski et al., 1996). The broader energy coverage of AstroSat eliminated the need for an additional bremsstrahlung component, as the Comptonization accounts for the hard X-ray emission (see Section 5.4 for discussion of the relationship between the XRT and AstroSat spectral models).
The best-fit parameters are presented in Table 2. The broadband AstroSat fits show qualitatively similar trends to those observed in Swift XRT, although with much smaller amplitudes: varies only weakly across the cycle, from 1.31 keV in Phase 1 to a minimum of 1.24 keV at the burst peak (Phase 4), while increases from 17.7 km in Phase 1 to a maximum of 22.9 km at the burst peak (Phase 4) and contracts back to 17.4 km in Phase 5. The absolute values of from AstroSat are systematically smaller than those from Swift XRT (17–23 km vs. 18–38 km), which we attribute to the different spectral models and energy ranges employed; this is discussed further in Section 5.4. We return to the question of whether the apparent disk-temperature variation in the AstroSat fits is statistically required in Section 4.4.
Figure 6 shows the unfolded broadband spectrum for Phase 1, with the thermal disk component (red) dominating below 7 keV and the Comptonized component (green) extending to higher energies. The good fit quality (reduced –1.10) indicates that this two-component model adequately describes the continuum across 0.8–30 keV. The narrow per-phase span of in the AstroSat fits prompts a direct test of whether the data require any temperature variation through the cycle.
4.4 Joint Test of Inner Disk Temperature Constancy
To assess whether the apparent variation in Table 2 is statistically required by the broadband data, we performed a joint analysis of all five phases simultaneously (10 datasets: five SXT and five LAXPC) in three configurations: (i) all parameters free per phase, which reproduces the per-phase fit summarized in Table 2; (ii) tied to a single global value across the cycle while every other parameter is allowed to vary per phase; and (iii) both and the diskbb normalization tied across the cycle. The SXT–LAXPC cross-normalization was kept free per phase in all three configurations to preserve the per-observation flux offsets between instruments.
Tying across all five phases costs only for 4 added degrees of freedom, which is fully consistent with statistical fluctuation; the joint reduced chi-squared remains for 1881 dof, statistically identical to the per-phase fit. The best-fit global temperature is keV (90% CI). The broadband AstroSat data are therefore statistically consistent with a single constant inner disk temperature throughout the cycle.
Tying the disk normalization in addition to , however, is rejected at high significance: for 8 added degrees of freedom relative to the per-phase fit. Under this combined constraint the corona is forced to absorb the entire residual phase-to-phase variation, with running off to unphysical values ( keV in Phases 3–5) and the fit becoming statistically poor. This rules out a fully constant disk and confirms that genuine variation in the apparent disk emitting area is required by the data.
We checked that this conclusion is robust to the details of the analysis. An -test comparing the tied- and free- configurations returns a probability well above for the four additional degrees of freedom, so the free-temperature model is not statistically preferred at any meaningful confidence level. Repeating the joint fit with the SXT–LAXPC cross-normalization tied to a single value across phases, rather than left free, shifts the global temperature by less than its statistical uncertainty and leaves the for tying below the threshold for significance. We also confirmed that the result is insensitive to the choice of energy binning and to the lower-energy bound of the SXT band within the calibrated range. The constancy of the inner disk temperature is therefore not an artifact of the cross-calibration treatment or of the binning, but a genuine property of the broadband data.
4.5 Phase-Resolved Parameters from the -Tied Joint Fit
The phase-resolved coronal parameters from the -tied fit (Table 3) follow a monotonic evolution across the cycle. The electron temperature rises from 6.5 keV in Phase 1 to 13.8 keV in Phase 5, and the photon index steepens from 1.82 in Phase 1 to 2.06 in Phase 5. The cross-normalization constants float between and across phases. The inner-disk emitting area, freed from the constraint via the disk normalization, varies modestly through the cycle.
| Component | Parameter (Units) | Phase 1 | Phase 2 | Phase 3 | Phase 4 | Phase 5 |
|---|---|---|---|---|---|---|
| TBabs | ( cm-2) | |||||
| Constant | SXTf | |||||
| LAXPC | ||||||
| Diskbb | (keV) (tied) | |||||
| (km) | ||||||
| Nthcomp | ||||||
| (keV) | ||||||
| Norm | ||||||
| Joint fit: | , dof = 1881, | |||||
| vs. free per-phase fit: | for dof = (consistent with statistical fluctuation) | |||||
| when both and disk norm tied: | for dof = (rejected) | |||||
Rescaling from the joint disk normalizations (anchored to the per-phase Phase 4 value of km at ) gives , , , , and km in Phases 1–5 respectively. The variation amplitude is 20% with -equivalent errors of 3–4%, separating the Phase 1/5 minima and the Phase 4 maximum at well above the level.
4.6 Hardness–Intensity and Color–Color Diagrams
To investigate spectral state transitions during the cycle, we constructed Hardness–Intensity Diagrams (HIDs) and Color–Color Diagrams (CCDs) for each instrument. For Swift XRT, intensity was defined as the total 1.0–10.0 keV count rate, and hardness as the ratio of counts in the 5.5–10.0 keV band to the 1.0–5.5 keV band. Soft and hard colors were defined as the ratios of counts in the 3.0–4.5 keV to 1.0–3.0 keV and 4.5–7.0 keV to 1.0–3.0 keV bands, respectively. Similar definitions were adopted for AstroSat SXT and LAXPC, adjusted for their respective energy ranges.
In each diagram the five phase bins are color-coded following the scheme of Figure 3 (Phases 1–3 in red, green, and blue; Phases 4–5 in cyan and gray), and every plotted point corresponds to a one-second time bin assigned to its phase by the segmentation procedure of Section 3. Plotting all phases jointly allows the trajectory of the source through the diagram to be followed directly, while the spread of points within a given phase reflects the cycle-to-cycle scatter of the heartbeat oscillation. We constructed the diagrams separately for each instrument so that the soft-band behavior seen by Swift XRT and AstroSat SXT could be compared against the hard-band behavior seen by LAXPC over the same set of phases.
The resulting HIDs and CCDs show hysteresis patterns, most clearly in the Swift XRT diagrams (Figure 7). Each phase occupies a distinct region in these diagrams, with the system tracing a counter-clockwise loop through the cycle, reflecting the expansion-collapse sequence: the system moves to softer states during Phases 1–3 as the disk expands and cools, then to harder states at the burst (Phase 4) and post-burst contraction (Phase 5). Phase 3 corresponds to the softest state in Swift XRT, consistent with the coolest disk temperature and largest radius in the XRT spectral fits, and similarly appears among the softest states in AstroSat SXT where the disk has substantially expanded; Phase 4 occupies the highest-intensity region, corresponding to the burst peak.


The hysteresis is most pronounced in the Swift XRT HID, where the rise phases (1–3) trace the lower, softer branch of the loop and the burst and decay phases (4–5) trace the upper, harder branch, so that the system does not retrace its path but encloses a finite area in the hardness–intensity plane. The AstroSat SXT HID, restricted to a narrower soft band, shows a much more compact and overlapping distribution with no well-defined loop, consistent with the SXT sampling primarily the thermal disk whose temperature varies only weakly across the cycle. In the color–color diagrams, the soft and hard colors are positively correlated during the rise and decouple near the burst, producing the characteristic looping that distinguishes genuine spectral evolution from simple flux scaling.
The hardness ordering of the phases changes with energy band. Phase 3 is the softest phase in the soft X-ray bands (XRT/SXT), but it does not become the hardest at higher energies; in the LAXPC band the hardest spectrum is that of the low-intensity Phase 1, which carries the flattest Comptonized continuum (; Table 2), while Phase 3 stays comparatively soft. This energy dependence indicates that thermal disk emission dominates the soft band while Comptonization governs the hardness ranking at higher energies (Done et al., 2007), which shows the need for broadband coverage to capture both components simultaneously.


The three instruments map complementary portions of the same spectral trajectory: the soft-band diagrams track the thermal disk while the LAXPC diagrams track the Comptonized corona, and the phase at which each instrument reaches its hardest state differs accordingly. The single-sense hysteresis seen most clearly in the Swift XRT HID, together with the differing hardness orderings between the soft-band and LAXPC diagrams, confirms that the cycle is hysteretic and that the disk and corona respond to the underlying instability with a measurable phase offset. We quantify this offset directly through the energy-dependent time lags presented in Section 4.
4.7 Timing Analysis: Energy-Dependent Time Lags
Time-lag analysis was performed to investigate the propagation of variability between different energy bands. Time lags were computed between the reference and subject energy bands using Fourier cross-spectral techniques (Uttley et al., 2014). The reference band was taken as 1–3 keV, and lags were measured relative to the 0.3–1 keV and 3–10 keV bands using a representative -class observation (OBSID 00030333112). The frequency-dependent time lags shown in Figure 8 (left) exhibit positive lags at the heartbeat frequency (0.01–0.02 Hz), with both the soft and hard bands lagging behind the 1–3 keV reference band by 5–8 s. At frequencies above 0.1 Hz, the lags diminish toward zero, consistent with the variability being confined to the heartbeat timescale. The lag spectrum (Figure 8, right) exhibits a structured pattern with both hard and soft lags at different frequencies, suggesting contributions from multiple physical processes such as disk reverberation, Comptonization time delays, and intrinsic propagation within the accretion flow (Uttley et al., 2014). The sign reversal between hard and soft lags at different frequencies indicates that these processes operate on distinct timescales within the cycle and are not confined to a single emission region.
5 Discussion
5.1 The radiation-pressure instability cycle
We first describe the disk evolution as inferred from the narrow-band Swift XRT fits taken at face value; in Section 5.3 we show that the broadband AstroSat data place a much weaker constraint on disk-temperature variation and favor a disk that is constant in temperature.
Our phase-resolved spectral analysis shows a cyclic evolution of the inner accretion disk in GRS 1915+105 during -class variability (Figures 3 and 7; Table 2). The systematic anti-correlation between inner disk temperature () and apparent radius () throughout the five phases is consistent with a radiation-pressure-driven instability cycle, as originally proposed by Neilsen et al. (2011) and predicted theoretically by Lightman and Eardley (1974) and Shakura and Sunyaev (1976).
During Phases 1–2, the inner disk is moderately extended (–28 km) and cooling ( decreasing from 1.69 to 1.59 keV) as radiation pressure inflates the disk outward. The progressive expansion reduces the viscous dissipation rate at larger radii, causing the temperature to drop while the luminosity remains near-Eddington (Shakura and Sunyaev, 1973; Lightman and Eardley, 1974; Abramowicz et al., 1988). By Phase 3, the disk reaches its maximum extent ( km) at the lowest temperature ( keV), marking the turning point where radiation-pressure support can no longer sustain the inflated configuration. The 1–10 keV flux at this phase ( erg cm-2 s-1) is comparable to the burst peak ( erg cm-2 s-1), because the larger compensates for the lower , consistent with a near-constant accretion rate driving the cycle (Frank et al., 2002). In Phase 4, the disk collapses inward (Abramowicz et al., 1988; Neilsen et al., 2011), producing the burst peak at the highest temperature ( keV) and a compact radius ( km). In Phase 5, the post-burst disk contracts further ( km, keV) as radiation pressure subsides and gravity draws the inner edge inward, resetting conditions for the next expansion cycle (Abramowicz et al., 1988).
This cyclic behavior is broadly consistent with the predictions of radiation-pressure instability models (Abramowicz et al., 1988; Watarai et al., 2001) and aligns with previous observations by Neilsen et al. (2011) and Zoghbi et al. (2016). The sequence of expansion, collapse, burst, and contraction follows the canonical heartbeat mechanism established in the literature.
To place these results in the context of the Eddington limit, we estimate the X-ray luminosity from our spectral fits. The observed 1–10 keV flux ranges from to erg cm-2 s-1 across the five phases (Table 2). Adopting a distance of 8.6 kpc (Reid et al., 2014), the corresponding 1–10 keV luminosity is – erg s-1. For a 12.4 black hole, erg s-1, so the observed 1–10 keV luminosity alone corresponds to 0.1–0.2 . This 1–10 keV measurement represents a lower bound on the bolometric luminosity, as our broadband AstroSat fits reveal extended Comptonized emission across the full 0.8–30 keV band. Independent studies have firmly established that GRS 1915+105 persistently accretes at near-Eddington rates (; Done et al. 2007; Remillard and McClintock 2006; McClintock et al. 2006), placing the source well within the regime where radiation-pressure instabilities are expected (Abramowicz et al., 1988).
5.2 Disk–corona coupling and the coronal temperature evolution
The broadband AstroSat analysis reveals a systematic evolution of the coronal electron temperature across the cycle. During Phases 1–4, as increases the corona heats progressively: rises from 6 keV in Phase 1 through 10 keV in Phases 2 and 3 to a maximum of 14.5 keV at the burst peak (Phase 4) (Table 2). This trend reflects the seed-photon starvation mechanism (Haardt and Maraschi, 1991; Done et al., 2007): as the inner disk recedes, it subtends a smaller solid angle as seen from the corona, reducing the supply of soft seed photons available for Compton cooling, so the coronal plasma heats to a higher equilibrium temperature.
After the burst peak the corona partially cools as the disk contracts back inward. Between Phase 4 and Phase 5, decreases from 22.9 to 17.4 km and drops from its maximum of 14.5 keV to 11.5 keV, consistent with the partial recovery of seed-photon flux as the disk re-approaches the corona. The cycle then resets to the cool-corona Phase 1 conditions ( keV).
The Comptonization photon index tracks this evolution (Sunyaev and Titarchuk, 1980; Zdziarski et al., 1996): steepens from 1.77 in Phase 1, where the cool, optically thicker corona produces a harder Comptonized spectrum, to 2.01 at the burst peak (Phase 4), where the hotter and more optically thin corona yields a steeper continuum, and remains close to 2.00 in Phase 5 before the cycle resets.
In the soft X-ray bands (Swift XRT and AstroSat SXT), Phase 3 shows the softest spectrum, consistent with a substantially expanded disk. The AstroSat LAXPC data show, however, that Phase 3 is not the hardest above 10 keV; the hardest hard-band spectrum is that of the low-intensity Phase 1, consistent with its flattest photon index (; Table 2). This energy dependence is consistent with the relative contributions of thermal disk emission and Comptonized continuum (Done et al., 2007): at soft X-ray energies the thermal disk dominates, while at hard X-ray energies the Comptonized continuum carries the bulk of the flux.
5.3 A constant inner disk temperature and the role of the corona
The joint analysis presented in Section 4.4 shows that the broadband AstroSat data are statistically consistent with a single global inner disk temperature, keV, throughout the cycle, while a fully constant disk (both and the apparent emitting area tied) is rejected at high significance. The dominant cycle-to-cycle variability is therefore carried by the Comptonizing corona: in the joint -tied fit (Table 3), rises from 6.5 keV in Phase 1 to 13.8 keV in Phase 5 and the photon index steepens monotonically from 1.82 to 2.06. The inner disk emitting area also varies, but at a more modest level of 20% in apparent .
This picture has a direct precedent in the literature on GRS 1915+105. Using simultaneous radio and X-ray observations of the -class soft X-ray dips, Vadawale et al. (2001) showed that the Comptonized component is the variable spectral element: the low-frequency quasi-periodic oscillation present outside the dip disappears coincidentally with it, while the underlying disk continuum remains comparatively stable, leading the authors to argue that the corona is partially ejected during the dip and provides the radio outflow (see also Nandi et al. 2001). The mechanism proposed for the -class is different in detail: the heartbeat is conventionally interpreted as a radiation-pressure-driven thermal limit cycle of the inner disk (Lightman and Eardley, 1974; Shakura and Sunyaev, 1976; Neilsen et al., 2011; Abramowicz et al., 1988) and not a discrete coronal-ejection event. Despite the difference in driving mechanism, the higher-level conclusion that emerges from our broadband fits, namely that the corona is the dynamic spectral component while the disk temperature stays approximately constant, is the same as in the framework articulated by Vadawale et al. (2001) for -class behavior. The thermal-cycle and ejection scenarios are not mutually exclusive; both can be accommodated within a picture in which the corona carries the bulk of the observable spectral variability across multiple variability classes.
The residual 20% variation in that survives in our -tied joint fit most likely arises from a combination of effects with no single clean geometric interpretation. A constant- disk with a modest, phase-dependent change in the spectral hardening factor produces apparent excursions of order 20% if varies by 10%, which is well within the range expected at near-Eddington luminosities (Davis and El-Abd, 2019; Shimura and Takahara, 1995); the same effect is seen directly in GRS 1915+105 by Zoghbi et al. (2016), who found the reflection-inferred inner radius nearly constant (varying by 5%) while the diskbb radius varied by 30% across the cycle. Partial coronal covering of the inner disk could further contribute to the apparent normalization swing. Our broadband fits do not resolve which of these mechanisms dominates; what the data do require is that the inner edge does not physically move by 5 km across the cycle.
The constant- interpretation does not eliminate the role of the radiation-pressure instability framework for the -cycle. The cycle still requires a physical driver to modulate the coronal seed-photon supply, and a near-Eddington thermal limit cycle that produces small (20%) excursions in disk emitting area while keeping the temperature pinned by the radiation-pressure equilibrium remains a plausible candidate (Abramowicz et al., 1988; Watarai et al., 2001). In the broadband picture the Comptonizing corona is the principal dynamical component, and the apparent disk-temperature swings inferred from narrow-band fits overstate the underlying disk evolution.
5.4 Cross-instrument differences and the apparent inner radius
The narrow-band Swift XRT fits return substantially larger apparent disk variations than the broadband AstroSat fits, and we attribute this to the limited energy coverage of XRT. The XRT model (diskbb + bremss + powerlaw) does not include an explicit Comptonization component, because the high-energy rollover of any underlying Comptonized continuum, set by which spans 6–14 keV across the cycle, lies at or beyond the upper edge of the 1–10 keV band. Coronal Comptonization is therefore poorly constrained in XRT-only fits; the bremsstrahlung term acts as a low-temperature stand-in for the soft tail of the Comptonized continuum (discussed further below), and the disk normalization and temperature shift to absorb residual coronal variability. The result is apparent and swings in the XRT block of Table 2 that are larger than the underlying physical changes. The broadband AstroSat fits constrain the corona directly through LAXPC out to 30 keV, allowing the disk parameters to settle onto a near-constant temperature.
A similar model-dependent offset is seen in the best-fit values: Swift XRT returns – cm-2 while AstroSat returns – cm-2. The SXT extends to lower energies (0.8 keV) than XRT and constrains the soft X-ray absorption more directly, while the narrower XRT band makes degenerate with the disk normalization and the bremsstrahlung component. Previous studies found cm-2 (Neilsen et al., 2011) and 4.9–6.1 cm-2 (Zoghbi et al., 2016; Miller et al., 2013) with broader-band instruments, intermediate between our two values and more consistent with the AstroSat measurement. The phase-to-phase variation within each instrument most likely reflects parameter degeneracies rather than genuine column density changes on the timescales of the cycle.
The use of different spectral models for Swift XRT (diskbb + bremss + powerlaw) and AstroSat (diskbb + nthcomp) also deserves comment. A soft excess is present in XRT-only and SXT-only fits that requires a bremsstrahlung-like component to achieve acceptable values. However, when SXT is combined with LAXPC to provide broadband coverage, the nthcomp Comptonization model alone accounts for both the soft excess and the hard X-ray emission. This indicates that the soft excess is the low-energy tail of the Comptonized continuum, not a physically distinct emission component (Done et al., 2007; Zdziarski et al., 1996), which only becomes apparent as a separate feature when the spectral coverage is insufficient to constrain the full Comptonization model. The convergence onto a single nthcomp component in the broadband fits reinforces the value of broadband coverage in characterizing the spectral components of -class sources.
The apparent inner radii of –38 km obtained from diskbb fits are consistent with accretion extending to or near the ISCO of GRS 1915+105 once standard corrections are applied. The diskbb normalization yields an apparent radius that must be corrected for spectral hardening and the zero-torque inner boundary condition following Kubota et al. (1998): the combined correction factor is , where accounts for the boundary condition offset and is the spectral hardening (color correction) factor. The canonical value (Shimura and Takahara, 1995) gives ; however, at the near-Eddington luminosities characteristic of GRS 1915+105, detailed atmosphere modeling indicates that can approach 2.0 (Davis and El-Abd, 2019), which raises the correction factor to and brings our apparent radii into the range 28–63 km (1.5–3.4 for ; Reid et al. 2014). These corrected values are broadly consistent with the ISCO of GRS 1915+105 (–, or 23–30 km, depending on the precise spin within the near-extreme range measured by McClintock et al. 2006). At near-Eddington accretion rates the disk also enters the slim-disk regime (Abramowicz et al., 1988; Watarai et al., 2000), in which the radial temperature profile flattens from toward ; diskbb assumes the steeper thin-disk profile and therefore systematically underestimates the emitting area, which can place the uncorrected values below the true ISCO even when the disk physically extends to it.
5.5 Comparison with previous studies
Our results are broadly consistent with the seminal work of Neilsen et al. (2011), who first performed detailed phase-resolved spectral analysis of the variability using simultaneous Chandra HETGS and RXTE data. Neilsen et al. (2011) found inner disk radii of –110 km using the ezdiskbb model with a color correction factor , compared to our Swift XRT values of –38 km obtained with diskbb. This systematic offset arises primarily from the different disk models employed: ezdiskbb incorporates a zero-torque inner boundary condition that tends to yield larger apparent radii than diskbb for comparable data (Kubota et al., 1998; Zimmerman et al., 2005). We extend the work of Neilsen et al. (2011) in two ways. We utilize 24 Swift XRT observations spanning 2014–2016, a substantially larger statistical sample than the single-epoch Chandra/RXTE study, and the consistency of the spectral evolution across multiple -class episodes demonstrates the robustness and repeatability of the phase pattern over years. The simultaneous AstroSat SXT+LAXPC coverage (0.8–30 keV) also provides independent constraints on both the thermal disk and Comptonized continuum, complementing the earlier Chandra/RXTE analysis of Neilsen et al. (2011) and the NuSTAR/Chandra work of Zoghbi et al. (2016), with the broad LAXPC bandpass in particular enabling the joint -tied test described in Section 4.4. A similar phase-resolved and timing approach has recently been applied to another black hole binary by Patel et al. (2025), who tracked a continuous transition from type-C quasi-periodic oscillations to a heartbeat state in 4U 1630–47, establishing it as a second system, alongside GRS 1915+105, in which this transition is seen.
6 Conclusions
We have presented a phase-resolved spectral and timing analysis of the -class (“heartbeat”) variability in the Galactic microquasar GRS 1915+105 using 24 Swift XRT observations spanning 2014–2016 and two broadband AstroSat LAXPC/SXT observations. Our main conclusions are:
-
•
Phase-resolved Swift XRT spectroscopy shows an apparent – anti-correlation across the cycle (the inner disk appears to expand from 22 to 38 km while cooling from 1.7 to 1.5 keV in Phases 1–3, then contract to 18 km post-burst), repeatable across all 24 observations spanning 2014–2016. The broadband AstroSat data, however, are statistically consistent with a single constant inner disk temperature, keV (joint -tied fit at for 1881 dof; for 4 added constraints). A fully constant disk is rejected ( when both and the disk normalization are tied), with apparent varying by 20% between km (Phase 5) and km (Phase 4). The disk is thus constant in temperature but modestly variable in apparent emitting area through the cycle.
-
•
Broadband AstroSat SXT+LAXPC data show a systematic correlation between disk extent and coronal electron temperature ( rising from 6 to 14.5 keV during disk expansion through Phases 1–4, partially recovering to 11.5 keV post-burst in Phase 5), driven by geometric modulation of the seed-photon supply via the Haardt–Maraschi mechanism (Haardt and Maraschi, 1991). Energy-dependent spectral hysteresis in the HID and CCD confirms this disk-corona feedback, with Phase 3 appearing softest in XRT/SXT while the hardness ordering changes in LAXPC, where the low-intensity Phase 1 is the hardest above 10 keV. The spectral variability through the cycle is therefore driven mainly by the corona, consistent with the framework established for GRS 1915+105 by Vadawale et al. (2001); the larger apparent swings inferred from Swift XRT alone are a consequence of its limited 1–10 keV bandpass, and broadband coverage to 30 keV is needed for an unbiased disk–corona decomposition.
-
•
These results provide new observational constraints on near-Eddington accretion physics relevant to ULXs, tidal disruption events, and AGN variability (Kaaret et al., 2017; Komossa, 2015; Czerny et al., 2009). The broad spectral range of our AstroSat SXT+LAXPC analysis (0.8–30 keV) enables us to simultaneously probe both the thermal disk and the Comptonized corona, directly revealing the disk-corona coupling and its evolution across the cycle, a result inaccessible to narrow-band observations. The disk-corona feedback mechanism demonstrated here provides an observational constraint for theoretical models of near-Eddington systems, and our phase-resolved continuum analysis provides complementary constraints on the disk structure that drives the wind variability reported by Zoghbi et al. (2016).
In the future, the combination of high-resolution grating spectroscopy and broadband timing available with XRISM (Tashiro et al., 2018) will enable simultaneous constraints on the disk wind, reflection spectrum, and continuum across the cycle, directly testing whether the apparent variations reflect true disk motion or color-correction effects (Zoghbi et al., 2016; Shimura and Takahara, 1995). The next generation of X-ray observatories, including Athena (Nandra et al., 2013), will extend this to fainter systems and higher redshifts, placing GRS 1915+105 in the broader context of accretion variability across the mass scale.
An important caveat on the physical interpretation of the apparent evolution comes from Zoghbi et al. (2016), who used simultaneous NuSTAR and Chandra data to compare the inner radius inferred from the disk blackbody () with that from the relativistic reflection spectrum (). They found the disk-blackbody radius to be far more variable across the cycle than the reflection-inferred radius , and concluded that the apparent radius changes in blackbody-based models may partly reflect variations in the disk color correction factor (Shimura and Takahara, 1995) driven by changes in disk composition and opacity, and not true physical motion of the disk inner edge. Our Swift XRT and AstroSat analyses are based solely on the disk continuum and cannot directly test this. The qualitative anti-correlation we observe is robust, but the absolute amplitude of the variations should be interpreted with this caveat in mind. Future observations capable of simultaneously resolving both the disk continuum and the relativistic reflection spectrum (e.g., XRISM, Tashiro et al. 2018; or Athena, Nandra et al. 2013) will be essential to disentangle these effects.
Acknowledgments
We thank the Swift and AstroSat teams for scheduling and executing these observations. We acknowledge the use of public data from the AstroSat archive at the Indian Space Science Data Center (ISSDC). We thank the SXT and LAXPC Payload Operation Centers at TIFR, Mumbai, for verifying and releasing the data. We also thank the respective instrument teams for their assistance with the data reduction and analysis. This research has made use of data obtained from the High Energy Astrophysics Science Archive Research Center (HEASARC), provided by NASA’s Goddard Space Flight Center.
References
- Abramowicz et al. [1988] Marek A. Abramowicz, Bohdan Czerny, Jean-Pierre Lasota, and Ewa Szuszkiewicz. Slim accretion disks. The Astrophysical Journal, 332:646–658, 1988. doi: 10.1086/166683. URL https://doi.org/10.1086/166683.
- Belloni et al. [2000] T. Belloni, M. Klein-Wolt, M. Méndez, M. van der Klis, and J. van Paradijs. A model-independent analysis of the variability of grs 1915+105. Astronomy and Astrophysics, 355:271–290, 2000. URL https://ui.adsabs.harvard.edu/abs/2000A&A...355..271B.
- Castro-Tirado et al. [1992] A. J. Castro-Tirado, S. Brandt, and N. Lund. Grs 1915+105. IAU Circular, 5590:2, 1992. URL https://ui.adsabs.harvard.edu/abs/1992IAUC.5590....2C.
- Czerny et al. [2009] Bożena Czerny, Marek Nikoajuk, Agata Różańska, Anne-Marie Dumont, Zbigniew Loska, and Piotr T. Zycki. Constraints on the black hole spin in the quasar sdss j094533.99+100950.1. The Astrophysical Journal, 708:1507–1521, 2009. doi: 10.1088/0004-637X/708/2/1507.
- Davis and El-Abd [2019] Shane W. Davis and Sahl El-Abd. Spectral hardening in black hole accretion: Giving spectral modelers an f. ApJ, 874(1):23, 2019. doi: 10.3847/1538-4357/ab09f7.
- Done et al. [2007] C. Done, M. Gierliński, and A. Kubota. Modelling the behaviour of accretion flows in x-ray binaries. Astronomy and Astrophysics Review, 15:1–66, 2007. doi: 10.1007/s00159-007-0006-1.
- Frank et al. [2002] J. Frank, A. King, and D. Raine. Accretion Power in Astrophysics. Cambridge University Press, 3rd edition, 2002. doi: 10.1017/CBO9781139164245.
- Haardt and Maraschi [1991] Francesco Haardt and Laura Maraschi. A two-phase model for the x-ray emission from seyfert galaxies. The Astrophysical Journal, 380(1):L51–L54, 1991. doi: 10.1086/186171.
- Huppenkothen et al. [2019] Daniela Huppenkothen, Matteo Bachetti, Abigail L. Stevens, Simone Miber, Paul Balm, Didier Barret, Wayne Coburn, Riley M.T. Connors, Steven R. Ehlert, et al. Stingray: A modern python library for spectral timing. The Astrophysical Journal, 881(1):39, 2019. doi: 10.3847/1538-4357/ab258d.
- Kaaret et al. [2017] Philip Kaaret, Hua Feng, and Timothy P. Roberts. Ultraluminous x-ray sources. Annual Review of Astronomy and Astrophysics, 55:303–341, 2017. doi: 10.1146/annurev-astro-091916-055259.
- Kellogg et al. [1975] E. Kellogg, J. R. Baldwin, and D. Koch. Studies of cluster X-ray sources. energy spectra for the Perseus, Virgo, and Coma clusters. The Astrophysical Journal, 199:299–306, 1975. doi: 10.1086/153692.
- Komossa [2015] S. Komossa. Tidal disruption of stars by supermassive black holes: Status of observations. Journal of High Energy Astrophysics, 7:148–157, 2015. doi: 10.1016/j.jheap.2015.04.006.
- Kubota et al. [1998] Aya Kubota, Yasuo Tanaka, Kazuo Makishima, Yoshihiro Ueda, Tadayasu Dotani, Hajime Inoue, and Kazutaka Yamaoka. Evidence for a black hole in the x-ray transient grs 1009–45. Publications of the Astronomical Society of Japan, 50(6):667–673, 12 1998. ISSN 0004-6264. doi: 10.1093/pasj/50.6.667. URL https://doi.org/10.1093/pasj/50.6.667.
- Lightman and Eardley [1974] Alan P. Lightman and Douglas M. Eardley. Black holes in binary systems: Instability of disk accretion. The Astrophysical Journal, 187:L1–L3, 1974. doi: 10.1086/181377.
- McClintock et al. [2006] J.E. McClintock, R. Shafee, R. Narayan, R.A. Remillard, S.W. Davis, and L.-X. Li. The spin of the near-extreme kerr black hole grs 1915+105. The Astrophysical Journal, 652(1):518–539, 2006. doi: 10.1086/508457.
- Miller et al. [2013] J.M. Miller, M.L. Parker, F. Fuerst, M. Bachetti, D. Barret, F.A. Harrison, M. Kolehmainen, D. Stern, J.A. Tomsick, D.J. Walton, J. Wilms, and W.W. Zhang. Nustar spectroscopy of grs 1915+105: Disk reflection, spin, and connections to jets. The Astrophysical Journal Letters, 775(1):L45, 2013. doi: 10.1088/2041-8205/775/2/L45.
- Mirabel and Rodríguez [1994] I. F. Mirabel and L. F. Rodríguez. A superluminal source in the galaxy. Nature, 371:46–48, 1994. doi: 10.1038/371046a0.
- Mitsuda et al. [1984] Kazuhisa Mitsuda, Hajime Inoue, Katsuji Koyama, Kazuo Makishima, Masaru Matsuoka, Yasuo Ogawara, Ken Suzuki, Yasuo Tanaka, Noriaki Shibazaki, and Tetsuo Hirano. Energy spectra of low-mass binary x-ray sources observed from tenma. Publications of the Astronomical Society of Japan, 36(6):741–759, 1984. doi: 10.1093/pasj/36.6.741.
- Nandi et al. [2001] A. Nandi, S. K. Chakrabarti, S. V. Vadawale, and A. R. Rao. Ejection of the inner accretion disk in GRS 1915+105: The magnetic rubber-band effect. A&A, 380(1):245–250, 2001. doi: 10.1051/0004-6361:20011444.
- Nandra et al. [2013] K. Nandra, D. Barret, X. Barcons, A. Fabian, et al. The hot and energetic universe: A white paper presenting the science theme motivating the athena+ mission. arXiv preprint arXiv:1306.2307, 2013. doi: 10.48550/arXiv.1306.2307.
- Neilsen et al. [2011] Joseph Neilsen, Ronald A. Remillard, and Julia C. Lee. The physics of the “heartbeat” state of grs1915+105. The Astrophysical Journal, 737(2):69, aug 2011. doi: 10.1088/0004-637X/737/2/69. URL https://dx.doi.org/10.1088/0004-637X/737/2/69.
- Patel et al. [2025] Chintan Patel, Sayantan Bhattacharya, Karan Akbari, Sudip Bhattacharyya, and Manojendu Choudhury. A continuous transition from type-c quasi periodic oscillations to the heartbeat state in the black hole x-ray binary 4u 1630–47. arXiv preprint arXiv:2511.01883, 2025. doi: 10.48550/arXiv.2511.01883.
- Rawat et al. [2018] Divya Rawat, Mayukh Pahari, J. S. Yadav, Pankaj Jain, Ranjeev Misra, Kalyani Bagri, Tilak Katoch, P. C. Agrawal, and R. K. Manchanda. Study of timing evolution from nonvariable to structured large-amplitude variability transition in grs 1915 + 105 using astrosat. The Astrophysical Journal, 870(1):4, dec 2018. doi: 10.3847/1538-4357/aaefed. URL https://doi.org/10.3847/1538-4357/aaefed.
- Reid et al. [2014] M. J. Reid, J. E. McClintock, J. F. Steiner, D. Steeghs, R. A. Remillard, V. Dhawan, and R. Narayan. A parallax distance to the microquasar grs 1915+105 from astrometric observations. The Astrophysical Journal, 796(1):2, 2014. doi: 10.1088/0004-637X/796/1/2.
- Remillard and McClintock [2006] R. A. Remillard and J. E. McClintock. X-ray properties of black-hole binaries. Annual Review of Astronomy and Astrophysics, 44:49–92, 2006. doi: 10.1146/annurev.astro.44.051905.092532.
- Shakura and Sunyaev [1973] N. I. Shakura and R. A. Sunyaev. Black holes in binary systems: observational appearance. Astronomy and Astrophysics, 24:337–355, 1973. URL https://ui.adsabs.harvard.edu/abs/1973A&A....24..337S/abstract.
- Shakura and Sunyaev [1976] N. I. Shakura and R. A. Sunyaev. A theory of the instability of disk accretion on to black holes and the variability of binary x-ray sources, galactic nuclei and quasars. Monthly Notices of the Royal Astronomical Society, 175:613–632, 1976. doi: 10.1093/mnras/175.3.613.
- Shimura and Takahara [1995] Toshiya Shimura and Fumio Takahara. On the spectral hardening factor of the x-ray emission from accretion disks in black hole candidates. The Astrophysical Journal, 445:780–788, 1995. doi: 10.1086/175740.
- Sunyaev and Titarchuk [1980] R. A. Sunyaev and L. G. Titarchuk. Comptonization of x-rays in plasma clouds - typical radiation spectra. Astronomy and Astrophysics, 86:121–138, 1980. URL https://ui.adsabs.harvard.edu/abs/1980A&A....86..121S.
- Tashiro et al. [2018] Makoto Tashiro, Hisashi Maejima, Kazuhiro Toda, et al. Concept of the x-ray astronomy recovery mission. Proceedings of SPIE, 10699:1069922, 2018. doi: 10.1117/12.2309455.
- Uttley et al. [2014] P. Uttley, E. M. Cackett, A. C. Fabian, E. Kara, and D. R. Wilkins. X-ray reverberation around accreting black holes. Astronomy & Astrophysics Review, 22(1):72, 2014. doi: 10.1007/s00159-014-0072-0.
- Vadawale et al. [2001] S. V. Vadawale, A. R. Rao, A. Nandi, and S. K. Chakrabarti. Observational evidence for mass ejection during soft x-ray dips in grs 1915+105. A&A, 370:L17–L21, 2001. doi: 10.1051/0004-6361:20010318.
- Watarai et al. [2000] Ken-ya Watarai, Jun Fukue, Makoto Takeuchi, and Shin Mineshige. Galactic black-hole candidates shining at the eddington luminosity. PASJ, 52(1):133–140, 2000. doi: 10.1093/pasj/52.1.133.
- Watarai et al. [2001] Ken-ya Watarai, Tsunefumi Mizuno, and Shin Mineshige. Slim disk model for ultra-luminous x-ray sources. The Astrophysical Journal Letters, 549:L77, 2001. doi: 10.1086/319125.
- Zdziarski et al. [1996] Andrzej A. Zdziarski, W. Neil Johnson, and Paweł Magdziarz. Broad-band -ray and x-ray spectra of ngc 4151 and their implications for physical processes and geometry. Monthly Notices of the Royal Astronomical Society, 283(1):193–206, 10 1996. ISSN 0035-8711. doi: 10.1093/mnras/283.1.193. URL https://doi.org/10.1093/mnras/283.1.193.
- Zimmerman et al. [2005] Evan R. Zimmerman, Ramesh Narayan, Jeffrey E. McClintock, and Jon M. Miller. Multitemperature blackbody spectrum of a thin accretion disk around a kerr black hole: Model computations and comparison with observations. The Astrophysical Journal, 618:832–844, 2005. doi: 10.1086/426071.
- Zoghbi et al. [2016] Abderahmen Zoghbi, J. M. Miller, A. L. King, M. C. Miller, D. Proga, T. Kallman, A. C. Fabian, F. A. Harrison, J. Kaastra, J. Raymond, C. S. Reynolds, S. E. Boggs, F. E. Christensen, W. Craig, C. J. Hailey, D. Stern, , and W. W. Zhang. Disk–wind connection during the heartbeats of grs 1915+105. The Astrophysical Journal, 833(2):165, 2016. doi: 10.3847/1538-4357/833/2/165.