R3-VAE: Reference Vector-Guided Rating Residual Quantization VAE for Generative Recommendation
Abstract
Generative Recommendation (GR) has gained traction for its merits of superior performance and cold-start capability. As the vital role in GR, Semantic Identifiers (SIDs) represent item semantics through discrete tokens. However, current techniques for SID generation based on vector quantization face two main challenges: (i) training instability, stemming from insufficient gradient propagation through the straight-through estimator and sensitivity to initialization; and (ii) inefficient SID quality assessment, where industrial practice still depends on costly GR training and A/B testing. To address these challenges, we propose Reference Vector-Guided Rating Residual Quantization VAE (-VAE). This framework incorporates three key innovations: (i) a reference vector that functions as a semantic anchor for the initial features, thereby mitigating sensitivity to initialization; (ii) a dot product-based rating mechanism designed to stabilize the training process and prevent codebook collapse; and (iii) two SID evaluation metrics, Semantic Cohesion and Preference Discrimination, serving as regularization terms during training. Empirical results on six benchmarks demonstrate that -VAE outperforms state-of-the-art methods, achieving an average improvement of 14.5% in Recall@10 and 15.5% in NDCG@10 across three public datasets (Beauty, Sports, and Toys). Furthermore, we perform GR training and online A/B tests on Toutiao. Our method achieves a 1.62% improvement in MRR and a 0.83% gain in StayTime/U versus baselines. Additionally, we employ -VAE to replace the item ID of CTR model, resulting in significant improvements in content cold start by , corroborating the strong applicability and business value in industry-scale recommendation scenarios. Crucially, our proposed metrics exhibit a stronger correlation with downstream performance, evidenced by Spearman’s rank correlation coefficients of 0.94 and 0.90 in the GR and CTR experiments.
[Github Repository]https://github.com/wwqq/R3-VAE
1 Introduction
With the rise of Large Language Models (LLMs), there has been a paradigm shift in the field of recommender systems. Generative Recommendation (GR) [27, 9, 26, 3, 18, 4, 14, 10, 6] is gradually replacing traditional “retrieval-reranking” pipelines. It directly outputs item identifiers via generative models, eliminating intermediate embedding tables, ANN indexes, and reranking modules for scalable end-to-end recommendation. As the key enabler of GR, Semantic Identifier (SID) [7, 27, 3] discrete tokens that capture item semantic attributes, enabling an interpretable mapping to human-understandable categories and seamless integration with pre-trained language models [38, 37, 22]. Current SID generation relies on vector quantization (VQ), which compresses continuous embeddings into discrete codewords via a learnable codebook. Among VQ methods, Residual Quantization (RQ) is a cornerstone with implementations such as RQ-VAE [15, 36] (in TIGER [27]) and residual K-Means [23] (in OneRec [3]), which leverage hierarchical “coarse-to-fine” residual quantization for efficient learning. Complemented by VQ-Rec’s OPQ [7, 5] for codebook optimization, these advances establish VQ-based quantization as the de facto standard for SID learning in GR.
Despite significant progress, state-of-the-art SID generation techniques also exhibit limitations that impede their performance in GR systems. A primary drawback is training instability stemming from inadequate gradient propagation during quantization. RQ-VAE, for instance, relies on the Straight-Through Estimator (STE) to approximate gradients across the non-differentiable codebook lookup operation [15, 36]. This approximation provides a biased gradient estimator. It often fails to propagate fine-grained information from the reconstruction loss effectively, leading to codebook collapse where the majority of vectors map to a small subset of codewords. While residual K-Means quantization [23] partially mitigates this issue, it is highly affected by the initial cluster centers and tends to prolong convergence or get trapped in local optima.
Another practical challenge in GR development is the lack of quantifiable metrics strongly correlated with downstream performance for SID quality assessment. Current approaches validate SID indirectly via downstream GR metrics (e.g., NDCG, Recall) in end-to-end evaluations. While this reflects real-world utility, it is computationally costly. This inefficiency severely hinders model iteration, as quantization module modifications cannot be rapidly evaluated without full downstream validation, impeding GR system design progress. Moreover, existing SID evaluation metrics proposed by some methods, such as Collision Rate in [16] and the Gini coefficient [4], exhibit limited correlation with downstream tasks and are not conducive to end-to-end optimization.
To address these limitations, we propose Reference Vector-Guided Rating Residual Quantization VAE (-VAE), a novel framework tailored for high-quality SID generation in GR systems. Our key contributions are as follows: (i) We introduce the reference vector that serves as a semantic anchor for initial item feature processing. By projecting input embeddings by this reference vector and computing the residual, we align the quantization process with the semantic structure of recommendation data from the outset. This design mitigates initialization sensitivity and ensures early residual vectors capture preference-relevant information, addressing the training instability and convergence challenges inherent in RQ-VAE and residual K-Means quantization. (ii) We replace STE with a rating mechanism that employs dot product to propagate reconstruction loss gradients. We compute “ratings” between codewords and residual with the dot product to measure angular similarity (e.g., semantic alignment) to quantify residual-codebook relevance. Unlike STE, this design retains fine-grained gradient information across quantization steps, stabilizing training and accelerating convergence. It preserves the hierarchical advantages of RQ-VAE [15] and residual K-Means [23] while eliminating codebook collapse, addressing the core instability of existing methods. (iii) We propose two quantifiable and optimizable metrics for SID evaluation: Semantic Cohesion (SC) and Preference Discrimination (PD). Specifically, SC measures the intra-cluster semantic consistency by computing the average cosine similarity between items in the same SID. Higher SC indicates stronger preference alignment within clusters. PD quantifies the inter-cluster divergence by calculating the average cosine distance between SIDs from different clusters and their respective centroids. Lower PD indicates distinct preference patterns across clusters. Both metrics exhibit a stronger correlation with downstream performance than the existing measures, including collision rate and Gini coefficient. This superior performance is substantiated by our online A/B test, where we observed a Spearman’s rank correlation coefficient of .
Empirical results on six benchmarks demonstrate that -VAE outperforms state-of-the-art methods, achieving an average improvement of 14.5% in Recall@10 and 15.5% in NDCG@10 across three public datasets (Beauty, Sports, and Toys). More importantly, we conduct comprehensive experiments on a large-scale industrial dataset derived from Toutiao, comparing -VAE with mainstream industrial baselines under the OneRec framework. Offline evaluation results show -VAE achieves an MRR of 0.628, representing 3.80% and 1.62% improvements over RQ-VAE and residual K-Means, respectively. Online A/B test further confirms its practical value. -VAE improves StayTime/U (defined as average time spent by a user per day) by 1.59% compared to RQ-VAE and by 0.82% compared to residual K-Means. Additionally, it improves LongStay/U (the count of documents on which a user’s stay time exceeds ten seconds per user) by 0.60% in comparison to RQ-VAE and 0.28% to residual K-Means. Inspired by the performance observed in GR, we further employed the SID to replace the item ID in traditional CTR models, resulting in significant improvements in cold start and user engagement metrics. Notably, -VAE facilitates a substantial increase of 15.36% in the total click volume of cold-start content (defined as content with impression counts below 512) and achieves a 0.65% enhancement in stay duration per user when compared to R-KMeans. These findings underscore the excellent applicability and business value of -VAE in real-world industrial recommendations.
The remainder of this paper is structured as follows: Section 2 reviews related work on GR and SID generation. Section 3 details the architecture and optimization of -VAE. Section 4 presents experimental results. Section 5 concludes the paper.
2 Related Work
2.1 Generative Recommendation
Generative Recommendation (GR) [27, 9, 26, 3, 18, 4, 14, 12, 32, 21] has emerged as a transformative paradigm in recommender systems, deviating from traditional multi-stage “retrieval-reranking” pipelines by leveraging generative models to directly output target item identifiers (e.g., semantic IDs) for end-to-end recommendation without relying on intermediate embedding tables, ANN indexes, or separate reranking modules.
This paradigm shift is driven by the powerful sequence modeling and semantic understanding capabilities of Large Language Models (LLMs) and advanced generative architectures, addressing long-standing limitations of traditional recommendation systems. OneRec [3] and TIGER [27] leverage vector quantization to map items into semantic ID sequences, enabling generative models to capture fine-grained user preferences and item correlations beyond the scope of collaborative filtering. Recent advancements further enhance GR with explicit reasoning capabilities (e.g., OneRec-Think [21]) and adaptive domain alignment (e.g., LGSID [13]), allowing the framework to address scenario-specific constraints by incorporating task-specific signals into the generation process.
2.2 Semantic Identifier
VQ-Rec [7] proposed an optimized product quantization (OPQ) [5] based method to discretize encodings of items to obtain semantically-rich and distinguishable item codes. CCFRec [19] used PQ [11] and RQ to map item embeddings into multi-level discrete codes. UniSearch [2] set VQ-VAE as the tokenizer to discretize multi-modal information into SID. TIGER [27], LETTER [33], SETRec [17], GNPR-SID [31], EGA-V2 [39], DAS [35], UIST [20], CoST [42], and MM-RQ-VAE [34] adopted a hierarchical quantizer called Residual Quantized VAE (RQ-VAE) [15, 36] on content embeddings to generate tokens that form the semantic Identifier. SEATER [28] used hierarchical constrained K-Means [1] to generate equal-length identifiers. OneRec [3] introduced a multi-level balanced quantitative mechanism with the residual K-Means quantization algorithm [23]. Besides, RPG [9], TokenRec [26], ETEGRec [18], and so on [29, 4] have proposed several improved schemes for generating Semantic Identifier (SID).
However, these SID generation approaches have some obvious drawbacks, such as unstable training, dependence on initialization, slow convergence, and insufficient expressive ability, which lead to suboptimal performance. In this paper, we propose -VAE to address the above issues. It has achieved significant improvements in downstream generative recommendation tasks, outperforming previous SID generation methods.
3 Method

This section details the architecture and optimization of -VAE, a framework designed to address the limitations of existing SID generation methods (training instability, inefficient evaluation) for Generative Recommendation (GR). The -VAE consists of three core components: a Reference Vector Projection Layer for semantic anchoring, a Dot Product-Based Rating Quantization Module for gradient-preserving residual updates, and a pair of SID Quality Metrics (SC/PD) for direct evaluation. Figure 1 provides an overview of the end-to-end pipeline.
3.1 Architecture Overview
-VAE processes item continuous embeddings into high-quality SIDs through a hierarchical residual quantization workflow, integrating the reference vector and rating mechanism into a Variational Autoencoder (VAE) backbone. The pipeline follows three key steps: (i) Reference Vector Projection: Input embeddings are projected by a learnable reference vector to generate semantically aligned initial residuals. (ii) Hierarchical Rating Quantization: Residuals are iteratively quantized via a dot product-based rating mechanism, preserving gradient flow to avoid codebook collapse. (iii) SID Generation & Evaluation: Quantized codewords are concatenated to form SID, whose quality is directly assessed using SC and PD before downstream GR deployment.
3.2 Reference Vector Projection Layer
The goal of this layer is to align the initial residual computation with the semantic structure of recommendation data, mitigating the initialization sensitivity of RQ-VAE and residual K-Means.
3.2.1 Reference Vector Definition
We introduce a learnable reference vector , where denotes the dimension of input item embeddings . The vector is optimized end-to-end to capture the semantic center of the recommendation dataset—e.g., aggregating preference patterns of dominant semantic attributes of core items.
3.2.2 Projection and Initial Residual Calculation
For an input embedding , we first compute its semantic projection onto using the dot product (to measure angular similarity, aligned with recommendation relevance). The projection scalar and initial residual are defined as:
| (1) |
| (2) |
where quantifies the semantic affinity between and , and represents the component of that deviates from the semantic center. This ensures retains preference-relevant information, unlike arbitrary residuals in RQ-VAE.
3.3 Rating Quantization Module
This layer replaces the STE-based gradient approximation in RQ-VAE with a dot product rating mechanism, enabling continuous gradient propagation across quantization steps. We adopt a hierarchical design with quantization layers (consistent with RQ’s “coarse-to-fine” paradigm), where each layer () processes the residual from the previous layer and outputs a codeword.
3.3.1 Codebook Initialization
Each quantization layer maintains a codebook , where is the number of codewords per layer (fixed across layers for simplicity). -VAE initializes via semantic clustering: we cluster the initial residuals of the training set using K-Means, then set to the cluster centroids. Subsequent codebooks () are initialized using centroids of residuals from layer , ensuring alignment with hierarchical semantic structure. We also ablate the impact of initialization in subsection 4.8.
3.3.2 Dot Product Rating Calculation
For the residual from layer , we compute a rating score between and each codeword using the normalized dot product. The dot product is chosen to measure angular similarity (semantic alignment) rather than Euclidean distance (geometric proximity), which better matches recommendation relevance:
| (3) |
To normalize scores into a probability distribution, we apply the softmax function to obtain the rating weight for each codeword:
| (4) |
Here, represents the confidence that is the optimal codeword for . Unlike RQ-VAE’s hard codebook lookup (non-differentiable), the soft enables continuous gradient flow.
3.3.3 Residual Update and Codeword Selection
The quantized representation at layer is a weighted sum of codewords (weighted by ), and the residual for the next layer is updated as:
| (5) |
| (6) |
Here, is the top- weights. After processing all layers, the SID for input is formed by concatenating the indices of the top-weighted codeword from each layer:
| (7) |
3.4 SID Quality Metrics
To bypass the computationally costly downstream GR validation step, we introduce two direct, quantifiable metrics for assessing SID quality: Semantic Cohesion (SC), which measures intra-cluster semantic consistency, and Preference Discrimination (PD,) which quantifies inter-cluster preference divergence. These metrics draw inspiration from prior works [16, 3, 4] on cluster validity assessment, adapted to align with the semantic and preference-oriented nature of SID in generative recommendation scenarios.
3.4.1 Semantic Cohesion (SC)
SC measures the consistency of semantics by calculating the average cosine similarity between the quantitative embeddings of items and their corresponding code embeddings within the same cluster. For a cluster (containing a set of items), let denote the quantitative embedding of item , and denote the quantitative embedding of another item . The SC for cluster is defined as:
| (8) |
where is the number of items in cluster , denotes the dot product operation, and represents the L2 norm of a vector. The overall SC of the model is the average of across all clusters .
| (9) |
A higher SC value indicates that the quantitative embeddings and code embeddings of items within the same cluster are more consistent.
3.4.2 Preference Discrimination (PD)
PD quantifies how distinct the preference patterns of different SID clusters are. For two disjoint clusters and , their preference divergence is measured by the distance between their centroid vectors and . The overall PD is the average distance across all pairs of clusters:
| (10) |
where is the total number of SID clusters. Here, we set to 2. Lower PD indicates clusters have more distinct preference patterns, reducing redundancy in downstream GR.
“‘latex
| Dataset | Method | Recall | NDCG | Semantic | Preference | ||||
| @10 | @20 | @30 | @10 | @20 | @30 | Cohesion | Discrimination | ||
| Beauty | VQ-VAE | 0.055 | 0.072 | 0.086 | 0.031 | 0.036 | 0.039 | 0.85 | -0.17 |
| RQ-VAE | 0.059 | 0.091 | 0.111 | 0.033 | 0.041 | 0.047 | 0.93 | -1.18 | |
| KMeans | 0.060 | 0.095 | 0.115 | 0.035 | 0.043 | 0.048 | 0.93 | -0.22 | |
| OPQ-KMeans | 0.059 | 0.092 | 0.113 | 0.033 | 0.042 | 0.048 | 0.94 | -1.14 | |
| R-KMeans | 0.064 | 0.097 | 0.121 | 0.035 | 0.043 | 0.048 | 0.96 | -1.39 | |
| MQ | 0.056 | 0.081 | 0.092 | 0.034 | 0.037 | 0.042 | 0.90 | -1.03 | |
| -VAE | 0.072 | 0.102 | 0.125 | 0.039 | 0.047 | 0.052 | 0.97 | -1.81 | |
| Sports | VQ-VAE | 0.028 | 0.039 | 0.051 | 0.015 | 0.018 | 0.020 | 0.90 | -0.11 |
| RQ-VAE | 0.031 | 0.048 | 0.062 | 0.017 | 0.021 | 0.024 | 0.94 | -1.17 | |
| KMeans | 0.033 | 0.054 | 0.069 | 0.018 | 0.023 | 0.026 | 0.91 | -0.21 | |
| OPQ-KMeans | 0.030 | 0.044 | 0.057 | 0.015 | 0.019 | 0.023 | 0.90 | -1.14 | |
| R-KMeans | 0.035 | 0.058 | 0.071 | 0.019 | 0.025 | 0.028 | 0.95 | -1.38 | |
| MQ | 0.036 | 0.058 | 0.070 | 0.020 | 0.025 | 0.027 | 0.95 | -1.16 | |
| -VAE | 0.041 | 0.063 | 0.078 | 0.022 | 0.027 | 0.030 | 0.97 | -1.80 | |
| Toys | VQ-VAE | 0.044 | 0.051 | 0.062 | 0.025 | 0.027 | 0.029 | 0.91 | -0.15 |
| RQ-VAE | 0.051 | 0.074 | 0.089 | 0.028 | 0.035 | 0.038 | 0.94 | -1.19 | |
| KMeans | 0.052 | 0.077 | 0.097 | 0.029 | 0.035 | 0.040 | 0.92 | -0.22 | |
| OPQ-KMeans | 0.051 | 0.071 | 0.080 | 0.028 | 0.033 | 0.037 | 0.94 | -1.15 | |
| R-KMeans | 0.058 | 0.086 | 0.107 | 0.031 | 0.038 | 0.043 | 0.96 | -1.39 | |
| MQ | 0.054 | 0.081 | 0.100 | 0.029 | 0.036 | 0.040 | 0.89 | -1.02 | |
| -VAE | 0.066 | 0.094 | 0.114 | 0.037 | 0.044 | 0.048 | 0.98 | -1.83 | |
“‘
3.5 Model Optimization
-VAE is optimized via a hybrid loss function that combines VAE reconstruction loss (for embedding fidelity) and metric-aware regularization (for SID quality).
3.5.1 Reconstruction Loss
The VAE decoder reconstructs the input embedding from the final residual and the sum of all quantized representations . The reconstruction loss is the Mean Squared Error (MSE) between and its reconstruction :
| (11) |
3.5.2 Metric-Aware Regularization
To align the model with SC and PD, we add a regularization term that maximizes SC and PD. Let denote the average SC across clusters, and denote the average PD across clusters. The regularization loss is:
| (12) |
3.5.3 Total Loss
The total loss for -VAE is the sum of the reconstruction loss and metric regularization:
| (13) |
where is a hyperparameter balancing the two terms (set to 0.01 in experiments via cross-validation). The model is optimized using AdamW optimizer with a learning rate of and weight decay of .
4 Experiments
To validate the effectiveness of -VAE in generating high-quality SID for Generative Recommendation (GR), we design experiments addressing three key questions: (1) Does -VAE outperform state-of-the-art SID generation methods in downstream GR tasks? (2) Are the proposed SID metrics (SC/PD) effective proxies for GR performance? (3) Do the core components of -VAE (reference vector, rating mechanism) contribute to performance improvements?
4.1 Experimental Setup
4.1.1 Datasets
4.1.2 Baselines
We compare -VAE with several mainstream VQ and RQ-based SID generation methods: VQ-VAE [30]: A standard vector quantization variational autoencoder (VAE) using the straight-through estimator (STE) for gradient approximation without residual decomposition. RQ-VAE and its variants [15, 36]: Hierarchical residual quantization VAE. MQ [26]: Masked vector based RQ-VAE. OPQ-KMeans (Optimized Product Quantization KMeans) [5, 7]: VQ-based method that optimizes codebook orthogonality to reduce quantization error. Residual K-Means [23, 3]: RQ-based method that integrates K-Means clustering for codebook learning.
4.1.3 Evaluation Metrics
We evaluate from two perspectives: downstream GR performance for validating SID utility, and SID quality to validate the proposed metrics SC/PD.
| Dataset | Method | Recall | NDCG | Semantic | Preference | ||||
| @10 | @20 | @30 | @10 | @20 | @30 | Cohesion | Discrimination | ||
| LastFM | VQ-VAE | 0.042 | 0.088 | 0.118 | 0.018 | 0.030 | 0.036 | 0.40 | -1.56 |
| RQ-VAE | 0.047 | 0.087 | 0.119 | 0.021 | 0.031 | 0.038 | 0.72 | -1.65 | |
| KMeans | 0.051 | 0.084 | 0.118 | 0.024 | 0.033 | 0.040 | 0.79 | -1.73 | |
| OPQ-KMeans | 0.060 | 0.104 | 0.140 | 0.030 | 0.041 | 0.047 | 0.91 | -1.85 | |
| R-KMeans | 0.056 | 0.097 | 0.127 | 0.026 | 0.038 | 0.044 | 0.85 | -1.77 | |
| MQ | 0.053 | 0.094 | 0.125 | 0.025 | 0.035 | 0.042 | 0.80 | -1.71 | |
| -VAE | 0.076 | 0.117 | 0.149 | 0.037 | 0.047 | 0.054 | 0.98 | -1.98 | |
| ML1M | VQ-VAE | 0.069 | 0.116 | 0.154 | 0.033 | 0.045 | 0.053 | 0.56 | -1.69 |
| RQ-VAE | 0.092 | 0.163 | 0.210 | 0.051 | 0.065 | 0.071 | 0.71 | -1.73 | |
| KMeans | 0.072 | 0.135 | 0.184 | 0.034 | 0.053 | 0.061 | 0.57 | -1.67 | |
| OPQ-KMeans | 0.132 | 0.214 | 0.275 | 0.065 | 0.086 | 0.099 | 0.88 | -1.83 | |
| R-KMeans | 0.160 | 0.244 | 0.303 | 0.080 | 0.101 | 0.114 | 0.91 | -1.88 | |
| MQ | 0.101 | 0.168 | 0.215 | 0.053 | 0.070 | 0.080 | 0.78 | -1.75 | |
| -VAE | 0.183 | 0.277 | 0.341 | 0.096 | 0.119 | 0.133 | 0.97 | -1.98 | |
| Clothing | VQ-VAE | 0.009 | 0.016 | 0.023 | 0.004 | 0.006 | 0.008 | 0.73 | -1.61 |
| RQ-VAE | 0.011 | 0.018 | 0.024 | 0.005 | 0.007 | 0.008 | 0.81 | -1.74 | |
| KMeans | 0.007 | 0.013 | 0.017 | 0.003 | 0.005 | 0.006 | 0.67 | -1.55 | |
| OPQ-KMeans | 0.013 | 0.020 | 0.025 | 0.007 | 0.009 | 0.010 | 0.86 | -1.85 | |
| R-KMeans | 0.014 | 0.021 | 0.026 | 0.008 | 0.009 | 0.011 | 0.90 | -1.87 | |
| MQ | 0.017 | 0.024 | 0.029 | 0.011 | 0.011 | 0.013 | 0.87 | -1.89 | |
| -VAE | 0.018 | 0.026 | 0.033 | 0.011 | 0.012 | 0.014 | 0.96 | -2.00 | |
Downstream GR Performance Metrics
We use a Transformer-based GR model (consistent across all methods) that takes SID as input to generate recommended item sequences. Key metrics: Recall@K: Fraction of relevant items in the top-K generated sequence (K=10, 20, 30). NDCG@K: Normalized Discounted Cumulative Gain (K=10, 20, 30); measures ranking quality of relevant items.
SID Quality Metrics
4.2 Comparison with state of the art
Following [14, 26], all methods are configured with the same hyperparameters for fairness. Table 1 presents the downstream GR performance of -VAE and baselines on Beauty, Sports, and Toys datasets. From the table, we can observe that -VAE outperforms all baselines across all metrics and datasets consistently. For instance, on Beauty, -VAE achieves Recall@10 = 0.072 and NDCG@10 = 0.039, representing 12.5% and 11.4% improvements over R-KMeans (the strongest baseline in this set), respectively. On Sports, -VAE further demonstrates its effectiveness by boosting Recall@10 by 17.1% and NDCG@10 by 15.8% compared to R-KMeans, while on the Toys dataset, it delivers 13.8% higher Recall@10 and 19.4% higher NDCG@10 than the same baseline, confirming its robustness across diverse recommendation scenarios.
To comprehensively validate -VAE’s generalization ability, Table 2 extends the evaluation to three additional datasets: LastFM, ML1M, and Clothing. The results here reinforce -VAE’s superior performance. on LastFM, it achieves Recall@10 = 0.076 and NDCG@10 = 0.037, outperforming OPQ-KMeans by 26.7% and 23.3% in these two metrics. On ML1M, -VAE maintains advantage with 14.4% and 20.0% gains in Recall@10 and NDCG@10 over R-KMeans, respectively. On Clothing, -VAE outperforms MQ, further verifying that its superior performance compared with all these baselines.
4.3 Generative Recommendation Performance on Industrial Dataset
To validate the practical applicability of -VAE in real-world generative recommendation scenarios, we conduct experiments on a large-scale industrial dataset from interaction logs of Toutiao. Constrained by resources, we compare -VAE with two mainstream industrial generative model baselines: RQ-VAE and Residual K-Means (R-KMeans).
4.3.1 Implementation Details
The overall experimental framework follows OneRec [3]. The codebook size is . The optimizer adopts AdamW with an initial learning rate of , and all experiments are conducted on NVIDIA A100 GPUs. For generation configuration, the is set to 5%, and the number of responses generated by beam search is 512. User historical behavior features include user profile information, real-time click sequences, real-time impression sequences, and recent click sequences.
4.3.2 Offline Evaluation
We use Mean Reciprocal Rank (MRR) as the core offline evaluation metric. MRR calculates the reciprocal of the rank of the correct result in the predicted sequence for each sample and takes the average, reflecting the model’s ability to rank correct results in top positions.
Table 3 presents the offline MRR performance of all methods. From Table, we observe that -VAE significantly outperforms both baselines. -VAE attains a superior MRR of 0.628, marking improvements of 3.80% over RQ-VAE (MRR = 0.605) and 1.62% over R-KMeans (MRR = 0.618). This confirms that -VAE’s core innovations (reference vector-based semantic anchoring and gradient-preserving rating mechanism) effectively enhance the quality of generated SID, thereby improving the accuracy of top-ranked results in generative recommendation.
4.3.3 Online A/B Test
To empirically assess the practical business impact of -VAE, we further execute an online A/B test. The experiment evaluated user engagement using two primary metrics: StayTime/U, defined as the average total time spent by a user per day, and LongStay/U, which measures the count of documents on which a user’s stay time exceeds ten seconds per user.
Table 3 shows the online performance. The results demonstrate that -VAE drives significant improvements in user engagement metrics. For StayTime/U, -VAE achieves 2672s, which is 1.60% higher than RQ-VAE (2630s) and 0.83% higher than R-KMeans (2650s). Regarding LongStay/U, -VAE yields the highest score 25.35, surpassing RQ-VAE (25.20) and R-KMeans (25.28) by 0.60% and 0.28%, respectively. These online results fully validate that the superior offline performance of -VAE translates into tangible business value, effectively enhancing user engagement in real industrial recommendation scenarios.
4.4 Discriminative Recommendation Performance on Industrial Dataset
To validate -VAE’s generalization ability in discriminative recommendation scenarios (like Click-Through Rate prediction, a core task in industrial recommender systems), we conduct experiments by replacing the id embedding with each SID on the same industrial dataset.
4.4.1 Implementation Details
The experiments are conducted on the CTR model. The codebook size is . The framework follows DIN [40], SIM [25], and RankMixer [41]. We use RMSPropV2 as the optimizer, set batch size to 2048 and initial learning rate to , and leverage the recent 60 user click sequences as historical behavior features.
4.4.2 Offline Evaluation
We adopt User Area Under ROC Curve (UAUC) as the core offline evaluation metric. Table 4 presents the offline UAUC performance and SID quality metrics of -VAE and baselines. It can be observed that -VAE achieves the highest UAUC (0.6669) across all methods, which aligns with its optimal SID quality (highest SC=0.94, lowest PD=-1.980, lowest CR=1.033, and smallest Gini=0.0314).
4.4.3 Online A/B Test
To quantify the actual gains of the -VAE for online services, we conduct an A/B test of RQ-VAE, R-KMeans and -VAE, with StayDuration/U (Average Stay Duration per User) and Cold-Start Click Volume as key metrics for Existing and New Users. Table 5 presents the results of the A/B test. The data demonstrate that the -VAE achieves a 0.11% and 0.65% improvement in the StayDuration/U for existing and new users compared to R-KMeans, respectively. Meanwhile, the model also drives a significant increase in the click volume of cold-start content (with impression counts below 512), with respective lifts of 4.26% and 15.36% observed among existing and new users. These findings indicate that high-quality SID can bring substantial gains to industrial recommendation systems. Currently, our proposed -VAE model has been fully deployed in production services.
| Method | MRR | StayTime/U | LongStay/U |
| RQ-VAE | 0.605 | 2630 | 25.20 |
| R-KMeans | 0.618 | 2650 | 25.28 |
| -VAE | 0.628 (+1.62%) | 2672 (+0.83%) | 25.35 (+0.28%) |
| Method | UAUC | Semantic | Preference | Collision | Gini |
| Cohesion | Discrimination | Rate | Coefficient | ||
| RQ-VAE | 0.6538 | 0.76 | -1.950 | 1.271 | 0.0815 |
| OPQ-KMeans | 0.6571 | 0.85 | -1.975 | 1.070 | 0.0692 |
| R-KMeans | 0.6577 | 0.92 | -1.985 | 1.039 | 0.0366 |
| MQ | 0.6553 | 0.91 | -1.960 | 1.037 | 0.0348 |
| -VAE | 0.6669 | 0.94 | -1.980 | 1.033 | 0.0314 |
| Method | Existing Users | New Users | ||
| SD/U | CS Click | SD/U | CS Click | |
| RQ-VAE | 37680 | 8224 | 5039 | 1441 |
| R-KMeans | 37696 | 8335 | 5057 | 1510 |
| -VAE | 37737 (+0.11%) | 8690 (+4.26%) | 5090 (+0.65%) | 1742 (+15.36%) |
| Method | Recall @ 10 | Semantic | Preference | Collision | Gini |
| Cohesion | Discrimination | Rate | Coefficient | ||
| VQ-VAE | 0.0552 | 0.85 | -0.17 | 60.5 | 0.43 |
| RQ-VAE | 0.0593 | 0.93 | -1.18 | 48.99 | 0.89 |
| KMeans | 0.0599 | 0.93 | -0.22 | 47.27 | 0.49 |
| OPQ-KMeans | 0.0595 | 0.94 | -1.14 | 4.98 | 0.68 |
| R-KMeans | 0.0639 | 0.96 | -1.39 | 1.14 | 0.11 |
| MQ | 0.0563 | 0.90 | -1.03 | 89.64 | 0.93 |
| -VAE | 0.0716 | 0.97 | -1.81 | 1.11 | 0.09 |
4.5 Correlation Between SID Metrics and Downstream Performance
To further explore the relationship between SID quality metrics and downstream performance, we conduct a Spearman rank correlation analysis between the SID metrics (our proposed Semantic Cohesion, Preference Discrimination, and Collision Rate [16], Gini coefficient [4]) and UAUC (the core downstream discriminative recommendation indicator) or Recall@10 (the core downstream GR indicator) in Table 4. The Spearman correlation coefficient quantifies the monotonic relationship between two variables, with values ranging from -1 (perfect negative correlation) to 1 (perfect positive correlation).
| Metric | Spearman Correlation | Spearman Correlation |
| with UAUC | with Recall@10 | |
| Semantic Cohesion | 0.90 | 0.94 |
| Preference Discrimination | -0.90 | -0.75 |
| Collision Rate | -0.70 | -0.93 |
| Gini Coefficient | -0.70 | -0.64 |
| Method | Recall | NDCG | SC | PD | ||||
| @10 | @20 | @30 | @10 | @20 | @30 | |||
| -VAE (Full) | 0.0716 | 0.1025 | 0.1250 | 0.0393 | 0.0470 | 0.0518 | 0.97 | -1.81 |
| w/o Reference Vector | 0.0642 | 0.0975 | 0.1211 | 0.0357 | 0.0437 | 0.0486 | 0.94 | -1.73 |
| w/o Rating Quantization | 0.0640 | 0.0968 | 0.1201 | 0.0351 | 0.0434 | 0.0478 | 0.90 | -1.78 |
| w/o SC Regularization | 0.0652 | 0.0988 | 0.1217 | 0.0369 | 0.0451 | 0.0490 | 0.90 | -1.85 |
| w/o PD Regularization | 0.0647 | 0.0981 | 0.1214 | 0.0367 | 0.0440 | 0.0487 | 0.96 | -1.56 |
From the results in Table 7, we observe consistent yet scenario-adaptive correlation patterns between our proposed SID quality metrics and downstream recommendation performance across both industrial discriminative recommendation tasks (UAUC) and public dataset generative retrieval tasks (Recall@10). Specifically, Semantic Cohesion (SC) demonstrates a strong positive correlation with both UAUC () and Recall@10 (). This confirms that higher intra-cluster semantic consistency of SID universally enhances recommendation accuracy, which aligns with -VAE achieving the top SC values and leading downstream performance across all scenarios. Preference Discrimination (PD) exhibits strong negative correlations with both metrics ( for UAUC; for Recall@10). A more negative PD value indicates larger inter-cluster preference divergence, which helps distinguish user preferences and thus improves recommendation relevance. Collision Rate (CR) shows a strong negative correlation with Recall@10 () and a moderate negative correlation with UAUC (). Lower CR values mean fewer SID collisions (i.e., distinct items map to unique SID), reducing retrieval ambiguity and boosting performance—an effect that is more pronounced on public generative retrieval tasks. The Gini coefficient (a measure of codebook imbalance) presents moderate negative correlations with both UAUC () and Recall@10 (), suggesting it has a relatively limited impact on downstream performance compared with SC, PD, and CR.
These unified results reveal that SC and PD are more effective SID quality proxies for industrial discriminative recommendation tasks, while SC and CR show stronger relevance to generative retrieval performance on public datasets. However, considering that PD can be optimized directly via end-to-end training, whereas CR typically requires additional post-processing strategies (e.g., codebook balancing strategy), we ultimately select SC and PD as the core optimization objectives and SID quality evaluation metrics for -VAE from the perspective of engineering feasibility. Notably, -VAE achieves the optimal combination of these key metrics across both industrial and public datasets, which explains its consistent superiority over baselines.
4.6 Ablation Studies
4.6.1 Impact of key components
To isolate the contribution of each core component of -VAE, we evaluate several ablated variants on Beauty dataset:
-
•
-VAE w/o Reference Vector: Removes the reference vector projection layer; initial residual .
-
•
-VAE w/o Rating Quantization: Replaces the dot product rating mechanism with STE (same as RQ-VAE’s gradient approximation).
-
•
-VAE w/o SC/PD Regularization: Removes the metric-aware regularization term.
Table 8 shows the results. Removing the reference vector projection layer reduces Recall@10 by 10.3% and NDCG@10 by 9.2%, confirming its role in mitigating initialization sensitivity and aligning residuals with semantic structure. Replacing the rating quantization module with STE reduces NDCG@10 by 10.6%, verifying the rating mechanism’s value for gradient preservation. Removing SC/PD regularization also weakens the downstream GR performance, highlighting the metrics’ role in guiding SID quality.
| Recall @ 10 | NDCG @ 10 | Semantic | Preference | |
| Cohesion | Discrimination | |||
| 0.001 | 0.0656 | 0.0371 | 0.96 | -1.79 |
| 0.01 | 0.0716 | 0.0393 | 0.97 | -1.81 |
| 0.1 | 0.0669 | 0.0373 | 0.95 | -1.87 |
4.6.2 Regularization Weight
Table 9 shows Recall@10, NDCG@10, SC and PD as increases from 0.001 to 0.1 (with , fixed). is the optimal choice in this scenario.


4.7 Qualitative Analysis
To further validate the effectiveness of the reference vector projection layer in shaping embedding distributions for clustering, we visualize the embeddings before and after projection using two methods: Spherical Distribution (Figure 2) and Preference Discrimination Angle Distribution (Figure 3).
4.7.1 Visualization Analysis
Spherical Distribution
Figure 2 compares the 3D PCA projections of original embeddings (left) and projected embeddings (right). The original embeddings exhibit a compact, clustered distribution (concentrated in a small subregion of the PCA space), which limits the discriminability of clusters—similar points are overly aggregated, making it difficult for clustering algorithms to distinguish distinct groups. In contrast, the projected embeddings are spatially dispersed (spread across a broader range of the PCA space) while maintaining structural coherence. This dispersion aligns with the design goal of the reference vector projection layer: it expands the embedding space to enhance inter-cluster separability, a critical prerequisite for effective clustering.
Preference Discrimination Angle Distribution
To quantify the distribution of preference discrimination, we use a 2D ring projection (Figure 3), where points are colored by their angular position (rad) to reflect the distribution spread. For the original embeddings (left), the preference discrimination score is —the points are highly concentrated in a narrow angular range (e.g., red/yellow regions dominate), leading to severe overlap. After projection (right), the preference discrimination score drops to , and points are evenly distributed across all angular regions (covering red, yellow, green, blue, and purple zones). This dispersion ensures that embeddings of distinct clusters occupy non-overlapping subspaces, directly facilitating accurate clustering.
The visualizations in Figure 2 and Figure 3 collectively demonstrate that the reference vector projection layer transforms embeddings from a compact, overlapping distribution to a dispersed and clustering-friendly distribution. By expanding the embedding space and enhancing inter-cluster separability, this layer lays a robust foundation for downstream clustering tasks—addressing the core limitation of original embeddings (poor discriminability) and enabling more accurate and stable cluster assignments.
4.8 Training Stability Analysis
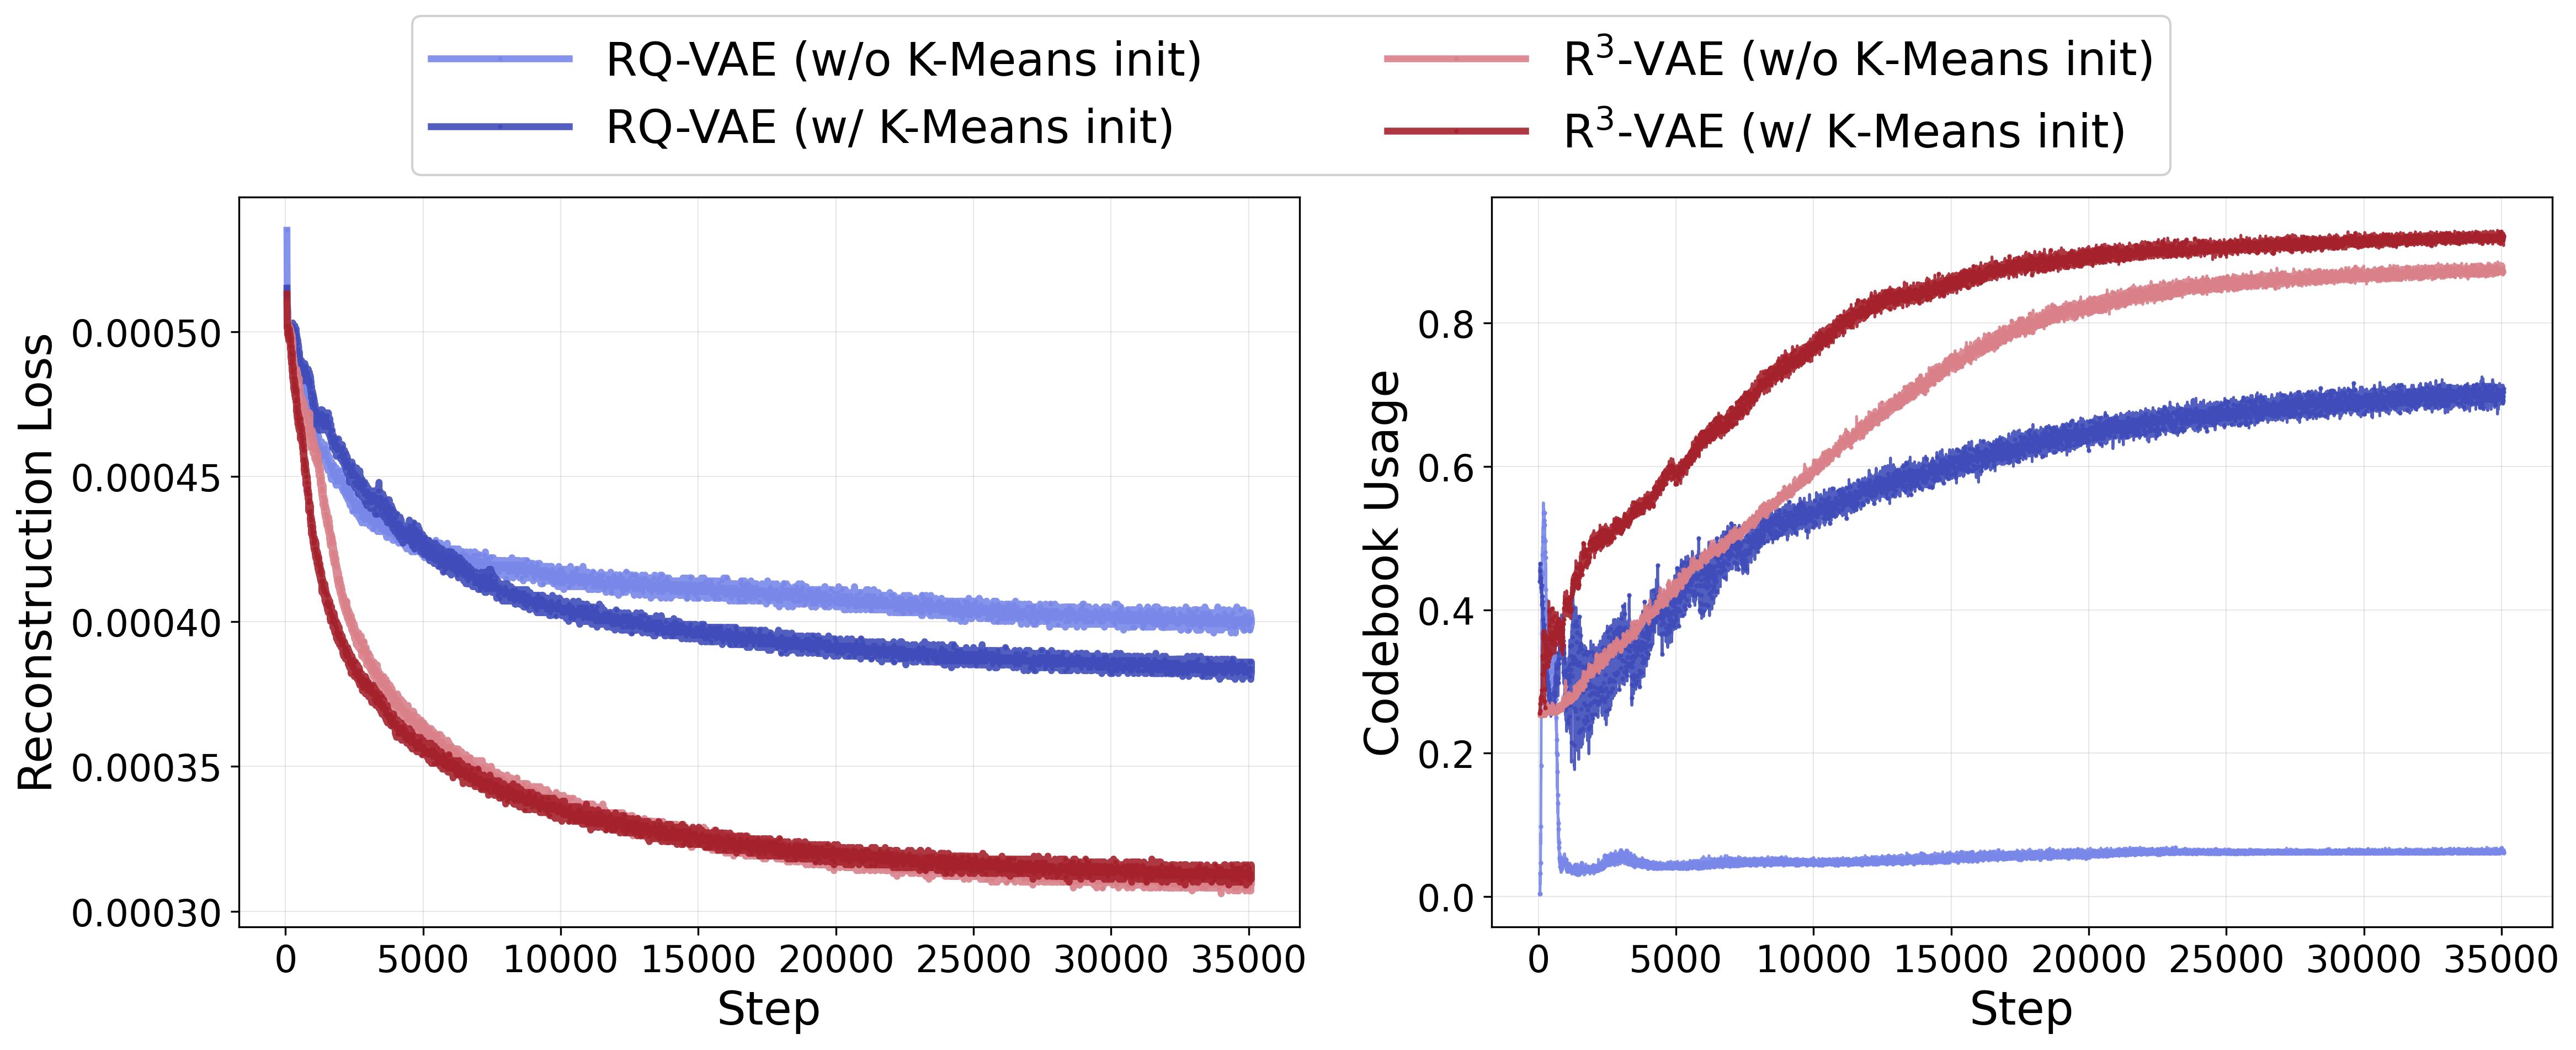
To further validate the training stability of -VAE (a key advantage of its gradient-preserving rating mechanism) and its insensitivity to initialization strategies, we compare the reconstruction loss and codebook usage curves of -VAE and RQ-VAE (with/without K-Means initialization) during training, as shown in Fig. 4.
4.8.1 Reconstruction Loss Behavior
The left subfigure depicts the reconstruction loss curve over training steps. It can be observed that -VAE (both with/without K-Means initialization) shows consistently fast convergence and a tight loss gap between initialization strategies. In contrast, RQ-VAE exhibits a large performance discrepancy between initialization settings. This demonstrates that -VAE’s training process is robust to initialization choices, avoiding the sensitivity that plagues traditional RQ methods. RQ-VAE (even with K-Means initialization) shows higher loss fluctuation and a final loss (0.00038) that is 19% higher than -VAE.
4.8.2 Codebook Usage Behavior
The right subfigure presents the codebook usage (proportion of active codewords) over training steps. -VAE achieves near-full codebook usage (approaching 1.0) after 20,000 steps, and maintains stable usage throughout training. RQ-VAE with K-Means initialization only reaches 0.7 codebook usage, while RQ-VAE without K-Means initialization suffers from severe codebook collapse (usage drops to 0.05 and remains stagnant). -VAE exhibits superior training stability in both loss convergence and codebook utilization, regardless of initialization strategy. This robustness stems from its core innovations (gradient-preserving rating mechanism and reference vector anchoring), which address the training instability bottlenecks of existing VQ-based methods.
5 Conclusion
In this paper, we address two critical limitations of existing Semantic Identifier (SID) generation methods for generative recommendation: training instability caused by inadequate gradient propagation and inefficient SID evaluation that relies on costly downstream validation. We propose a novel framework named Reference Vector-Guided Rating Residual Quantization VAE (-VAE) alongside two SID metrics: Semantic Cohesion and Preference Discrimination. Both metrics exhibit strong correlations with GR performance. Empirical results on six benchmarks demonstrate that -VAE outperforms state-of-the-art methods, achieving an average improvement of 14.5% in Recall@10 and 15.5% in NDCG@10 across three public datasets (Beauty, Sports, and Toys). Experiments of the GR and CTR model on a large-scale industrial dataset from Toutiao further demonstrate that our new method exhibits excellent applicability and business value in real-world industrial recommendation scenarios.
References
- Bradley et al. [2000] Paul S Bradley, Kristin P Bennett, and Ayhan Demiriz. Constrained k-means clustering. Microsoft Research, Redmond, 2000.
- Chen et al. [2025] Jiahui Chen, Xiaoze Jiang, Zhibo Wang, Quanzhi Zhu, Junyao Zhao, Feng Hu, Kang Pan, Ao Xie, Maohua Pei, Zhiheng Qin, et al. Unisearch: Rethinking search system with a unified generative architecture. arXiv preprint, 2025.
- Deng et al. [2025] Jiaxin Deng, Shiyao Wang, Kuo Cai, Lejian Ren, Qigen Hu, Weifeng Ding, Qiang Luo, and Guorui Zhou. Onerec: Unifying retrieve and rank with generative recommender and iterative preference alignment. arXiv preprint, 2025.
- Fu et al. [2025] Kairui Fu, Tao Zhang, Shuwen Xiao, Ziyang Wang, Xinming Zhang, Chenchi Zhang, Yuliang Yan, Junjun Zheng, Yu Li, Zhihong Chen, et al. Forge: Forming semantic identifiers for generative retrieval in industrial datasets. arXiv preprint, 2025.
- Ge et al. [2013] Tiezheng Ge, Kaiming He, Qifa Ke, and Jian Sun. Optimized product quantization. In IEEE TPAMI, 2013.
- Geng et al. [2022] Shijie Geng, Shuchang Liu, Zuohui Fu, Yingqiang Ge, and Yongfeng Zhang. Recommendation as language processing (rlp): A unified pretrain, personalized prompt & predict paradigm (p5). In RecSys, 2022.
- Hou et al. [2023] Yupeng Hou, Zhankui He, Julian McAuley, and Wayne Xin Zhao. Learning vector-quantized item representation for transferable sequential recommenders. In WWW, 2023.
- Hou et al. [2024] Yupeng Hou, Jiacheng Li, Zhankui He, An Yan, Xiusi Chen, and Julian McAuley. Bridging language and items for retrieval and recommendation. arXiv preprint, 2024.
- Hou et al. [2025a] Yupeng Hou, Jiacheng Li, Ashley Shin, Jinsung Jeon, Abhishek Santhanam, Wei Shao, Kaveh Hassani, Ning Yao, and Julian McAuley. Generating long semantic ids in parallel for recommendation. In KDD, 2025a.
- Hou et al. [2025b] Yupeng Hou, An Zhang, Leheng Sheng, Zhengyi Yang, Xiang Wang, Tat-Seng Chua, and Julian McAuley. Generative recommendation models: Progress and directions. In WWW, 2025b.
- Jegou et al. [2010] Herve Jegou, Matthijs Douze, and Cordelia Schmid. Product quantization for nearest neighbor search. TPAMI, 2010.
- Ji et al. [2024] Jianchao Ji, Zelong Li, Shuyuan Xu, Wenyue Hua, Yingqiang Ge, Juntao Tan, and Yongfeng Zhang. Genrec: Large language model for generative recommendation. In ECIR. Springer, 2024.
- Jiang et al. [2025] Hao Jiang, Guoquan Wang, Donglin Zhou, Sheng Yu, Yang Zeng, Wencong Zeng, Kun Gai, and Guorui Zhou. Llm-aligned geographic item tokenization for local-life recommendation. arXiv preprint, 2025.
- Ju et al. [2025] Clark Mingxuan Ju, Liam Collins, Leonardo Neves, Bhuvesh Kumar, Louis Yufeng Wang, Tong Zhao, and Neil Shah. Generative recommendation with semantic ids: A practitioner’s handbook. arXiv preprint, 2025.
- Lee et al. [2022] Doyup Lee, Chiheon Kim, Saehoon Kim, Minsu Cho, and Wook-Shin Han. Autoregressive image generation using residual quantization. In CVPR, 2022.
- Li et al. [2025] Guanghan Li, Xun Zhang, Yufei Zhang, Yifan Yin, Guojun Yin, and Wei Lin. Semantic convergence: Harmonizing recommender systems via two-stage alignment and behavioral semantic tokenization. In AAAI, 2025.
- Lin et al. [2025] Xinyu Lin, Haihan Shi, Wenjie Wang, Fuli Feng, Qifan Wang, See-Kiong Ng, and Tat-Seng Chua. Order-agnostic identifier for large language model-based generative recommendation. In SIGIR, 2025.
- Liu et al. [2025a] Enze Liu, Bowen Zheng, Cheng Ling, Lantao Hu, Han Li, and Wayne Xin Zhao. Generative recommender with end-to-end learnable item tokenization. In SIGIR, 2025a.
- Liu et al. [2025b] Enze Liu, Bowen Zheng, Wayne Xin Zhao, and Ji-Rong Wen. Bridging textual-collaborative gap through semantic codes for sequential recommendation. In KDD, 2025b.
- Liu et al. [2024a] Qijiong Liu, Hengchang Hu, Jiahao Wu, Jieming Zhu, Min-Yen Kan, and Xiao-Ming Wu. Discrete semantic tokenization for deep ctr prediction. In WWW, 2024a.
- Liu et al. [2025c] Zhanyu Liu, Shiyao Wang, Xingmei Wang, Rongzhou Zhang, Jiaxin Deng, Honghui Bao, Jinghao Zhang, Wuchao Li, Pengfei Zheng, Xiangyu Wu, et al. Onerec-think: In-text reasoning for generative recommendation. arXiv preprint, 2025c.
- Liu et al. [2024b] Zihan Liu, Yupeng Hou, and Julian McAuley. Multi-behavior generative recommendation. In CIKM, pages 1575–1585, 2024b.
- Luo et al. [2024] Xinchen Luo, Jiangxia Cao, Tianyu Sun, Jinkai Yu, Rui Huang, Wei Yuan, Hezheng Lin, Yichen Zheng, Shiyao Wang, Qigen Hu, et al. Qarm: Quantitative alignment multi-modal recommendation at kuaishou. arXiv preprint, 2024.
- Ni et al. [2019] Jianmo Ni, Jiacheng Li, and Julian McAuley. Justifying recommendations using distantly-labeled reviews and fine-grained aspects. In EMNLP, 2019.
- Pi et al. [2020] Qi Pi, Guorui Zhou, Yujing Zhang, Zhe Wang, Lejian Ren, Ying Fan, Xiaoqiang Zhu, and Kun Gai. Search-based user interest modeling with lifelong sequential behavior data for click-through rate prediction. In CIKM, 2020.
- Qu et al. [2025] Haohao Qu, Wenqi Fan, Zihuai Zhao, and Qing Li. Tokenrec: Learning to tokenize id for llm-based generative recommendations. In TKDE, 2025.
- Rajput et al. [2023] Shashank Rajput, Nikhil Mehta, Anima Singh, Raghunandan Hulikal Keshavan, Trung Vu, Lukasz Heldt, Lichan Hong, Yi Tay, Vinh Tran, Jonah Samost, et al. Recommender systems with generative retrieval. In NeurIPS, 2023.
- Si et al. [2024] Zihua Si, Zhongxiang Sun, Jiale Chen, Guozhang Chen, Xiaoxue Zang, Kai Zheng, Yang Song, Xiao Zhang, Jun Xu, and Kun Gai. Generative retrieval with semantic tree-structured identifiers and contrastive learning. In SIGIR, 2024.
- Tan et al. [2025] Bin Tan, Wangyao Ge, Yidi Wang, Xin Liu, Jeff Burtoft, Hao Fan, and Hui Wang. Pcr-ca: Parallel codebook representations with contrastive alignment for multiple-category app recommendation. arXiv preprint, 2025.
- Van Den Oord et al. [2017] Aaron Van Den Oord, Oriol Vinyals, et al. Neural discrete representation learning. In NeurIPS, 2017.
- Wang et al. [2025a] Dongsheng Wang, Yuxi Huang, Shen Gao, Yifan Wang, Chengrui Huang, and Shuo Shang. Generative next poi recommendation with semantic id. In KDD, 2025a.
- Wang et al. [2023] Wenjie Wang, Xinyu Lin, Fuli Feng, Xiangnan He, and Tat-Seng Chua. Generative recommendation: Towards next-generation recommender paradigm. arXiv preprint, 2023.
- Wang et al. [2024] Wenjie Wang, Honghui Bao, Xinyu Lin, Jizhi Zhang, Yongqi Li, Fuli Feng, See-Kiong Ng, and Tat-Seng Chua. Learnable item tokenization for generative recommendation. In CIKM, 2024.
- Wang et al. [2025b] Yuhao Wang, Junwei Pan, Xinhang Li, Maolin Wang, Yuan Wang, Yue Liu, Dapeng Liu, Jie Jiang, and Xiangyu Zhao. Empowering large language model for sequential recommendation via multimodal embeddings and semantic ids. In CIKM, 2025b.
- Ye et al. [2025] Wencai Ye, Mingjie Sun, Shaoyun Shi, Peng Wang, Wenjin Wu, and Peng Jiang. Das: Dual-aligned semantic ids empowered industrial recommender system. In CIKM, 2025.
- Zeghidour et al. [2021] Neil Zeghidour, Alejandro Luebs, Ahmed Omran, Jan Skoglund, and Marco Tagliasacchi. Soundstream: An end-to-end neural audio codec. In TASLP, 2021.
- Zhai et al. [2024] Jiaqi Zhai, Lucy Liao, Xing Liu, Yueming Wang, Rui Li, Xuan Cao, Leon Gao, Zhaojie Gong, Fangda Gu, Michael He, et al. Actions speak louder than words: Trillion-parameter sequential transducers for generative recommendations. In ICML, 2024.
- Zheng et al. [2024] Bowen Zheng, Yupeng Hou, Hongyu Lu, Yu Chen, Wayne Xin Zhao, Ming Chen, and Ji-Rong Wen. Adapting large language models by integrating collaborative semantics for recommendation. In ICDE, 2024.
- Zheng et al. [2025] Zuowu Zheng, Ze Wang, Fan Yang, Jiangke Fan, Teng Zhang, Yongkang Wang, and Xingxing Wang. Ega-v2: An end-to-end generative framework for industrial advertising. arXiv preprint, 2025.
- Zhou et al. [2018] Guorui Zhou, Xiaoqiang Zhu, Chenru Song, Ying Fan, Han Zhu, Xiao Ma, Yanghui Yan, Junqi Jin, Han Li, and Kun Gai. Deep interest network for click-through rate prediction. In KDD, 2018.
- Zhu et al. [2025] Jie Zhu, Zhifang Fan, Xiaoxie Zhu, Yuchen Jiang, Hangyu Wang, Xintian Han, Haoran Ding, Xinmin Wang, Wenlin Zhao, Zhen Gong, et al. Rankmixer: Scaling up ranking models in industrial recommenders. In CIKM, 2025.
- Zhu et al. [2024] Jieming Zhu, Mengqun Jin, Qijiong Liu, Zexuan Qiu, Zhenhua Dong, and Xiu Li. Cost: Contrastive quantization based semantic tokenization for generative recommendation. In RecSys, 2024.
6 Contributions and Acknowledgments
Team Toutiao Recommendation
Qiang Wan
Ze Yang
Dawei Yang
Ying Fan
Xin Yan
Siyang Liu
Yicong Liu
Chenwei Zhang
Wei Xu
Jiahao Qin
Ke Wang