High Entropy Alloy under Shock Compression: Optical-Pump X-Ray-Probe
Abstract
High entropy alloys (HEAs) are multi-principal-element alloys designed for tailorable mechanical performance and have been attracting significant engineering interest, yet their fundamental behaviour under extreme dynamic conditions, such as shock loading, remains unexplored. Here, we report laser-shock experiments on two different types of -m-thick HEA microfilms, CuPdAgPtAu and CrFeCoNiCuMo, on -m-thick black-Kapton ablator driven by a high intensity laser pulse (532 nm, 5 ns, 16 J, -mm diameter focal spot) and probed by an X-ray free electron laser (XFEL) pulse (12 keV, 7 fs). Time-resolved X-ray diffraction (XRD) shows the formation of a transient phase with a lattice compression up to of the CuPdAgPtAu HEA along the (111) plane; this transient compressed phase existed for ns. The impedance matching Hugoniot analysis estimated a shock pressure of GPa in the HEA film, while Au- and Fe-based equations of state (EoS) modelling predict 80 GPa (0.8 MBar) at the free HEA surface. The free HEA surface reached maximum velocities of km/s as recorded from in situ monitoring with the velocity interferometry system for any reflector (VISAR) imaging. These initial HEA results show the suitability of HEA sample preparation and XFEL-based XRD characterisation under extreme shock loading, and are promising for experimental determination of the EoS of this emerging class of materials (beamtime proposal No.: 2024A8503 for a 6-hour preliminary experiment).
keywords:
High Entropy Alloy (HEA), Shock compression, black-kapton ablator, X-ray diffraction (XRD), free electron laser (FEL)


1 Introduction
The study of matter under extreme conditions is a frontier of modern science, advancing along with the development of extraordinary infrastructure such as high peak brilliance X-ray free electron lasers (XFELs) [Glenzer_2016, Fukuzawa_2020, Rastogi]. Focusing of a 7 fs 9.1 keV pulse into a 7 nm spot achieves intensities of W/cm2 which take all electrons from a Chromium atom producing Cr24+ state - bare nucleus [NP24]. This formidable result is achieved by a combination of convex and concave reflective Kirkpatrick-Baez (KB) mirrors at the grazing-incident to minimise aberrations which is achieved over m of X-ray optics [Cr24]. Such high intensities can be also achieved at visible or near-IR spectral range by ultra-short pulsed lasers using the optical parametric chirped pulse amplification (OPCPA) [Dubietis]. Terawatt ( W) class lasers have tens-of-mJ pulse energy at fs duration and even higher Petawatt pulse powers are achievable by thin thermoplastic film post-compression technique [Mou22].
Lasers of Joule-level energies with pulse duration of tens-of-femtoseconds have higher repetition rates and deliver intensities up to W/cm2 per pulse, when focused on a cylindrical wire delivering a converging 9-fold compression at the wire’s axis reaching 800 Mbar pressure as were probed with femtosecond XFEL pulses [Laso]. These conditions are relevant to astrophysical phenomena and warm dense matter (WDM) research [wdm].
It soon will become possible to produce practical 1 kHz and n/s neutron laser-based sources using high-intensity ultra-short pulses as demonstrated in the proof of the concept experiments at a scaled-down version with 1 Hz repetition rate 12 fs, 21 mJ pulses focused to m diameter and reaching W/cm2 intensity [Osvay]. This opens widely anticipated possibilities of nuclear transmutation of chemical elements and isotopes with unprecedented flexibility and versatility. For example, the currently used neutron activation of Si in nuclear reactors, can be achieved with simpler setups, i.e., n-type doping of Si by Phosphorus in a pure Si (a perfect lattice) is achieved via Si + n Si + P + (electron). Once relativistic intensities are reached above W/cm2, neutron production yield scales as as demonstrated using 1.5 ps 900 J pulses [Yogo]. Ultra-fast laser-driven MeV electron and neutron sources is a fast emerging field [Gunter]. The long-time aim to harness laser-driven fusion is also getting closer as the Lawson criterion for ignition was recently exceeded in a laser-driven inertial fusion experiment [Sun].
The creation of a high pressure with ultra-fast thermal quenching using fs-laser pulses opens a new synthesis pathway to new materials and phases, including metastable which can be retrieved to the ambient conditions [06prl166101]. Open-packed incommensurate host-guest (same or impurity atoms) structures are formed at high pressure, e.g., for Ba at 10 GPa [Nelmes]. A twofold role of guest atoms is manifested: 1) allowing for the formation of diverse structures having multiple enthalpy minima at a certain pressure, 2) enhancing the high-pressure phase stability, e.g., by implantation of guest atoms N, O. Aluminium forms the host-guest incommensurate structure at 3.2 TPa [Pickard, McM]. High-pressure Si phases were observed under ultra-relativistic W/cm2 intensity using fs pulses for irradiation of Si and generation energetic MeV electrons which contributed to the strong back-side ablation of mm wafer [24prr023101].
Interaction of ultra-short laser pulses of high intensity with high entropy alloys (HEA) is the active focus area due to the promise of superior mechanical properties of HEAs at extreme conditions [ZHANG20221, 1, 3].
Analysis of data from 2024A8503 SACLA beamtime is presented here. We used high entropy alloys (HEAs) on black Kapton ablator shocked with optical pump beam 532 nm wavelength, ns pulse duration focused onto m (at FWHM) diameter top-hat spot; the beam was formed using a diffractive optical element (DOE). Pulse energy was J, which corresponded to the fluence kJ/cm2 and the average intensity TW/cm2 on the black Kapton surface. Typical shock travel time through the black Kapton (polyimide) to reach the HEA film was ns. A time-delayed X-ray pulse of XFEL 12 keV/7 fs ( photons/pulse; 400 J) was probing the shock-affected region on a 1-m-thick HEA film with an elliptical focus of cross-sections m2. Single laser pulse was used for modification, which was probed at a few different delays by XFEL pulse. X-ray diffraction (XRD) was detected in transmission geometry (Fig. 1(a)). Two VISAR systems monitored the top surface of the HEA film and provided a time-resolved velocity measurement based on laser interferometry. Two VISAR systems were allowed to properly calibrate the temporal-spatial response of the surface to the applied shock. Technical capabilities of the used SACLA beamline can be found elsewhere [BL3].
2 Experimental: materials, methods, conditions
2.1 High Entropy Alloy (HEA)
High entropy alloys (HEAs) are new alloy materials that were theorized [Tsai03] then realized [13] around the early 2000s. Unlike traditional alloys, HEAs are composed of five or more primary elements, each with atomic concentrations ranging from 5% to 35% [13, 14]. The elements used are usually 3d transition metals similar atomic size that leads to the tendency to form a solid solution when the configuration entropy is met. HEAs are versatile due to their potential combinations. This opens the door for a wide range of applications such as hydrogen storage [4, 5], biomaterials [2], functional coatings [10, 6, 7], nuclear applications [9, 8], and more. With the potential of applying HEAs under harsh environments, it is important to understand the metamorphism of such materials under extreme conditions. Two different HEAs are selected for this experiment, CuPdAgPtAu (Au-HEA) and CrFeCoNiCuMo (Fe-HEA), due to their unit cell structures, range of lattice parameter differences between the constituent elements, and atomic size differences between the constituent elements. The measured lattice parameters of Au-HEA’s constituent metals, determined with Cu- 8.04 keV/1.54056Å line [auhea], are 4.08Å (Au, fcc), 4.09Å (Ag, fcc), 3.62Å (Cu, fcc), 3.89Å (Pd, fcc), and 3.90Å (Pt, fcc); and 2.51Å (Co, hexagonal structure(hex)), 2.88Å (Cr, body-centre cubic(bcc)), 2.87Å (Fe, bcc), 3.52Å (Ni, fcc), and 3.15Å (Mo, bcc) for Fe-HEA [Hermann_2011]. Both alloys have face-centered cubic (FCC) structure, with a theoretically predicted lattice parameter of Å [Miracle_2017] for Au-HEA and Å [Miracle_2017] for Fe-HEA (3.59Å for CrFeCoNiCuMo), the theoretical parameters are calculated using the rule-of-mixtures approach , where is each constituent element, is the radius of each constituent metals and the lattice parameter is calculated base on the FCC crystal structure, . The atomic radius for each constituent metals are 144.2 pm (Au) 144.47 pm (Ag) 127.8 pm (Cu), 138.7 pm (Pt), and 137.54 pm (Pd), the atomic sizes distributed evenly with a maximum difference of 16.67 pm for Au-HEA. In the case of Fe-HEA, the atomic size are not as evenly distributed, 125.10 pm (Co), 124.91 pm (Cr), 124.12 pm (Fe), 124.59 pm (Ni), and 136.26 pm (Mo), with only Mo being noticeably larger and a maximum difference of 12.14 pm for Fe-HEA [Miracle_2017]. Base on the rule-of-mixtures approach, theoretical melting temperature can also be calculated with , where is each constituent element, is the molar composition of each constituent metals, and is the melting point for the corresponding metals. The estimated melting point for Au-HEA is 1559.8K and 1985.55K for Fe-HEA.
The atomic weight for Au-HEA is estimated to be 133.98 g/mol [DeLaeter_2003] and the mass density is calculated to be 14.79 g/cm3 base on where is the number of atoms per unit cell, is the molar mass in g/mol, is Avogadro’s number, and is the volume of the unit cell which equals to for the FCC structure. Fe-HEA’s atomic weight is estimated to be 60.77 g/mol [DeLaeter_2003] (CrFeCoNiCuMo has the atomic weight of 64.14 g/mol) and the mass density is calculated to be 8.97 g/cm. Thermal diffusivity of Fe-HEA was directly measured by Temperature Wave Analysis (TWA) [Morikawa] m2/s. For the typical shock wave velocity of km/s in experiments for the m thickness of Fe-HEA, the heat diffusion length is negligible nm.
2.2 Sample Deposition
The Fe-HEA coupon was produced at FORTIS (Joining and Surface Technology) in Witten, Germany, via cold spray deposition onto copper sputter targets at 38 bar using a CGT Kinetics 4000/34.
Both types of HEAs described above are used separately for the preparation of five different samples with physical vapour deposition method (PVD) or electron beam deposition method (e-beam, AXXIS, Kurt J. Lesker company, Jefferson Hills, PA, USA) onto a 25m thin Kapton B polyimide film (DuPont, Wilmington, DE, USA). They were CuAgAu and PtPd high entropy alloy (HEA) targets co-sputtered by PVD to form m of Au-HEA; the targets were purchased from Tanaka Precious Metal Co., Ltd., Japan. Similarly, a m of CrFeCoNiCuMo (Fe-HEA) was sputtered by PVD. Furthermore, another set of m of CrFeCoNiCuMo HEA was sputtered with PVD with an additional m layer of Aluminium oxide (AlOx) deposited with e-beam for some samples to reduce shock as well as optical reflectance. The deposition rate of CuPdAgPtAu HEA (Au-HEA) is estimated to be 0.1865 m/min/W (m/min for the used 40 W) from target-1 CuAgAu and 0.1284 m/min/W (5.13 m/min at 40 W) from target-2 PdPt; Ar gas flow was at 20 sccm. The rotation speed of the sample during sputtering was 660 rpm. The deposition rate of CrFeCoNiCuMo HEA (Fe-HEA) and AlOx were 6 nm/min. All samples underwent extreme shock compression by 16 J laser pulses. The high-speed dynamics of their crystalline structure transformation were monitored with X-ray Free Electron Laser (XFEL) at various delay times from the shock wave generation.
2.3 SPring-8 Angstrom Compact free electron LAser (SACLA) beamline BL3
The experiment was performed at the hard X-ray beamline in SACLA [sacla] Japan (BL3) [BL3] which is used for analysis of phase transitions under shock compression: cavitation melting [Liquid], olivine-ringwoodite transformation at GPa (corresponding to 660 km inside Earth) [olivine], stishovite at 300 GPa [acoustic]. The samples, m thick Au-HEA or Fe-HEA on a 25 m thick black Kapton polyimide film prepared as Sec. 2.2 has described, were shocked with a pump laser (532 nm, 5 ns, 16 J) focused to a mm diameter spot on the back side of the black Kapton film. The probing X-ray free electron laser (XFEL) beam, set at after the pump laser, was at 12 keV with a mean pulse energy of 370 J/pulse (number of photons ), and pulse duration of 7 fs (2.1 m in space). The number density of photons in the focal region assumed as a cylinder 2.1 m long and with a base of 15 m in radius is photons/cm3 (photons per area photons/cm2). As an estimate, X-ray fluence considering m radius of the focal spot was J/cm2 and intensity PW/cm2. The X-ray beam sizes at the sample position were measured by the knife (wire) edge scanning. The horizontal (x-axis) diameter m ( standard deviation) at FWHM and vertical m without considering the projection angle of . Considering sample inclination, the vertical size on the surface (a projection) becomes larger m. X-ray polarization was in the horizontal p-pol.
2.4 X-ray Diffraction - XRD
A flat panel detector (FPD) was used for direct digital radiography of 2D XRD. Shock compression causes a peak shift/splitting by an internal stress or planar faults, especially stacking faults or twinning. The peak broadening is related to the size of crystallites and micro-stresses. Also, the stress gradients and/or chemical heterogeneities can cause peak broadening. Similarly, the peak asymmetries can be caused by long-range internal stresses, planar faults or chemical heterogeneity [DEVINCENTIS, cryst8]. Moreover, an anisotropic peak broadening can result from an anisotropic crystallite shape or anisotropic strain [11].
XRD intensity in Fig. 4(b) was obtained by azimuthal integration of FPD detector using standard procedure by the program heXRD [Boyce_2013, avery_2024]. In order to compare XRD data measured with different sources, a Q-spacing presentation was selected to display XRD data, see Fig. 4(b). The scattering vector is calculated using X-ray wavelength and diffraction the angle ; the Bragg spacing , where is an integer number. was used for calibration of diffraction angle. The Pawley method, which does not require prior knowledge of the structure, was used for XRD data analysis [Pawley].


2.5 Velocity Interferometry System for Any Reflector - VISAR
Surface reflection from the HEA side was analysed using the imaging velocity interferometry system for any reflector (VISAR) [visar] (Fig. 1(a)); wavelength of illumination was 532 nm. One dimensional Fourier transform was performed along the space direction (horizontal direction of the image from streak camera in Fig. 1(a)) at each time step, and the spectrum in a limited frequency window is used for the inverse Fourier transform to extract the phase information of the fringes. The extracted phase is unwrapped by detecting the phase shift in the phase profile.
Two interferometer systems having different sensitivity were monitoring the surface motion of HEA in parallel to extend the dynamic range of the velocity detection. The sensitivities of the VISAR1 streak camera was 5.419 km/s and VISAR2 2.894 km/s depending on the etalon thickness of the interferometer. In a case of Doppler shift of free surface in a vacuum condition, the velocity per fringe (VPF) can be written as: , where is the wavelength of the light for VISAR system, is the time delay in the etalon, and defines the dispersion in the etalon. The can be derived from the geometry of the etalon as: , where is the speed of light, is the refractive index of the etalon, and is its thickness.
Analysis of the interferograms was carried out using a Matlab code with appropriate velocity per fringe (VPF) calibration values to change phase (image) to velocity. The interferometric data was taken with and without the shock wave application for each measurement and former data was used as the background phase.
2.6 Modelling of shock conditions
Modelling of shock propagation in black Kapton (polyimide) was numerically modelled using the MULTI software package [mult, mult2]. HEA films were m-thick; see Figs. A1 and A2.
In experiments, the strongest modification of the XRD peaks occurred ns after the laser pulse, which was irradiated into the 25 m-thick black Kapton. The speed of shock wave is estimated km/s; see experimental Kapton shock wave data [rus] in Fig. A4, The pressure estimated (see Sec. 4.1) from the impedance matching Hugoniot analysis was at GPa. It constitutes a fraction from the Young modulus predicted from the first principles for similar materials as investigated in this study, e.g., GPa for CoCrFeCuNi [ZHANG2022104059].
3 Results
3.1 XRD
The results from flat panel detector are analysed in Figs. 3 and 4 for CuPdAgPtAu HEA(Au-HEA) and CrFeCoNiCuMo HEA(Fe-HEA), respectively. Only the face-centered cubic (FCC) phase is observed in both cases. For Au-HEA, lattice planes (111), (200), and (220) show a peak splitting when the time delay between the pump and the probe is 4.0 ns. Unlike Au-HEA, Fe-HEA did not show peak splitting, and the peaks for (111) and (200) have full width at half maximum (FWHM) 0.2 Å-1 and overlap with each other. This could indicate dislocation of the lattice structure at smaller angles [12] or a smaller crystallite structure is formed for Fe-HEA than Au-HEA [11]. The peak broadening is observed when 4.2 ns in both cases and shifts toward the larger angles (larger ) with increasing . The maximum compression of Au-HEA estimated from the (111) plane from 3.9Å to 3.7Å corresponds to change.
3.1.1 XRD of AgAuCuPdPt under high pressure
High-entropy alloys (HEAs) are known for their exceptional structural stability under applied stress, owing to sluggish atomic diffusion and nanoscale lattice distortions. These properties result in high strength and ductility, making HEAs well-suited for demanding applications [Tsai03]. Despite this stability, HEAs may still undergo various nanostructural changes under uniaxial pressure, including phase transitions, lattice parameter shifts, amorphization, and dislocation generation. The structural evolution of the AgAuCuPdPt HEA under shock compression is presented in Fig. 3(b). Prior to compression, the CuPdAgPtAu (Au-HEA) exhibits a face-centered cubic (fcc) crystal structure with a lattice parameter of Å, as confirmed by peak fitting using the Pawley method. The nature of shock-induced structural evolution depends on the magnitude of the applied stress. If the material is compressed within the elastic regime, the changes are expected to be reversible. However, stresses exceeding the elastic limit can lead to irreversible deformation and permanent micro-structural modifications.
The high-pressure compressed AgAuCuPdPt HEA exhibits two trends: compression of initial phase and formation of a transient phase. During the initial phase of compression, up to 4.0 ns, the lattice parameter remains unchanged, and the XRD pattern shows a single set of Bragg peaks corresponding to the original cubic fcc structure with a lattice parameter of Å. At 4.0 ns, a second set of Bragg peaks emerges in the XRD data, indicating the formation of a new cubic fcc phase with a smaller lattice parameter of Å. From this point onward, two distinct cubic fcc phases coexist: the original phase with Å and the newly formed phase with Å. The evolution of these lattice parameters under shock compression is shown in Fig. 3.
Following the peak splitting observed at 4.0 ns, the lattice parameter of the original phase starts to decrease, reaching Å at 4.6 ns. In contrast, the newly formed phase, which appears at 4.0 ns with a smaller lattice parameter of Å, shows a trend of increasing period. Its lattice parameter expands over time and eventually converges with that of the original phase Å at 4.6 ns. This convergence suggests a re-merging of the two phases or structural homogenization into a new, more compressed state (see discussion in Sec. 4).

3.2 VISAR
VISAR data analysis (Fig. 5) shows that shock velocity was larger in Fe-HEA samples as compared with the Fe-HEA coated with AlOx. Also, shock velocity in Au-HEA was larger as compared with the annealed Au-HEA. The shock speed in the black Kapton substrate was in between those for Fe-HEA (larger) and Au-HEA (smaller). For the VISAR2 analysis, a phase shift had to be added at the starting point of shock wave launch where non-physical negative velocities are obtained following an established procedure [shift]. The skipped fringes in the interferogram occur where the phase changes more rapidly than the response time of the streak camera. This blind spot/time results in a loss of fringe visibility and continuity while the actual phase may change more than by the one fringe cycle. With this correction of VISAR2 data, comparable velocities between the two cameras were obtained and shown in Fig. 6; the VISAR fringe analysis was carried out at a single pixel resolution. The final free-surface velocity of the front surface of HEA reached 4.5-5 km/s.
The shock velocity can be estimated using the Hugoniot relation , which defines a densification of Kapton at such conditions (see Fig. A4 for polyimide data). The shock pressure estimate in Kapton is GPa ( g/cm3, km/s, km/s, ). The shock pressure traversed into Au and projected onto its free surface as measured by VISAR is discussed next using the shock impedance matching (IM) method [Damien, acoustic].
4 Discussion
Formation of transient high-density phase is discussed next. Working hypothesis is: i) formation of a meta-stable phase of HEA (Fig. 3(c); Sec. 4.2) occurring together with ii) elastic compression at early interaction times. The density increase by due to high pressure compression was experimentally observed by XRD. The Young modulus of HEAs is about 220 GPa and the cubic phase with the lattice constant of Å was observed. If it is due to an elastic deformation of the original HEA lattice by , the required stress follows from the Hooke’s law : GPa GPa. However, the compressed phase showed expansion, while the initial HEA underwent compression in 3.5-4.5 nm time window. The length of 7 fs (2.1 m in free space) X-ray pulse is comparable with the HEA film’s (tilted) thickness (Fig. 3(a)). It “reads” (by diffraction) the actual state of HEA from 30 m radius and 1 m long (thickness of HEA film) cylindrical volume. At the very early times, that volume has region not affected by pressure wave, which later is compressed. Formation of meta-stable phase is postulated due to possible interplay between entropy and enthalpy terms in the Gibbs energy (Sec. 4.2). This phase is expanding (due to heating) after initial spontaneous formation (Fig. 3(d)). While the initial HEA undergoes compaction, the meta-stable component is expanding and their lattice periods converging up to the 4.6 ns time, which was the limit in these preliminary beamline-trial experiments.
Analysis of pressure evolution at the implemented conditions is presented next considering pressure transition through the interfaces [Damien1]. This is standard approach for the bulk samples ( mm thickness).
4.1 Hugoniot analysis
The standard pressure-velocity analysis for polymer-metal target is applied (see Fig. 9(a)), where EoS of Au [Zhiguo] and polymer (polystyrene and polypropylene) [Damien] were used. For Au [Zhiguo]: , with g/cm3 and for polymer [Damien]: and g/cm3; here [km/s]. Figure 9 shows graphical procedure of acoustic impedance matching (IM) in plot for EoS which are qualitatively approximate to those of Au-HEA and black Kapton used in experiments. The experimentally observed shock transit time through a 25 m thick Kapton was ns. This defines shock velocity km/s in Kapton and particle velocity km using EoS above (Fig. 9(b)). For this value, the IM method was applied to determine the pressure upon entrance into Au, which reads 55 GPa. The reflection unloading from free-surface of Au is expected to produce km/s, which is half of the surface velocity measured by VISAR behind the pressure front [acoustic, Damien], i.e. the expected VISAR measured velocity is km/s. However, the VISAR velocity of Au-HEA was 4-4.6 km/s (Figs. 5,6), which is considerably higher than the expected value from IM analysis. A possible explanation is due to a very thin 1 m thickness of the film, which only partly contributes to the measured VISAR signal at earliest stages of the movement onset where km/s (Fig. 5). At later stage (8-10 ns; Figs. 5) the VISAR signal is dominated with Kapton contribution when approaching maximum saturated VISAR velocities. Indeed, for Kapton km (Fig. 9(b)) is closer to the experimental km/s as compared to the gold’s impedance matching prediction km/s (Fig. 9(a)).
The discussion above has a qualitative nature since EoS of Au and polymer were used, which are expected to be slightly different from those of Au-HEA and Kapton. One can expect that the pressure in Au-HEA was close to GPa. It is noteworthy, the presented analysis was only qualitative and the pressure velocity and VISAR data were not matching. This can be caused by thin m HEA film, while the method is known to work quantitatively for the m thick polished samples [Lin_2025, Parsons_2026]. Moreover, the min-max roughness of the HEA film was of the thickness due to non-flat surface of black-Kapton (see schematics in Fig. 3(a)). The roughness is expected to contribute to a higher uncertainty in pressure transition/reflection from interfaces, especially for thin micro-films [Karzova].

4.2 Transient phase of HEA
We propose that the observed and unexpected peak splitting (Fig. 3) indicates that, under a high pressurecompression, the initial Au-HEA phase temporarily evolves into two distinct HEA phases that coexist for a brief period of approximately 0.6 ns. These include the original phase with a larger lattice parameter and a newly formed intermediate phase, which appears to be highly metastable and disappears shortly after the pressure is removed. The formation of this metastable phase can be rationalized in terms of thermodynamic phase stability under non-equilibrium conditions.
The single-phase AgAuCuPdPt high-entropy alloy solid solution forms as a result of a negative Gibbs free energy of mixing Gsol, which is enabled by the high configurational entropy Ssol associated with its multi-component nature. This relationship is governed by the thermodynamic equation:
| (1) |
where Gsol is the Gibbs free energy change of the solution (in this case, the AgAuCuPdPt HEA), Hsol is the enthalpy of mixing, T is the absolute temperature, and Ssol is the configurational entropy. The increase in entropy, Ssol, helps suppress the formation of competing intermetallic compounds (e.g., A+B, B+C, A+C, etc.) and instead promotes the stabilization of a single-phase random solid solution, ABCDE-solution [rev, Taiwan].
The tendency for solid solution formation in multi-component alloys can be quantified using the parameter , defined as:
| (2) |
When > 1, the formation of a random solid solution is thermodynamically favored over the formation of intermetallic phases. The stability of a solid solution, such as the AgAuCuPdPt, can be disrupted by changes in the enthalpy of mixing, Hsol. The general expression for the change in enthalpy is:
| (3) |
where Usol is the change in internal energy, is the pressure, is the volume, and represents the pressure-volume work. Although heat input, , can also affect the system’s energy, in shock compression scenarios, the dominant contributions typically arise from changes in internal energy and volume due to the sudden application of the high pressure.
Under ambient conditions, the AgAuCuPdPt satisfies the criterion , indicating that the entropy term dominates over , thus favoring a stable single-phase solid solution. However, under dynamic conditions such as high pressure compression, this balance may shift. The rapid increase in pressure and resulting compression of the lattice can significantly raise , potentially lowering below 1. As a result, the thermodynamic driving force for single-phase stability may be lost, and the material can become metastable or unstable, allowing for the nucleation of new intermediate phases.
X-ray diffraction analysis reveals that the lattice parameter of the AgAuCuPdPt decreases under compression, indicating a rapid structural response to the applied stress. At 4.0 ns after the onset of the high pressure, the diffraction pattern shows the emergence of a second set of peaks, signifying the coexistence of two distinct phases. This observation suggests that the pressure-induced compression not only reduces the unit cell volume of the original phase but also drives the formation of a new, transient or metastable phase. The resulting peak splitting provides direct evidence of this structural transformation, likely triggered by the destabilization of the single-phase solid solution as the enthalpy of mixing Hsol increases under extreme loading conditions.
The time evolution of this transient phase requires experimental observation by XRD over a longer time span as well as theoretical predictions of composition to be experimentally verified in future experiments.
4.3 HEA-ablation pressure, velocity at the critical surface of Kapton
Let us estimate laser ablation conditions for the pulse energy J, focal spot size area cm2 for the laser wavelength of nm at the average intensity W/cm2; the cyclic frequency s-1 defines the critical density cm-3. Kapton (containing atoms C, O, N, H) has an average ion mass, g (the mass number , taken arbitrarily ). The critical mass density (assuming single ionisation per atom) then is g/cm3.
Absorption in ns regime occurs in the vicinity of the critical density. Assuming high absorption, fast energy equilibration of electrons and ions and quasi-stationarity the laser energy flow (intensity) transforms into energy flow of heated ions: , here is the velocity of ions. Taking the above numbers, one gets cm/s. The pressure at the critical surface driving heat wave gradually transformed into the shock wave then estimates as erg/cm GPa 3 Mbar.
The pressure at the shock wave front propagating through the Kapton gradually decreases due to the dissipation, energy losses on ablation and on expansion. These losses are easily taken even from 1D hydrodynamic code. Hence pressure at the shock wave front entering HEA is much smaller. Ways to improve the estimates: account for absorption coefficient , ionisation rate (might be more than one), average ion’s mass. The 16 J per pulse is a huge energy, which is a few times larger than necessary for ablation of the whole Kapton in the focal volume.
The pressure at the shock wave front propagating through the Kapton gradually decreases due to the heat conduction perpendicular to the laser beam direction (small), ionisation, bond breaking, energy losses on expansion. The volume of Kapton m contains cm atoms. Sum of losses per atom is , here the cohesion energy eV/atom, ionisation eV/atom, expansion eV/atom, i.e., eV/atom. Energy spent for the ablation of Kapton volume affected by laser equals to J. Therefore, at the used energy of 16 J, the Kapton should be burned through.
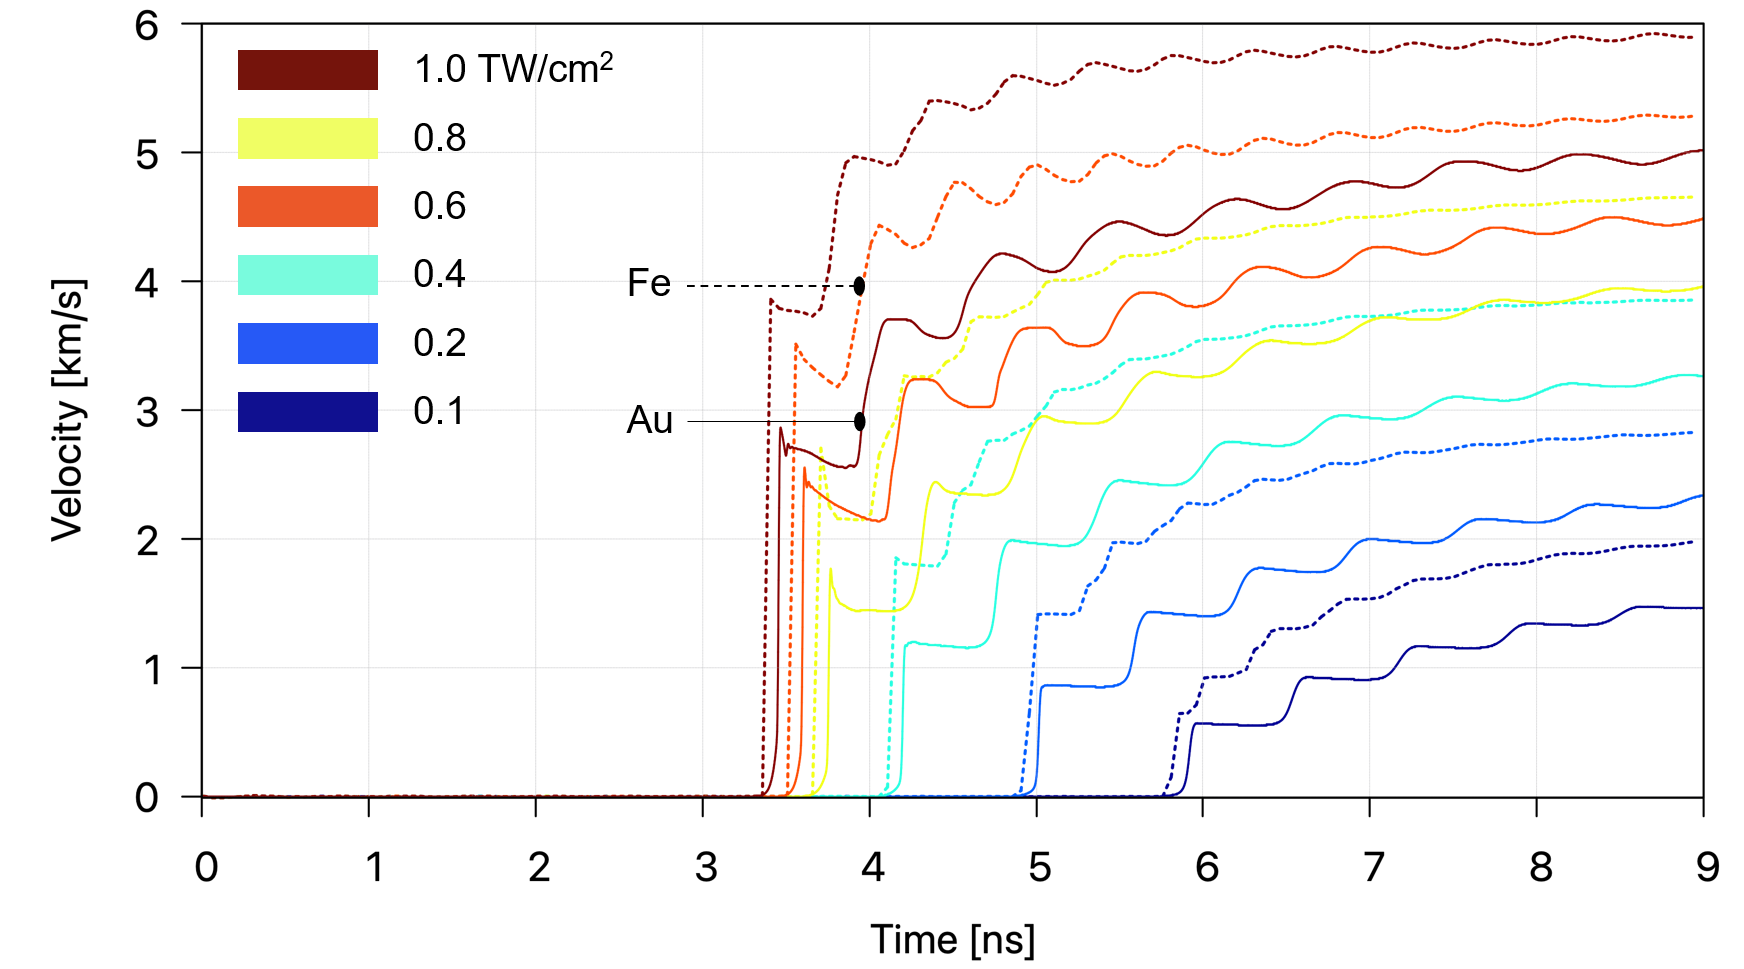
Figure 7 shows modelling results for the shock pressure evolution in Au and Fe (using their known EoS) at three laser intensities at the ablator surface [mult, mult2]. Figure 8 summarises the free-surface velocity from the pressure model. Such velocity transients are numerical predictions for the experimental VISAR results. At 1 TW/cm2 intensity, the maximum shock pressure of 100-120 GPa ( Mbar) is theoretically predicted in Fe and Au. The IM analysis of shock pressure in Au predicts an approximately twice lower pressure at km/s when experimental conditions with Au-HEA were applied (Fig. 9(a)).
5 Conclusions and Outlook
Formation of a transient phase of FCC lattice in Au-HEA was detected at GPa within short 4-4.2 ns time window after laser-induced shock in black-Kapton ablator of 25 m thickness using XFEL SACLA BL3 beamline. The meta-stable (transient) “X”-phase is hypothesised based on an increase of (due to pressure; Eqn. 3), resulting in to increase as well. It is probable that for some composition “X” the condition is no longer satisfied for HEAABCDE at high pressures. After the pressure is removed, the condition is restored. The intermediate phase is stable as long as pressure is applied.
The shock-compression conditions were analysed using Hugonoit impedance matching, numerical ab initio modelling with EoS of related materials, and analytical ablation pressure estimates for the theoretically achievable highest pressures.
This hypothesis of transient “X” phase will be further explored with a higher temporal resolution and over longer time span. In the current introductory (6 hours) beamline experiment, longer delay times were not tested and are planned for the full proposal. Further improvements of thin-film HEA samples via surface polishing of Kapton and/or in situ imidisation of mirror-flat kapton precursor resist is planned to achieve a few-nm min-max roughness. This is expected to develop methodology when the impedance matching Hugonoit analysis will become quantitative even for few-micrometer thick HEA films. Such technique would become highly valuable for characterisation of fast expanding family of HEAs subjected to high pressures.
Acknowledgements
We acknowledge the technical support of the BL3 team during the 2024A8503 SACLA beamtime proposal on 21 April 2024. SJ is grateful for support via the Australian Research Council Discovery DP240103231 grant. JM acknowledges support via JST CREST (Grant No. JPMJCR19I3) and KAKENHI (No.22H02137). MR was supported via KAKENHI (Grant No. 22K14200) and SAKIGAKE (Grant No. JPMJPR250E). This work was the result of using research equipment shared in MEXT Project for promoting public utilization of advanced research infrastructure (Program for Advanced Research Equipment Platforms, Grant No. JPMXS0450300324). We are grateful to Takeshi Matsuoka for discussion of shock wave experiments and the Australia-Germany collaboration grant UA-DAAD 57652710.
References
- [1] (2016-12) Mechanical Properties of High Entropy Alloy Al0.1CoCrFeNi for Peripheral Vascular Stent Application. Cardiovascular Engineering and Technology 7 (4), pp. 448–454 (en). Note: Number: 4 External Links: ISSN 1869-408X, 1869-4098, Link, Document Cited by: §1.
- [2] (2021-04) An Overview of High-Entropy Alloys as Biomaterials. Metals 11 (4), pp. 648 (en). Note: Number: 4 External Links: ISSN 2075-4701, Link, Document Cited by: §2.1.
- [3] (2022-02) Microstructure and Mechanical Properties of Co32Cr28Ni32.94Al4.06Ti3 High-Entropy Alloy. Materials 15 (4), pp. 1444 (en). Note: Number: 4 External Links: ISSN 1996-1944, Link, Document Cited by: §1.
- [4] (2010-09) Hydrogen storage properties of multi-principal-component CoFeMnTixVyZrz alloys. International Journal of Hydrogen Energy 35 (17), pp. 9046–9059 (en). Note: Number: 17 External Links: ISSN 03603199, Link, Document Cited by: §2.1.
- [5] (2013-09) Structure and hydrogen storage properties of a high entropy ZrTiVCrFeNi alloy synthesized using Laser Engineered Net Shaping (LENS). International Journal of Hydrogen Energy 38 (27), pp. 12180–12189 (en). Note: Number: 27 External Links: ISSN 03603199, Link, Document Cited by: §2.1.
- [6] (2019-08) A Review on High Entropy Alloys Coatings: Fabrication Processes and Property Assessment. Advanced Engineering Materials 21 (8), pp. 1900343 (en). Note: Number: 8 External Links: ISSN 1438-1656, 1527-2648, Link, Document Cited by: §2.1.
- [7] (2020-06) Thermal Spray High-Entropy Alloy Coatings: A Review. Journal of Thermal Spray Technology 29 (5), pp. 857–893 (en). Note: Number: 5 External Links: ISSN 1059-9630, 1544-1016, Link, Document Cited by: §2.1.
- [8] (2021-01) High-Entropy Alloys for Advanced Nuclear Applications. Entropy 23 (1), pp. 98 (en). Note: Number: 1 External Links: ISSN 1099-4300, Link, Document Cited by: §2.1.
- [9] (2021-06) Current development of body-centered cubic high-entropy alloys for nuclear applications. Tungsten 3 (2), pp. 197–217 (en). Note: Number: 2 External Links: ISSN 2661-8028, 2661-8036, Link, Document Cited by: §2.1.
- [10] (2014-07) High-Entropy Alloys: A Critical Review. Materials Research Letters 2 (3), pp. 107–123 (en). Note: Number: 3 External Links: ISSN 2166-3831, Link, Document Cited by: §2.1.
- [11] (2003-05) The Meaning of Size Obtained from Broadened X‐ray Diffraction Peaks. Advanced Engineering Materials 5 (5), pp. 323–329 (en). External Links: ISSN 1438-1656, 1527-2648, Link, Document Cited by: §2.4, §3.1.
- [12] (2004-10) Microstructural parameters from X-ray diffraction peak broadening. Scripta Materialia 51 (8), pp. 777–781 (en). External Links: ISSN 13596462, Link, Document Cited by: §3.1.
- [13] (2004-05) Nanostructured High-Entropy Alloys with Multiple Principal Elements: Novel Alloy Design Concepts and Outcomes. Advanced Engineering Materials 6 (5), pp. 299–303. Note: Number: 5 Publisher: John Wiley & Sons, Ltd External Links: ISSN 1438-1656, Link, Document Cited by: §2.1.
- [14] (2007) High-Entropy Alloys – A New Era of Exploitation. Materials Science Forum. 560, pp. 1–90. Cited by: §2.1.
6 Appendix
Direct momentum transfer from light to black Kapton is negligible since the radiation pressure is GPa for TW/cm2 pulse irradiance, while the maximum intensity was below 2 TW/cm2; is the speed of light.
It is possible to estimate the pressure arriving onto the HEA film from the VISAR1 data (Fig. 5). A formidable acceleration of m/s2 is estimated at the onset of surface movement. The mass density of Fe-HEA is g/cm3 for the equal sum of five constituent metals. The underestimated value, we consider the pressure wave is impacting the same m diameter Fe-HEA disk of 1 m thickness as on the surface of black Kapton ablator, i.e., the mass of the Fe-HEA disk ng. This yields in the force kN, which exerts the pressure of GPa. This can only serve as an estimate since the shock is concentrated on a slightly reduced m diameter (Fig. A3(b)). This estimate is qualitatively consistent with discussion in Sec. 4. We assume that there was no shock induced melting of HEA, which takes place when pressure reach close to the Young modulus of material, e.g., discussed in a similar experiment for gold [Briggs2019].


6.1 Geometry and choice of ablator
Selection of ablator was based on time-space constraints shown schematically in Fig A3. A black Kapton ablator of 25 m thickness allowed to apply compression for long enough time, which was additionally limited by a relatively small m thickness of HEA films. In thin films, a back reflected shock from HEA-air interface has phase reversal and reduces initial compression wave. We chose the largest diameter laser beam m in order to simplify overlap the volume of shocked film and X-ray which was m in diameter on front surface of HEA.
Another constraint on the ablator thickness is due to finite rise time of laser pulse to the intensity maximum (plateau) . This is important in ablators, e.g., Si, where elastic shock wave has high velocity in a low-pressure region (during ). The shock wave launched at the intensity maximum (after rise time) with velocity defines the minimum thickness of ablator: . For Si ablator, m at 110 GPa. Due to a high longitudinal sound wave velocity (proportional to the elastic wave) in Si along , , (slow-to-fast), a single shock wave emerges into Si only above 100 GPa at speeds km/s [Si]. The multi-wave structure precludes an ideal single shock compression in samples when Si is employed as an ablator below GPa [Goto1982].
6.2 Rankine–Hugoniot shock data of polyimide
Experimental Rankine–Hugoniot shock results for Kapton are shown in Fig. A4.
The sample of Au-HEA was made by sputtering from two targets. Thermal annealing was used to facilitate formation of FCC HEA. XRD with Cu- line showed almost identical structures with and without thermal annealing (Fig. A5).
