Holter-to-Sleep: AI-Enabled Repurposing of Single-Lead ECG for Sleep Phenotyping
ABSTRACT
Sleep disturbances are tightly linked to cardiovascular risk, yet polysomnography (PSG)—the clinical reference standard—remains resource-intensive and poorly suited for multi-night, home-based, and large-scale screening. Single-lead electrocardiography (ECG), already ubiquitous in Holter and patch-based devices, enables comfortable long-term acquisition and encodes sleep-relevant physiology through autonomic modulation and cardiorespiratory coupling. Here, we present a proof-of-concept Holter-to-Sleep framework that, using single-lead ECG as the sole input, jointly supports overnight sleep phenotyping and Holter-grade cardiac phenotyping within the same recording, and further provides an explicit analytic pathway for scalable cardio–sleep association studies. The framework is developed and validated on a pooled multi-center PSG sample of 10,439 studies spanning four public cohorts, with independent external evaluation to assess cross-cohort generalizability, and additional real-world feasibility assessment using overnight patch-ECG recordings via objective–subjective consistency analysis. This integrated design enables robust extraction of clinically meaningful overnight sleep phenotypes under heterogeneous populations and acquisition conditions, and facilitates systematic linkage between ECG-derived sleep metrics and arrhythmia-related Holter phenotypes. Collectively, the Holter-to-Sleep paradigm offers a practical foundation for low-burden, home-deployable, and scalable cardio–sleep monitoring and research beyond traditional PSG-centric workflows.
KEYWORDS
Holter-to-Sleep, Single-lead ECG, Scalable home sleep phenotyping, Cardio–sleep association analysis
Introduction
Sleep is a fundamental biological process that sustains systemic homeostasis and is essential for cognitive performance, emotional regulation, and metabolic stability. Persistent sleep disturbances are consistently associated with adverse health outcomes, including cardiovascular disease, metabolic dysfunction, and neurocognitive impairment 2, 20, 12, 41, 44, 51, 45. Accordingly, scalable and accessible sleep monitoring is increasingly important for both clinical screening and population-level sleep health management.
PSG is widely regarded as the clinical gold standard for sleep assessment. By recording multimodal signals—including electroencephalography (EEG), electrooculography (EOG), electromyography (EMG), respiratory airflow, oxygen saturation, and ECG—PSG enables comprehensive characterization of sleep architecture and sleep-related events, such as arousals and disordered breathing40, 33, 26. Despite its indispensable role, PSG remains resource-intensive and operationally constrained by specialized equipment, trained personnel, and laborious scoring procedures, limiting its scalability for multi-night monitoring, home deployment, and large-scale screening 8.
Among candidate modalities for scalable sleep monitoring, single-lead ECG is uniquely positioned to bridge clinical-grade assessment and real-world deployment. Single-lead ECG is already widely available from routine Holter and patch-based wearable devices, supports comfortable long-term recordings at home, and enables continuous, low-burden monitoring across multiple nights. From a physiological perspective, sleep-related autonomic modulation, respiratory load, and arousal responses are reflected in heart rate dynamics and ECG morphology, motivating ECG-based inference of sleep stages and sleep disturbances 35, 46, 47, 23, 49, 39, 37, 38, 21, 36, 24, 4, 50. Importantly, ECG is inherently dual-purpose: if robust sleep characterization can be achieved from the same signal used for cardiac monitoring, a single overnight recording can concurrently provide sleep metrics and Holter-grade cardiac analytics, thereby enabling scalable investigation of cardio–sleep associations.
Prior work has demonstrated the feasibility of ECG-based sleep analysis, spanning conventional feature-based approaches and deep learning models for single-lead ECG sleep staging and sleep event detection 28, 22, 25, 31, 34, 1, 42, 27, 30. In parallel, the rapid growth of wearable sensing has stimulated renewed interest in home sleep monitoring using ECG and other unobtrusive signals 18, 19, 7. Nevertheless, substantial gaps remain before single-lead ECG can serve as a comprehensive and generalizable substrate for scalable sleep monitoring, and these gaps directly motivate the present study. First, many ECG-based studies rely on limited-scale datasets with restricted population diversity, which constrains robustness under cross-cohort distribution shifts 16, 15, 10. Second, sleep is governed by long-range temporal dynamics and structured stage transitions; models that insufficiently capture multi-epoch context may underperform when generalized across centers and cohorts. Third, existing approaches often treat sleep staging, respiratory event detection, and arousal recognition as isolated tasks, preventing shared representation learning and limiting the ability to produce PSG-like holistic outputs. Fourth, external validation and real-world wearable testing remain scarce, leaving uncertainties regarding reliability under practical acquisition conditions. Finally, even when sleep inference is feasible, a systematic pathway to integrate ECG-derived sleep phenotypes with Holter-level arrhythmia analytics for scalable cardio–sleep association studies is largely under-explored.
Here we present a Holter-to-Sleep framework that uses single-lead ECG as the sole input to jointly characterize sleep architecture and clinically relevant sleep disturbances at scale, with rigorous multi-cohort validation and real-world wearable assessment, and further enables Holter-level cardio–sleep association analyses. Figure 1 displays an overview of the study, and the key contributions of this study are as follows:
-
•
Holter-to-Sleep framework: We establish a Holter-to-Sleep framework demonstrating that single-lead ECG can support holistic sleep characterization for scalable home monitoring.
-
•
Two-Stage deep learning architecture: We introduce a Two-Stage deep learning architecture that combines CNN-based morphological representation learning with Transformer-based temporal refinement to better capture long-range sleep dynamics and improve cross-cohort generalization.
-
•
Unified multi-task learning: We develop a Unified multi-task learning strategy that simultaneously models sleep staging and detects key sleep disturbances, aligning model outputs with PSG-style reporting.
- •
-
•
Holter-level cardio–sleep association analysis: We perform Holter-level cardio–sleep association analyses by linking ECG-derived sleep phenotypes with arrhythmia-related cardiac phenotypes, providing a scalable analytic pathway for cardio–sleep medicine.

RESULTS
PSG cohorts
A total of PSG studies were included, and single-lead ECG was extracted from each record as the model input. The combined MESA 6, MrOS 3, and SHHS 29 cohorts () were used for model development and internal evaluation, and were split into a training set (), a training-validation set (), and an internal validation set (). The CFS cohort served as an independent external validation set (). Table 1 summarizes demographics and PSG-derived sleep and event-burden metrics for each split (continuous variables reported as means.d.; categorical variables reported as (%)). The external cohort differs from the development cohorts in age/sex composition and several sleep-related indices, providing an independent setting for assessing cross-cohort generalizability.
| Metric | Training () | Train-val () | Internal val () | External val () |
| Demographics | ||||
| Age (years) | 68.4810.89 | 68.3811.20 | 68.7210.56 | 41.3419.45 |
| Female, (%) | 2,354 (34.56%) | 496 (33.97%) | 495 (33.93%) | 388 (54.72%) |
| BMI (kg m-2) | 27.944.84 | 28.044.87 | 28.024.91 | 32.129.26 |
| Event burden and oxygen desaturation | ||||
| AHI (events h-1) | 20.2117.02 | 20.3917.41 | 20.2216.98 | 12.3016.75 |
| ArI (events h-1) | 16.496.68 | 16.466.68 | 16.336.24 | 12.756.07 |
| ODI 3% (events h-1) | 6.419.74 | 6.629.80 | 6.439.67 | 6.4312.50 |
| ODI 4% (events h-1) | 3.717.18 | 3.917.34 | 3.747.20 | 4.079.46 |
| Sleep architecture (percentage of TST) | ||||
| N1 / TST (%) | 7.816.71 | 7.886.62 | 8.056.89 | 5.144.94 |
| N2 / TST (%) | 58.5011.28 | 58.9111.18 | 58.4211.47 | 56.0813.07 |
| N3 / TST (%) | 14.4511.24 | 13.9411.14 | 14.1811.24 | 21.2013.77 |
| NREM / TST (%) | 80.766.59 | 80.736.61 | 80.656.53 | 82.427.27 |
| REM / TST (%) | 19.246.59 | 19.276.61 | 19.356.53 | 17.587.27 |
| Sleep continuity and fragmentation | ||||
| TIB (min) | 528.6984.83 | 527.7484.38 | 527.7084.87 | 535.9249.52 |
| TST (min) | 352.7367.33 | 351.8667.44 | 353.7765.08 | 353.3470.88 |
| Sleep efficiency (%) | 68.0215.14 | 67.9315.09 | 68.2914.62 | 66.2413.32 |
| Wake / TIB (%) | 31.9815.14 | 32.0715.09 | 31.7114.62 | 33.7613.32 |
| Sleep latency (min) | 53.3157.80 | 55.7458.21 | 53.4159.39 | 98.6768.77 |
| WASO (min) | 84.7661.99 | 83.2462.61 | 83.4860.82 | 76.4760.79 |
Consistent sleep staging and epoch-level sleep event detection performance with strong cross-cohort generalization
To assess cross-cohort generalizability, we evaluated the proposed model on the held-out internal validation set from MESA/MrOS/SHHS and the independent external validation cohort (CFS). Confusion matrices for four staging granularities are shown in Figure 2, and the corresponding quantitative metrics with 95% confidence intervals (CIs) are summarized in Table 2. In 4-class staging (W/Light/Deep/REM), the model achieved [0.700, 0.702] on internal validation and [0.743, 0.745] on external validation (Macro AUC: 0.944 [0.944, 0.944] and 0.959 [0.959, 0.959], respectively). For sleep disturbance detection, ROC curves are shown in Figure 3 and performance metrics with 95% CIs are reported in Table 3. Arousal detection achieved an AUC of 0.855 [0.855, 0.856] on internal validation and 0.864 [0.863, 0.865] on external validation, while respiratory event detection achieved an AUC of 0.787 [0.786, 0.788] and 0.785 [0.784, 0.787], respectively.
To provide qualitative context for single-lead ECG sleep staging, we curated representative ECG-based sleep-staging studies and summarized their reported datasets, PSG sample sizes, and headline metrics in Appendix C. Because cohorts, label sets, and evaluation protocols vary across studies, this summary is intended for context rather than head-to-head benchmarking; likewise, we did not compile cross-study comparisons for sleep-event detection given substantial heterogeneity in event definitions, time scales, and disorder taxonomies.
| Class setting | Accuracy | Weighted F1 | Kappa | Macro AUC |
| Internal validation | ||||
| 5-class | 0.773 [0.772, 0.773] | 0.761 [0.760, 0.762] | 0.670 [0.668, 0.670] | 0.930 [0.930, 0.930] |
| 4-class | 0.804 [0.803, 0.804] | 0.801 [0.801, 0.802] | 0.701 [0.700, 0.702] | 0.944 [0.944, 0.944] |
| 3-class | 0.870 [0.869, 0.870] | 0.869 [0.869, 0.870] | 0.776 [0.775, 0.777] | 0.962 [0.962, 0.962] |
| 2-class | 0.926 [0.926, 0.926] | 0.926 [0.926, 0.926] | 0.834 [0.834, 0.835] | 0.974 [0.974, 0.975] |
| External validation (CFS) | ||||
| 5-class | 0.812 [0.811, 0.813] | 0.801 [0.800, 0.802] | 0.729 [0.728, 0.731] | 0.946 [0.945, 0.946] |
| 4-class | 0.826 [0.825, 0.827] | 0.822 [0.821, 0.822] | 0.744 [0.743, 0.745] | 0.959 [0.959, 0.959] |
| 3-class | 0.892 [0.891, 0.893] | 0.892 [0.891, 0.893] | 0.814 [0.813, 0.815] | 0.975 [0.974, 0.975] |
| 2-class | 0.924 [0.923, 0.924] | 0.925 [0.924, 0.925] | 0.833 [0.832, 0.834] | 0.978 [0.977, 0.978] |

| Metric | Arousal | Respiratory |
| Internal validation | ||
| Accuracy | 0.852 [0.852, 0.853] | 0.798 [0.798, 0.799] |
| Precision | 0.518 [0.517, 0.520] | 0.368 [0.366, 0.369] |
| Recall | 0.593 [0.591, 0.595] | 0.534 [0.532, 0.536] |
| Specificity | 0.899 [0.899, 0.900] | 0.843 [0.843, 0.844] |
| F1-score | 0.553 [0.552, 0.555] | 0.435 [0.434, 0.437] |
| AUC | 0.855 [0.855, 0.856] | 0.787 [0.786, 0.788] |
| External validation (CFS) | ||
| Accuracy | 0.895 [0.894, 0.895] | 0.838 [0.837, 0.839] |
| Precision | 0.558 [0.554, 0.561] | 0.301 [0.298, 0.304] |
| Recall | 0.555 [0.552, 0.558] | 0.465 [0.461, 0.469] |
| Specificity | 0.940 [0.940, 0.941] | 0.880 [0.879, 0.880] |
| F1-score | 0.556 [0.553, 0.559] | 0.365 [0.363, 0.368] |
| AUC | 0.864 [0.863, 0.865] | 0.785 [0.784, 0.787] |

ECG emerges as a promising modality for scalable sleep staging after channel-wise comparison
To contextualize the role of single-lead ECG in sleep staging and quantify the benefit of the proposed two-stage model, CNN with Transformer-based temporal refinement, we performed a channel-wise comparison on the CFS cohort (Table 4). Adding the Transformer consistently improved staging performance across all channels relative to the CNN-only (Net1D) baseline. Notably, for ECG-2, increased from 0.621 to 0.748 (a 20.45% relative increase), with Accuracy, Weighted F1, and Macro AUC. Under single-channel settings, ECG-2 approached the performance of channels more directly associated with sleep staging, while the multimodal reference set (C4+LOC+EMG1) achieved the highest overall performance.
| Channel | Method | Accuracy | Weighted F1 | Macro AUC | Relative increase | |
| C4+LOC+EMG1 | Net1D | 0.843 | 0.842 | 0.782 | 0.962 | – |
| Net1D+Trans | 0.886 | 0.881 | 0.838 | 0.977 | +7.16% | |
| EEG-C4 | Net1D | 0.827 | 0.822 | 0.759 | 0.955 | – |
| Net1D+Trans | 0.873 | 0.869 | 0.820 | 0.974 | +8.04% | |
| EOG-L | Net1D | 0.832 | 0.829 | 0.767 | 0.956 | – |
| Net1D+Trans | 0.878 | 0.875 | 0.826 | 0.975 | +7.69% | |
| EMG1 | Net1D | 0.705 | 0.690 | 0.580 | 0.880 | – |
| Net1D+Trans | 0.787 | 0.778 | 0.700 | 0.936 | +20.69% | |
| ECG-2 | Net1D | 0.725 | 0.718 | 0.621 | 0.903 | – |
| Net1D+Trans | 0.823 | 0.819 | 0.748 | 0.949 | +20.45% | |
| Airflow | Net1D | 0.482 | 0.459 | 0.247 | 0.694 | – |
| Net1D+Trans | 0.632 | 0.610 | 0.454 | 0.836 | +83.81% |
Real-world wearable data validation: ECG-derived sleep consistency metrics correlate with PSQI
In the patch-based wearable ECG cohort, epoch-level PSG labels were unavailable. We therefore evaluated real-world consistency by comparing model-derived overnight metrics with subjective sleep quality assessed by the Pittsburgh Sleep Quality Index (PSQI) 5(Fig. 4). Specifically, wake probability was defined as the overnight mean of epoch-wise wake probabilities, and sleep efficiency was estimated from model-inferred sleep–wake information. In participants, wake probability was positively correlated with normalized PSQI (, ), whereas sleep efficiency was negatively correlated with normalized PSQI (, ).

ECG-derived sleep phenotypes reveal cross-cohort heart–sleep associations
Across the pooled multi-cohort PSG sample, we derived overnight sleep phenotypes from single-lead ECG model inference and compared their distributions across arrhythmia-related strata (Fig. 5). Relative to their corresponding reference groups, individuals with arrhythmia phenotypes or higher ectopy burden consistently exhibited poorer sleep, characterized by longer TIB, longer SL, lower SE, and higher ODI 3%; all stratified comparisons annotated in the figure were statistically significant ().
For frequent premature ventricular contraction (PVC), TIB increased from 529.9178.58 to 553.1281.75 min, SL increased from 50.9655.26 to 68.5966.18 min, SE decreased from 68.7014.25% to 62.8515.07%, and ODI 3% increased from 6.209.59 to 7.5810.75. For frequent premature atrial contraction (PAC), TIB increased from 528.9278.31 to 548.3681.56 min, SL increased from 50.3754.86 to 64.3163.75 min, SE decreased from 69.0414.18% to 63.6714.86%, and ODI 3% increased from 6.009.21 to 7.8611.61. For atrial fibrillation (AF) during sleep, TIB increased from 530.7479.05 to 548.1179.79 min, SL increased from 51.6955.96 to 63.9863.25 min, SE decreased from 68.2814.52% to 65.7313.87%, and ODI 3% increased from 6.219.49 to 7.5611.51. For ventricular tachycardia (VT), the differences were more pronounced: TIB increased from 531.1178.86 to 564.6581.98 min, SL increased from 52.0456.24 to 74.0566.62 min, SE decreased from 68.2314.44% to 63.2614.32%, and ODI 3% increased from 6.309.72 to 7.6810.32.
Collectively, these results indicate that ECG-inferred sleep phenotypes can robustly capture discriminative sleep differences aligned with Holter-grade arrhythmia phenotypes in a cross-cohort setting. Further subgroup analyses of phenotypes and complete results can be found in the Appendix G.

From algorithm to application: an integrated web dashboard for ECG-based sleep & Holter cardiac reporting
To facilitate practical use and result interpretation, we implemented an integrated web dashboard that combines ECG-based sleep inference with Holter-grade long-term ECG analytics (Fig. 6). The system accepts raw EDF recordings, automatically parses the ECG channel, and generates a consolidated overnight report including continuous heart-rate trends, a sleep-stage timeline, and summary sleep and cardiac metrics, enabling unified review of nocturnal cardio–sleep phenotypes.

DISCUSSION
This study proposes and validates a proof-of-concept Holter-to-Sleep framework that enables simultaneous sleep phenotyping and Holter-grade cardiac phenotyping using single-lead ECG alone, together with an explicit pathway for downstream cardio–sleep association analyses. In contrast to prior work that typically targets a single sleep task or relies on multi-channel PSG signals, our framework provides a scalable paradigm that integrates nocturnal sleep assessment and cardiac risk characterization within the same data source and workflow. This unified design is particularly relevant to home-based, lightweight, and low-burden monitoring scenarios, and it lays a methodological and engineering foundation for scalable cardio–sleep research, longitudinal health management, and potential screening or follow-up applications.
Regarding methodological validity, we systematically evaluated ECG-based sleep staging, arousal detection, and respiratory event detection on multi-center cohorts totaling more than 10,000 PSG studies, and further assessed generalizability via internal validation and an independent external cohort. Although the study is not intended as a head-to-head benchmarking against existing methods, the scale of the data and the consistent cross-cohort performance support that the proposed approach is extensible and transferable across heterogeneous populations, providing a strong basis for deployment in larger cohorts and more complex real-world settings. Algorithmically, the proposed design aims to maximally exploit sleep-relevant physiological information embedded in single-lead ECG. First, we fused time-domain, frequency-domain, and time–frequency representations to enhance sensitivity to autonomic modulation, rhythmic dynamics, and non-stationary components. Second, a CNN backbone captures local morphology and short-term dynamics, while a Transformer module models longer-range temporal dependencies, improving discrimination of sleep architecture and event boundaries. Third, multi-epoch concatenation incorporates contextual information from neighboring epochs and leverages temporal consistency to stabilize epoch-level predictions. Ablation studies in Appendix D indicate that each component contributes to the overall performance.
The channel-wise comparison (Table 4) provides complementary evidence for single-lead ECG as a strong and pragmatic modality for scalable sleep staging from the perspective of sensor availability, information content, and deployability. Under the stringent single-channel setting, ECG-2 with temporal refinement achieved performance close to channels more directly associated with conventional staging (e.g., EEG and EOG), while clearly outperforming respiratory surrogates that are more vulnerable to real-world signal degradation (e.g., airflow). Notably, the relative gain brought by the Transformer was particularly pronounced for ECG, suggesting that stage-related cardiac cues are expressed less as isolated within-epoch patterns and more as temporally structured dynamics—reflecting the minute-scale unfolding of sleep continuity, transition regularities, and autonomic/respiratory modulation of heart-rate fluctuations. This observation motivates the two-stage design adopted in this work: learning robust epoch-level representations while explicitly modeling contextual dependencies and sequence-level constraints using attention. From a translational standpoint, single-lead ECG is routinely available in PSG and constitutes a standard sensing modality in Holter and patch-based monitors; thus, leveraging ECG enables competitive sleep staging without the additional acquisition burden of dedicated neurophysiological electrodes, supporting longitudinal follow-up and population-scale cardio–sleep phenotyping. We emphasize that multimodal PSG remains the reference standard for maximal diagnostic fidelity; the present work targets cost-effective, scalable screening and phenotyping rather than replacing full clinical polysomnography.
Beyond PSG-based validation, we further examined real-world feasibility using a dynamic ECG patch monitor (HeartVoice, Anhui, China) to acquire overnight recordings in an unconstrained setting. Because epoch-level PSG labels are unavailable in this wearable cohort, we derived interpretable overnight metrics from model outputs (overnight wake probability and sleep efficiency) and evaluated their consistency with subjective sleep quality assessed by the PSQI. The observed associations suggest that the proposed approach can provide informative sleep-related summaries under real-world conditions without PSG supervision, supporting its potential for broader deployment and longitudinal studies.
From a clinical and public health perspective, jointly assessing sleep and cardiac phenotypes is necessary. In the Holter cohort, arrhythmia phenotypes and higher ectopy burden were associated with a consistent pattern of worse sleep, including increased time in bed, prolonged sleep latency, reduced sleep efficiency, and elevated hypoxemia burden. These findings suggest that conventional Holter analyses alone may not fully capture nocturnal physiology, and that incorporating sleep phenotypes within the same monitoring framework can help reveal clinically meaningful interactions and risk signals. A single-lead ECG solution that simultaneously supports sleep and cardiac phenotyping is therefore well aligned with the need for low-burden, home-based, continuous cardio–sleep monitoring.
Several additional strengths are noteworthy. We leveraged multi-center cohorts and performed external validation, supporting reproducibility and scalability. The end-to-end pipeline spans data ingestion, sleep inference, cardiac analytics, association analysis, and reporting, lowering the engineering barrier for translation. Moreover, the implemented web dashboard enables automated parsing of raw EDF recordings and generation of integrated overnight reports, facilitating practical adoption by researchers and clinicians and accelerating translation from proof-of-concept to real-world workflows.
This study also has limitations. First, the wearable validation relied on PSQI as a reference. PSQI is subjective and reflects sleep quality over approximately one month, whereas our ECG recordings covered a single night; thus, the wearable analysis primarily characterizes correlations between single-night model-derived metrics and recent subjective sleep quality rather than strict epoch-level accuracy in real-world sleep staging. Nevertheless, this approach provides a pragmatic starting point for feasibility assessment in the absence of PSG labels. Future work should incorporate multi-night recordings, sleep diaries, and/or additional wearable modalities to strengthen ecological validity. Second, supplementary experiments with cohort-specific training (Appendix A) show reduced performance when training and evaluating on MESA or SHHS alone. This may reflect the higher prevalence of cardiovascular comorbidities in these cohorts, leading to more complex and heterogeneous ECG morphologies and rhythms that challenge learning of stable sleep-relevant representations within a single cohort. Future directions include comorbidity-aware stratification, domain adaptation, and explicit robustness mechanisms for arrhythmias and noise to improve performance in high-risk populations.
In summary, by using single-lead ECG as the sole input, we establish an extensible Holter-to-Sleep framework that supports multi-task sleep inference, integrates Holter-grade cardiac phenotyping, and enables cardio–sleep association analyses, providing a feasible pathway toward low-burden, home-based continuous cardio–sleep monitoring.
METHODS
Datasets and data preprocessing
Datasets and data annotation
In our study, we assembled a unified dataset for model development, validation, and real-world evaluation by integrating single-lead ECG signals from four large public PSG cohorts and by collecting additional long-term wearable ECG recordings. The public cohorts included MESA, MrOS, SHHS, and CFS. MESA, MrOS, and SHHS were used for model training and internal validation, whereas CFS served as an independent external validation cohort. Real-world wearable data were acquired using a patch-based dynamic ECG monitor, yielding 70 overnight recordings; after questionnaire completion and quality control, these data were used for real-world consistency evaluation. To ensure data quality and cross-cohort comparability, we applied unified inclusion/exclusion criteria with quality control on monitoring duration and sleep-stage distributions. The complete screening process and cohort-specific sample sizes are summarized in Fig. 7.
We strictly aligned single-lead ECG signals extracted from PSG with the corresponding sleep annotations by parsing XML annotation files matched to the EDF recordings. Three 30-s epoch–level label sequences were generated for each record: sleep staging labels, arousal event labels, and respiratory event labels. Sleep stages followed standard 30-s scoring with Wake, N1, N2, N3, and REM; for consistency, N3 and N4 annotations were merged into N3. Arousal labels were defined as a binary sequence, where an epoch was labeled as 1 if any arousal event occurred within the 30-s window and 0 otherwise. Respiratory labels were also defined in a binary manner: an epoch was labeled as 1 if hypopnea or any apnea event (obstructive, central, or mixed) occurred within the 30-s window, and 0 otherwise. To ensure complete temporal coverage and accurate signal–label alignment, we computed the total number of 30-s epochs for each PSG recording and constructed label sequences of equal length accordingly. Because the beginning and end of recordings are often affected by device setup/termination and signal instability, we excluded the first and last 60 epochs (approximately 60 minutes in total; 30 minutes at each end) from each ECG record to mitigate boundary noise. Ultimately, each recording yielded a time-aligned signal matrix together with sleep stage, arousal, and respiratory event labels for downstream modeling and analysis.
Data preprocessing
A standardized preprocessing pipeline was applied to single-lead ECG signals extracted from PSG recordings to improve signal quality and cross-dataset consistency, including resampling, filtering, baseline correction, and normalization. All ECG signals were first resampled to 100 Hz to remove sampling-rate variability across cohorts. A 0.5–40 Hz bandpass filter was then used to suppress low-frequency drift and high-frequency noise, preserving the principal ECG components. Baseline drift was subsequently corrected by fitting and removing a first-order polynomial, thereby reducing slow baseline fluctuations associated with electrode contact variation or motion. To enhance comparability across recordings, robust Z-score normalization was performed to attenuate the influence of outliers. Finally, amplitude normalization linearly scaled each standardized signal to the range , mitigating inter-record amplitude discrepancies and providing uniform inputs for downstream model training.
Construction of frequency and time–frequency features
The neural network input comprises two components: the time-domain ECG waveform and a set of frequency and time–frequency features. The time-domain waveform corresponds to a 30-s segment. For each 30-s segment, the Power Spectral Density (PSD) was first estimated using the Welch method. By segmenting the signal, applying windowing, and performing the Fourier transform, Welch’s approach reduces the influence of noise on spectral estimation and yields frequency components with their corresponding spectral power. Based on the estimated spectrum, nine physiologically relevant frequency-domain features were extracted. Specifically, band powers in Delta (0.5–4 Hz), Theta (4–8 Hz), and Alpha (8–13 Hz) ranges were computed to characterize energy distribution across bands, and total spectral power was calculated to reflect the overall energy level. The peak frequency was obtained as the frequency with the maximum spectral power. In addition, the spectral centroid (power-weighted mean frequency) and spectral bandwidth (standard deviation around the centroid) were computed to summarize the center and spread of the spectral distribution. Spectral shape was further quantified using spectral flatness, where higher flatness indicates a more noise-like spectrum, and spectral entropy was computed on the normalized spectrum to quantify randomness and complexity.
Time–frequency features were additionally derived using wavelet transforms to capture localized signal characteristics across multiple time and frequency scales. Wavelet analysis provides multi-resolution representations and is well suited for non-stationary physiological signals. In this study, a Daubechies wavelet (db4) was adopted as the basis function, and a four-level Discrete Wavelet Transform (DWT) was applied to each 30-s ECG segment, yielding five sets of coefficients: approximation coefficients at level 5 and detail coefficients at levels 1–4. For each coefficient level, energy (sum of squared coefficients) was computed to quantify scale-specific energy contributions. Furthermore, statistical descriptors, including mean, standard deviation, variance, maximum, and minimum, were extracted to characterize amplitude variation and local morphology across scales. Finally, the nine frequency-domain features and the 30 wavelet-derived time–frequency features were concatenated to form a 39-dimensional handcrafted feature vector; the complete feature list is provided in Appendix F.

Development of deep learning model
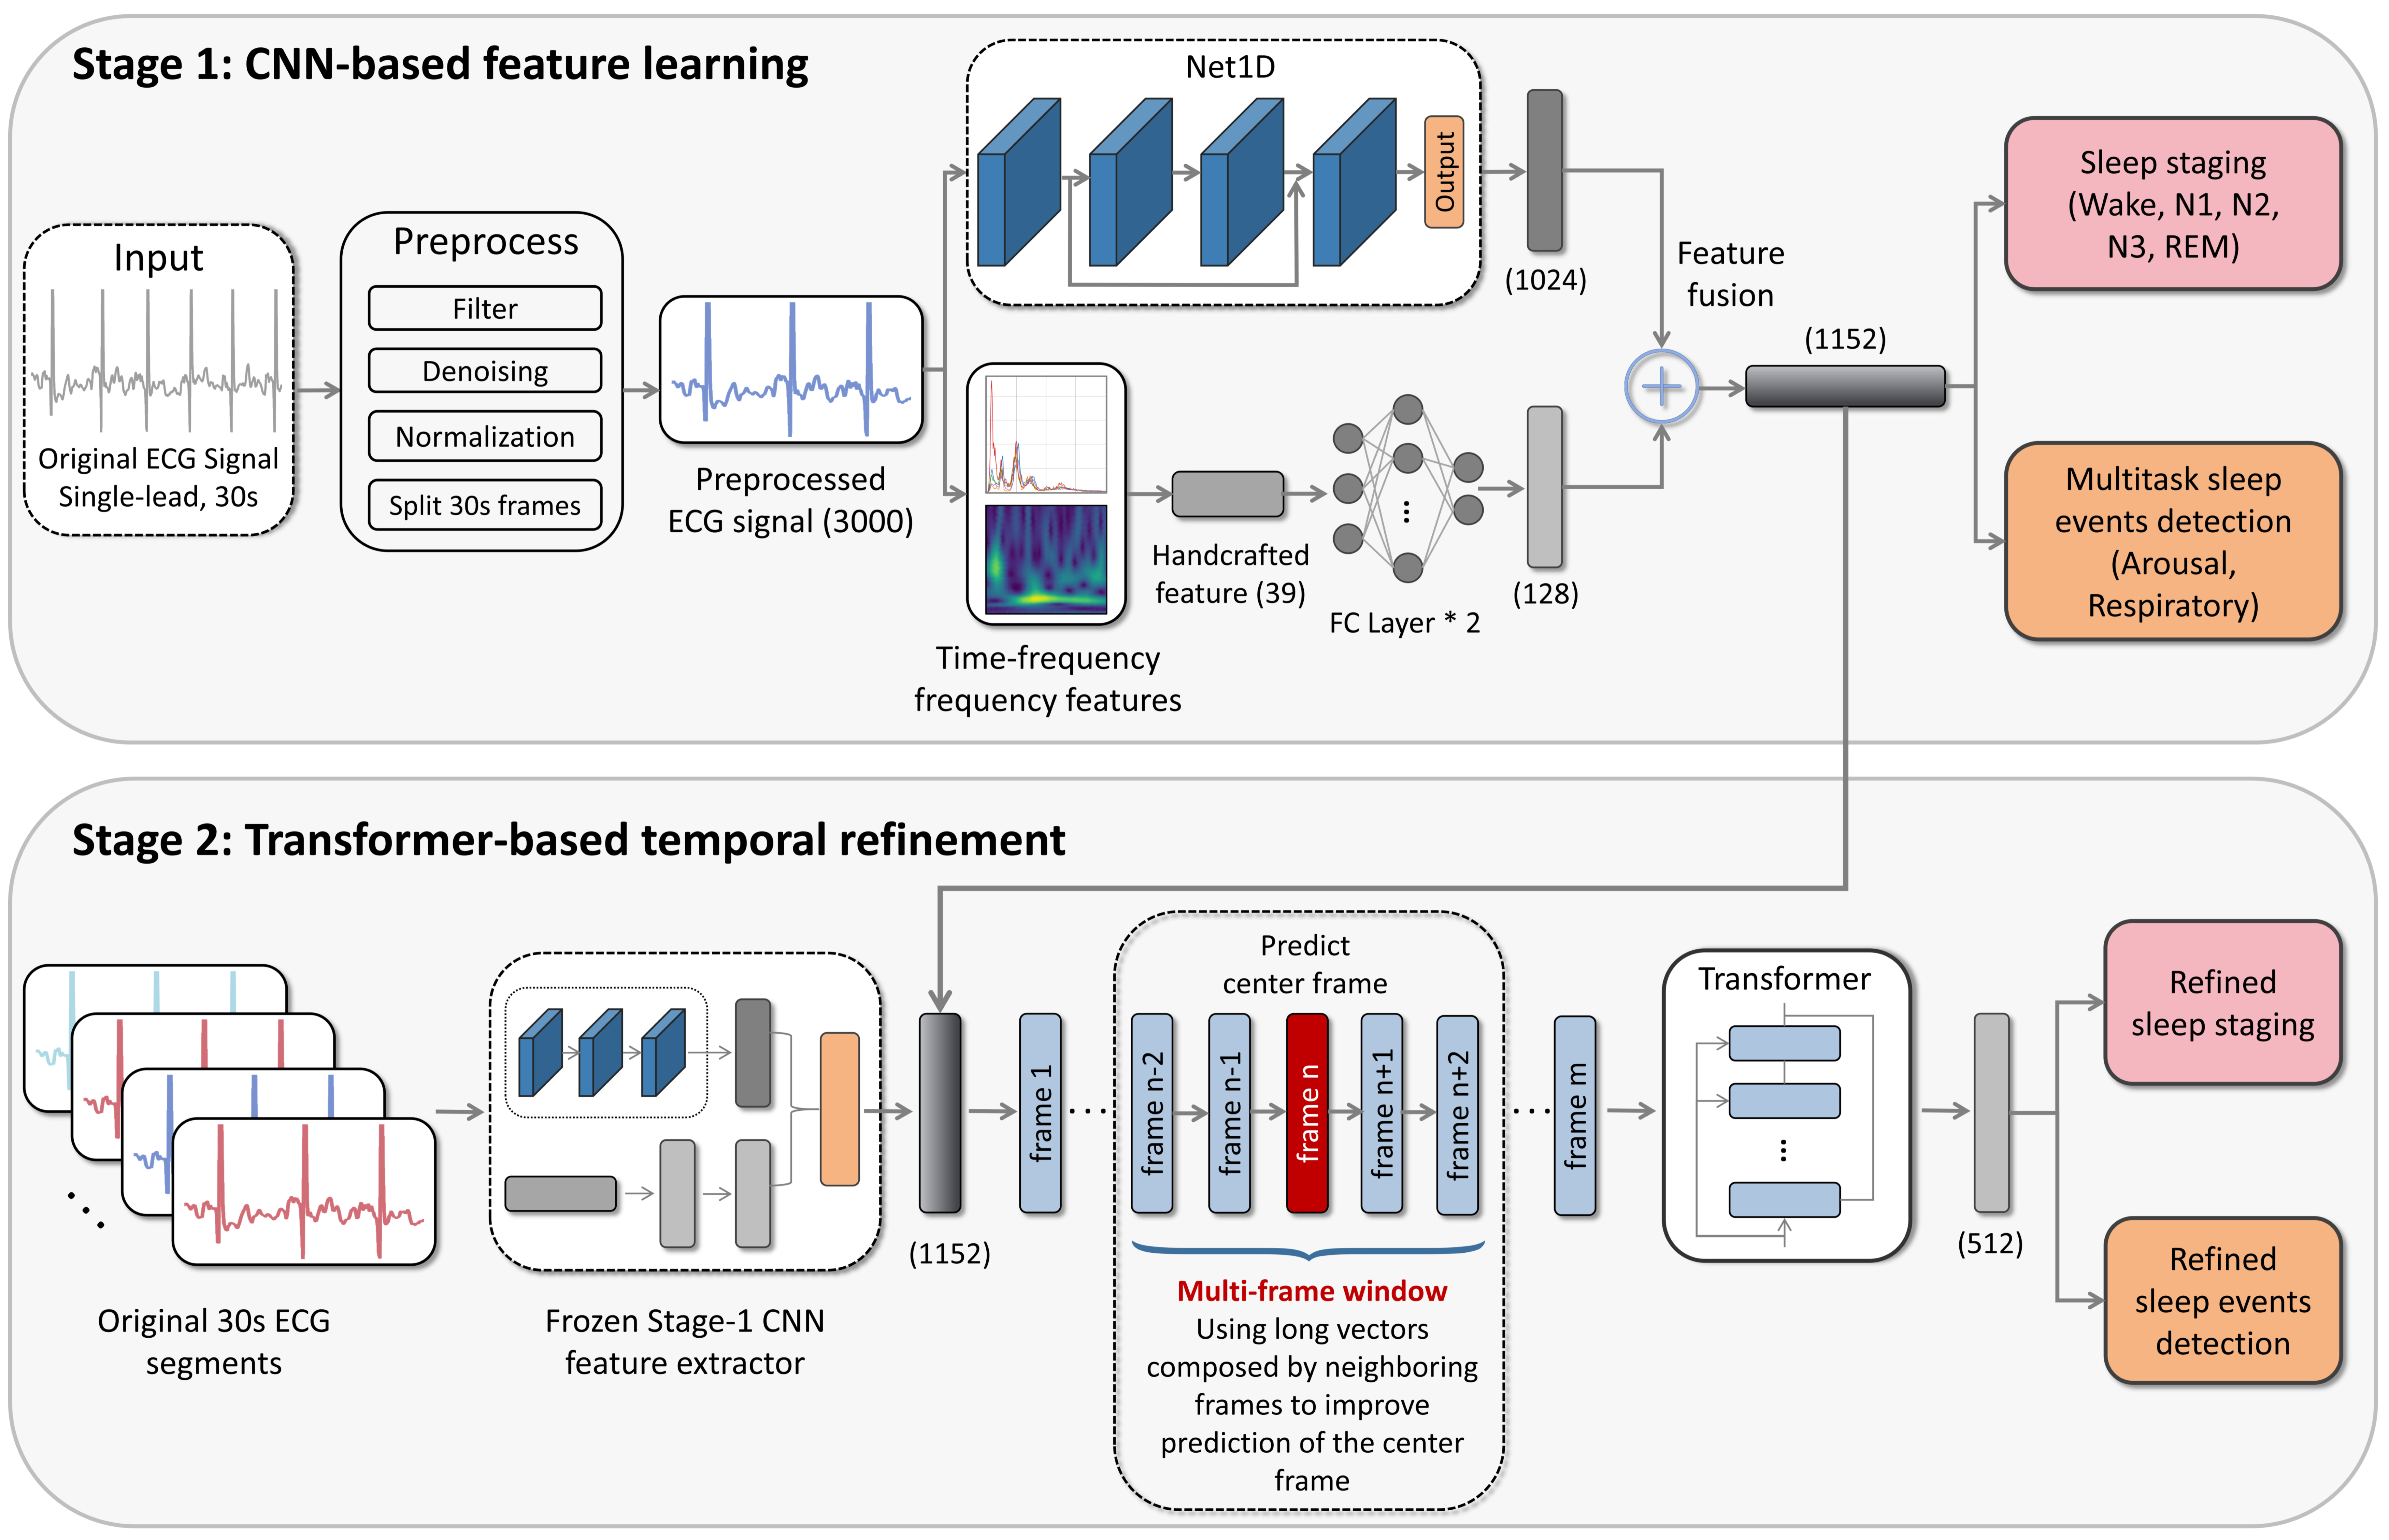
We propose a two-stage deep learning framework that takes single-lead ECG as input and jointly performs sleep staging and sleep event detection (Fig. 8). The overall design follows a representation learning–temporal refinement paradigm. Stage 1 employs a CNN to learn robust morphology- and rhythm-related representations from each 30-s epoch, and fuses them with frequency/time–frequency descriptors to form a unified feature vector. Stage 2 freezes the Stage 1 feature extractor and uses a Transformer to model multi-epoch context, improving temporal consistency and boundary discrimination for the center epoch.
Stage 1: CNN representation learning with multi-domain feature fusion. For each preprocessed 30-s single-lead ECG epoch, the time-domain signal is fed into a 1D CNN (Net1D) backbone—adapted from the architecture proposed by Hong et al. 14—to capture morphological and rhythmic patterns, yielding a high-dimensional deep representation. Concurrently, the corresponding frequency-domain features are projected into a compatible embedding space. The deep representation and the handcrafted spectral/time–frequency embeddings are then fused at the feature level to obtain a shared representation for downstream predictions.
Task formulation: sleep staging and multi-task event detection. Using the shared representation, sleep staging is formulated as a five-class classification task. For sleep events, we adopt a shared-weight multi-task learning head to simultaneously detect arousals and respiratory-related events, leveraging potential physiological relatedness across tasks and improving training efficiency. Outputs from Stage 1 can be directly used as initial predictions.
Stage 2: Transformer-based temporal refinement. To exploit the temporal continuity inherent in sleep architecture, we construct a sliding window of neighboring 30-s epochs. The feature sequence extracted from Stage 1 is fed into a Transformer encoder to predict the label of the center epoch 43. During Stage 2, the Stage 1 CNN feature extractor is frozen, and only the Transformer and its prediction heads are optimized. This paradigm enables the model to retain robust local representations while significantly enhancing long-range dependency modeling and stage-transition awareness. This temporal refinement strategy is applied to both sleep staging and sleep-event detection. Specifically, the sleep staging task leverages the sequential context of the epoch-level embeddings, while event detection is formulated as a multitask learning problem utilizing a shared Transformer encoder with parallel classification heads for the binary tasks. Both tasks employ a fixed-length local context window and perform classification based on the representation of the center token. Detailed model architectures and hyperparameters are provided in Appendix D. The refined outputs from this stage serve as the final predictions for evaluation, derived-metric computation, and subsequent downstream analyses.
Training objective and loss functions. No specialized loss engineering was introduced beyond standard classification objectives. Sleep staging is optimized using the categorical cross-entropy loss:
| (1) |
where and denote the one-hot ground-truth label and the predicted probability for class , respectively. For sleep event detection, a multi-task optimization strategy is adopted, where the overall loss is the sum of the arousal loss and the respiratory-event loss:
| (2) |
Data splitting, thresholding, and uncertainty estimation
Train/validation/test splits were created at the recording level, such that all epochs from the same overnight recording were confined to a single split; the default split ratio was 70%/15%/15% with a fixed random seed for reproducibility. For multiclass sleep staging, discrete labels were obtained by argmax over softmax probabilities. For binary event detection, decision thresholds were determined on the validation set via a grid search (100 equally spaced candidates in ) by maximizing the F1-score and were then fixed for test evaluation. Metric uncertainty was quantified using nonparametric bootstrap; the resampling unit was the epoch (30-s segment), with 1000 bootstrap replicates and 95% confidence intervals.
Evaluation metrics
Model performance was evaluated using task-appropriate classification metrics for sleep staging and sleep event detection. For sleep staging, we report overall Accuracy, Weighted F1-score, Cohen’s Kappa (), and macro-averaged ROC AUC (Macro AUC). Kappa is used as a primary staging metric to quantify agreement between predictions and reference annotations while accounting for class imbalance. For sleep event detection (binary classification for arousal and respiratory events), we report Accuracy, Precision, Recall, Specificity, F1-score, and ROC AUC, where AUC serves as the primary indicator of discriminative performance. To quantify the stability and uncertainty of the reported results, 95% confidence intervals (95% CI) for key metrics were computed using bootstrapping.
Real-world validation of sleep consistency using wearable ECG data
To validate the feasibility of the proposed algorithm in real-world sleep monitoring, we conducted a consistency analysis experiment using wearable single-lead ECG devices. The wake probability throughout the night was used as a surrogate metric for sleep quality, and the relationship between this model-derived metric and self-reported PSQI scores was assessed to evaluate the consistency between algorithmic predictions and subjective sleep quality perceptions. A total of 70 healthy participants were recruited for this study. Each participant wore a dynamic single-lead ECG patch for continuous overnight ECG recording. The following morning, participants were asked to complete the PSQI, which assesses subjective sleep quality on a scale from 0 to 21, with higher scores indicating poorer sleep quality. Complete PSQI questionnaires were obtained from 26 participants, who were included in the PSQI-related analyses.
Since single-lead ECG does not provide manual PSG-equivalent annotations, the sleep monitoring algorithm first classified 30-second ECG segments into five sleep stages. To compute the probability of wakefulness across the entire night, we extracted the predicted wake probability from the softmax output of the five-class model for each segment, regardless of its final class label. The per-segment wake probability is denoted as:
| (3) |
where represents the input to the model for the -th 30-second epoch, and denotes the wake probability of the -th 30-second segment. The average wake probability over the entire night was computed as:
| (4) |
where represents the total number of 30-second windows during the night. To align the wake probability range with the PSQI scoring scale, the PSQI scores were normalized by dividing by 21. This normalized PSQI score was then used for consistency analysis.
Additionally, we introduced SE as an additional metric, calculated by summing the total duration of non-wake states over the entire night and dividing by the total monitoring duration. Both the normalized PSQI score and the model-derived metrics were then analyzed for consistency.
To evaluate the relationship between the two model-derived metrics—wake probability and SE—and PSQI scores, the Pearson correlation coefficient () and p-value were computed to quantify their linear association. Furthermore, a least squares regression model was fitted for each metric, and a 95% confidence interval was calculated to assess the robustness of the regression analysis:
| (5) |
where denotes the model-derived metric, is the regression slope, and is the intercept.
The full PSQI questionnaire can be found in Appendix H.
Joint analysis of Holter-level cardiac metrics and sleep metrics
To assess the associations between ECG-derived sleep phenotypes and Holter-level cardiac phenotypes, we constructed two synchronized feature sets for each PSG recording: a sleep-metric set and a cardiac-metric set. The sleep-metric set comprised 16 variables capturing sleep-disordered breathing burden, arousal burden, and sleep architecture/efficiency. The cardiac-metric set comprised 32 Holter-level variables including heart-rate summary statistics, supraventricular/ventricular ectopy burden and rhythm-event summaries, as well as time- and frequency-domain heart-rate variability (HRV) features. Holter-level metric computation followed established practice and was implemented by adapting prior validated pipelines, with specific reference to the CardioLearn framework by Hong et al. 13 and the implementation described by Fu et al. 9. Full metric definitions are provided in Appendix E.
We then performed joint analysis using a cardiac-phenotype–stratified comparison strategy, in which sleep phenotypes were compared across groups defined by cardiac phenotypes. Two grouping schemes were used depending on the cardiac variable type: (1) binary/event-based stratification—for rhythm events or indicator variables (e.g., atrial fibrillation (AF) occurrence during sleep and ventricular tachycardia (VT) occurrence), participants were stratified into event-present vs. event-absent groups; and (2) threshold-based burden stratification—for quantitative burden metrics (e.g., premature atrial contractions (PACs) and premature ventricular contractions (PVCs)), event counts were normalized to an hourly rate (events/h), and participants were stratified into “frequent” vs. “non-frequent” groups using predefined thresholds. Consistent with the Results, frequent PVC was defined as a PVC burden events/h and frequent PAC as a PAC burden events/h.
For each stratification, we conducted between-group statistical comparisons of sleep metrics to identify sleep features most strongly associated with cardiac phenotypes. Two-sided tests were applied for continuous sleep metrics, and significance levels were reported. Distributions were visualized using box/violin plots. This workflow enables systematic screening of sleep-phenotype differences anchored to Holter-level cardiac phenotypes within a unified PSG cohort, thereby characterizing clinically meaningful cardio–sleep associations.
Web dashboard for integrated sleep–cardiac reporting
To facilitate practical usability assessment and result visualization, we integrated the proposed ECG-based sleep analysis model with the Holter-level cardiac metric computation module into a user-facing web dashboard. The system allows users to upload EDF (European Data Format) files and select the target single-lead ECG channel. It then automatically performs signal ingestion and quality control, segmentation and preprocessing, model inference, and the computation and aggregation of sleep and cardiac metrics, ultimately generating an overnight integrated sleep–cardiac report. The report includes an overnight heart-rate trend, a sleep-stage timeline, key sleep and arousal/respiratory metrics. The implementation of the dashboard and the end-to-end pipeline are provided in the public repository: https://github.com/xdl1216/Holter-to-Sleep.
RESOURCE AVAILABILITY
Data availability
The public sleep cohorts analyzed during the current study are available in the National Sleep Research Resource (NSRR) repository at https://sleepdata.org/.
Code availability
The code for the Holter-to-Sleep framework and the integrated web dashboard are available at https://github.com/xdl1216/Holter-to-Sleep and https://github.com/PKUDigitalHealth/Holter-to-Sleep.
ACKNOWLEDGMENTS
This work was supported by the National Natural Science Foundation of China (62102008, 62172018), CCF-Tencent Rhino-Bird Open Research Fund (CCF-Tencent RAGR20250108), CCF-Zhipu Large Model Innovation Fund (CCF-Zhipu202414), PKU-OPPO Fund (BO202301, BO202503), Research Project of Peking University in the State Key Laboratory of Vascular Homeostasis and Remodeling (2025-SKLVHR-YCTS-02), Beijing Municipal Science and Technology Commission (Z251100000725008). The authors thank all collaborators and participating institutions for their support and contributions to this research.
AUTHOR CONTRIBUTIONS
Donglin Xie conceived and designed the study and implemented the algorithms and software. Qingshuo Zhao integrated, curated, and preprocessed the datasets. Jingyu Wang planned the real-world ECG data collection protocol and provided clinical guidance. Shijia Geng and Rongrong Guo prepared the ECG acquisition devices, performed the real-world ECG recordings, and collected PSQI questionnaires. Jiarui Jin, Jun Li, Guangkun Nie and Gongzheng Tang assisted with result interpretation and manuscript revision. Yuxi Zhou contributed to methodological discussions and manuscript editing. Thomas Penzel and Shenda Hong supervised the project, provided overall technical guidance, and critically revised the manuscript. All authors reviewed and approved the final manuscript.
DECLARATION OF INTERESTS
The authors declare no competing interests.
References
- Sleep apnea detection from single-lead ecg: a comprehensive analysis of machine learning and deep learning algorithms. IEEE Transactions on Instrumentation and Measurement 71, pp. 1–11. Cited by: Introduction.
- Diabetes and sleep: a complex cause-and-effect relationship. Diabetes research and clinical practice 91 (2), pp. 129–137. Cited by: Introduction.
- Associations between sleep architecture and sleep-disordered breathing and cognition in older community-dwelling men: the osteoporotic fractures in men sleep study. Journal of the American Geriatrics Society 59 (12), pp. 2217–2225. Cited by: Table 14, 4th item, PSG cohorts.
- Sleep–wake stage detection with single channel ecg and hybrid machine learning model in patients with obstructive sleep apnea. Physical and Engineering Sciences in Medicine 44, pp. 63–77. Cited by: Introduction.
- The pittsburgh sleep quality index: a new instrument for psychiatric practice and research. Psychiatry research 28 (2), pp. 193–213. Cited by: Real-world wearable data validation: ECG-derived sleep consistency metrics correlate with PSQI.
- Racial/ethnic differences in sleep disturbances: the multi-ethnic study of atherosclerosis (mesa). Sleep 38 (6), pp. 877–888. Cited by: Table 14, 4th item, PSG cohorts.
- Unobtrusive sleep monitoring using smartphones. In 2013 7th International Conference on Pervasive Computing Technologies for Healthcare and Workshops, pp. 145–152. Cited by: Introduction.
- State of the science and recommendations for using wearable technology in sleep and circadian research. Sleep 47 (4), pp. zsad325. Cited by: Introduction.
- Artificial-intelligence-enhanced mobile system for cardiovascular health management. Sensors 21 (3), pp. 773. Cited by: Joint analysis of Holter-level cardiac metrics and sleep metrics.
- PhysioBank, physiotoolkit, and physionet: components of a new research resource for complex physiologic signals. circulation 101 (23), pp. e215–e220. Cited by: Introduction.
- Components of a new research resource for complex physiologic signals. PhysioBank, PhysioToolkit, and Physionet. Cited by: Table 14, Table 14.
- Association between sleep disorders, obesity, and exercise: a review. Nature and science of sleep, pp. 27–35. Cited by: Introduction.
- Cardiolearn: a cloud deep learning service for cardiac disease detection from electrocardiogram. In Companion Proceedings of the Web Conference 2020, pp. 148–152. Cited by: Joint analysis of Holter-level cardiac metrics and sleep metrics.
- HOLMES: health online model ensemble serving for deep learning models in intensive care units. In Proceedings of the 26th ACM SIGKDD International Conference on Knowledge Discovery & Data Mining, pp. 1614–1624. Cited by: Development of deep learning model.
- Development of the polysomnographic database on cd-rom. Psychiatry and clinical neurosciences 53 (2), pp. 175–177. Cited by: Introduction.
- Analysis of a sleep-dependent neuronal feedback loop: the slow-wave microcontinuity of the eeg. IEEE Transactions on Biomedical Engineering 47 (9), pp. 1185–1194. Cited by: Introduction.
- The siesta project polygraphic and clinical database. IEEE Engineering in Medicine and Biology Magazine 20 (3), pp. 51–57. Cited by: Table 14.
- Recent advances in wearable sensors and portable electronics for sleep monitoring. Iscience 24 (5). Cited by: Introduction.
- At-home wireless sleep monitoring patches for the clinical assessment of sleep quality and sleep apnea. Science Advances 9 (21), pp. eadg9671. Cited by: Introduction.
- Neurocognitive impairment in obstructive sleep apnea. Chest 141 (6), pp. 1601–1610. Cited by: Introduction.
- Sleep stage identification using the combination of elm and pso based on ecg signal and hrv. In 2018 3rd International Conference on Computer and Communication Systems (ICCCS), pp. 258–262. Cited by: Introduction.
- A deep learning-based algorithm for detection of cortical arousal during sleep. Sleep 43 (12), pp. zsaa120. Cited by: Introduction.
- Transfer learning from ecg to ppg for improved sleep staging from wrist-worn wearables. Physiological measurement 42 (4), pp. 044004. Cited by: Introduction.
- Deep learning in the cross-time frequency domain for sleep staging from a single-lead electrocardiogram. Physiological measurement 39 (12), pp. 124005. Cited by: Table 14, Introduction.
- A passive and portable system for monitoring heart rate and detecting sleep apnea and arousals: preliminary validation. In 1st Transdisciplinary Conference on Distributed Diagnosis and Home Healthcare, 2006. D2H2., pp. 51–54. Cited by: Introduction.
- Opportunities for utilizing polysomnography signals to characterize obstructive sleep apnea subtypes and severity. Physiological measurement 39 (9), pp. 09TR01. Cited by: Introduction.
- A review of obstructive sleep apnea detection approaches. IEEE journal of biomedical and health informatics 23 (2), pp. 825–837. Cited by: Introduction.
- Automated sleep arousal detection based on eeg envelograms. In 2018 Computing in Cardiology Conference (CinC), Vol. 45, pp. 1–4. Cited by: Introduction.
- The sleep heart health study: design, rationale, and methods. Sleep 20 (12), pp. 1077–1085. Cited by: Table 14, 4th item, PSG cohorts.
- Sleep stage classification from heart-rate variability using long short-term memory neural networks. Scientific reports 9 (1), pp. 14149. Cited by: Table 14, Introduction.
- Automatic detection of target regions of respiratory effort-related arousals using recurrent neural networks. In 2018 Computing in Cardiology Conference (CinC), Vol. 45, pp. 1–4. Cited by: Introduction.
- The familial aggregation of obstructive sleep apnea.. American journal of respiratory and critical care medicine 151 (3), pp. 682–687. Cited by: 4th item.
- A review of signals used in sleep analysis. Physiological measurement 35 (1), pp. R1. Cited by: Introduction.
- An obstructive sleep apnea detection approach using a discriminative hidden markov model from ecg signals. IEEE Transactions on Biomedical Engineering 63 (7), pp. 1532–1542. Cited by: Introduction.
- Sleep staging from electrocardiography and respiration with deep learning. Sleep 43 (7), pp. zsz306. Cited by: Table 14, Introduction.
- Deep adaptation network for subject-specific sleep stage classification based on a single-lead ecg. Biomedical Signal Processing and Control 75, pp. 103548. Cited by: Introduction.
- Ensemble computational intelligent for insomnia sleep stage detection via the sleep ecg signal. IEEE Access 10, pp. 108710–108721. Cited by: Introduction.
- Deep convolutional recurrent model for automatic scoring sleep stages based on single-lead ecg signal. Diagnostics 12 (5), pp. 1235. Cited by: Table 14, Introduction.
- Automatic sleep stage classification using weighted elm and pso on imbalanced data from single lead ecg. Procedia Computer Science 157, pp. 321–328. Cited by: Introduction.
- Objective measurements of sleep for non-laboratory settings as alternatives to polysomnography–a systematic review. Journal of sleep research 20 (1pt2), pp. 183–200. Cited by: Introduction.
- Emotion, emotion regulation and sleep: an intimate relationship. AIMS neuroscience 5 (1), pp. 1. Cited by: Introduction.
- A novel algorithm for the automatic detection of sleep apnea from single-lead ecg. IEEE transactions on biomedical engineering 62 (9), pp. 2269–2278. Cited by: Introduction.
- Attention is all you need. Advances in neural information processing systems 30. Cited by: Development of deep learning model.
- Sleep, recovery, and metaregulation: explaining the benefits of sleep. Nature and science of sleep, pp. 171–184. Cited by: Introduction.
- Phenome-wide analysis of diseases in relation to objectively measured sleep traits and comparison with subjective sleep traits in 88,461 adults. Health data science 5, pp. 0161. Cited by: Introduction.
- The research of sleep staging based on single-lead electrocardiogram and deep neural network. Biomedical engineering letters 8, pp. 87–93. Cited by: Table 14, Introduction.
- A multi-class automatic sleep staging method based on long short-term memory network using single-lead electrocardiogram signals. IEEE Access 7, pp. 85959–85970. Cited by: Table 14, Introduction.
- The national sleep research resource: towards a sleep data commons. Journal of the American Medical Informatics Association 25 (10), pp. 1351–1358. Cited by: 4th item.
- Dual-modal and multi-scale deep neural networks for sleep staging using eeg and ecg signals. Biomedical Signal Processing and Control 66, pp. 102455. Cited by: Introduction.
- Artificial intelligence-enabled 8-channel ecg diagnosing of abnormalities with wide qrs complexes: a cohort study. Health Data Science. Cited by: Introduction.
- Sleep and sleep disturbances: biological basis and clinical implications. Cellular and Molecular Life Sciences 64, pp. 1174–1186. Cited by: Introduction.
Appendix A Cohort-specific training and validation results
| Cohort | Class | Accuracy | Weighted F1 | Macro AUC | |
| CFS | 5-class | 0.841 [0.839, 0.843] | 0.835 [0.834, 0.837] | 0.776 [0.774, 0.779] | 0.959 [0.959, 0.960] |
| 4-class | 0.856 [0.854, 0.857] | 0.856 [0.854, 0.858] | 0.792 [0.789, 0.794] | 0.971 [0.971, 0.972] | |
| 3-class | 0.910 [0.909, 0.912] | 0.911 [0.909, 0.912] | 0.845 [0.843, 0.848] | 0.981 [0.980, 0.981] | |
| 2-class | 0.945 [0.944, 0.946] | 0.945 [0.944, 0.946] | 0.875 [0.872, 0.877] | 0.984 [0.984, 0.985] | |
| MESA | 5-class | 0.648 [0.647, 0.650] | 0.624 [0.623, 0.626] | 0.478 [0.477, 0.480] | 0.849 [0.848, 0.849] |
| 4-class | 0.699 [0.698, 0.701] | 0.686 [0.685, 0.688] | 0.518 [0.516, 0.520] | 0.864 [0.864, 0.865] | |
| 3-class | 0.758 [0.757, 0.760] | 0.755 [0.754, 0.757] | 0.584 [0.582, 0.587] | 0.881 [0.881, 0.882] | |
| 2-class | 0.847 [0.846, 0.848] | 0.846 [0.845, 0.847] | 0.672 [0.670, 0.674] | 0.910 [0.909, 0.911] | |
| MrOS | 5-class | 0.839 [0.838, 0.840] | 0.827 [0.826, 0.828] | 0.758 [0.757, 0.760] | 0.954 [0.954, 0.954] |
| 4-class | 0.863 [0.862, 0.864] | 0.863 [0.862, 0.864] | 0.788 [0.786, 0.789] | 0.970 [0.970, 0.971] | |
| 3-class | 0.900 [0.899, 0.900] | 0.900 [0.899, 0.901] | 0.831 [0.830, 0.832] | 0.977 [0.977, 0.977] | |
| 2-class | 0.929 [0.928, 0.929] | 0.929 [0.928, 0.929] | 0.853 [0.852, 0.854] | 0.980 [0.980, 0.980] | |
| SHHS | 5-class | 0.646 [0.645, 0.647] | 0.628 [0.626, 0.629] | 0.467 [0.465, 0.469] | 0.848 [0.848, 0.849] |
| 4-class | 0.672 [0.671, 0.673] | 0.663 [0.662, 0.664] | 0.486 [0.484, 0.488] | 0.862 [0.861, 0.862] | |
| 3-class | 0.784 [0.783, 0.785] | 0.780 [0.779, 0.781] | 0.582 [0.579, 0.584] | 0.891 [0.890, 0.892] | |
| 2-class | 0.897 [0.896, 0.898] | 0.893 [0.892, 0.893] | 0.680 [0.678, 0.682] | 0.920 [0.919, 0.921] |
| Dataset | Accuracy | Precision | Recall | Specificity | F1-Score | AUC |
| CFS | 0.911 [0.910, 0.912] | 0.618 [0.611, 0.625] | 0.628 [0.621, 0.636] | 0.949 [0.947, 0.950] | 0.623 [0.618, 0.629] | 0.914 [0.912, 0.916] |
| MESA | 0.812 [0.811, 0.813] | 0.438 [0.435, 0.441] | 0.568 [0.564, 0.571] | 0.859 [0.858, 0.860] | 0.495 [0.492, 0.498] | 0.808 [0.806, 0.809] |
| MrOS | 0.891 [0.890, 0.891] | 0.574 [0.571, 0.577] | 0.617 [0.615, 0.620] | 0.932 [0.931, 0.932] | 0.595 [0.592, 0.597] | 0.901 [0.901, 0.902] |
| SHHS | 0.843 [0.842, 0.844] | 0.551 [0.549, 0.554] | 0.622 [0.620, 0.625] | 0.891 [0.890, 0.891] | 0.585 [0.583, 0.587] | 0.854 [0.853, 0.856] |
| Dataset | Accuracy | Precision | Recall | Specificity | F1-Score | AUC |
| CFS | 0.868 [0.867, 0.870] | 0.325 [0.319, 0.332] | 0.490 [0.482, 0.499] | 0.904 [0.902, 0.906] | 0.391 [0.384, 0.398] | 0.841 [0.838, 0.844] |
| MESA | 0.747 [0.746, 0.748] | 0.173 [0.171, 0.176] | 0.447 [0.442, 0.451] | 0.778 [0.777, 0.779] | 0.250 [0.247, 0.253] | 0.686 [0.683, 0.688] |
| MrOS | 0.861 [0.860, 0.862] | 0.237 [0.234, 0.239] | 0.390 [0.386, 0.393] | 0.899 [0.898, 0.900] | 0.295 [0.292, 0.297] | 0.793 [0.791, 0.794] |
| SHHS | 0.717 [0.715, 0.718] | 0.468 [0.466, 0.470] | 0.657 [0.655, 0.659] | 0.738 [0.736, 0.739] | 0.547 [0.545, 0.548] | 0.769 [0.768, 0.770] |
![[Uncaptioned image]](2603.18714v1/figs/appendix_a_1.png)
![[Uncaptioned image]](2603.18714v1/figs/appendix_a_2.png)
Appendix B Ablation Study
To quantify the contribution of key design choices under a controlled computational budget, all ablation experiments were conducted on the CFS cohort, while keeping the training and evaluation protocol consistent with the main experiments. We investigate (i) feature fusion, (ii) model composition within the two-stage framework, and (iii) the multi-frame window length used by the Transformer-based temporal refinement module.
B.1 Feature fusion
Feature Fusion Accuracy Weighted F1 Macro AUC With Fusion 0.842 0.835 0.776 0.959 Without Fusion 0.823 0.819 0.748 0.949
Feature Fusion Task Accuracy Precision Recall Specificity F1-Score AUC With Fusion Arousal 0.911 0.618 0.628 0.949 0.623 0.914 Respiratory 0.868 0.325 0.490 0.904 0.391 0.841 Without Fusion Arousal 0.900 0.569 0.629 0.936 0.597 0.902 Respiratory 0.847 0.365 0.543 0.884 0.437 0.835
B.2 Model comparison
Model Accuracy Weighted F1 Macro AUC Net1D 0.735 0.728 0.630 0.912 Transformer 0.756 0.743 0.651 0.912 Net1D + Transformer 0.791 0.780 0.703 0.924
Model Task Accuracy Precision Recall Specificity F1-Score AUC CNN Net1D Arousal 0.884 0.510 0.563 0.927 0.535 0.868 Respiratory 0.741 0.192 0.532 0.763 0.283 0.734 Transformer Arousal 0.705 0.197 0.487 0.734 0.281 0.662 Respiratory 0.530 0.133 0.711 0.511 0.225 0.647 CNN Net1D + Transformer Arousal 0.887 0.514 0.602 0.924 0.555 0.878 Respiratory 0.816 0.302 0.522 0.852 0.383 0.793
B.3 Multi-frame window size
Window size Accuracy Weighted F1 Macro AUC 1 0.791 0.780 0.703 0.924 3 0.824 0.814 0.750 0.945 5 0.833 0.824 0.763 0.951 7 0.838 0.830 0.771 0.955 9 0.841 0.834 0.775 0.958 11 0.836 0.830 0.768 0.956 13 0.839 0.831 0.772 0.956 15 0.842 0.835 0.776 0.959 17 0.842 0.836 0.775 0.958 19 0.842 0.837 0.776 0.959 21 0.838 0.833 0.771 0.957
Window size Task Accuracy Precision Recall Specificity F1-Score AUC 1 Arousal 0.887 0.514 0.602 0.924 0.555 0.878 Respiratory 0.816 0.302 0.522 0.852 0.383 0.793 3 Arousal 0.897 0.556 0.625 0.934 0.588 0.899 Respiratory 0.838 0.344 0.534 0.875 0.418 0.824 5 Arousal 0.903 0.583 0.595 0.944 0.589 0.898 Respiratory 0.845 0.359 0.529 0.884 0.428 0.827 7 Arousal 0.902 0.578 0.602 0.942 0.590 0.898 Respiratory 0.849 0.366 0.525 0.889 0.432 0.830 9 Arousal 0.898 0.563 0.606 0.937 0.584 0.895 Respiratory 0.843 0.357 0.544 0.880 0.431 0.828 11 Arousal 0.898 0.560 0.614 0.936 0.586 0.896 Respiratory 0.838 0.349 0.563 0.871 0.431 0.830 13 Arousal 0.905 0.592 0.622 0.943 0.607 0.906 Respiratory 0.850 0.373 0.543 0.888 0.442 0.840 15 Arousal 0.911 0.618 0.628 0.949 0.623 0.914 Respiratory 0.868 0.325 0.490 0.904 0.391 0.841 17 Arousal 0.902 0.578 0.628 0.939 0.602 0.904 Respiratory 0.854 0.379 0.517 0.896 0.438 0.837 19 Arousal 0.906 0.597 0.613 0.945 0.605 0.904 Respiratory 0.857 0.387 0.526 0.897 0.446 0.840 21 Arousal 0.900 0.568 0.618 0.937 0.592 0.898 Respiratory 0.852 0.374 0.520 0.893 0.435 0.834
Appendix C Comparison of Existing Studies
| Study | Classes | Dataset(s) | Acc | ||
| Wei et al. (2018) 46 | 3 | MIT–BIH Polysomnographic Database 11 | 18 | 0.560 | 0.770 |
| Urtnasan et al. (2022) 38 | 3 | Private dataset | 112 | – | 0.860 |
| Li et al. (2018) 24 | 4 | MIT–BIH Polysomnographic Database 11 | 18 | 0.540 | 0.756 |
| Wei et al. (2019) 47 | 4 | Xijing Hospital dataset (FMMU) | 238 | 0.550 | 0.778 |
| Radha et al. (2019) 30 | 4 | Siesta database 17 | 588 | 0.610 | 0.770 |
| Sun et al. (2020) 35 | 5 | MGH Cohort | 8682 | 0.490 | – |
| Holter-to-Sleep (this study) | 5 | MESA 6 + MrOS 3 + SHHS 29 | 9730 | 0.670 | 0.773 |
Appendix D Supplementary Methods
D.1 Input representation and embedding dimensionality
Each 30-s epoch was represented by (i) a time-domain single-lead ECG segment (stored as a 1D vector of length 3000 with an explicit channel dimension) and (ii) an epoch-aligned frequency-domain feature vector (39 dimensions). The epoch-level feature extractor was a Net1D-style architecture with attention-based aggregation for the time-domain backbone output, and a lightweight feed-forward mapping with attention weighting for the frequency-domain features. The final epoch embedding was obtained by concatenating a 1024-dimensional time-domain representation and a 128-dimensional frequency-domain representation, resulting in a 1152-dimensional embedding per epoch.
D.2 Transformer architectures and context-window definition
Sleep-staging Transformer (sequence-level).
The sleep-staging Transformer used a batch-first Transformer Encoder with learnable positional embeddings. For each epoch, we formed a local context window of length (7 preceding epochs, the current epoch, and 7 following epochs). The 15 epoch embeddings (each 1152-dimensional) within the window were concatenated to form the input vector of a single token, yielding a token input dimension of . The model projected tokens to hidden size , added positional embeddings, and applied a -layer Transformer Encoder ( heads, feed-forward dimension , dropout 0.1). The classifier produced 5-class sleep-stage logits for each token in the sequence. Because the number of epochs varies across recordings, sequences were padded within a batch; loss computation ignored padded positions via an ignore_index mask.
Sleep-event Transformer (window-level).
For event detection, each local window () was treated as an individual sample with input shape . After linear projection to , a -layer Transformer Encoder (, dropout 0.1) generated contextualized hidden states. The center-token representation was used as a shared embedding for two parallel binary classifiers, producing arousal and respiratory logits, respectively.
D.3 Training configuration and hyperparameters
Sleep-staging CNN (epoch-level).
We used Adam with learning rate and weight decay , trained for 50 epochs with batch size 256. A ReduceLROnPlateau scheduler was applied (patience=10, factor=0.3), and early stopping was performed based on validation loss (patience=5). Training supported distributed data parallelism (DDP) and automatic mixed precision (AMP).
Sleep-staging Transformer.
We used Adam with learning rate , batch size 64, and up to 100 epochs, with early stopping based on validation loss (patience=5). The context window length was with stride 1. Cross-entropy loss was computed with padded labels ignored by ignore_index.
Multitask sleep-event CNN.
The multitask CNN shared a Net1D encoder and used two binary classification heads. We used AdamW with learning rate and weight decay , trained for 50 epochs with batch size 128. ReduceLROnPlateau was applied (patience=5, factor=0.3) with early stopping (patience=3). During training, small additive Gaussian noise (standard deviation 0.01) was used for augmentation. Training supported DDP and AMP.
Sleep-event Transformer.
We used Adam with learning rate , batch size 16, and up to 200 epochs, with early stopping based on validation loss (patience=6). The context window length was with stride 1, and logits were computed from the center-token representation using two parallel binary heads.
D.4 Split unit and generation of file lists
Train/validation/test splits were performed at the recording-file level (one .npz file per overnight recording). All .npz paths were collected recursively from the specified directories and randomly split with a fixed seed. We first assigned 60% of files to training; the remaining 40% was equally divided into validation and test sets (20%/20%). The resulting file lists were written to train_paths.txt, val_paths.txt, and test_paths.txt. All training and evaluation scripts used these lists as the sole data input, ensuring reproducible splits and results.
D.5 Threshold selection for binary tasks
For binary event detection, the model outputs were converted to positive-class probabilities via softmax. The decision threshold was determined on the validation set by grid search: we evaluated 100 equally spaced candidates in and selected the threshold that maximized the F1-score. The selected threshold was then fixed for test evaluation, reporting Accuracy, Precision, Recall, Specificity, F1-score, and AUC.
D.6 Bootstrap unit and confidence intervals
We used nonparametric bootstrap to quantify metric uncertainty. The resampling unit was the epoch (30-s segment): the evaluation set was flattened into an epoch-level sample list, which was resampled with replacement for 1000 replicates. For each replicate, the target metric was computed, and the 2.5th and 97.5th percentiles of the bootstrap distribution were used to construct a 95% confidence interval; the bootstrap mean was reported as the point estimate.
Appendix E List of sleep and Holter-grade cardiac metrics
For reproducibility and reference, this appendix summarizes the sleep-related metrics (16 items) and Holter-grade cardiac metrics (32 items) used in this study.
| Sleep metrics (16) | Holter-grade cardiac metrics (32) |
|
AHI (events h-1)
ArI (events h-1) N1 / TST (%) N2 / TST (%) N3 / TST (%) NREM / TST (%) REM / TST (%) SE (%) SL (min) TIB (min) TST (min) TTSP (min) WASO (min) Wake / TIB (%) ODI 3% (events h-1) ODI 4% (events h-1) |
Total_valid_beats
Avg_HR Min_HR Max_HR Snt_max_beat_count Snt_duration Snb_max_beat_count Snb_duration Total_PAC Single_PAC Paired_PAC Bigeminy_PAC Triad_PAC Total_PVC Single_PVC Paired_PVC Bigeminy_PVC Triad_PVC Total_VT Total_SVT SDNN SDANN SDANNIndex RMSSD pNN50 HRV_tri LF HF LFNU HFNU LF/HF AF_duration |
Appendix F Handcrafted frequency and time–frequency features
| Frequency Domain Features | Time-Frequency Features |
| 1. Delta Power | Energy Features: Energy calculated for each wavelet decomposition level (5 levels, first-level coefficients for each level) |
| 2. Theta Power | Statistical Features: Statistical features computed for each wavelet decomposition level (5 5 matrix, 5 features per decomposition level), including: |
| 3. Alpha Power | 1. Mean |
| 4. Total Power | 2. Standard Deviation |
| 5. Peak Frequency | 3. Variance |
| 6. Spectral Centroid | 4. Maximum Value |
| 7. Spectral Bandwidth | 5. Minimum Value |
| 8. Spectral Flatness | |
| 9. Spectral Entropy |
Appendix G Detailed tables for joint sleep–Holter stratified analyses
This appendix reports the complete metric tables used in the joint sleep–Holter stratified analyses. Values are presented as mean standard deviation. P-values are from two-sided statistical tests; extremely small P-values are reported as “<0.001”, otherwise rounded to three decimals.
G.1 Frequent PVC vs non-frequent PVC
Metric Frequent PVC (n=1,248) Non-frequent PVC (n=9,191) P-value Age (years) 69.83 14.31 66.29 12.84 <0.001 BMI (kg m-2) 28.51 5.66 28.25 5.29 0.250 AHI (events h-1) 21.48 18.03 19.11 16.86 <0.001 ArI (events h-1) 31.36 18.09 29.13 15.38 <0.001 N1 % of TST 7.87 7.10 7.19 6.23 <0.001 N2 % of TST 59.56 11.85 58.01 11.33 <0.001 N3 % of TST 13.93 11.47 15.22 11.44 <0.001 NREM % of TST 81.36 7.17 80.42 6.57 <0.001 REM % of TST 18.64 7.17 19.58 6.57 <0.001 SE (%) 62.85 15.07 68.70 14.25 <0.001 SL (min) 68.59 66.18 50.96 55.26 <0.001 TIB (min) 553.12 81.75 529.91 78.58 <0.001 TST (min) 342.80 77.32 358.47 66.20 <0.001 TTSP (min) 443.97 82.54 438.50 69.40 0.002 WASO (min) 101.18 71.44 80.02 57.92 <0.001 Wake % of TIB 37.15 15.07 31.30 14.25 <0.001 ODI 3% (events h-1) 7.58 10.75 6.20 9.59 <0.001 ODI 4% (events h-1) 4.38 7.62 3.61 7.15 <0.001
G.2 Frequent PAC vs non-frequent PAC
Metric Frequent PAC (n=2,022) Non-frequent PAC (n=8,417) P-value Age (years) 68.96 16.03 66.17 12.20 <0.001 BMI (kg m-2) 28.08 5.26 28.33 5.35 0.074 AHI (events h-1) 22.09 19.38 18.74 16.34 <0.001 ArI (events h-1) 32.35 18.85 28.69 14.81 <0.001 N1 % of TST 8.00 6.89 7.10 6.19 <0.001 N2 % of TST 59.25 11.68 57.94 11.32 <0.001 N3 % of TST 14.14 11.75 15.29 11.37 <0.001 NREM % of TST 81.39 6.95 80.33 6.56 <0.001 REM % of TST 18.61 6.95 19.67 6.56 <0.001 SE (%) 63.67 14.86 69.04 14.18 <0.001 SL (min) 64.31 63.75 50.37 54.86 <0.001 TIB (min) 548.36 81.56 528.92 78.31 <0.001 TST (min) 344.11 74.81 359.60 65.67 <0.001 TTSP (min) 442.30 79.98 438.39 68.81 0.006 WASO (min) 98.19 69.37 78.79 57.00 <0.001 Wake % of TIB 36.33 14.86 30.96 14.18 <0.001 ODI 3% (events h-1) 7.86 11.61 6.00 9.21 <0.001 ODI 4% (events h-1) 4.61 8.46 3.49 6.86 <0.001
G.3 Atrial fibrillation during sleep: AF present vs absent
Metric AF present (n=1,162) AF absent (n=9,277) P-value Age (years) 65.62 19.41 66.85 12.03 <0.001 BMI (kg m-2) 28.13 5.34 28.30 5.33 0.535 AHI (events h-1) 20.87 18.79 19.21 16.77 0.104 ArI (events h-1) 30.69 18.20 29.24 15.40 0.204 N1 % of TST 7.22 6.22 7.28 6.36 0.572 N2 % of TST 59.11 11.90 58.08 11.34 <0.001 N3 % of TST 14.77 12.40 15.10 11.33 0.019 NREM % of TST 81.10 6.85 80.46 6.62 <0.001 REM % of TST 18.90 6.85 19.54 6.62 <0.001 SE (%) 65.73 13.87 68.28 14.52 <0.001 SL (min) 63.98 63.25 51.69 55.96 <0.001 TIB (min) 548.11 79.79 530.74 79.05 <0.001 TST (min) 355.18 68.35 356.78 67.74 0.162 TTSP (min) 448.31 74.01 437.99 70.67 <0.001 WASO (min) 93.12 68.13 81.22 58.86 <0.001 Wake % of TIB 34.27 13.87 31.72 14.52 <0.001 ODI 3% (events h-1) 7.56 11.51 6.21 9.49 <0.001 ODI 4% (events h-1) 4.45 8.42 3.61 7.03 <0.001
G.4 Ventricular tachycardia during sleep: VT present vs absent
Metric VT present (n=489) VT absent (n=9,950) P-value Age (years) 69.93 15.16 66.56 12.94 <0.001 BMI (kg m-2) 28.66 5.91 28.26 5.30 0.468 AHI (events h-1) 20.99 16.74 19.32 17.03 0.001 ArI (events h-1) 30.00 16.49 29.37 15.71 0.388 N1 % of TST 7.18 5.73 7.28 6.37 0.617 N2 % of TST 60.24 11.70 58.10 11.38 <0.001 N3 % of TST 13.57 11.40 15.14 11.45 <0.001 NREM % of TST 80.99 6.88 80.51 6.64 0.091 REM % of TST 19.01 6.88 19.49 6.64 0.091 SE (%) 63.26 14.32 68.23 14.44 <0.001 SL (min) 74.05 66.62 52.04 56.24 <0.001 TIB (min) 564.65 81.98 531.11 78.86 <0.001 TST (min) 352.44 75.06 356.80 67.43 0.217 TTSP (min) 454.35 78.17 438.40 70.68 <0.001 WASO (min) 101.91 69.93 81.60 59.40 <0.001 Wake % of TIB 36.74 14.32 31.77 14.44 <0.001 ODI 3% (events h-1) 7.68 10.32 6.30 9.72 <0.001 ODI 4% (events h-1) 4.43 7.33 3.67 7.20 <0.001
G.5 Median-split stratification by nocturnal mean heart rate
Metric High HR (64) (n=5301) Low HR (64) (n=5138) P-value Age (years) 64.80 13.65 68.69 12.14 <0.001 BMI (kg m-2) 28.86 5.77 27.68 4.77 <0.001 AHI (events h-1) 20.01 18.07 18.76 15.84 0.087 ArI (events h-1) 29.58 16.42 29.21 15.01 0.695 N1 % of TST 7.30 6.56 7.25 6.10 0.292 N2 % of TST 57.79 11.81 58.62 10.96 <0.001 N3 % of TST 15.75 11.79 14.36 11.06 <0.001 NREM % of TST 80.84 6.74 80.22 6.55 <0.001 REM % of TST 19.16 6.74 19.78 6.55 <0.001 SE (%) 68.33 14.77 67.65 14.15 <0.001 SL (min) 51.47 55.00 54.72 58.87 0.025 TIB (min) 526.84 76.27 538.72 81.92 <0.001 TST (min) 354.87 70.07 358.38 65.35 0.081 TTSP (min) 435.02 71.77 443.41 70.20 <0.001 WASO (min) 80.15 60.39 85.03 59.68 <0.001 Wake % of TIB 31.67 14.77 32.35 14.15 <0.001 ODI 3% (events h-1) 6.81 10.62 5.90 8.74 <0.001 ODI 4% (events h-1) 4.04 7.94 3.36 6.34 <0.001
G.6 HRV quantile-based stratification: SDANN as an example
Metric High SDANN (198.19) (n=2,609) Low SDANN (114.15) (n=2,610) P-value Age (years) 68.38 12.35 65.17 13.90 <0.001 BMI (kg m-2) 27.84 5.11 28.90 5.93 <0.001 AHI (events h-1) 19.08 16.73 19.71 17.55 0.394 ArI (events h-1) 29.23 15.55 29.44 16.04 0.776 N1 % of TST 6.87 5.77 7.25 6.76 0.360 N2 % of TST 58.33 11.27 58.28 11.92 0.972 N3 % of TST 15.13 11.52 15.45 11.75 0.352 NREM % of TST 80.32 6.57 80.99 6.67 <0.001 REM % of TST 19.68 6.57 19.01 6.67 <0.001 SE (%) 66.90 14.18 69.60 14.95 <0.001 SL (min) 52.99 57.29 50.50 54.52 0.172 TIB (min) 538.68 82.20 521.79 74.35 <0.001 TST (min) 354.52 66.65 357.98 69.73 0.002 TTSP (min) 437.33 72.70 438.47 69.53 0.269 WASO (min) 82.81 60.14 80.49 59.51 0.121 Wake % of TIB 33.10 14.18 30.40 14.95 <0.001 ODI 3% (events h-1) 6.33 9.40 6.60 10.27 0.615 ODI 4% (events h-1) 3.70 6.94 3.88 7.55 0.626
Appendix H Pittsburgh Sleep Quality Index (PSQI)
![[Uncaptioned image]](2603.18714v1/figs/psqi_1.png)
![[Uncaptioned image]](2603.18714v1/figs/psqi_2.png)
![[Uncaptioned image]](2603.18714v1/figs/psqi_3.png)
![[Uncaptioned image]](2603.18714v1/figs/psqi_4.png)
![[Uncaptioned image]](2603.18714v1/figs/psqi_5.png)