MXDFz4.4: A LyC emitter after the epoch of reionization and a first test of Ly morphology as a tracer of LyC escape at high redshift
Abstract
Assessing the contribution of ionizing sources to cosmic reionization is a central goal of extragalactic astrophysics. Understanding and quantifying ionizing escape remains challenging near the epoch of reionization. We present the highest-redshift Lyman continuum (LyC) emitter detected to date, MXDFz4.4, at in the MUSE eXtremely Deep Field, observed only after the end of reionization. A high-confidence Ly line confirms the redshift. LyC flux is detected at in the F435W filter with a flux of , corresponding to a flux measurement at . After correcting for the intrinsic production of LyC photons and the IGM opacity at , we derive high escape fractions, , ranging from . We apply established low-redshift tracers of LyC escape and, for the first time at this redshift, promising Ly morphological tracers such as the halo fraction. SED fitting indicates the presence of a recent burst of star formation; we explore its impact on the production and escape of ionizing photons. Ly-based tracers of reveal a complex scenario in which the recent burst strongly influences LyC production and escape, combined with a more evolved stellar population. This interpretation is supported by UV diagnostics, including and sSFR. Our results provide cautious support for the Ly halo fraction as a LyC escape tracer at high redshift. Considering the burst-driven enhancement in ionizing photon production and escape, we conclude that stochastic star formation in the early universe likely plays a significant role in the contribution of galaxies to cosmic reionization.
show]igoovaerts@stsci.edu
]mrafelski@stsci.edu
]alexander.beckett@lam.fr
]grecco.oyarzun@ou.edu
]
]knedkova@caltech.edu
]
]akoekemoer@stsci.edu
]mrevalski@stsci.edu
]
]
]
]
]
I Introduction
The contribution of ionizing sources to the process of cosmic reionization is a central topic of extra-galactic astrophysics and a key goal of the JWST mission. With the first years of JWST data, significant progress has been made in two of three necessary quantities to constrain this contribution: the star formation rate (SFR) density and the production of ionizing photons (per unit SFR). The SFR density during the epoch of reionization (EoR) is determined by the UV luminosity function (LF), which has been robustly constrained with photometry (Donnan et al., 2024; Finkelstein et al., 2024; Asada et al., 2025) and spectroscopy (Harikane et al., 2024) up to . Similarly, the production of ionizing photons has been quantified by recent works (Simmonds et al., 2023; Pahl et al., 2025; Llerena et al., 2025; Hayes et al., 2025), with excellent statistics, revealing only slight or no evolution with redshift. The third necessary quantity, the escape fraction of ionizing photons, , remains elusive.
Ionizing flux cannot be directly observed in the EoR, due to absorption of ionizing photons by the intervening neutral HI gas in the inter-galactic medium (IGM). Therefore, must first be understood at lower redshifts, and indirect tracers established, which we can use to quantify the escape of ionizing photons within the EoR. Significant progress has been made in recent years by the Low-z Lyman Continuum Survey (LzLCS: Flury et al. 2022b, see also Chisholm et al. 2022; Le Reste et al. 2025) — which has studied in detail 35 Lyman continuum emitters (LCEs) at — and by other studies (Izotov et al., 2016; Verhamme et al., 2017; Izotov et al., 2020, 2022, 2024b, see Jaskot 2025 for a review). The most important findings are that (i) Ly properties, such as equivalent width (EW) and escape fraction (), correlate well with (Henry et al., 2015; Verhamme et al., 2017; Steidel et al., 2018; Flury et al., 2022a) and that (ii) the Ly line separation from the systemic redshift and the halo fraction show a strong anti-correlation with (Verhamme et al., 2015; Izotov et al., 2018b, 2020; Flury et al., 2022a; Saldana-Lopez et al., 2026). Combined, these results connecting Ly and LyC emission highlight the importance of clear channels in HI column density in allowing the escape of Lyman photons from the interstellar medium of the host galaxy.
Other galaxy properties that have been found to correlate well with include SFR surface density, (Izotov et al., 2016; Vanzella et al., 2018; Flury et al., 2022a; Jaskot et al., 2024), steep, blue UV slopes (, Chisholm et al., 2022; Ji et al., 2025), the strength of the [O III]/[O II] ratio (Izotov et al., 2018b, 2020; Jaskot et al., 2024), and the presence of strong UV lines such as CIV (Schaerer et al., 2022; Saxena et al., 2022; Izotov et al., 2024a). High likely contributes to the creation of clear channels crucial to LyC escape, steep UV slopes are attributed to the role of dust in blocking LyC photons, and High [O III]/[O II] ratios in LCEs have been associated with sensitivity to ionization parameter and feedback from massive stars.
However, no single tracer alone reliably predicts the escape of ionizing photons, underscoring the need for a framework that both links the escape of LyC photons to available tracers and assesses the importance of different variables in tracking the escape of LyC photons, such as in Maji et al. (2022); Jaskot et al. (2024). We have reached the point that such multivariate predictors can be used on the appreciable sample of low redshift LCEs collated in the literature and on simulated data (Rosdahl et al., 2022; Choustikov et al., 2024). However, due to a lack of data as comprehensive as the LzLCS for a statistically significant population at , we are not yet at this stage at these redshifts.
At , which we term “high redshift” for the purposes of this work, a number of open questions remain. Recent studies have cast doubt on the ability of Ly properties to reliably trace at high- (Rutkowski et al., 2017; Kerutt et al., 2024; Citro et al., 2025). For instance, Citro et al. (2025) found galaxies with strong Ly emission but without traces of LyC emission at the expected strength based on low-z estimators. Kerutt et al. (2024) found a diversion from the well-established relation at low redshift between and Ly peak separation (Izotov et al., 2018b) as well as large scatter in the well-established Ly EW and relation (Steidel et al., 2018).
Therefore, doubts persist over the applicability of low-redshift tracers during the EoR, which is their primary purpose. As of evolution have taken place between the EoR and low-redshift measurements, there are numerous factors which may influence the universal validity of tracers. Examples include the merger fraction, known to increase with redshift (Rodriguez-Gomez et al., 2015), the evolution of the star formation efficiency (Madau et al., 1996), and the UV background (Fan et al., 2006). It is therefore important to search for LCEs as close to the EoR as possible.
In this work, we describe the detection of an LCE at , within of the EoR, in the MUSE eXtremely Deep Field (MXDF; Bacon et al., 2023), which we henceforth refer to as MXDFz4.4. In §II we describe the MUSE data used to detect the Ly line, which confirms the redshift, as well as the HST and JWST data used to detect the LyC flux and characterize the spectral energy distribution (SED) of the galaxy. §III describes MXDFz4.4 and the necessary modeling to derive its properties: SED fitting and modeling of IGM transmission. We evaluate all accessible tracers which have been established at low redshift, focusing on the important Ly-LyC connection, in §V. Finally, we interpret this discovery in relation to the transmission of the IGM and the properties of MXDFz4.4 in §VI, offering conclusions in §VII.
Throughout this paper, we adopt a value for the Hubble constant of , and the cosmology used is and . All IMFs used are stated throughout the text and magnitudes are given in the AB mag system (Oke and Gunn, 1983). All equivalent widths are given in the rest frame unless otherwise stated.
II Data and Analysis
The MUSE eXtremly Deep Field (MXDF; GTO Program 1101.A-0127, PI R. Bacon, Bacon et al. 2023) is a region of extremely deep observations by the MUSE integral field spectrograph on the VLT, with the deepest area having a total exposure time of 141h. MUSE has a field of view of with a spatial pixel size of . The spectra have a wavelength range of and a spectral pixel size of . This wavelength coverage enables MUSE to detect Ly emission in the redshift range . All MXDF data is publicly available111https://amused.univ-lyon1.fr and viewable using a web interface222https://amused.univ-lyon1.fr/project/UDF/browse.
The MXDF is situated within the footprint of the Hubble Ultra Deep Field (HUDF; Beckwith et al., 2006), with additional public HST ACS/WFC and WFC3/UVIS imaging from programs including GOODS (Giavalisco et al., 2004), CANDELS (Grogin et al., 2011; Koekemoer et al., 2011), 3D-HST (Brammer et al., 2012), UVCANDELS (Wang et al., 2025), UVUDF (Teplitz et al., 2013), and HDUV (Oesch et al., 2018). The HST filters used in this analysis are WFC3/UVIS F336W and ACS/WFC F435W, F606W, F775W, F814W, and F850LP. The F435W filter, in which MXDFz4.4’s LyC emission is detected, has an average depth of . These data have been reprocessed as part of HST archival program PID 16621 (PI: Koekemoer), including calibration improvements from updated darks, biases, flatfields and astrometric alignments, as well as other low-level improvements including improved removal of cosmic rays, satellite trails, and bad pixels.
This field also benefits from public JWST imaging from the JADES and JEMS programs (Eisenstein et al., 2023; Rieke et al., 2023; Williams et al., 2023)333DOIs: Rieke, Marcia et al. (2023); Williams, Christina et al. (2023), where the JWST/NIRCam filters from these programs that we use are: F090W, F115W, F150W, F182M, F200W, F210M, F277W, F335M, F356W, F410M, F430M and F444W. F460M and F480M are also included in the JADES imaging data release (Rieke et al., 2023); however, we exclude these filters from our SED fitting, as visual inspection revealed elevated background levels relative to the source signal in these bands, rendering the photometry unreliable and the associated uncertainties likely underestimated.
II.1 Photometry of MXDFz4.4

We perform custom photometry on the full-resolution images to maximize the resulting flux SNR of MXDFz4.4. The segmentation map released by the JADES collaboration blends MXDFz4.4 with a faint neighbor to the southeast, so we create a custom version where these sources are carefully de-blended. We perform Kron photometry (Kron, 1980) on the full-resolution images and correct these values by 10%, consistent with curve-of-growth analysis checks we performed. We note that the neighbor is very faint, so this has minimal effects on the photometry published in Rieke et al. (2023).
As the emission in F435W is spatially far more compact than in redder filters, we apply a different method to maximize the SNR in the F435W image, similarly to the method used by Rafelski et al. (2015); Sun et al. (2024) for faint UV photometry of the UVUDF and UVCANDELS surveys. Specifically, we calculate an isophotal flux using a segmentation map based on the F606W filter, a neighboring filter where MXDFz4.4 is more compact than the detection image used by JADES, but with high enough SNR to create a reliable segmentation map. This smaller aperture fully captures the flux in the F435W filter and reduces the contribution from sky dominated pixels, thereby increasing the SNR of the flux measurements. The uncertainty on the flux within the aperture is calculated using the F435W RMS map and propagated with the uncertainty on the sky background subtraction, which is done in a wide annulus around MXDFz4.4, ensuring no flux from any object is taken into account.
We connect the F435W flux to the rest of the photometry by using an aperture correction based on the larger JADES-based isophotal area. This correction is determined by taking the ratio of the isophotal flux measured in the smaller and larger isophotal areas in the F606W image. This correction assumes that the distribution of flux is similar in F606W and F435W, which is confirmed both visually and by comparison with the F435W flux measured in the larger isophotal area. The two flux measurements agree within the smaller isophotal area uncertainties as expected. This F606W isophotal area flux measurement is then used to define the SNR of the detection. The F435W detection significance is .
To verify that correlated noise or large-scale noise patterns do not affect this detection, we calculate the flux in 1,000,000 empty sky apertures of the same size as the aperture used to detect MXDFz4.4’s F435W flux. Apertures are placed at random positions across the image, avoiding regions containing detected sources. A histogram of these fluxes is shown in Fig. 1, with MXDFz4.4’s detection flux shown with a green solid line coincident with the threshold shown in the dot-dashed gray line. The width of this distribution agrees with the formal uncertainty from the RMS map, indicating that correlated noise and large-scale patterns do not significantly affect the LyC flux measurement in F435W.
We correct for the effects of the point spread function (PSF) by applying published encircled energy corrections (similar to PSF matching) to the resultant Kron photometry, which is reasonable given the compactness of our galaxy444HST: https://www.stsci.edu/hst/instrumentation/acs/data-analysis/aperture-corrections555JWST: https://jwst-docs.stsci.edu/jwst-near-infrared-camera/nircam-performance/nircam-point-spread-functions#NIRCamPointSpreadFunctions-Encircledenergiesforresampleddata. The alternative standard method of PSF matching the images before measuring the photometry would reduce the SNR of the F435W photometry, as it would smooth the flux over the larger F444W PSF and thus increase our flux uncertainty. We confirm the validity of this method in two ways. First, we check the curves of growth of the photometry including the encircled energy correction and find convergence at large radii. Second, we compare the photometry of the redder HST and JWST photometry with this method to that of the PSF matched photometry from JADES and find good agreement. Therefore, this Kron flux corrected to the total flux (10%) plus the encircled energy correction is used as our final flux measurement. We propagate the uncertainties from each correction accordingly, together with the uncertainty in aperture flux and background subtraction. The resultant LyC flux measurement in F435W is , at . We subsequently use this photometry for the SED fitting described in §III.1.
II.2 Spectral Extraction of MXDFz4.4 from the MXDF datacube
The MUSE consortium makes their spectra public, the extraction of which follows Bacon et al. (2023). We briefly outline this procedure here, specifically that which relates to extraction using the ORIGIN software (Mary et al., 2020), as this is the method used for MXDFz4.4. The ORIGIN software is optimized to detect faint line emitters in MUSE datacubes. Care is taken to mask any bright continuum sources in a three-stage process. The first two stages involve segmenting and masking out any bright, noisy sources, firstly on the datacube itself, creating a white light continuum image, then on the S/N residual image thereof. Principal Component Analysis is then used iteratively to clean further residuals from each spaxel in the cube. Emission lines are then detected by filtering the datacube with possible spectral line profiles. Each source is then extracted from the original datacube using the algorithm from Horne (1986). These extracted spectra are publicly available for all line-emitters detected in the MXDF. We take the the spectrum for MXDFz4.4 and apply a custom fitting process which is described in Sect. V.1.1. This process also follows the line-fitting procedure for Ly lines described in Bacon et al. (2023) but allows us to extract and visualize all necessary Ly properties.
III Physical properties of MXDFz4.4


MXDFz4.4is located in the deepest section of the MXDF (exposure time ) at an RA and DEC of 53.1577218, , and a redshift (from the Ly emission line) of 4.442. This makes it the highest-redshift directly-observed LCE to date.
MXDFz4.4has an observed ratio of ionizing to non-ionizing flux, (in units), of , calculated from the F435W to F775W flux ratio. We adopt the nomenclature to denote the LyC flux detected in F435W, rather than , to differentiate from studies where the flux at exactly is used from spectra. The F435W band covers up to rest frame, but as it starts below we term this wavelength range “LyC”. A diagram of a LAE SED taken from the JAGUAR suite of mock SEDs (Williams et al., 2018), the F435W filter transmission, and Lyman limit at are shown in Fig. 2.
The values that we derive, depending on the intrinsic ratio of ionizing to non-ionizing flux and the IGM attenuation, are presented in Table 1 and discussed in §IV. The properties of MXDFz4.4 derived from SED fitting are detailed in §III.1, while the detailed analysis of the Ly emission line observed by MUSE is detailed in §V.1. The HST and JWST imaging of MXDFz4.4 is shown in Fig. 3 and the MUSE spectrum is shown in Fig. 4.
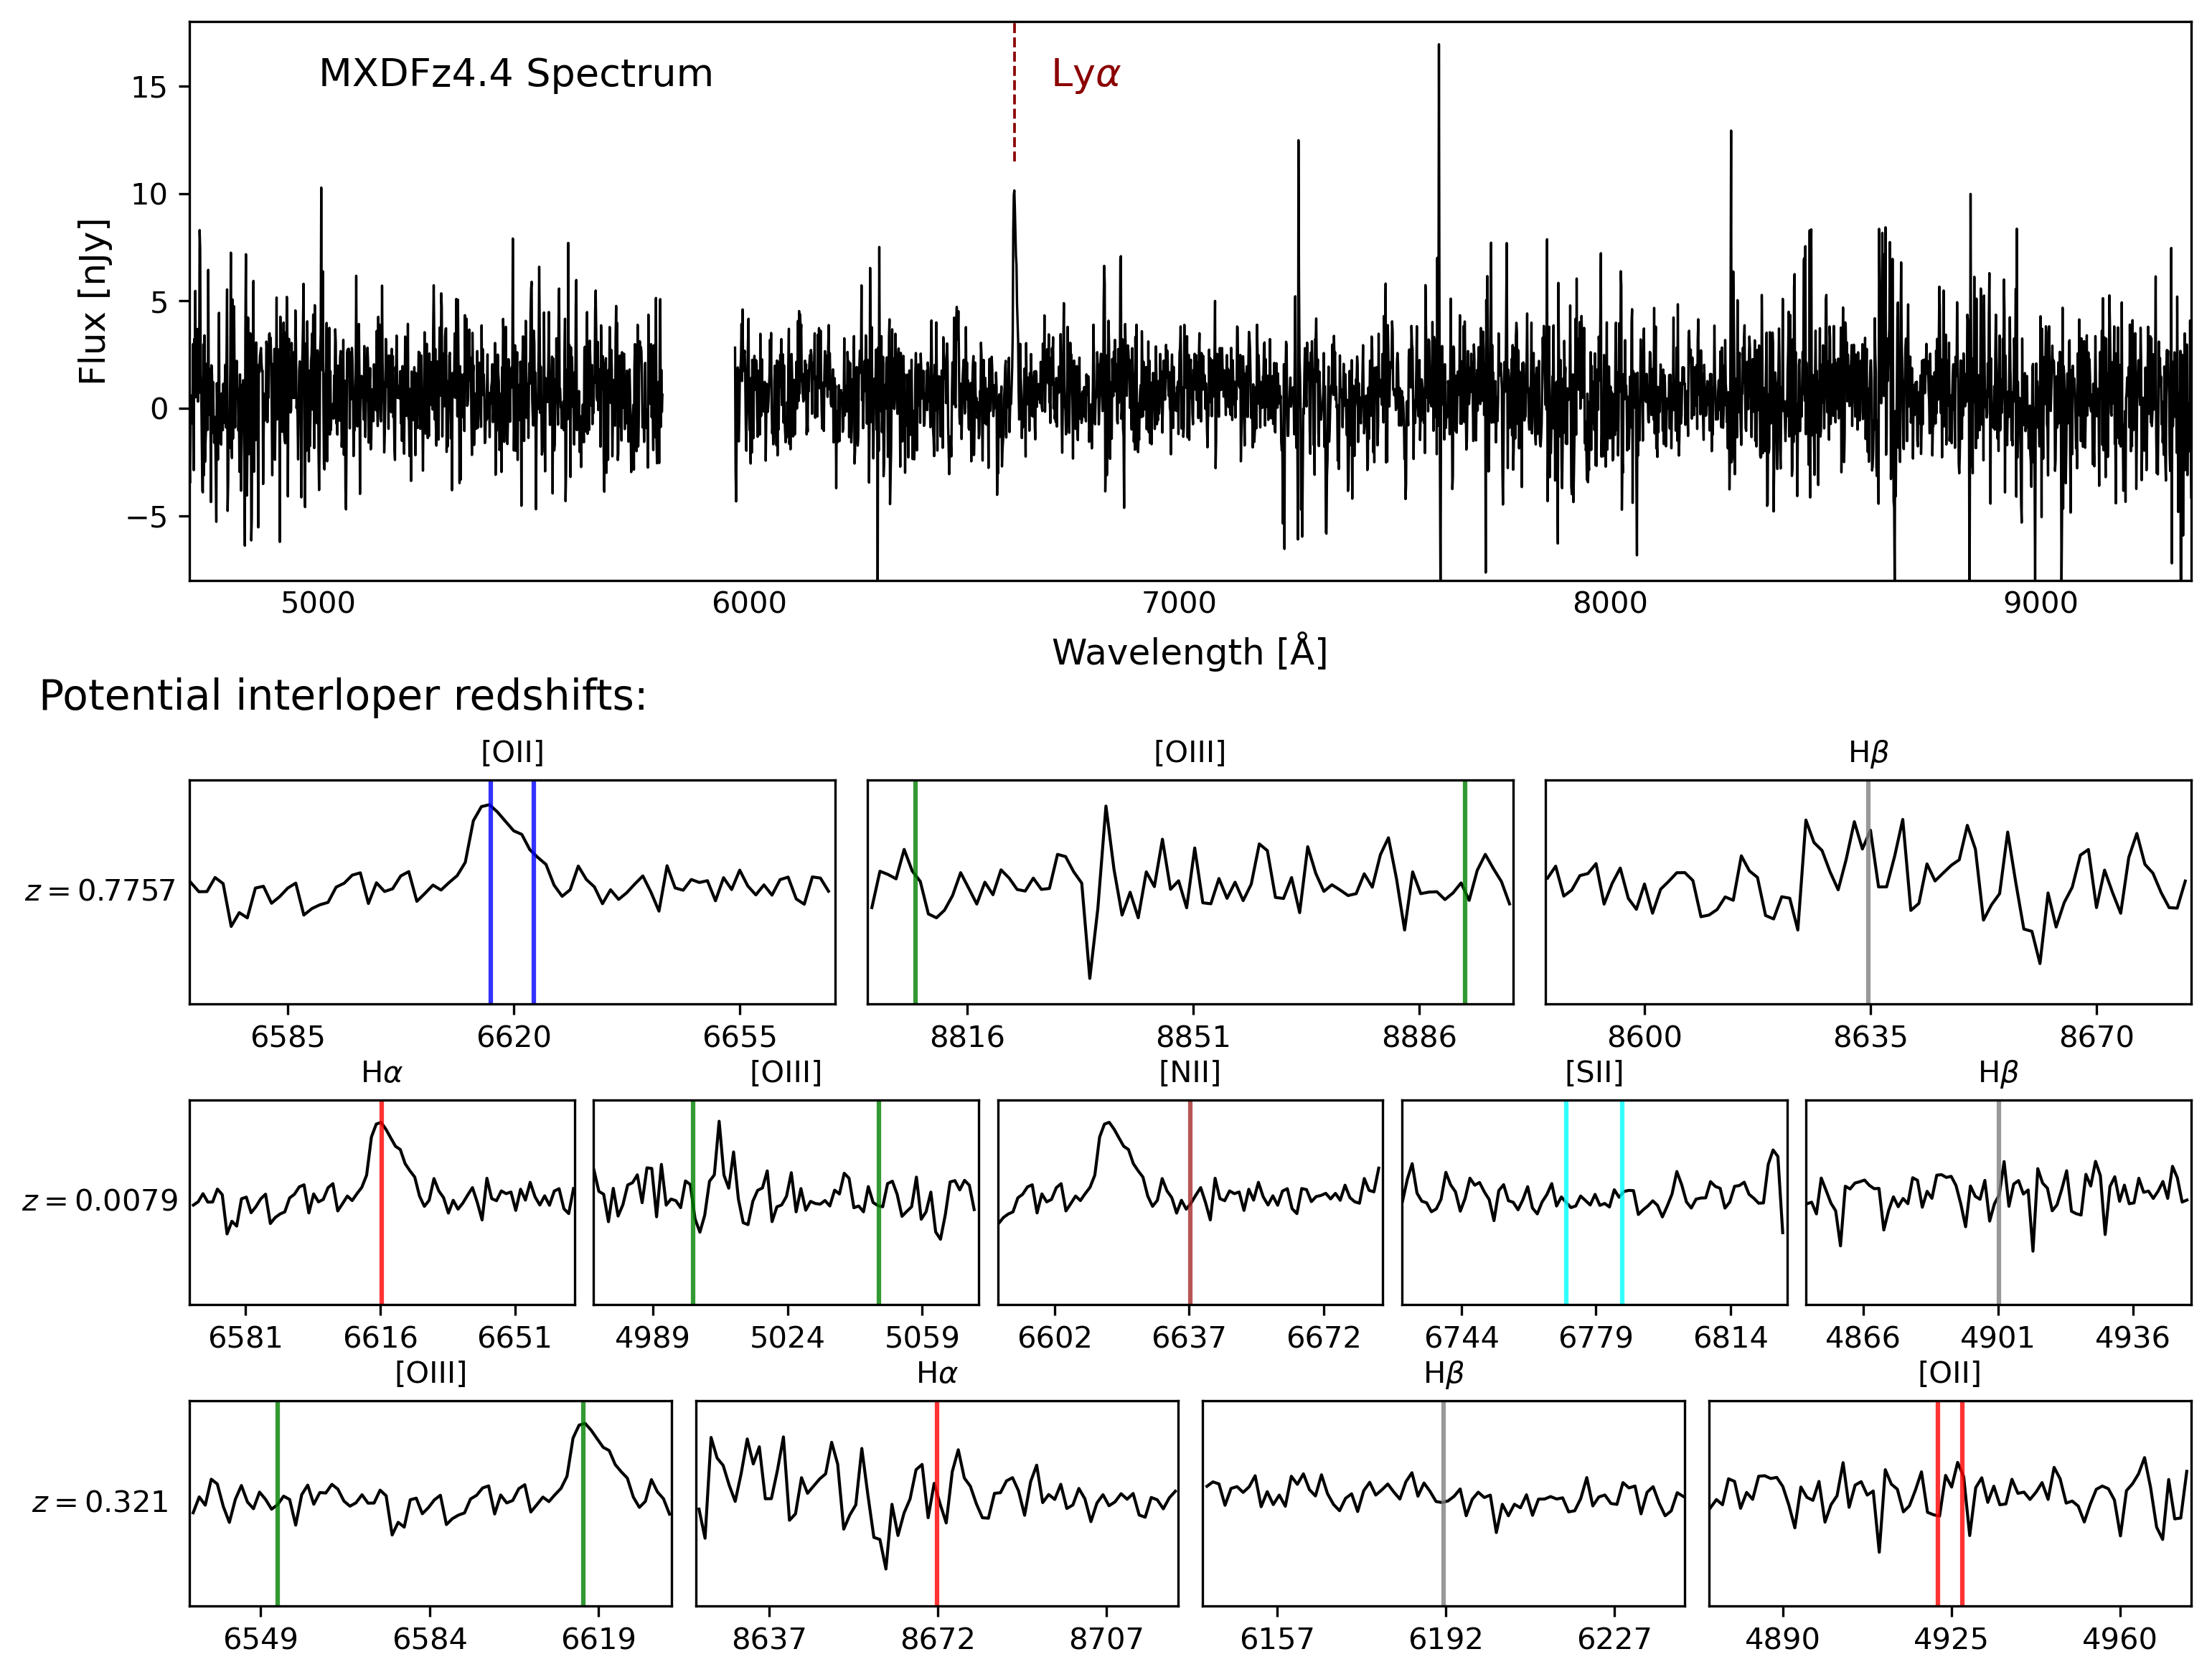
While the spectrum shows only one emission line, MXDFz4.4 has a confident redshift as the line has an asymmetric profile, typical of Ly emission lines. We include a detailed discussion how we rule out other possible redshifts in Appendix A. Also in this appendix, we calculate the probability of chance alignment with a low-redshift interloper () and present the details of the resolved nature of the flux in F435W, which rules out the possibility of the LyC flux originating from a supernova in a faint, low-redshift host galaxy.
No lines other than Ly are detected in the MUSE spectrum. A redder spectrum of MXDFz4.4 obtained with JWST NIRISS Wide-Field slitless spectroscopy from the NGDEEP program also exists (PID 2079; PIs: S. Finkelstein, C. Papovich, N. Pirzkal, Bagley et al. 2024). No lines are detected in the NIRISS spectrum, which is to be expected (see Appendix B for the full details).
| 3aaValue from literature. | 0.18 | ccValue from fitting with BPASS models (Eldridge et al., 2017). | |||
|---|---|---|---|---|---|
| 1.0-1.5ddValue from pySTARBURST99 models (Hawcroft et al., 2025). | 0.18 | ccValue from fitting with BPASS models (Eldridge et al., 2017). | |||
| bbValue from fitting with BC03 models (Bruzual and Charlot, 2003). | 0.18 | ||||
| 1.0-1.2ccValue from fitting with BPASS models (Eldridge et al., 2017). | 0.18 |
| bbValue from fitting with BC03 models (Bruzual and Charlot, 2003). | bbValue from fitting with BC03 models (Bruzual and Charlot, 2003). | bbValue from fitting with BC03 models (Bruzual and Charlot, 2003). | |
| ccValue from fitting with BPASS models (Eldridge et al., 2017). | ccValue from fitting with BPASS models (Eldridge et al., 2017). | ccValue from fitting with BPASS models (Eldridge et al., 2017). |
III.1 SED fitting
We use the CIGALE SED fitting code to derive MXDFz4.4’s properties, fitting the observed photometry with a flexible, non-parametric star formation histories (SFH). In order to predict the ratio of UV to ionizing photons (), which we require to calculate the intrinsic escape fraction of MXDFz4.4, we do not include the IGM-affected bands (F606W and F435W; see §IV). As mentioned in §II, we also do not fit the F460M and F480M bands. We fit using two different stellar population synthesis models to assess the impact that this choice has on the derived properties.
The CIGALE SED fitting code (Burgarella et al., 2005; Boquien et al., 2019), as used for this work, builds composite stellar populations based on flexible SFHs by combining stellar population synthesis models. In our runs, we use two different sets of models: Bruzual and Charlot (2003) (henceforth BC03) and BPASS v2.2 Eldridge et al. (2008, 2017). The BPASS models include the effects of binary populations on stellar evolution. Switching these binary effects on or off, as well as switching between the different extinction laws (MW, LMC, SMC), affects the best fit galaxy properties. Importantly, the affected properties include the intrinsic , without a significant change in the reduced chi-squared of the fit. We therefore run CIGALE using the BPASS models in each of these cases (making six separate runs) and utilize the full range of results to report a more realistic value and uncertainty on every measurement.
CIGALEalso accounts for gas ionized by massive stars, as well as extinction and re-emission due to dust using a modified Calzetti et al. (2000) attenuation law. We use a Chabrier IMF (Chabrier, 2003) and adopt a non-parametric SFH with 10 bins covering the past 600 Myr. The latest bin covers the most recent 5 Myr, with the remaining bins equally-sized in log space. The best-fit is found with an SFH that remains very low until 10 Myr before the galaxy is observed, rising into a strong burst in the most recent 5 Myr. The resulting model can be used to predict the intrinsic emission in the LyC regime. By convolving the resulting best fit spectra with the F435W and F775W filter transmissions, we derive luminosity ratios, , of and for the BC03 models and BPASS, respectively. We note that using a ‘delayed-tau’ SFH model returns very similar results, i.e., the best fit is found to have a strong burst 5 Myr in the past. The best fits using the BC03 and BPASS models (with the non-parametric SFH) are shown in Fig. 5. All SED fitting-derived results, including derived escape fractions (see also §IV), are given in Table 1. Quantities derived using the BPASS models are given as ranges that encompass the values derived for all runs.


Due to the likely impact of the recent burst of star formation on (due to stellar feedback clearing holes in the ISM; Trebitsch et al. 2017; Rahner et al. 2017; Carr et al. 2025), we additionally consider values taken directly from two different stellar population synthesis models of young stars (): BPASS (Eldridge et al., 2008) and the recent pySTARBURST99 models (Hawcroft et al., 2025). Both codes incorporate effects that can be significant for the production of LyC photons. pySTARBURST99 includes the effects of stellar rotation as well as very massive stars (VMS), up to (see Fig. 6). BPASS takes into account the effect of binary stellar populations.
CIGALEmay struggle to fit a very young population due to a sparsity of very young star templates, additionally motivating an analysis using these specialized stellar models. Both population synthesis codes utilize a similar framework to make predictions of synthetic observables based on grids of input stellar evolution models and spectral libraries. While these codes adopt different stellar libraries, the only significant difference affecting the ratio should be the inclusion of synthetic VMS spectra: while pySTARBURST99 includes them directly, BPASS extrapolates these from a regular OB grid (relevant in the first ). In Fig. 6 we show the evolution of over the first for a range of metallicities after including the effects of VMS. The from CIGALE is consistent with the low end of the range shown, which supports the idea of a very recent burst in MXDFz4.4. We show the escape fractions derived using the luminosity ratios from these models alongside the CIGALE-derived escape fractions in Table 1. We discuss the consequences for MXDFz4.4’s escape fraction in §IV and §VI.

III.2 IGM modeling
The IGM is expected to absorb large fractions of ionizing photons at (Inoue, 2011; Inoue et al., 2014). Despite this, LCEs have been confirmed at redshifts up to (Vanzella et al., 2018; Meštrić et al., 2025) and candidates exist up to (Prichard et al., 2022; Kerutt et al., 2024). The detection of MXDFz4.4 makes it imperative to assess whether it is possible to have an IGM sightline transmissive enough to allow us to observe the ionizing flux, or whether this result calls into question our models of IGM transmission near the EoR.
We model the IGM using the TAOIST routine described in Bassett et al. (2021). In brief, mock sightlines are populated with HI absorbers at randomized locations following the redshift-dependent column density distribution function (CDDF) given by Steidel et al. (2018). We model individual HI absorbers with column densities between 1012 and 1021 cm-2 which, at wavelengths redder than 912 Å, produce Voigt profiles with varying Doppler widths (sampled from Hui et al. 1999). At bluer wavelengths, the absorption cross-section is proportional to (Osterbrock, 1974). By integrating the transmission curve through our LyC band, we can calculate the transmission of the IGM (), i.e., the fraction of flux in F435W that would pass through the IGM along that mock sightline.
In order to adequately sample the distribution, we produce 10,000 mock sightlines. The TAOIST code allows for a different CDDF in the CGM of the galaxy, where the higher gas density leads to more high-column-density absorbers. As the redshift of MXDFz4.4 is based on the Ly line, it is not clear whether there is Ly emission at the systemic redshift. We therefore produce two sets of mock sightlines, where one includes absorption from the CGM of MXDFz4.4 and the other assumes a clear channel through the CGM along which LyC photons can escape. The distribution from both sets of sightlines is shown in Figure 7. Given that MXDFz4.4 must be in a sightline with higher than average transmission, we select the value from our list of modeled sightlines for use in deriving our escape fractions. This value is .
The CDDF used in this modeling was produced using measured HI absorbers at 2.0 z 2.8 (Rudie et al., 2013), with a power law used to denote the redshift evolution of the CDDF. Extrapolating this redshift evolution to z 4 may not produce accurate results, as IGM conditions may change close to the EoR. The CDDF also becomes more difficult to measure at low column densities as we consider higher redshifts, as individual absorbers become more difficult to resolve in the Ly ‘jungle’ (Bielby et al., 2020). This is particularly important as the IGM transmission mostly depends on the prevalence of the lower-column-density absorbers, i.e., the incidence rate of high-column-density Lyman Limit Systems (LLSs) along the line of sight will determine the absorption of LyC photons (Inoue et al., 2014). We also note that this simulation does not include the effect of the large scale structure, which may result in a systematic bias in the estimate of (Scarlata et al., 2025).
An estimate of the Ly transmission in the MXDF, at an impact parameter of from MXDFz4.4, already exists (Matthee et al., 2024). The authors find a Ly transmission of at using the absorption spectrum of a bright LAE at , making this more transmissive than typical quasar sightlines at this redshift. We take the transmission spectrum of this LAE (MUSE ID 53) and attempt to derive a LyC transmission from it. We obtain , a more-than-average transmissive sightline at . However, the spectral resolution of quasar spectra normally used to study HI gas at these redshifts is a factor of greater than MUSE (Becker et al., 2015; Lofthouse et al., 2020; Bielby et al., 2020). Additionally, the SNR of quasar spectra is generally far higher. We therefore cannot determine the H I column density with sufficient accuracy to reliably constrain the LyC transmission. Furthermore, the correlation between the sightlines to MUSE ID 53 and MXDFz4.4 may be poor due to the impact of CGM-scale absorbers, which can have a large impact on the LyC transmission (e.g. Rudie et al. 2013; Inoue et al. 2014). We therefore choose not to trust this derivation of and rely on the modeling previously described in this section.

IV The escape fraction of MXDFz4.4
In this section we start by defining the terms used in the explanation and calculation of the LyC escape fraction. This is followed by the measured and derived quantities for MXDFz4.4.
IV.1 Escape fraction definitions
The observed flux ratio between the photometric bands which measure the flux bluewards of (LyC flux) and the UV flux is denoted by . This contains no model assumptions and is purely an observed quantity. However, the effect of the absorption by the IGM is not taken into account, neither is the intrinsic ratio between the ionizing and non-ionizing flux. These quantities are captured in the relative escape fraction (Steidel et al., 2001; Siana et al., 2007);
| (1) |
We note that the exponential factor at the end of this expression is equal to ; is plotted in Fig. 7. Both this and the UV-to-ionizing luminosity ratio are model dependent quantities, the first derived by the TAOIST modeling (§III.2) and the second by our SED fitting (§III.1).
Typically, a further quantity is defined to account for the effect of absorption by dust in the galaxy, termed the absolute escape fraction;
| (2) |
where is the dust attenuation in the rest frame UV, another model-dependent quantity. We mark this quantity with the superscript IGM to denote that it is corrected for IGM absorption.
We present two methods of deriving MXDFz4.4’s escape fraction. The first assumes an intrinsic luminosity ratio in Eq. 1, which comes from stellar population modeling, and then we correct for dust using Eq. 2. We adopt an intrinsic luminosity ratio of 3, common in the literature (Steidel et al., 2001; Kerutt et al., 2024), and a range, , based on our young, metal-poor pySTARBURST99 models (Fig. 6). The second method derives the luminosity ratio directly from the CIGALE best-fit models (see §III.1 and Table 1), which already takes dust attenuation into account, hence yielding directly.
IV.2 Escape fraction derivations
We start by considering luminosity ratios derived by CIGALE in Eq. 1. For the third term in Eq. 1, going forward, we consider that the MXDF is a sightline which has a transmission above the mean simulated transmission; (see §III.2). We discuss this assumption in §VI. Using the observed flux ratio of , we calculate values of % (BC03) and (BPASS).
Using a luminosity ratio of 3 and the attenuation derived by our SED fitting, we obtain of and a possible range of . As this results in an escape fraction , we consider it unlikely that the intrinsic luminosity ratio in MXDFz4.4 is as high as 3. This is further discussed in §VI.
The luminosity ratios derived from BPASS and pySTARBURST99 models (Hawcroft et al., 2025) are shown in Fig. 6. Given the recent burst in star formation shown by our models and the necessity for to be , we focus on the low end of the range shown. As the value derived from CIGALE is also low, this plot is useful to visualize the possible nature of the recent burst in MXDFz4.4. The luminosity ratio range we consider from the young pySTARBURST99 stellar models is , which captures the low-metallicity stellar populations at an age of . This gives an range of and an range of .
As an escape fraction of is unphysical, either must be below a certain value or our result invokes a tension with the IGM models described in the previous section. We consider a lower bound of , as given using the luminosity ratios from the pySTARBURST99 models. While a range of is large in absolute terms, this reflects the uncertainty surrounding the model assumptions inherent to the calculation at high-redshift, where we do not know the intrinsic ratio of ionizing to UV photons or the exact opacity of the IGM. Moreover, the small number of LCEs in the literature within this range are classed as strong LCEs, making a comparison with MXDFz4.4 useful. We now move on to comparing the properties of MXDFz4.4 to other objects in the literature and tracers established at low-redshift.
V Evaluating tracers
MXDFz4.4represents a significant step forward in measuring the properties of the LCEs actually responsible for the reionization process, as it is times closer to the end of the EoR (in terms of time elapsed) than low redshift studies (Flury et al., 2022b; Jaskot, 2025) and a factor of less than the time between the end of the EoR and , where previous high-redshift studies based on multiple galaxies have been focused (Steidel et al., 2018; Pahl et al., 2021; Rivera-Thorsen et al., 2022; Beckett et al., 2025).
First, we focus on the important Ly-LyC connection, taking full advantage of MUSE’s spectral resolution and spatial information. In following sections we also connect the SFR surface density, , and the UV slope with .
As mentioned in the previous section, we consider in our analysis an envelope of possible escape fractions: , ranging from the minimum value (based on ratios) to the maximum possible value, which is implied by our IGM transmission corrections. While this is a large range in absolute terms, there are few LCEs observed in the local universe with , hence it remains useful to compare MXDFz4.4’s properties with those LCEs of high escape fraction that have been observed.
V.1 The Ly-LyC connection
Thanks to the IFU data of MXDFz4.4 from MUSE, we have full access to both spectral and spatial Ly tracers of . We start by comparing MXDFz4.4’s Ly properties to low redshift predictions. A summary of all the relevant properties is given in Table 2.
| Property | Value |
|---|---|
| MUSE ID | 280 |
| RA: | 53.1577218 |
| DEC | |
| Flux | |
| Luminosity | |
| EW | |
| FWHM | |
| Red peak asymmetry | |
| aaUsing SFR derived from CIGALE using BC03 models., bbUsing SFR derived from CIGALE using BPASS models. Range comes from range of SFRs derived in different runs (see §III.1)., ccDerived using UV magnitude observed in F775W filter. | |
| Halo Fraction |
Note. — A table of MXDFz4.4’s properties related to escape fraction and properties of the host galaxy derived from SED fitting with CIGALE (see text). The upper table pertains to escape fraction properties, with the first two rows using luminosity ratios derived from stellar population models, a value commonly assumed in the literature, 3 (Steidel et al., 2001; Kerutt et al., 2024) and the values derived from young, metal-poor pySTARBURST99 models. Both these rows use the range of dust attenuation values derived by our SED fitting with CIGALE. The final escape fractions are given as a range based on the ranges of and . The bottom two rows use the luminosity ratios directly from CIGALE, which already have dust attenuation included. The luminosity ratio from BPASS is given as a range based on different runs (see §III.1). All these results use a value of 0.18 (see text). The lower table contains SED fitting-derived properties of the host galaxy, with the first row using the BC03 models and the second row BPASS. BPASS-derived values are given as a range, based on the values derived in all BPASS runs (see text).
Note. — Table 2. A summary of MXDFz4.4’s Ly properties.
V.1.1 Lyemission line properties

The simplest Ly properties we can study are the flux and the equivalent width (EW). In order to derive the Ly flux, we perform a custom skewed-Gaussian fit to the line, closely following the procedure in (Bacon et al., 2023). The skewed Gaussian equation we fit is as follows:
| (3) |
where is the amplitude of the Gaussian, is the central wavelength, is the standard deviation and is the asymmetry parameter; large positive in this case leading to a more redward-skewed line. The flux of this line is calculated in the same way as a normal Gaussian function:
| (4) |
We subtract the background from this flux measured in two representative windows of 66.25 Å (53 MUSE spectral pixels) around the emission line. We subtract the median pixel flux in these two windows multiplied by the number of pixels underneath the Ly line. The final Ly flux is . This is completely consistent with the value from the public MXDF catalog (Bacon et al., 2023). As there is no continuum detected in the MUSE data, we then calculate the Ly EW by taking the ratio of the Ly flux to the flux in the filter that sees the emission, F606W, having first subtracted the Ly flux from this filter. The result is an observed Ly EW of , which gives a rest frame EW of .
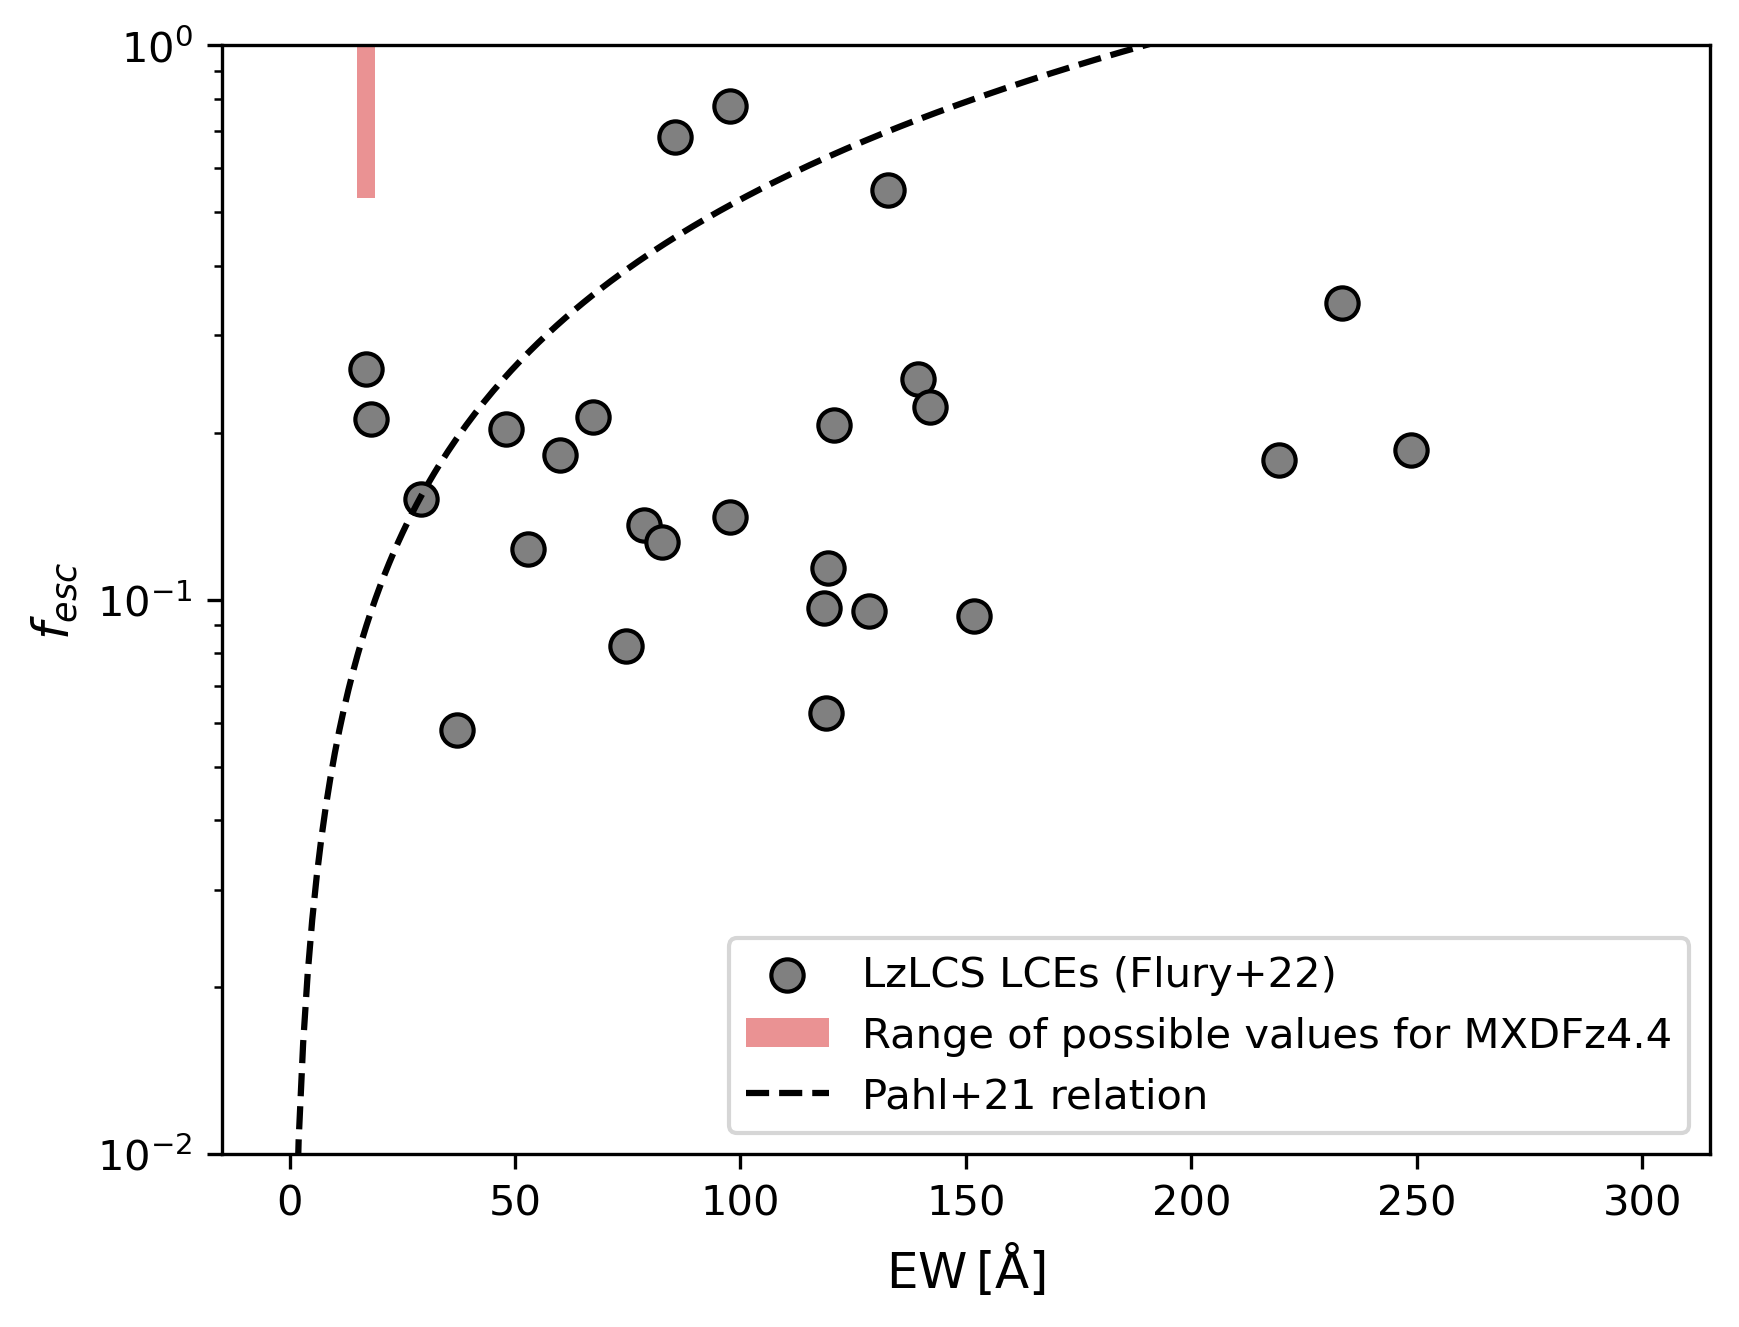
We compare this Ly EW with literature results in Fig. 9, where we shade in red the full region that MXDFz4.4 could occupy in terms of and in terms of Ly EW. This region is outside the range of results from low-redshift (Flury et al., 2022a), although there is significant scatter (grey points). However, this region is also in significant disagreement with the relation at high-redshift established by Pahl et al. (2021). That said, the Ly EW is not expected to be a good tracer at very high . This stems from the necessary reduction in nebular emission when a high fraction of ionizing photons escape the galaxy rather than powering the nebular emission from the ISM.
While the Ly escape fraction is generally closely related to the EW (Sobral and Matthee, 2019; Goovaerts et al., 2024; Begley et al., 2024), it should scale with even to high values if the is calculated using non-resonant hydrogen lines, such as H. Indeed, a close relation between and has been found (Flury et al., 2022a; Jaskot et al., 2024; Jaskot, 2025). However, as we do not have access to these lines for MXDFz4.4, we resort to comparing to calculated using our SED fitting and the UV magnitude in the F775W filter.
We calculate the using the dust-corrected SFRs from our CIGALE runs. Because the SFR has evolved dramatically over the last — and even likely over the last as our SED fitting suggests —, we consider both averaged SFR values (see Table 1). In the past, Ly escape has been calculated using both UV-derived SFRs and H-derived SFRs. Our results for the -averaged SFRs can be more readily compared with the UV-based method, and our results with the H method. We therefore give a range of possible values in Table 2 (individual uncertainties are far smaller than the range) for the BC03 models, the BPASS models, and also for a comparison to the value derived using the UV magnitude simply converted to an SFR following the standard prescription from Kennicutt (1998). We caution that this prescription assumes a constant SFR over longer than , which is very unlikely to be the case for MXDFz4.4. The Ly escape fractions derived are: (BC03), (BPASS) and (UV magnitude). Because of the numerous assumptions and model dependencies used to obtain these values, it is challenging to meaningfully interpret them alongside low-redshift results. They vary from quite low, given that MXDFz4.4 is a strong LCE, to quite high. Observations of the H line would be necessary to more reliably determine the MXDFz4.4’s SFR and therefore . However, if it is indeed the case that MXDFz4.4 is a very strong LCE, observing its accordingly reduced H emission may be challenging.
The asymmetry of the Ly line is generally thought of as resulting from kinematics in the neutral gas in the ISM and CGM, such as outflows, as well as back-scattering. Kakiichi and Gronke (2021) suggest that galaxies with their ISM in the density-bounded scenario (in which ionizing photons escape) have a lower red peak asymmetry (i.e., a more symmetric line). Thus this quantity may provide a simple way to assess the porosity of the ISM, crucial for allowing LyC escape. This is tentatively borne out in the observational sample of Izotov et al. (2016, 2018b, 2018a). We define the red peak asymmetry, , similarly to Kakiichi and Gronke (2021);
| (5) |
where is the Ly flux, is the wavelength at the red peak and is the wavelength between the red and blue peaks. In this case there is no blue peak, so we take a wavelength bluewards of the red peak. The resulting is robust to this choice of lower integration limit. We calculate to be , with an uncertainty calculated by MC sampling Eq. 5 within the limits of our skewed Gaussian fit to the Ly line. This is a low red peak asymmetry according to Kakiichi and Gronke (2021), consistent with the galaxies they find to be strong LCEs, with mostly density-bounded ISM conditions.
The FWHM of the Ly line is, however, in light contradiction with expectations. Verhamme et al. (2015) showed that LAEs with narrow peaks, close to the systemic redshift, are good candidates to be LCEs. However, MXDFz4.4 has a relatively large FWHM: (corrected for the MUSE line spread function). Larger FWHM values generally indicate higher neutral hydrogen column densities. However, Kerutt et al. (2024) also find reasonably high FWHM values for 12 LCE candidates at , some of which are consistent with MXDFz4.4.
These slightly conflicting results for the spectral properties of MXDFz4.4’s Ly emission stress the need to also take into account its spatial properties. We do so in the following sections.
V.1.2 Lyhalo fraction

The Ly halo fraction, HF, is currently a very promising tracer of at low redshift (Puschnig et al., 2017; Saldana-Lopez et al., 2026). Broadly, it encapsulates the amount of Ly emission that escapes the host galaxy in an extended halo, rather than co-spatially with the UV emission. A low halo fraction indicates the presence of clear channels in the ISM and CGM of the galaxy through which Ly photons escape with minimal scattering events, facilitating LyC photon escape. Saldana-Lopez et al. (2026) fit a relation between the HF and : , at low redshift from the Lyman Alpha and Continuum Origins Survey (LaCOS, Le Reste et al. 2025). We study this quantity, and its relation to , for the first time at high redshift.
In order to compute the HF for our data, where the Ly comes from MUSE and the UV continuum comes from HST’s F775W filter, we broadly follow the method laid out by Wisotzki et al. (2016) and close to that employed by Saldana-Lopez et al. (2026) to facilitate comparison. The key differences between our available data and that of Saldana-Lopez et al. (2026) are that Ly is detected in MUSE rather than HST and that no continuum is detected in Ly. Thus, we must combine the two datasets to calculate the HF.
Firstly, a narrow band (NB) image must be created around MXDFz4.4 from the MUSE datacube. We create the NB image for our HF calculation by summing the datacube in a window around the wavelength of the Ly emission, which contains all the Ly flux. However, this NB image still has a much larger PSF than the HST image, so morphological comparisons are not yet possible. We therefore convolve the HST image to the MUSE PSF, using the Moffat profile described in Bacon et al. (2023) for the MXDF. Fig. 10 shows the contours of Ly emission overplotted on the UV emission from F775W, PSF-matched to MUSE. The is also shown for reference.
We then cut out a window around MXDFz4.4 and subtract the local background from each, masking MXDFz4.4 and nearby sources in the process. Nearby sources remain masked and radial profiles are calculated for both Ly and UV. These radial profiles are then compared after normalizing the profile to the core of the Ly profile. The extended Ly emission over the UV profile is then considered the Ly halo, and the fraction of the total emission that this constitutes is considered the HF.
Using this method we derive a HF of . The significant uncertainty on this value stems from the uncertainty on the Ly profile. As the integrated SNR of the Ly emission is only , the outskirts of the profile have low SNR. Another issue affects the center of the profile, caused by the size of the MUSE pixels, . In the inner few tenths of arcseconds of the Ly profile, only a small number of pixels are considered, which raises the uncertainty. Both of these effects naturally stem from the MUSE data, and cannot be mitigated save in a source with much higher SNR (ideally integrated).
We plot MXDFz4.4’s HF on Fig. 11, together with the results from the LaCOS survey (Saldana-Lopez et al., 2026). As before, we plot the area for the HF and the full range of possible escape fractions. This range is mostly outside the uncertainty on the relation established by Saldana-Lopez et al. (2026); MXDFz4.4 has a higher fraction of Ly flux emitted in the halo than expected, or equivalently, a higher than expected based on its HF. We note that the next two strongest LCEs also lie above the relation and its uncertainty. A lack of very high- LCEs mean it is challenging to truly test this relation in the regime MXDFz4.4 occupies.
On the other hand, we show that it is possible to constrain (albeit with large uncertainties) very small halo fractions with MUSE and HST data, lending confidence, from a methodological standpoint, to the possibility of the application of the HF relation across the full range of at high redshift. We do expect large uncertainties to remain for MUSE LAEs of lower Ly SNR ().
Going forward, increased statistics (most likely coming from ) will greatly benefit the assessment of whether the HF is a reliable tracer of LyC escape at high-redshift.

V.1.3 Ly
Additional Ly morphological parameters have been suggested as tracers. The compactness of the Ly emission can be expressed more simply than the HF, using . This has also been shown to be a potentially valuable tracer of (Saldana-Lopez et al., 2026), and one which does not rely on a detection of the continuum. More compact galaxies, therefore with lower , exhibit higher values. The suggested interpretation broadly follows the logic used to explain the correlation between the concentration of the UV starlight and (see the following Section). Additionally, as with the interpretation of the HF, Ly escaping mostly centrally indicates clear channels through the ISM towards the observer, which also elevate .
We derive for MXDFz4.4 via forward modeling of the same local background-subtracted NB image as for the HF. The intrinsic surface brightness distribution is modeled as a Sersic profile and convolved with the MUSE PSF (see §II). Parameters are inferred using MCMC sampling with the python package emcee (Foreman-Mackey et al., 2013, 2019).
We find a MUSE PSF-adjusted value of , which we plot as the red shaded area in Fig. 12 together with the results from Saldana-Lopez et al. (2026), where once again this area encompasses the full range of possible values and in . We find less agreement here than in the HF, with the region demarcating MXDFz4.4 significantly outside the grey uncertainty region from Saldana-Lopez et al. (2026). However, we note that there are other LAEs of high that reside above this region, showing more extended Ly emission than would be expected given their escape fractions.
Following a similar logic to , the offset of the Ly and UV centroids has also been suggested as a tracer of (Saldana-Lopez et al., 2026) through the statistic. However, the value we measure is consistent with zero after accounting for uncertainties introduced by a potential, small WCS offset between F775W and MUSE. The offset matches expectations from comparing images of extremely different pixel sizes (10-20% of the larger pixel size, in this case ) and the centroiding uncertainty itself, particularly for MXDFz4.4’s clearly non-Gaussian profile. We therefore accept that it will always be challenging to extract significant conclusions from this statistic when combining MUSE and HST/JWST data.

V.2 Star formation rate surface density and specific star formation rate
A high SFR surface density, , has been highlighted as a galaxy property which can correlate with (Izotov et al., 2016; Naidu et al., 2020; Gazagnes et al., 2020; Jaskot et al., 2024). The explanation centers on stellar feedback creating holes in the ISM more efficiently when the stellar environment is more concentrated (higher ).
We define within MXDFz4.4’s UV half-light radius using the typical equation for (Shibuya et al., 2019; Naidu et al., 2020): . The half light radius of MXDFz4.4 is , as derived in Nedkova et al. (2024) using a multi-wavelength version of GALFIT (Peng et al., 2002, 2010) that fits Sérsic profiles in all available filters simultaneously (Häußler et al., 2013). For MXDFz4.4, the 30mas HST mosaics in nine filters were used to constrain the half-light radius: F435W, F606W, F775W, F814W, F850LP, F105W, F125W, F140W, and F160W. While the re-processing of the ACS/WFC imaging as part of the HST archival program ID 16621 provide significant improvements to the image quality, these improvements are most significant in F435W and less so in F775W, the latter of which we use to measure the half-light radius. We therefore opt to use the results from Nedkova et al. (2024) that are constrained over multiple wavelengths, noting that we also find good agreement using the photutils package on the re-processed F775W image, lending confidence to this result.
We derive a number of different SFRs for MXDFz4.4 (see Table 1) based on SED fitting and different timescales (). The low end of these ranges gives values less than , which appears far too low for a strong LCE such as MXDFz4.4. The higher end of these ranges () gives moderate values around . This is still not high considering the very high MXDFz4.4 likely exhibits. However, when looking in more detail at the SFH plots produced by CIGALE, the peaks of the recent burst (which is present in the SFH regardless of stellar population model choice) are around (BPASS) and (BC03). An SFR of gives a value of , which is more consistent with expectations for a strong LCE (Jaskot et al., 2024). However, such peak SFRs are not typically used for this calculation. The fact that MXDFz4.4 only has a in line with low-redshift predictions when the peak of the recent starburst is considered is likely further evidence of the impact of this burst on the escape of LyC photons.
Although there is less of a correlation found between and sSFR (specific star-formation rate; SFR divided by stellar mass), we note that most of the strong LzLCS LCEs have sSFR values above , between and (Flury et al., 2022a). High in high sSFR galaxies is also found in simulations (Menon et al., 2025). Using the same SFR ranges, and our CIGALE and BPASS-derived stellar mass of , we derive sSFR values between and , consistent with the LCEs of very high in Flury et al. (2022a).
V.3 UV slope
The UV slope, , has been suggested as a promising tracer of at low redshift (Chisholm et al., 2022). It is particularly attractive as it is easy to measure at any redshift (albeit subject to uncertainties, e.g. Austin et al. 2025). The UV slope is sensitive to the dust content of the galaxy, as dust absorbs these UV photons and re-emits them in the infrared. The UV slope is additionally sensitive to the age and metallicity of the stellar population, with younger, metal-poor populations having bluer (more negative) slopes. However, nebular continuum emission from hot gas in the ISM created by such populations serves to redden the UV slope. It is argued that is mainly sensitive to dust, implying that slope steepness should correlate with . This is indeed found at low redshift (Chisholm et al., 2022).
We fit the UV slope of MXDFz4.4 and find a redder slope than expected based on the relation found by Chisholm et al. (2022), both in the best-fit spectra from CIGALE and in the photometry. Avoiding the feature in the spectrum by calculating the slope in windows of and , we obtain a value using CIGALE and the BC03 models of . This is similar to the value derived using the observed photometry: . Chisholm et al. (2022) find that galaxies with very high , such as MXDFz4.4 ( ), mostly have . This suggests the presence of greater dust content than would be expected for a strong LCE, although the older, more chemically evolved component of the composite stellar population found by our SED fitting could also play a role in reddening the UV slope. We note that using the best-fit spectrum from CIGALE and BPASS gives a bluer slope (), but that these fits fit the observed photometry slightly worse in the wavelength range where the UV slope is calculated (Fig. 5).
We also caution that while the UV slope does depend on the dust attenuation along the line of sight — the same line of sight as the escape of LyC photons —, it is far less impacted by morphology and the potential presence of clear channels in the ISM. The same applies to the escape of Ly, as recently highlighted by Markov et al. (2025); Ejdetjärn et al. (2026). Different components of galaxies can contain differing amounts of dust and neutral hydrogen in their ISM, allowing LyC escape from only some parts of the galaxy. Hence, the integrated light of a galaxy may show the presence of dust, despite the existence of dust-clear channels through which LyC escapes (Ji et al., 2025).
VI Discussion
In this section we collect the measured properties of MXDFz4.4, as well as those that are dependent on models, discuss their validity, and infer the likely nature of MXDFz4.4.
Due to its very high redshift, and therefore the high opacity of the IGM, we conclude that MXDFz4.4’s intrinsic escape fraction is very high, likely . Given that an escape fraction of is unphysical, we are left with two avenues to explain the detection of MXDFz4.4, based on Eq. 1. Either the intrinsic luminosity ratio of non-ionizing to ionizing photons (the second term) must be low or the transmission of the IGM must be low (the third term).
We consider the two cases from Table 1; using from stellar models (pySTARBURST and BPASS) and using directly from CIGALE (which includes dust). In the first case, (using the dust attenuation we derive with CIGALE in Eq. 2), must be () or (). In either case must be close to unity. This brings MXDFz4.4’s observed into consistency with models of IGM transmission. For the CIGALE-derived case must also be very near unity to avoid . As we can see from Fig. 6, ratios of near unity are achieved only by very young and/or very metal-poor populations.
Even with such extreme stellar populations, only a small fraction of sightlines are transmissive enough to allow the that we observe from MXDFz4.4, according to our modeling (§III.2 and Fig. 7). Using the stellar modeling approach (row 2 of Table 1), a value of is necessary to ensure even with the best case dust attenuation. This is satisfied by just over of sightlines. Using the CIGALE approach (rows 3 and 4 of Table 1), this reduces to of sightlines (). This can be interpreted as a “-unlikely sightline”. The previous case, , is equivalent to a little over unlikely.
It is possible that the IGM actually allows a greater transmission of ionizing photons than the TAOIST models predict. Although the HI CDDF used by TAOIST is redshift dependent, it is primarily calibrated using observations from the Keck Baryonic Structure Survey (KBSS, Rudie et al. 2013) at 2 z 3, and may therefore be inaccurate close to the EoR. TAOIST and other Monte-Carlo based IGM codes also generally do not account for HI clustering, which can be due to large scale structure (Scarlata et al., 2025). This could also increase the transmission of the most transparent sightlines and reduce the possible tension (Kakiichi et al., 2018).
However, given that we do observe ionizing escape from MXDFz4.4, and that a young and/or potentially very metal poor stellar population can account for this, we now discuss its physical nature by combining all the tracers that we have analyzed and the physical conditions we have derived. We caution that comparisons to other LCE samples may be limited by the lack of sufficient LCEs of very high in the literature.
The Ly EW is in significant disagreement both with results found at low redshift and at high redshift (Flury et al., 2022a; Pahl et al., 2021). However, this may be expected for an LCE of very high , as MXDFz4.4 is likely to be. The strength of nebular lines is expected to reduce if significant amounts of ionizing photons escape, as these then no longer go to producing recombination lines like Ly.
For this reason, is expected to correlate with up to very high values, however only if it is calculated using non-resonant hydrogen recombination lines, such as H. This is not the case for MXDFz4.4 and given the difficulty in deriving precise SFRs using SED fitting, we are left with a large range of values, derived in a number of ways. High values, as would be expected, are included, but unfortunately our results are not very constraining and therefore are difficult to compare to others in the literature.
Considering the Ly asymmetry and HF, these agree fairly well in that a low HF indicates a direct path for LyC photons to escape the galaxy towards the observer, and a symmetric line suggests a density-bounded scenario which also allows for high levels of escape.
The high FWHM, however, is less in line with expectations from simulations and from low redshift observations, as this can indicate high neutral hydrogen column densities, which would impede LyC escape. These slightly contradictory Ly properties may be explained by the effect of the recent burst combined with an older, more evolved population (which likely exists given the redder-than-expected UV slope). Ly photons can take time to escape from the galaxy (e.g. Mas-Hesse et al. 2003). At stellar ages younger than , Ly struggles to escape from the molecular clouds surrounding stars (Hayes et al., 2007). Then, feedback from massive stars, winds, and the first supernovae, such as we expect in MXDFz4.4’s recent burst, progressively clear the clouds and facilitates both Ly and LyC escape (Rahner et al., 2017; Trebitsch et al., 2017; Carr et al., 2025; Komarova et al., 2025). If the burst in MXDFz4.4 is at this stage, rapid development of the emergent Ly emission would be expected, with some component remaining from the older stellar population and its ISM.
If MXDFz4.4’s Ly line is close to the systemic redshift, which has been shown to correlate well with (Verhamme et al., 2015, 2017; Flury et al., 2022a), this may alleviate the unexpectedly high FWHM. It would mean that significant fraction of the Ly photons are escaping at the systemic redshift rather than undergoing an extensive radiative transfer process through surrounding neutral hydrogen. This would help to explain the high fraction of LyC photons that also escape. Unfortunately, we lack the additional lines in MXDFz4.4’s spectrum to verify this.
Among all the Ly-based tracers, we note that one of the most promising at low redshift, the HF, qualitatively agrees with predictions, which moderately increases the confidence in the possibility of using it at high redshift. Further confidence would necessitate testing the HF method for much larger samples, especially in the lower escape fraction regime where the HF relation from Saldana-Lopez et al. (2026) is more constrained. Samples of LCEs in the range of MXDFz4.4 are likely to remain small for the foreseeable future, although will remain desirable to better constrain the high- regime.
With these conclusions based on MXDFz4.4’s Ly properties in mind, we suggest that the MXDFz4.4’s recent star formation and the nature of its burst are the driving force behind its high observed escape fraction and highlight the importance of and sSFR as tracers. It may be for this reason that the Ly HF still acts as a good tracer of , while for example the Ly is less in line with low-redshift findings (Saldana-Lopez et al., 2026); the HF is the most sensitive of the Ly diagnostics to the holes created in the ISM for Ly and LyC to escape. Still, the is lower than expected for all but the peak of the recent star formation, which likely means that the nature of the stellar population also plays a significant role, i.e. a young, metal-poor stellar population producing many ionizing photons per UV photon. To illustrate the importance of this, we refer the reader to the earlier discussion about the necessity of being near unity (note that this keeps all other parameters, as well as the actual escape of LyC photons, the same). Even the upper bounds on the possible ratios we calculate are low compared to the average galaxy population, and are surpassed, according to Fig. 6, for all but the most metal poor stars in .
Therefore, it is likely that the very young and potentially metal-poor nature of the stellar population in MXDFz4.4’s recent burst is contributing strongly to its observation as an LCE. This is supported by the recent local Universe work of Ejdetjärn et al. (2026), where LyC is boosted due to recent star formation and is not necessarily co-spatial with Ly, which the authors attribute to LyC and Ly originating in different locations (i.e., stars versus the ISM). A post-starburst boost in the of a galaxy has been well studied, both in simulations (Gnedin et al., 2008; Yajima et al., 2009; Kimm and Cen, 2014; Trebitsch et al., 2017; Rosdahl et al., 2022; Menon et al., 2025) and in observations (Flury et al., 2025; Komarova et al., 2025; Carr et al., 2025), with these studies also commenting on the importance of young, metal-poor stars in this process.
The burstiness of early galaxies within the EoR has recently been invoked to explain the excess of UV-bright galaxies observed at very high redshifts (Sun et al., 2023; Shen et al., 2023; Muñoz et al., 2026). These galaxies have already been suggested as efficient ionizers (Endsley et al., 2023; Simmonds et al., 2024), mostly due to their enhanced ionizing photon production efficiency and a potential higher (Endsley et al., 2024; Hayes et al., 2025). Our interpretation of MXDFz4.4’s properties supports this, and it also suggests that galaxies with successive strong bursts of star formation may also experience episodes of extremely high LyC production and . We caution that this is dependent on metallicity, since more enriched populations would produce fewer ionizing photons. This process is cumulative, with successive bursts producing more enriched populations and fewer ionizing photons. However, elevated and sSFR during the burst may still facilitate high levels of escape. Such bursty galaxies are therefore strong candidates to emit a large share of the ionizing photons needed to reionize the IGM at early times.
If high-redshift galaxies have a duty cycle closer to one (i.e. they spend close to 100% of their time in the star-forming phase), it might provide a mechanism for EoR galaxies to emit enough ionizing photons into the IGM to create the reionization history that we observe, a similar argument to that presented in Naidu et al. (2020) for . For this reionization history, the necessary escape fraction on a population level has generally been placed around (Finkelstein et al., 2019), which is far greater than what we observe in the local Universe. The increased burstiness of high redshift galaxies might therefore help alleviate this issue.
VII Summary and conclusions
We present the detection of the highest-redshift Lyman continuum emitter to date, MXDFz4.4, at . This redshift is confirmed by a high-confidence Ly line in extremely deep, 140h MUSE spectroscopy. We apply all available tracers established by studies at low redshift and conclude the following about the nature of MXDFz4.4:
-
•
Our SED fitting with CIGALE and two different stellar population models (Fig. 5) suggests a very recent and vigorous burst of star formation, with numerous stellar models predicting a very low ratio at these young ages. This would mean that MXDFz4.4’s observed escape fraction is not in tension with models of IGM transmission at .
-
•
MXDFz4.4’s Ly EW is low (Fig. 9) in comparison to both low and high-redshift studies from the literature. However, this may be explained by MXDFz4.4’s very high escape fraction. When is very high, nebular emission, including Ly, is expected to decrease as ionizing photons are escaping rather than being absorbed and re-emitted as Ly.
-
•
MXDFz4.4’s Ly escape fraction, , is challenging to constrain without the H emission line. We use SED fitting and MXDFz4.4’s UV magnitude instead, finding a wide range of values, ranging from low to .
-
•
The Ly shape and FWHM are in slight conflict, with the line being symmetric (as expected for a strong LCE) but with a large FWHM (unexpected given simulations). This may be alleviated by MXDFz4.4’s Ly line being close to the systemic redshift, shown to be important in facilitating LyC escape. However, we lack the other emission lines to assess this.
-
•
The Ly half-light radius, , is also larger than expected for high- galaxies, lying outside of the predicted range based on low-redshift results. Both this and the Ly line FWHM could be attributed to rapid evolution of the MXDFz4.4’s Ly emission due to its recent burst, some contribution from an older stellar population, and more chemically evolved parts of the galaxy.
-
•
We tested the promising halo fraction tracer established by Saldana-Lopez et al. (2026) for the first time at high redshift and find qualitative agreement with low-redshift results, although MXDFz4.4 occupies a sparsely populated area of the parameter space. Nevertheless, our results support the use of this promising tracer for high-redshift studies and demonstrate how this can be achieved with MUSE data. These results also reinforce the importance of geometry and orientation/viewing angle in the observation of escaping LyC photons. Applying the HF method to more high-redshift LCEs is necessary to truly ascertain its validity towards the EoR and therefore the potential importance of the presence clear channels in the ISM and CGM which this tracer probes. In particular, more high- LAEs are needed to assess whether MXDFz4.4 is a typical or an outlier case.
-
•
Among MXDFz4.4’s star formation properties, sSFR is elevated and is moderate, rising to very elevated when we consider the peak SFR of the recent burst. Both of these point to the importance of the recent burst of star formation in clearing the ISM and facilitating LyC escape.
-
•
We find a redder UV slope, , than expected: from photometry and from the best-fit CIGALE models. This indicates the presence of some dust in the galaxy and means it is likely we are observing the LyC escaping thanks to a specific ISM geometry, also likely due to feedback from the recent burst.
Based on these results, we suggest that galaxies in the early Universe, which have been shown to undergo multiple bursts of vigorous star formation, may also undergo successive periods of extremely high ionizing photon production and escape, although the production is likely also dependent on metallicity. While more work is needed to confirm this, the bursty nature of high-redshift galaxies may provide an explanation for the discrepancy between the low levels of observed among the general galaxy population at low redshift and the number needed to reionize the IGM.
While the detection and characterization of MXDFz4.4 shows MUSE to be an extremely useful instrument for high-redshift LCE investigation, we warn that the HF method will not work with all MUSE-detected LAEs, as a significant fraction (10-30%, depending on the relative depths of the MUSE data and photometry) are undetected in the continuum (Bacon et al., 2023; Goovaerts et al., 2023). Still, the and all the line shape diagnostics would remain available, making MUSE an efficient instrument to quantify in LAEs up to , well into the end of the EoR.
Appendix A Redshift confidence
In order to confirm the redshift of MXDFz4.4, we carried out a number of tests, positing the alternative possibilities that the emission line seen in the MUSE spectrum at is not Ly but instead the doublet, the stronger of the two [O III] lines (), H and the C III] doublet. The first three cases are shown below in the cutouts in Fig. 13, clearly showing the lack of the other expected lines in the spectra. In the case of [O II] and C III], we show plots of [O II] and C III] emitters from the MUSE database in Figs. 14 and 15, clearly showing that both of these doublets are resolved at . It is therefore clear that none of these cases are plausible.
In the case of H, we do not see either [O III], [N II] or [S II]. Additionally, the line at is visibly skewed, common for Ly but extremely uncommon for H. Finally, if this line was H, the redshift would be , and detections would be expected even in the shallower F336W, F275W and F225W images (Fig. 3) depending on the SED shape, all of which contain non-detections. Finally, the source’s compact morphology is not consistent with a galaxy at .
If the line were to be the doublet, we would expect it to be resolved at the spectral resolution of MUSE. We show the spectrum of an emitter at the same SNR () and wavelength and show that it is easily resolved (Fig. 14). Additionally, neither nor H is detected. Even in the case of a very low ionization state, where is expected to be stronger than , for an detection, we would expect a detection of the stronger line (based on an ratio of 0.5, typically found in metal-rich low- galaxies).
If the line at were to be the stronger of the two lines, we would expect to detect the weaker line at as this line ratio is (independent of astrophysical conditions in the galaxy). In addition to this, not one of H, H or is detected.
Finally, Fig. 15 clearly shows that the C III] doublet is resolved at the wavelength that Ly is detected in MXDFz4.4’s spectrum.
Together with the clearly asymmetric line-profile, these cases show that there is high confidence in MXDFz4.4’s Ly line and therefore its redshift of .
A.1 Chance alignment with a low-redshift interloper or supernova
We also discuss the possibility of a chance alignment between a low redshift galaxy and a background LAE, such that the continuum that we see, including the detection in F435W, does not actually come from the line emitter we observe in the MUSE spectrum. In order to assess this probability, we start with the number density of quiescent galaxies from Brammer et al. (2011) (lowest redshift and mass bin, as the SED is inconsistent with a very high mass galaxy): . The foreground galaxy must be quiescent, as it is not detected in the filters bluewards of F435W, and no emission lines are detected in 140h-depth MUSE data. From this we calculate the number of such galaxies that should exist in the MXDF in the interval of the JADES-derived photometric redshift: , arriving at 0.039. As the alignment must be exact, we then compute the number of circles (approximate centroid uncertainty between the two emissions, Ly and continuum) which fit in the MXDF. This number, using Thue’s circle packing theorem (Chang and Wang, 2010), is 20405. Combining this number with the chance of the necessary galaxy existing in the MXDF field of view, gives a chance of an alignment with any single LAE of 1 in 523205. We multiply this by the number of LAEs in a feasible redshift range to detect LyC in F435W: , 40. This gives a final probability of a chance alignment producing the F435W flux we observe, of 1 in 13080, or .
We also rule out the possibility of the F435W flux that we detect being created by a supernova in a faint host galaxy which aligns with MXDFz4.4. This is done by showing the F435W is not a point source, rather it is extended and elongated. The F435W PSF FWHM is and the FWHM of MXDFz4.4’s F435W flux is . The semi-major to semi-minor axis ratio of MXDFz4.4 in F435W is 1.21 whereas for the PSF it is 1.01 (circular).


Appendix B JWST/NIRISS Spectrum of MXDFz4.4 from the NGDEEP program
There is JWST/NIRISS Wide-Field Slitless spectroscopy available in the MXDF, from the NGDEEP program (Bagley et al., 2024). There are no lines detected in MXDFz4.4’s spectrum, despite NGDEEP’s long exposure time in F200W of 31,000 sec. However, considering the flux limit of the spectra , it is unsurprising that no lines are detected. The strongest line that falls in NIRISS’ wavelength coverage is , which would fall at . The limit of the spectrum is more than the Ly flux observed by MUSE, therefore it is not surprising that is not detected. There are even scenarios of Lyman photon escape, the density-bounded case (see, e.g. Fig. 1 of Jaskot 2025), where is suppressed, due to a lack of low-ionization gas in the ISM.

References
- Earliest Galaxy Evolution in the CANUCS+Technicolor fields: Galaxy Properties at seen with the Full NIRCam Medium and Broad Band Filters. arXiv e-prints, pp. arXiv:2507.03124. External Links: Document, 2507.03124 Cited by: §I.
- EPOCHS. III. Unbiased UV Continuum Slopes at 6.5 ¡ z ¡ 13 from Combined PEARLS GTO and Public JWST/NIRCam Imaging. ApJ 995 (1), pp. 43. External Links: Document, 2404.10751 Cited by: §V.3.
- The MUSE Hubble Ultra Deep Field surveys: Data release II. A&A 670, pp. A4. External Links: Document, 2211.08493 Cited by: §I, §II.2, §II, §V.1.1, §V.1.1, §V.1.2, §VII.
- The Next Generation Deep Extragalactic Exploratory Public (NGDEEP) Survey. ApJ 965 (1), pp. L6. External Links: Document, 2302.05466 Cited by: Appendix B, §III.
- IGM transmission bias for z 2.9 Lyman continuum detected galaxies. MNRAS 502 (1), pp. 108–126. External Links: Document, 2101.00727 Cited by: §III.2, MXDFz4.4: A LyC emitter after the epoch of reionization and a first test of Ly morphology as a tracer of LyC escape at high redshift.
- Reionisation and High-Redshift Galaxies: The View from Quasar Absorption Lines. PASA 32, pp. e045. External Links: Document, 1510.03368 Cited by: §III.2.
- The Parallel Ionizing Emissivity Survey (PIE). I. Survey Design and Selection of Candidate Lyman Continuum Leakers at 3.1 ¡ z ¡ 3.5. ApJ 992 (1), pp. 155. External Links: Document, 2503.20878 Cited by: §V.
- The Hubble Ultra Deep Field. AJ 132 (5), pp. 1729–1755. External Links: Document, astro-ph/0607632 Cited by: §II.
- Connecting the escape fraction of lyman-alpha and lyman-continuum photons in star-forming galaxies at z≃ 4–5. Monthly Notices of the Royal Astronomical Society 527 (2), pp. 4040–4051. Cited by: §V.1.1.
- Into the Ly jungle: exploring the circumgalactic medium of galaxies at z 4-5 with MUSE. MNRAS 493 (4), pp. 5336–5356. External Links: Document, 2001.09058 Cited by: §III.2, §III.2.
- CIGALE: a python Code Investigating GALaxy Emission. A&A 622, pp. A103. External Links: Document, 1811.03094 Cited by: §III.1, MXDFz4.4: A LyC emitter after the epoch of reionization and a first test of Ly morphology as a tracer of LyC escape at high redshift.
- Astropy/photutils: 2.3.0 External Links: Document, Link Cited by: MXDFz4.4: A LyC emitter after the epoch of reionization and a first test of Ly morphology as a tracer of LyC escape at high redshift.
- 3D-HST: A Wide-field Grism Spectroscopic Survey with the Hubble Space Telescope. ApJS 200 (2), pp. 13. External Links: Document, 1204.2829 Cited by: §II.
- The Number Density and Mass Density of Star-forming and Quiescent Galaxies at 0.4 ¡= z ¡= 2.2. ApJ 739 (1), pp. 24. External Links: Document, 1104.2595 Cited by: §A.1.
- Stellar population synthesis at the resolution of 2003. MNRAS 344 (4), pp. 1000–1028. External Links: Document, astro-ph/0309134 Cited by: Figure 5, Figure 6, §III.1, Table 1, Table 1, Table 1, Table 1, Table 1, Table 1, MXDFz4.4: A LyC emitter after the epoch of reionization and a first test of Ly morphology as a tracer of LyC escape at high redshift.
- Star formation and dust attenuation properties in galaxies from a statistical ultraviolet-to-far-infrared analysis. MNRAS 360 (4), pp. 1413–1425. External Links: Document, astro-ph/0504434 Cited by: §III.1.
- The Dust Content and Opacity of Actively Star-forming Galaxies. ApJ 533 (2), pp. 682–695. External Links: Document, astro-ph/9911459 Cited by: §III.1.
- The Effect of Radiation and Supernovae Feedback on LyC Escape in Local Star-forming Galaxies. ApJ 982 (2), pp. 137. External Links: Document, 2409.05180 Cited by: §III.1, §VI, §VI.
- Galactic Stellar and Substellar Initial Mass Function. PASP 115 (809), pp. 763–795. External Links: Document, astro-ph/0304382 Cited by: §III.1.
- A Simple Proof of Thue’s Theorem on Circle Packing. arXiv e-prints, pp. arXiv:1009.4322. External Links: Document, 1009.4322 Cited by: §A.1.
- The far-ultraviolet continuum slope as a Lyman Continuum escape estimator at high redshift. MNRAS 517 (4), pp. 5104–5120. External Links: Document, 2207.05771 Cited by: §I, §I, §V.3, §V.3.
- The Physics of Indirect Estimators of Lyman Continuum Escape and their Application to High-Redshift JWST Galaxies. MNRAS 529 (4), pp. 3751–3767. External Links: Document, 2304.08526 Cited by: §I.
- Challenging the LyC–Ly Relation: Strong Ly Emitters without LyC Leakage at z 2.3. ApJ 986 (2), pp. 184. External Links: Document, 2406.07618 Cited by: §I.
- JWST PRIMER: a new multifield determination of the evolving galaxy UV luminosity function at redshifts z ≃ 9 - 15. MNRAS 533 (3), pp. 3222–3237. External Links: Document, 2403.03171 Cited by: §I.
- Overview of the JWST Advanced Deep Extragalactic Survey (JADES). arXiv e-prints, pp. arXiv:2306.02465. External Links: Document, 2306.02465 Cited by: §II.
- Radiation hydrodynamic simulation of the Haro 11 galaxy: the escape of LyC and Ly in a dwarf galaxy merger. arXiv e-prints, pp. arXiv:2601.20943. External Links: 2601.20943 Cited by: §V.3, §VI.
- Binary Population and Spectral Synthesis Version 2.1: Construction, Observational Verification, and New Results. PASA 34, pp. e058. External Links: Document, 1710.02154 Cited by: Figure 5, Figure 6, §III.1, Table 1, Table 1, Table 1, Table 1, Table 1, Table 1, MXDFz4.4: A LyC emitter after the epoch of reionization and a first test of Ly morphology as a tracer of LyC escape at high redshift.
- The effect of massive binaries on stellar populations and supernova progenitors. MNRAS 384 (3), pp. 1109–1118. External Links: Document, 0711.3079 Cited by: Figure 6, §III.1, §III.1, MXDFz4.4: A LyC emitter after the epoch of reionization and a first test of Ly morphology as a tracer of LyC escape at high redshift.
- A JWST/NIRCam study of key contributors to reionization: the star-forming and ionizing properties of UV-faint z 7-8 galaxies. MNRAS 524 (2), pp. 2312–2330. External Links: Document, 2208.14999 Cited by: §VI.
- The star-forming and ionizing properties of dwarf z 6-9 galaxies in JADES: insights on bursty star formation and ionized bubble growth. MNRAS 533 (1), pp. 1111–1142. External Links: Document, 2306.05295 Cited by: §VI.
- Constraining the Evolution of the Ionizing Background and the Epoch of Reionization with z~6 Quasars. II. A Sample of 19 Quasars. AJ 132 (1), pp. 117–136. External Links: Document, astro-ph/0512082 Cited by: §I.
- Conditions for Reionizing the Universe with a Low Galaxy Ionizing Photon Escape Fraction. ApJ 879 (1), pp. 36. External Links: Document, 1902.02792 Cited by: §VI.
- The Complete CEERS Early Universe Galaxy Sample: A Surprisingly Slow Evolution of the Space Density of Bright Galaxies at z 8.5–14.5. ApJ 969 (1), pp. L2. External Links: Document, 2311.04279 Cited by: §I.
- The Low-redshift Lyman Continuum Survey. II. New Insights into LyC Diagnostics. ApJ 930 (2), pp. 126. External Links: Document, 2203.15649 Cited by: §I, §I, Figure 9, §V.1.1, §V.1.1, §V.2, §VI, §VI.
- The Low-redshift Lyman Continuum Survey. I. New, Diverse Local Lyman Continuum Emitters. ApJS 260 (1), pp. 1. External Links: Document, 2201.11716 Cited by: §I, §V.
- The Low-redshift Lyman Continuum Survey: The Roles of Stellar Feedback and Interstellar Medium Geometry in LyC Escape. ApJ 985 (1), pp. 128. External Links: Document, 2409.12118 Cited by: §VI.
- emcee v3: A Python ensemble sampling toolkit for affine-invariant MCMC. The Journal of Open Source Software 4 (43), pp. 1864. External Links: Document, 1911.07688 Cited by: §V.1.3.
- emcee: The MCMC Hammer. PASP 125 (925), pp. 306. External Links: Document, 1202.3665 Cited by: §V.1.3, MXDFz4.4: A LyC emitter after the epoch of reionization and a first test of Ly morphology as a tracer of LyC escape at high redshift.
- The origin of the escape of Lyman and ionizing photons in Lyman continuum emitters. A&A 639, pp. A85. External Links: Document, 2005.07215 Cited by: §V.2.
- The Great Observatories Origins Deep Survey: Initial Results from Optical and Near-Infrared Imaging. ApJ 600 (2), pp. L93–L98. External Links: Document, astro-ph/0309105 Cited by: §II.
- Escape of Ionizing Radiation from High-Redshift Galaxies. ApJ 672 (2), pp. 765–775. External Links: Document, 0707.0879 Cited by: §VI.
- Evolution of the Lyman--emitting fraction and UV properties of lensed star-forming galaxies in the range 2.9 ¡ z ¡ 6.7. A&A 678, pp. A174. External Links: Document, 2307.15559 Cited by: §VII.
- Charting the Lyman- escape fraction in the range 2.9 ¡ z ¡ 6.7 and consequences for the LAE reionisation contribution. A&A 690, pp. A302. External Links: Document, 2408.00517 Cited by: §V.1.1.
- CANDELS: The Cosmic Assembly Near-infrared Deep Extragalactic Legacy Survey. ApJS 197 (2), pp. 35. External Links: Document, 1105.3753 Cited by: §II.
- Pure Spectroscopic Constraints on UV Luminosity Functions and Cosmic Star Formation History from 25 Galaxies at z spec = 8.61-13.20 Confirmed with JWST/NIRSpec. ApJ 960 (1), pp. 56. External Links: Document, 2304.06658 Cited by: §I.
- MegaMorph - multiwavelength measurement of galaxy structure: complete Sérsic profile information from modern surveys. MNRAS 430 (1), pp. 330–369. External Links: Document, 1212.3332 Cited by: §V.2.
- pySTARBURST99: The Next Generation of STARBURST99. ApJS 280 (1), pp. 5. External Links: Document, 2505.24841 Cited by: Figure 6, §III.1, Table 1, §IV.2, MXDFz4.4: A LyC emitter after the epoch of reionization and a first test of Ly morphology as a tracer of LyC escape at high redshift.
- On the Average Ultraviolet Emission-line Spectra of High-redshift Galaxies: Hot and Cold, Carbon-poor, Nitrogen Modest, and Oozing Ionizing Photons. ApJ 982 (1), pp. 14. External Links: Document, 2411.09262 Cited by: §I, §VI.
- The escape of Lyman photons from a young starburst: the case of Haro11†. MNRAS 382 (4), pp. 1465–1480. External Links: Document, 0710.2622 Cited by: §VI.
- Ly Emission from Green Peas: The Role of Circumgalactic Gas Density, Covering, and Kinematics. ApJ 809 (1), pp. 19. External Links: Document, 1505.05149 Cited by: §I.
- An optimal extraction algorithm for CCD spectroscopy.. PASP 98, pp. 609–617. External Links: Document Cited by: §II.2.
- A Geometrical Test of the Cosmological Energy Contents Using the Ly Forest. ApJ 511 (1), pp. L5–L8. External Links: Document, astro-ph/9807190 Cited by: §III.2.
- An updated analytic model for attenuation by the intergalactic medium. MNRAS 442 (2), pp. 1805–1820. External Links: Document, 1402.0677 Cited by: §III.2, §III.2, §III.2.
- Rest-frame ultraviolet-to-optical spectral characteristics of extremely metal-poor and metal-free galaxies. MNRAS 415 (3), pp. 2920–2931. External Links: Document, 1102.5150 Cited by: §III.2.
- Lyman alpha and Lyman continuum emission of Mg II-selected star-forming galaxies. MNRAS 515 (2), pp. 2864–2881. External Links: Document, 2207.04483 Cited by: §I.
- Extremely strong C IV 1550 nebular emission in the extremely low-metallicity star-forming galaxy J2229+2725. MNRAS 528 (1), pp. L10–L14. External Links: Document, 2311.02015 Cited by: §I.
- Detection of high Lyman continuum leakage from four low-redshift compact star-forming galaxies. MNRAS 461 (4), pp. 3683–3701. External Links: Document, 1605.05160 Cited by: §I, §I, §V.1.1, §V.2.
- J1154+2443: a low-redshift compact star-forming galaxy with a 46 per cent leakage of Lyman continuum photons. MNRAS 474 (4), pp. 4514–4527. External Links: Document, 1711.11449 Cited by: §V.1.1.
- Diverse properties of Ly emission in low-redshift compact star-forming galaxies with extremely high [O III]/[O II] ratios. MNRAS 491 (1), pp. 468–482. External Links: Document, 1910.12773 Cited by: §I, §I.
- Ly emission in low-redshift most metal-deficient compact star-forming galaxies. MNRAS 527 (1), pp. 281–297. External Links: Document, 2310.08441 Cited by: §I.
- Low-redshift Lyman continuum leaking galaxies with high [O III]/[O II] ratios. MNRAS 478 (4), pp. 4851–4865. External Links: Document, 1805.09865 Cited by: §I, §I, §I, §V.1.1.
- Multivariate Predictors of Lyman Continuum Escape. I. A Survival Analysis of the Low-redshift Lyman Continuum Survey. ApJ 972 (1), pp. 92. External Links: Document, 2406.10171 Cited by: §I, §I, §V.1.1, §V.2, §V.2.
- Ionizing Radiation Escape from Low-Redshift Galaxies and Its Connection to Cosmic Reionization. ARA&A 63 (1), pp. 45–82. External Links: Document, 2508.18411 Cited by: Appendix B, §I, §V.1.1, §V.
- The Importance of Dust Distribution in Ionizing-photon Escape: NIRCam and MIRI Imaging of a Lyman Continuum-emitting Galaxy at z 3.8. ApJ 988 (2), pp. L69. External Links: Document, 2504.01067 Cited by: §I, §V.3.
- The role of galaxies and AGN in reionizing the IGM - I. Keck spectroscopy of 5 ¡ z ¡ 7 galaxies in the QSO field J1148+5251. MNRAS 479 (1), pp. 43–63. External Links: Document, 1803.02981 Cited by: §VI.
- Radiation hydrodynamics of turbulent h ii regions in molecular clouds: a physical origin of lyc leakage and the associated lyα spectra. The Astrophysical Journal 908 (1), pp. 30. External Links: ISSN 1538-4357, Link, Document Cited by: §V.1.1, §V.1.1.
- Star Formation in Galaxies Along the Hubble Sequence. ARA&A 36, pp. 189–232. External Links: Document, astro-ph/9807187 Cited by: §V.1.1.
- Lyman continuum leaker candidates at z 3-4 in the HDUV based on a spectroscopic sample of MUSE LAEs. A&A 684, pp. A42. External Links: Document, 2312.08791 Cited by: §I, §III.2, §IV.1, §V.1.1, Table 2.
- Escape Fraction of Ionizing Photons during Reionization: Effects due to Supernova Feedback and Runaway OB Stars. ApJ 788 (2), pp. 121. External Links: Document, 1405.0552 Cited by: §VI.
- CANDELS: The Cosmic Assembly Near-infrared Deep Extragalactic Legacy Survey—The Hubble Space Telescope Observations, Imaging Data Products, and Mosaics. ApJS 197 (2), pp. 36. External Links: Document, 1105.3754 Cited by: §II.
- Power-law Emission-line Wings and Radiation-driven Superwinds in Local Lyman Continuum Emitters. ApJ 994 (2), pp. 192. External Links: Document, 2506.19623 Cited by: §VI, §VI.
- Photometry of a complete sample of faint galaxies.. ApJS 43, pp. 305–325. External Links: Document Cited by: §II.1.
- The Ly and Continuum Origins Survey. I. Survey Description and Ly Imaging. ApJS 280 (1), pp. 27. External Links: Document, 2504.07056 Cited by: §I, §V.1.2.
- The ionizing photon production efficiency of star-forming galaxies at z 4–10. A&A 698, pp. A302. External Links: Document, 2412.01358 Cited by: §I.
- MUSE Analysis of Gas around Galaxies (MAGG) - I: Survey design and the environment of a near pristine gas cloud at z ≍ 3.5. MNRAS 491 (2), pp. 2057–2074. External Links: Document, 1910.13458 Cited by: §III.2.
- High-redshift galaxies in the Hubble Deep Field: colour selection and star formation history to z~4. MNRAS 283 (4), pp. 1388–1404. External Links: Document, astro-ph/9607172 Cited by: §I.
- Predicting Lyman-continuum emission of galaxies using their physical and Lyman-alpha emission properties. A&A 663, pp. A66. External Links: Document, 2204.02440 Cited by: §I.
- Resolving dust and Ly emission in a lensed galaxy at the epoch of reionization with JWST/CANUCS. arXiv e-prints, pp. arXiv:2512.13778. External Links: Document, 2512.13778 Cited by: §V.3.
- ORIGIN: Blind detection of faint emission line galaxies in MUSE datacubes. A&A 635, pp. A194. External Links: Document, 2002.00214 Cited by: §II.2.
- Ly Emission in Starbursts: Implications for Galaxies at High Redshift. ApJ 598 (2), pp. 858–877. External Links: Document, astro-ph/0309396 Cited by: §VI.
- Large-scale excess H I absorption around z 4 galaxies detected in a background galaxy spectrum in the MUSE eXtremely deep field. MNRAS 529 (3), pp. 2794–2806. External Links: Document, 2305.15346 Cited by: §III.2.
- Bursts of Star Formation and Radiation-driven Outflows Produce Efficient LyC Leakage from Dense Compact Star Clusters. ApJ 987 (1), pp. 12. External Links: Document, 2408.14591 Cited by: §V.2, §VI.
- Unraveling the Lyman continuum emission of Ion3: Insights from HST multiband imaging and X-Shooter spectroscopy. A&A 698, pp. A203. External Links: Document, 2504.18711 Cited by: §III.2.
- Relatively Fast and Reasonably Furious: Evidence for Increased Burstiness in Smaller Halos at Cosmic Dawn. MNRAS. External Links: Document Cited by: §VI.
- Rapid Reionization by the Oligarchs: The Case for Massive, UV-bright, Star-forming Galaxies with High Escape Fractions. ApJ 892 (2), pp. 109. External Links: Document, 1907.13130 Cited by: §V.2, §V.2, §VI.
- UVCANDELS: The Role of Dust on the Stellar Mass–Size Relation of Disk Galaxies at 0.5 z 3.0. ApJ 970 (2), pp. 188. External Links: Document, 2405.10908 Cited by: §V.2.
- HDUV: The Hubble Deep UV Legacy Survey. ApJS 237 (1), pp. 12. External Links: Document, 1806.01853 Cited by: §II.
- Secondary standard stars for absolute spectrophotometry.. ApJ 266, pp. 713–717. External Links: Document Cited by: §I.
- Astrophysics of gaseous nebulae. Cited by: §III.2.
- An uncontaminated measurement of the escaping Lyman continuum at z 3. MNRAS 505 (2), pp. 2447–2467. External Links: Document, 2104.02081 Cited by: Figure 9, §V.1.1, §V, §VI.
- A Spectroscopic Analysis of the Ionizing Photon Production Efficiency in JADES and CEERS: Implications for the Ionizing Photon Budget. ApJ 981 (2), pp. 134. External Links: Document, 2407.03399 Cited by: §I.
- Detailed Structural Decomposition of Galaxy Images. AJ 124 (1), pp. 266–293. External Links: Document, astro-ph/0204182 Cited by: §V.2.
- Detailed Decomposition of Galaxy Images. II. Beyond Axisymmetric Models. AJ 139 (6), pp. 2097–2129. External Links: Document, 0912.0731 Cited by: §V.2.
- Lyman Continuum Galaxy Candidates in COSMOS. ApJ 924 (1), pp. 14. External Links: Document, 2110.06945 Cited by: §III.2.
- The Lyman continuum escape and ISM properties in Tololo 1247-232 - new insights from HST and VLA★. MNRAS 469 (3), pp. 3252–3269. External Links: Document, 1704.05943 Cited by: §V.1.2.
- UVUDF: Ultraviolet Through Near-infrared Catalog and Photometric Redshifts of Galaxies in the Hubble Ultra Deep Field. AJ 150 (1), pp. 31. External Links: Document, 1505.01160 Cited by: §II.1.
- Winds and radiation in unison: a new semi-analytic feedback model for cloud dissolution. MNRAS 470 (4), pp. 4453–4472. External Links: Document, 1704.04240 Cited by: §III.1, §VI.
- JADES Initial Data Release for the Hubble Ultra Deep Field: Revealing the Faint Infrared Sky with Deep JWST NIRCam Imaging. ApJS 269 (1), pp. 16. External Links: Document, 2306.02466 Cited by: §II.1, §II, Figure 3.
- Data from the jwst advanced deep extragalactic survey (jades). STScI/MAST. External Links: Document, Link Cited by: footnote 3.
- A bottom-up search for Lyman-continuum leakage in the Hubble Ultra Deep Field. A&A 666, pp. A145. External Links: Document, 2206.10799 Cited by: §V.
- The merger rate of galaxies in the Illustris simulation: a comparison with observations and semi-empirical models. MNRAS 449 (1), pp. 49–64. External Links: Document, 1502.01339 Cited by: §I.
- LyC escape from ¡scp¿sphinx¡/scp¿ galaxies in the epoch of reionization. Monthly Notices of the Royal Astronomical Society 515 (2), pp. 2386–2414. External Links: ISSN 1365-2966, Link, Document Cited by: §I, §VI.
- The Column Density Distribution and Continuum Opacity of the Intergalactic and Circumgalactic Medium at Redshift langzrang = 2.4. ApJ 769 (2), pp. 146. External Links: Document, 1304.6719 Cited by: §III.2, §III.2, §VI.
- The Lyman Continuum Escape Fraction of Emission Line-selected z 2.5 Galaxies Is Less Than 15%. ApJ 841 (2), pp. L27. External Links: Document, 1705.06355 Cited by: §I.
- The Ly and Continuum Origins Survey. II. The Connection between the Escape of Ionizing Radiation and Ly Halos in Star-forming Galaxies. ApJ 999 (1), pp. 71. External Links: Document, 2504.07074 Cited by: §I, Figure 11, Figure 12, §V.1.2, §V.1.2, §V.1.2, §V.1.3, §V.1.3, §V.1.3, §VI, §VI, 6th item.
- Strong C IV emission from star-forming galaxies: a case for high Lyman continuum photon escape. MNRAS 517 (1), pp. 1098–1111. External Links: Document, 2206.06161 Cited by: §I.
- Systematic Bias in Ionizing Radiation Escape Fraction Measurements from Foreground Large-scale Structures. ApJ 985 (1), pp. 115. External Links: Document, 2501.19303 Cited by: §III.2, §VI.
- Strong Lyman continuum emitting galaxies show intense C IV 1550 emission. A&A 658, pp. L11. External Links: Document, 2202.07768 Cited by: §I.
- The impact of UV variability on the abundance of bright galaxies at z 9. MNRAS 525 (3), pp. 3254–3261. External Links: Document, 2305.05679 Cited by: §VI.
- Morphologies of 190,000 Galaxies at z = 0-10 Revealed with HST Legacy Data. III. Continuum Profile and Size Evolution of Ly Emitters. ApJ 871 (2), pp. 164. External Links: Document, 1809.00765 Cited by: §V.2.
- New Constraints on the Lyman Continuum Escape Fraction at z~1.3. ApJ 668 (1), pp. 62–73. External Links: Document, 0706.4093 Cited by: §IV.1.
- The ionizing photon production efficiency at z ∼ 6 for lyman-alpha emitters using jems and muse. Monthly Notices of the Royal Astronomical Society 523 (4), pp. 5468–5486. External Links: ISSN 1365-2966, Link, Document Cited by: §I.
- Low-mass bursty galaxies in JADES efficiently produce ionizing photons and could represent the main drivers of reionization. MNRAS 527 (3), pp. 6139–6157. External Links: Document, 2310.01112 Cited by: §VI.
- Predicting Ly escape fractions with a simple observable. Ly in emission as an empirically calibrated star formation rate indicator. A&A 623, pp. A157. External Links: Document, 1803.08923 Cited by: §V.1.1.
- The Keck Lyman Continuum Spectroscopic Survey (KLCS): The Emergent Ionizing Spectrum of Galaxies at z 3. ApJ 869 (2), pp. 123. External Links: Document, 1805.06071 Cited by: §I, §I, §III.2, §V.
- Lyman-Continuum Emission from Galaxies at Z ~= 3.4. ApJ 546 (2), pp. 665–671. External Links: Document, astro-ph/0008283 Cited by: §IV.1, §IV.1, Table 2.
- Bursty Star Formation Naturally Explains the Abundance of Bright Galaxies at Cosmic Dawn. ApJ 955 (2), pp. L35. External Links: Document, 2307.15305 Cited by: §VI.
- The Ultraviolet Luminosity Function at 0.6 ¡ z ¡ 1 from UVCANDELS. ApJ 972 (1), pp. 8. External Links: Document, 2311.15664 Cited by: §II.1.
- UVUDF: Ultraviolet Imaging of the Hubble Ultra Deep Field with Wide-Field Camera 3. AJ 146 (6), pp. 159. External Links: Document, 1305.1357 Cited by: §II.
- Fluctuating feedback-regulated escape fraction of ionizing radiation in low-mass, high-redshift galaxies. MNRAS 470 (1), pp. 224–239. External Links: Document, 1705.00941 Cited by: §III.1, §VI, §VI.
- Direct Lyman continuum and Ly escape observed at redshift 4. MNRAS 476 (1), pp. L15–L19. External Links: Document, 1712.07661 Cited by: §I, §III.2.
- Lyman- spectral properties of five newly discovered Lyman continuum emitters. A&A 597, pp. A13. External Links: Document, 1609.03477 Cited by: §I, §VI.
- Using Lyman- to detect galaxies that leak Lyman continuum. A&A 578, pp. A7. External Links: Document, 1404.2958 Cited by: §I, §V.1.1, §VI.
- The Lyman Continuum Escape Fraction of Star-forming Galaxies at 2.4 z 3.0 from UVCANDELS. ApJ 980 (1), pp. 74. External Links: Document, 2308.09064 Cited by: §II.
- The JWST Extragalactic Mock Catalog: Modeling Galaxy Populations from the UV through the Near-IR over 13 Billion Years of Cosmic History. ApJS 236 (2), pp. 33. External Links: Document, 1802.05272 Cited by: Figure 2, §III.
- JEMS: A Deep Medium-band Imaging Survey in the Hubble Ultra Deep Field with JWST NIRCam and NIRISS. ApJS 268 (2), pp. 64. External Links: Document, 2301.09780 Cited by: §II.
- Data from the jwst extragalactic medium-band survey (jems). STScI/MAST. External Links: Document, Link Cited by: footnote 3.
- Extended Lyman haloes around individual high-redshift galaxies revealed by MUSE. A&A 587, pp. A98. External Links: Document, 1509.05143 Cited by: §V.1.2.
- The escape of ionizing photons from supernova-dominated primordial galaxies. MNRAS 398 (2), pp. 715–721. External Links: Document, 0906.1658 Cited by: §VI.