Einstein Probe discovery of EP J171159.4333253:
an eclipsing neutron star low-mass X-ray binary with clocked bursts
Abstract
EP J171159.4333253 is a new neutron-star low-mass X-ray binary discovered in outburst by the Einstein Probe (EP) on 2025 June 23, exhibiting clocked type-I X-ray bursts, eclipses and dips. In this paper, we report on the results of the X-ray spectral and timing analyses for EP J171159.4333253 using data collected by EP and NuSTAR during the first 21 days of the outburst. The X-ray burst recurrence time can be characterized over a subset of nine bursts spanning 1.6 days around the NuSTAR observation, and the result is s with indications of a possible decreasing trend. From the X-ray eclipse events, the binary orbital period and the eclipse duration are estimated to be hr and s, respectively. These enable an estimate of the mass and radius of the companion star and the binary inclination, which are , and , respectively. We also report on joint ULTRACAM and EP observations on 2025 July 21–22, detecting the source optical counterpart and covering an eclipse in both X-ray and optical bands. The optical eclipse is wavelength-dependent and broader than in X-rays, indicating that part of the optical emission arises from an extended region in the accretion flow. Despite a moderate variation in the source flux, the properties of the persistent X-ray emission are typical of a hard spectral state. We further evaluated the ratio of the accretion energy to the thermonuclear energy to be 120–130, implying helium bursts with the accreted hydrogen being depleted in-between bursts.
show]wangyilong@nao.cas.cn
]cotizelati@ice.csic.es
]parent@ice.csic.es
]marino@ice.csic.es
]rea@ice.csic.es
]vik.dhillon@sheffield.ac.uk
]blanco@ice.csic.es
]iribas@ice.csic.es
]s.littlefair@sheffield.ac.uk
]yangzh@ihep.ac.cn
]zhangguobao@ynao.ac.cn
]sebastien.guillot@irap.omp.eu
]nikangrui0@163.com
]jhwu@e.gzhu.edu.cn
]patruno@ice.csic.es
]yuri.cavecchi@upc.edu
]giulia.illiano@inaf.it
]alessandro.papitto@inaf.it
]filippo.ambrosino@inaf.it
]bfliu@nao.cas.cn
]hqcheng@bao.ac.cn
]hfeng@ihep.ac.cn
]hujingwei@nao.cas.cn
]ccjin@nao.cas.cn
]hsun@bao.ac.cn
]taolian@ihep.ac.cn
]xuyj@ihep.ac.cn
]hnyang@nao.cas.cn
]wmy@nao.cas.cn
]zhaoqc@ihep.ac.cn
I Introduction
Low-mass X-ray binaries (LMXBs) are binary systems composed of a compact stellar object, either a black hole (BH) or a neutron star (NS), and a companion star typically with a mass comparable to or less than the solar mass (e.g. Lewin et al., 1995; Bahramian and Degenaar, 2022). In NS-LMXBs, the matter accreted on top of the NS surface can sometimes undergo thermonuclear runaways and produce explosions, known as type-I X-ray bursts (e.g. Fujimoto et al., 1981; Galloway and Keek, 2021). These phenomena naturally require the accreting compact object to possess a surface where matter can accumulate, making type-I X-ray bursts exclusive to NS-LMXBs and thus a clear signature of an NS accretor. Type-I X-ray bursts are usually observed to repeat at variable intervals, depending on the accretion rate of the system as well as the chemical composition of the accreted matter. Among more than one hundred previously known bursters (Galloway et al., 2020), only seven sources are known to have shown bursts that repeat quasi-periodically, which are referred to as clocked bursters: GS 182624 (the prototype; e.g. Ubertini et al., 1999), KS 1731260 (Cornelisse et al., 2003), GS 0836429 (Aranzana et al., 2016), IGR J174802446 (Motta et al., 2011; Chakraborty et al., 2011), MAXI J1816195 (Bult et al., 2022; Wang et al., 2024), 1RXS J180408.9342058 (Marino et al., 2019; Fiocchi et al., 2019) and SRGA J144459.260420 (Ng et al., 2024; Molkov et al., 2024; Dohi et al., 2025; Papitto et al., 2025).
In this paper, we report on the discovery of a new clocked burster, EP J171159.4333253 (hereafter EP J17113332). EP J17113332 was first detected by the Wide-field X-ray Telescope (WXT) on board the Einstein Probe (EP) mission (Yuan et al., 2022, 2025) in one observation performed on 2025 June 23, and therefore was initially designated as EP250623a (Ni et al., 2025). However, stacking of WXT data showed that a weak signal from the source location could already be detected at least on June 21. Then, on June 25, a target-of-opportunity (ToO) observation at the WXT position was performed with the Follow-up X-ray Telescope (FXT) on board EP. An uncatalogued X-ray source was detected at , , with an uncertainty of in radius (90% confidence level, statistical and systematic), giving the source a final designation of EP J171159.4333253 (Wu et al., 2025). The FXT light curve, apart from the persistent emission, showed a short burst lasting s and a low-count-rate period (later identified as a dip event), which, together with the low Galactic latitude of EP J17113332, led to the tentative identification of the source as an eclipsing NS-LMXB. A Nuclear Spectroscopic Telescope Array (NuSTAR) follow-up observation was performed on 2025 June 27. Seven bursts with quasi-periodic recurrence time of s were detected (Marino et al., 2025b), suggesting that EP J17113332 is a clocked burster.
A radio follow-up observation performed with MeerKAT on 2025 June 30 revealed a counterpart within the FXT position error, with a 1.3-GHz flux density of (Cowie et al., 2025). In the optical band, on 2025 June 28, a ToO observation with the Visible Telescope (VT) on board the Space Variable Objects Monitor (SVOM) detected a candidate optical counterpart with magnitudes of mag and mag in the VT-Red and VT-Blue bands, respectively (Guillot et al., 2025). However, the source was not detected in two observations performed respectively with the 0.4-m Super Light Telescope (SLT) and the 0.5-m Robotic Imager For Transients (RIFT) at Lulin Observatory on 2025 June 27 and July 3, which gave 3- upper limits of 18.8 mag with the rp filter of SLT and 19.0 mag with the white filter of RIFT (Kong et al., 2025). On 2025 July 21, we confirmed the optical counterpart of EP J17113332 using the ULTRACAM camera mounted on the 3.5-m New Technology Telescope (NTT), as reported in this work.
II Observations and data reduction
Our main dataset includes observations obtained over the first 21 days of the outburst with the following X-ray telescopes: WXT and FXT on board EP and NuSTAR (see Table B1 for details). Photon arrival times recorded by the different instruments were corrected to the Solar System barycenter using the JPL DE430 ephemeris and the source position determined from MeerKAT observations: R. A. = 17h11m59.31s, Dec. = –33∘32′52.5′′ (J2000.0; Cowie et al. 2025).
Additionally, we present the results of an optical observation performed on 2025 July 21-22 by ULTRACAM, and partial results of a simultaneous X-ray observation by EP/FXT. A detailed analysis of this X-ray observation, together with the remaining observations performed after 2025 July 13, will be presented in a companion paper (Yang et al., in prep.), which focuses on the long-term evolution of EP J17113332 throughout this outburst.
II.1 Einstein Probe
II.1.1 Wide-field X-ray Telescope (WXT)
The WXT on board EP (Yuan et al., 2022) is a wide-field monitor equipped with the novel lobster-eye micro-pore optics, giving it a field of view (FOV) of . Operating in the 0.5–4 keV band, WXT has a sensitivity of for a typical exposure of 1 ks. The energy resolution is 170 eV at 1 keV and the spatial resolution is (FWHM).
EP/WXT detected X-ray emission from the position of EP J17113332 in a snapshot beginning on 2025 June 23 at 12:37:24 UTC. From that moment on and until July 13, the source was detected by WXT for a total of 184 times, with individual snapshot exposures ranging from 0.4 to 9.3 ks and a total exposure time of Ms. Figure 1 presents the WXT light curve, binned approximately on a daily timescale, derived by combining all spectral data acquired each day and fitting the resulting spectra with an absorbed power-law model. In the fits, the value for the absorption column density was held fixed to the value obtained from the broadband spectral analysis (Section III.4.1), whereas the power-law photon index, , was allowed to vary. We note that the WXT light curves occasionally demonstrate suggestive hints consistent with eclipses and X-ray bursts. However, in order to perform a robust timing analysis when only WXT data are available, the limited sensitivity of WXT requires a careful exploration of binning choices and detection criteria over a large dataset, which is beyond the scope of this work.

II.1.2 Follow-up X-ray Telescope (FXT)
The FXT (Chen et al., 2020) on board EP is a Wolter-I telescope operating in the 0.3–10 keV band. It has a sensitivity of for an exposure of 10 ks. The energy resolution is 120 eV at 1.25 keV (FWHM) and the typical localization uncertainty is (90% confidence level). EP/FXT consists of two identical modules, FXT-A and FXT-B. During the observation, the two modules can be set in different science modes, including Partial Window mode (PW, with a time resolution of 2 ms), Full Frame mode (FF, with a time resolution of 50 ms) and Timing mode (TM, with a time resolution of 23.6 s).
The first follow-up observation with EP/FXT was performed on 2025 June 25 at 14:09:08 UTC, two days after the WXT detection. In this observation, an X-ray burst and a dip event were detected, which motivated a daily monitoring program with FXT. In this work, we analyzed the dataset of the first 22 EP/FXT observations collected over 21 days following the onset of the outburst. The data were reduced with the fxtchain tool available within the FXT Data Analysis Software Package (FXTDAS; v1.20) following the standard procedure described in the FXT User Guide.111https://epfxt.ihep.ac.cn/analysis Further filtering of the data was performed with Xselect. For PW and FF data, a circular source region with a radius of and an annular background region with inner and outer radii of and were adopted. Moreover, for FF data the inner region around the source position was excluded, in order to mitigate the pile-up effect. For TM data, box regions () aligned with the roll angle of the satellite during each observation were used for both source and background extractions, with the center of the background region shifted from the source location by .
II.2 NuSTAR
NuSTAR (Harrison et al., 2013) is a hard X-ray observatory consisting of two Wolter-I telescopes, focusing X-rays onto two Focal Plane Modules (FPM), labeled A and B. Operating in the 3–79 keV band, it provides high-sensitivity timing measurements with a time resolution of about 2 s. The energy resolution (FWHM) is 400 eV at 10 keV and 900 eV at 68 keV. The angular resolution (FWHM) is . The sensitivity of NuSTAR is in 6–10 keV and in 10–30 keV, for an exposure of s.
A NuSTAR observation targeting EP J17113332 was carried out on 2025 June 27, for a total on-source exposure of 46.7 ks. We reduced the data from both FPM detectors using standard tools within the NuSTARDAS package (v.2.1.4a). The source region was extracted using a circular region of radius centered at the coordinates of the source. To account for possible spatial non-uniformities in the detector background, we extracted background spectra from four 50′′ circular regions placed away from the source and distributed across the FOV so as to maximize their separation. We extracted 1-s binned light curves with Xselect and inspected them in search for type-I X-ray bursts, eclipses and/or dips. We identified the time intervals corresponding to these events through visual inspection, grouping consecutive time bins that are significantly above (for bursts) or below (for eclipses and dips) the persistent emission level. In order to isolate the persistent emission, we ran NuPRODUCTS to extract spectra and light curves from an event file in which those burst and eclipse/dip intervals had been filtered out. Additionally, separate NuPRODUCTS runs were performed on event files containing only the burst intervals.
II.3 ULTRACAM
On 2025 July 21 at 23:39:45 (UTC), we observed EP J17113332 simultaneously in the , and filters using the high-speed, triple-beam imager ULTRACAM (Dhillon et al., 2007) on the 3.5-m NTT at La Silla, Chile. We used the so-called Super SDSS filters in ULTRACAM, which are more top-hat in shape than the original SDSS filter set and have significantly higher throughputs, particularly in the and bands (see Dhillon et al., 2021). A total of 785 frames were obtained, each of 10.0 s exposure time. The instrument was used in full-frame mode, no-clear mode, giving a dead time of 0.024 s between frames, where each ULTRACAM frame is GPS time-stamped to a relative (i.e. frame-to-frame) accuracy of 50 s and an absolute accuracy of 1 ms (Dhillon et al., 2007). The source was too faint to detect in the -band frames and therefore data in this filter will not be discussed further here.
The ULTRACAM data were reduced using the HiPERCAM data reduction pipeline (Dhillon et al., 2021). All frames were debiased and then flat-fielded, the latter using the median of twilight-sky frames taken with the telescope spiralling. Due to the crowded field, we used point-spread function (PSF) photometry to extract the counts from EP J17113332 and a number of comparison stars in the same FOV, the latter acting as the reference for the PSF fits, and providing corrections for transparency and extinction variations. The comparison stars were also used for flux calibration via their magnitudes given in the SkyMapper Southern Sky Survey DR4 (Onken et al., 2024).
III Data analysis and results
III.1 Timing analysis of the clocked bursts
III.1.1 Search for X-ray bursts
We searched for X-ray bursts by identifying statistically significant count rate excesses in the data. First, the cleaned, barycentered event data were binned into 2-s light curves. Assuming the background emission is dominated by Poisson noise, we computed for each time bin the chance probability for a noise fluctuation, , where is the observed number of counts and is the mean count rate of the relevant observation. These tail probabilities were converted to Gaussian-equivalent significances by mapping to a one-sided normal deviate via , yielding expressed in units of standard deviations (Cowan, 1998).
Burst candidates were defined as time intervals where the significance exceeded 3. The peak time of each burst was defined as the center of the time bin with the maximum significance value. Burst start and end times were determined by tracking the rise and decay phases of the significance profile until the significance either ceased to decrease monotonically or fell below a 1 threshold. We note that this threshold corresponds to a constant Poisson tail probability that is independent of the local count rate or noise level, serving only as a conservative criterion for defining burst boundaries. In addition, we estimated the decay timescale for each burst by fitting the light curve with a Gaussian-rise plus exponential-decay model.
To maximize photon statistics, we performed the timing analysis of the bursts using the full energy band available for each dataset. We verified that the differences in the derived timing parameters when using the full band versus a fixed common energy range (e.g., 3–10 keV) are negligible as compared to the time resolution of the light curves.
In total, we identified 16 bursts, corresponding to 17 detections: seven in the NuSTAR observation (see Figure 2 for the light curve) and ten in the EP/FXT data (one burst was simultaneously detected by both instruments). Burst properties are listed in Table B2.

III.1.2 Burst recurrence time
The recurrence time of the bursts, , is defined as the interval between consecutive burst onsets. Due to the intrinsic variability in and the long data gaps in our datasets, we were only able to obtain reliable estimate of for eight consecutive pairs of bursts spanning 1.6 days around the time of the NuSTAR observation. For these eight pairs of bursts we measured a weighted median s (95% confidence level; blue lines in the left panel of Figure 3). Moreover, the data hint at a decreasing trend in , and with a linear fit we derived s day-1 (95% confidence level; orange lines in the left panel of Figure 3). The details of this analysis are presented in Appendix A.

In the type-I X-ray bursters, a decreasing trend in typically points to an increase in the accretion rate and hence in the observed persistent flux (see Section IV.5 for a more detailed discussion). Motivated by this, we also analyzed the NuSTAR persistent-emission light curves in the 3–10 keV and 10–79 keV bands. As with the analysis, we fitted the data with both a constant and a linear model using maximum likelihood with an intrinsic-scatter term . In both energy bands, a linear increase is strongly preferred (right panel of Figure 3). For the 10–79 keV band, we obtained, under the linear model, a slope of with . A likelihood-ratio test calibrated by 2000 bootstrap simulations gave , indicating a highly significant increasing trend. Similarly, in the 3–10 keV band we obtained a slope of and , with a likelihood-ratio . In both cases, the intrinsic scatter term makes the residuals compatible with Gaussian noise, and the bootstrap-calibrated likelihood-ratio test confirms the strong preference for a linear increase of the persistent flux during the observation.
Furthermore, we fitted the relation between and the observed count rate with a power-law model: , where and are the model parameters to be determined, and is the NuSTAR count rate during persistent emission. In order to perform this fit, the NuSTAR data in the 3–79 keV band were first binned over individual observational segments separated by the gaps during the observation. We then paired each value with the average count rate of the segment that is closest in time. Finally, we obtained the following best-fit results (95% confidence level), confirming the anti-correlation between and the observed persistent flux: , with 6 degrees of freedom (dof). The fitting results are also presented in Figure B1.
III.2 Timing analysis of eclipses and dips in X-rays
Apart from the type-I X-ray bursts, the light curves of EP J17113332 obtained by both EP/FXT and NuSTAR clearly demonstrated two more types of prominent variabilities, eclipses and dips.
We first investigated the periodicity of the eclipses by applying the Bayesian block algorithm (Scargle et al., 2013) to photon arrival times in each observation. This method identifies statistically significant changes in the source count rate and divides a light curve into several segments (blocks) based on these changes. The count rate is therefore roughly constant within each block yet drastically changes at the edges between neighboring blocks. This algorithm is well-suited to detecting the sharp transitions expected during eclipse events. Eclipses were identified as intervals during which the count rate dropped to the background level. The start of each eclipse (ingress) was defined as the beginning of the block immediately following a sharp decline in count rate, while the end (egress) was defined as the termination of the block preceding a sharp recovery to the out-of-eclipse level. The statistical uncertainty on each ingress and egress time was conservatively estimated as half the interval between the last photon before and the first photon after the identified block edge.
Only one complete eclipse was observed in our dataset (EP/FXT, ObsID 11900304129; see Figure 4), while the remaining events were either ingress-only or egress-only detections. This was primarily due to the limited duration of the good time intervals, which often started or ended during the eclipse itself. In total, we identified seven ingress and two egress times across six distinct eclipses.
To assign integer cycle numbers to each event, we used a provisional orbital period estimated from the separation between consecutive ingress times observed with NuSTAR (Figure 2). We also adopted a provisional eclipse duration of s, measured from the complete eclipse, to provide a consistent phase reference for all eclipses, including the partial ones.
The mid-eclipse time of the nth orbital cycle () is defined as , where is the reference mid-eclipse epoch for cycle zero, and is the orbital period. The ingress and egress times are modeled as where is the eclipse duration for cycle . Rather than assuming a fixed eclipse duration, we model each as a random draw from a parent Gaussian distribution with mean , representing the typical eclipse duration, and standard deviation , which captures intrinsic variability from cycle to cycle. The joint posterior over the model parameters was sampled using Markov Chain Monte Carlo (MCMC; Hastings, 1970) techniques. We measured hr, MJD, s and s (95% upper limit: 68.6 s). Uncertainties represent the 16th and 84th percentiles of the marginal posterior distributions.

Apart from the eclipses, we also identified a total of six dip events from our main dataset with the Bayesian block algorithm: two in the NuSTAR observation (Figure 2) and four in the EP/FXT dataset (Figure 5). Similar to eclipses, dips also involve significant rises and drops in the count rate, but they were distinguished from eclipses because of their irregular recurrence and variable duration. Moreover, during the dip events, the count rate never dropped to the background level as was the case for eclipses, and the light curve demonstrated irregular short-term variations that never occurred in eclipses. These differences point to fundamentally different physical mechanisms behind these two types of events. We note that, in order to mitigate the impact of random short-term statistical fluctuations, we conservatively retained only the detected dip candidates which lasted for over 100 s.

III.3 Searches for coherent pulsations and burst oscillations
We used the pulsar timing software package PRESTO (Ransom, 2011) to perform Fourier-domain accelerated searches for coherent signals in the data collected during the persistent emission periods by both EP/FXT and NuSTAR. Data were divided into chunks with a length of 2.3 ks, corresponding to roughly one tenth of the orbital period estimated from the periodic recurrence of the eclipses. We chose this segment duration to maximize sensitivity (proportional to , where is the duration of the observation) while avoiding the loss of power caused by non-linear acceleration Doppler smearing, known to be significant for higher than (Ransom, 2001; Ransom et al., 2002; Andersen and Ransom, 2018). No statistically significant signals were found. The best constraint on the pulsed-fraction upper limit was obtained with ObsID 06800000720, which is 11% (99% confidence level, in 0.5–10 keV band). We also performed the same analysis within 0.5–2 keV and 2–10 keV bands in order to separate the emissions from disk and corona, and the derived pulsed-fraction upper limits are 13% (ObsID 06800000724) and 22% (ObsID 06800000720), respectively.
We also searched for burst oscillations in each type-I X-ray burst using sliding Fourier windows of 1, 2, and 4 s duration. For each burst, the search covered the interval from 10 s before the burst onset to the end of the burst, corresponding to a total duration of approximately 130 s. Power spectra were computed in the frequency range of 50–2000 Hz using Leahy normalization. Adjacent time windows were stepped by half of the window length. The total number of independent trials per burst was therefore , accounting for the number of time windows, frequency bins, and window lengths. No statistically significant oscillation signal was detected after correcting for the number of trials. We derived upper limits on the fractional rms amplitude by converting the detection-threshold power to rms amplitude using , where is the total number of photons in each time window. For a global confidence level, this corresponds to a Leahy-normalized power threshold of .
This analysis was performed for the eight bursts observed by EP/FXT in TM, and the resulting upper limits on the oscillation amplitude depend on the burst brightness and integration time. The most constraining limits we obtained are approximately rms for 1-s windows, rms for 2-s windows, and rms for 4-s windows, with the tightest constraints obtained from the brightest bursts and the longest integration times. For NuSTAR bursts, with the same analysis, the limits we derived are rms for 1-s windows, rms for 2-s windows, and rms for 4-s windows.
III.4 X-ray spectral analysis
III.4.1 Persistent emission
In this section, we report on the spectral analysis of the persistent emission from EP J17113332 excluding bursts, eclipses and dips. All EP/FXT and NuSTAR spectra were grouped using the optimal binning following Kaastra and Bleeker (2016), while maintaining at least 25 counts per bin to allow the use of statistics. Spectral fits were performed with Xspec v12.12.1. In all cases, we applied the TBabs model to account for interstellar absorption, adopting photoelectric cross-sections and elemental abundances from Verner et al. (1996) and Wilms et al. (2000), respectively. When combining data from multiple instruments, a constant component was added to account for cross-calibration uncertainties, and we verified that differences in the constant values between instruments remained within 20%.
With the aim to perform a broadband spectral analysis, we paired our NuSTAR spectrum with all the EP observations performed within the NuSTAR observing window, i.e., ObsIDs 0680000699, 0680000706 and 0680000707 (see Table B1 for more details). An initial exploratory fit with a simple TBabspowerlaw model (Model 0) was found unacceptable, as significant unmodeled residuals were present below 2 keV, around 7 keV and beyond 20 keV (see Figure 6). The residuals indicate the presence of both a soft thermal component and reflection features. We therefore adopted a more physically motivated model, assuming the canonical three-component model (including blackbody emission from the NS/boundary layer, multicolor disk blackbody emission from the disk and Compton-scattering from a hot inner flow or corona) for NS-LMXBs spectra by Lin et al. (2007). In practice, the powerlaw component was replaced with a bbodyrad convolved with thcomp (Zdziarski et al., 2020), to jointly model the Comptonization and the seed photon spectra. This component assumes a geometry where the photons coming from the NS or the boundary layer around it are Compton-scattered by the corona. To represent the soft thermal emission, we added a diskbb component. As required by the observed residuals, we also included a component to model the contribution from the reflection spectrum arising from the reprocessing by the disk of the incident Comptonization spectrum emitted by the corona (see, e.g. Ludlam, 2024, for a recent review on reflection in NS-LMXBs). Such a component was accounted for using the self-consistent relxillCp model (García et al., 2014). To capture the low-energy roll-over in the seed photon spectrum — unaccounted for in relxillCp, which assumes a fixed and unrealistically low seed temperature of 0.05 keV — we included an expabs multiplicative component, characterized by the cut-off energy parameter. By running ftest, both diskbb and relxillCp were found to be highly statistically significant, with probabilities of improvement by chance of 10-20 and 10-29, respectively. Despite the inclusion of reflection, residual absorption features remained near 7 keV, prompting us to add a gaussian absorption line, a common feature in eclipsing/dipping LMXBs (for a review, see Díaz Trigo and Boirin, 2016). Our final model reads therefore:
This continuum modeling approach is commonly adopted in broadband spectral studies of NS-LMXBs, as demonstrated by several recent works (Gambino et al., 2019; Mondal et al., 2020; Marino et al., 2023; Banerjee and Homan, 2024; Marino et al., 2025a). An overview of all the parameters included in the model is reported in Table 1. For physical consistency, we tied to , the photon indices and electron temperatures of thcomp and relxillcp and fixed the reflection fraction parameter to to only consider the reflection spectral component. Some parameters were not well constrained by the fit, so that we froze them to typically adopted values for LMXBs (e.g. Marino et al., 2022; Ludlam, 2024; Malacaria et al., 2025; La Monaca et al., 2025), i.e., the emissivity index to 3, the Fe abundance AFe to 1, and the density parameter to 20. For the binary inclination , which was also not well constrained by the fit due to degeneracies, we fixed the value to 74∘ (see Section IV.1 for the discussion on the binary inclination ).
| Component | Parameter | Unit | Description | Value |
|---|---|---|---|---|
| TBabs | 1022 cm-2 | Equivalent hydrogen column density | 0.48 | |
| thComp | Power-law index of the Comptonization spectrum | 1.90 | ||
| keV | Electron temperature of the corona | 22 | ||
| Covering fraction | (1.0) | |||
| bbodyrad | keV | Blackbody temperature | 0.80 | |
| Blackbody normalization | 28 | |||
| diskbb | keV | Inner disk temperature | 0.30 | |
| Disk normalization | 400 | |||
| expabs | keV | Low energy cut-off | ||
| relxillCp | ∘ | Binary inclination | (74.0) | |
| Spin parameter | (0) | |||
| Inner disk radius | 38 | |||
| Outer disk radius | (1000) | |||
| Disk emissivity | (3.0) | |||
| Redshift to the source | (0) | |||
| Power-law index of the incident spectrum | ||||
| Disk ionization | 2.13 | |||
| cm-3 | Disk density | (20.0) | ||
| AFe | Fe abundance of reflecting material | (1.0) | ||
| keV | Electron temperature of the corona | |||
| Reflection fraction | () | |||
| Reflection normalization | 0.0021 | |||
| gaussian | keV | Line centroid energy | (6.97) | |
| keV | Line width | (0.2) | ||
| Line normalization | ||||
| cflux | (10-10) erg cm-2 s-1 | X-ray unabsorbed flux | 2.0700.008 | |
| for degrees of freedom |

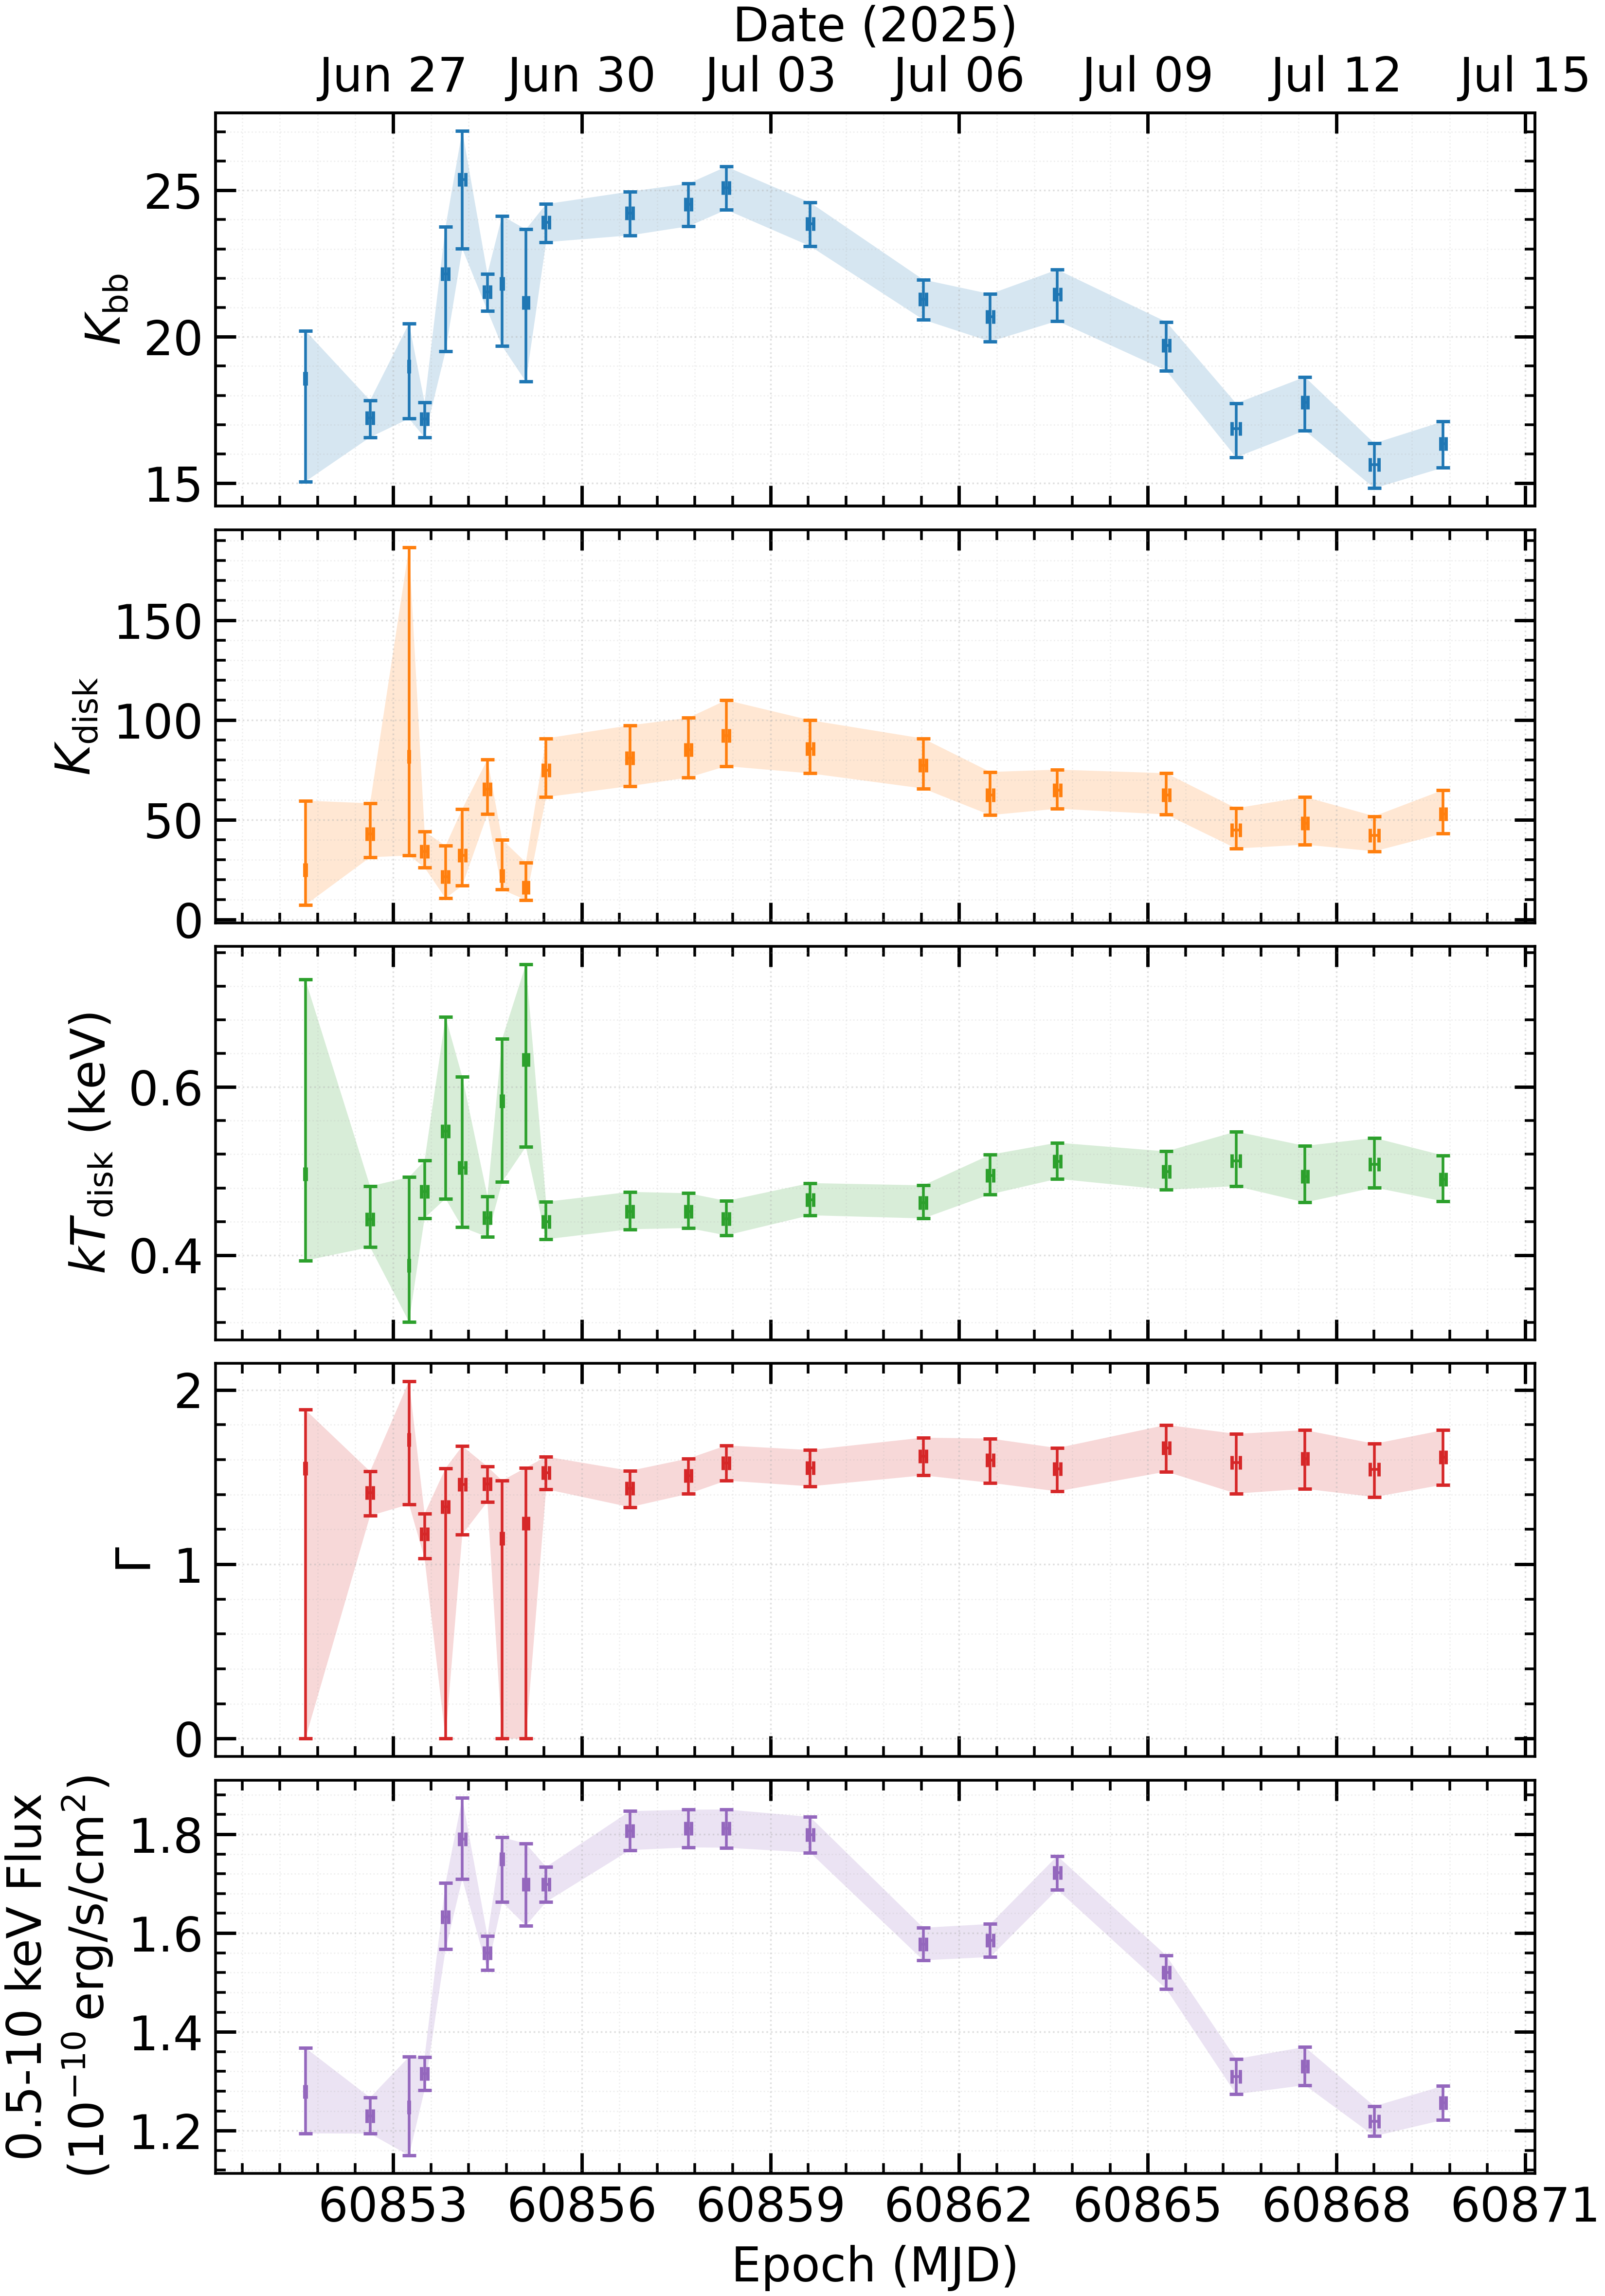
In order to investigate the long-term evolution of the persistent emission, we performed similar spectral analysis for the rest of the FXT observations as well. Due to a lack of high-energy coverage above 10 keV and the absence of clear residuals due to reflection when only FXT data are available, we removed relxillCp from the spectral model, thus adopting a simplified version that reads: . To better constrain the parameters, during spectral fitting, we fixed the values of the hydrogen column density (), electron temperature of the corona () and blackbody temperature () to the values derived from the joint fitting with NuSTAR (see Table 1), and the value of covering fraction () to . Data collected by both FXT-A and FXT-B were used for spectral analysis, except that for TM we ignored the data below and the data above due to known calibration issues (private communication). The unfolded EP/FXT spectra and the spectral fitting residuals are shown in Figure B3. The evolution of the key spectral parameters is shown in Figure 7 and a detailed discussion is given in Section IV.4.
III.4.2 Type-I X-ray burst emission
We performed time-resolved spectral analysis for all the bursts. For each burst, we divided the whole time span into several segments and performed spectral fitting for each segment. For the seven bursts in the NuSTAR dataset (Table B2), the Xspec model adopted in the analysis is , where nthComp is used to account for the persistent emission during the burst and bbodyrad models the burst spectrum. During the spectral fitting, the values of , , , (note that here is a parameter of nthComp, representing the temperature of the seed photons for Comptonization) were fixed to those derived from the broadband spectral analysis of the persistent emission (Table 1). We further tied the normalization of nthComp, , across the different segments in order to better constrain the variations of the bbodyrad model parameters used to describe the thermal emission during the bursts, given the relatively low count statistics in each segment. A similar analysis was also performed for bursts in the EP/FXT dataset (Table B2), adopting a simplified model of due to the limited bandpass of FXT. In order to account for the persistent emission which is not included in such a model, we used the pre-burst persistent spectrum as background. We were able to derive acceptable fits (with ) and constrain the spectral parameters for most of the time segments. The evolution of , and for each burst is presented in Figure B4 (NuSTAR) and Figure B5 (EP/FXT). We found no evidence for photospheric radius expansion (see e.g. Lewin et al., 1993) in either of the datasets, implying that the burst luminosities are sub-Eddington. The peak burst temperature can reach keV (e.g. burst No. 7) and the peak bolometric flux during the bursts is (burst No. 16).
Burst No. 8 was simultaneously detected by both NuSTAR and EP/FXT, providing an excellent opportunity to investigate its spectral evolution over a broad energy range. We performed time-resolved spectral analysis from the onset to the end of the burst using time bins of 5 s, 10 s, 20 s, and 50 s, combining data from both instruments. We adopted two different methods to analyze the burst spectra. The first is the standard approach, commonly referred to as the “classical” method, which assumes that the persistent emission remains unchanged before and during the burst. This assumption is also made for the other 15 bursts. In this method, the 100 s pre-burst spectrum was used as the background in the spectral fitting and the burst emission was modeled with in XSPEC. The second method is the so-called variable-persistent emission method (Worpel et al., 2013), which allows the persistent emission to vary in intensity during the burst while assuming that its spectral shape remains unchanged. We adopted the model and allowed only to vary, thereby accounting for changes in the persistent emission during the burst.
The spectral analysis results are presented in Figure B6. At the onset of burst No. 8, the bolometric flux rises rapidly to a peak of , accompanied by a high blackbody temperature of keV. During the subsequent decay phase, the flux decreases monotonically, while shows a gradual cooling trend toward keV. In contrast, initially increases around the burst peak and then declines, consistent with the cooling tail behavior commonly observed in thermonuclear bursts. The results obtained with the classical and methods are broadly consistent in terms of the overall flux and temperature evolution. However, the method indicates a significant enhancement of the persistent emission during the early phase of the burst, as reflected by an increase in that peaks near the burst maximum and subsequently decreases toward the pre-burst level. This suggests that the burst temporarily amplifies the persistent emission component, while the intrinsic burst emission follows a standard cooling evolution trend.
III.4.3 Ratio of accretion energy to thermonuclear energy
The above spectral-timing analysis allowed us to evaluate another key parameter, the ratio between the accretion energy released in the interval between two consecutive bursts and the thermonuclear energy released during the second burst (). Among the 16 bursts detected, there are only three pairs of bursts that were consecutive, i.e., no more bursts likely occurred in between. Specifically, the three pairs are bursts No. 4–5, No. 5–6 and No. 9–10, which allowed us to estimate for bursts No. 5, 6 and 10. For each of the three pairs, we performed spectral fitting both for the burst and for the persistent emission between the bursts using the same methods described in Section III.4.1 and Section III.4.2, and we estimated the bolometric fluxes by extrapolating the best-fit models to the 0.01–100 keV band. was then derived as the ratio between the bolometric fluence of the persistent emission and that of the burst. We estimated for bursts No. 5 and 6, and for burst No. 10. The implication of these values is discussed in Section IV.5.
III.5 The optical counterpart
We constructed light curves for all of the stars within the various X-ray, radio and optical error circles reported in Section I. Only one target (see Figure 8 for the optical image) showed any significant variability. Moreover, this variability is in the form of an optical eclipse that coincides with the time of the X-ray eclipse — further discussed in Section III.5.1 — giving us great confidence that we have indeed identified the optical counterpart.
III.5.1 The optical eclipse
Using the simultaneous ULTRACAM and EP observations, we studied the eclipse duration over different energy bands. Figure 9 shows that the optical flux exhibits a smooth transition during the eclipses, in stark contrast to the sharp behavior observed in the X-rays. In order to model specifically these differences, we fit each optical light curve with a piecewise-linear trapezoidal model (after removing the flare, see Section III.5.2) that includes seven free parameters: the out-of-eclipse flux levels (allowed to differ before and after the eclipse), the in-eclipse flux, the ingress start time, and the durations of the three segments. The profile of the trapezoidal model is flat outside the eclipse, linear during ingress and egress, and constant during totality. Fits were performed over a time interval fully covering the eclipse and displaying stable out-of-eclipse emission, by means of a non-linear least-squares algorithm. Parameter uncertainties were derived from 300 bootstrap realizations per band, where synthetic light curves were generated by perturbing the best-fit model with Gaussian noise and refitting them.
The analysis was repeated using several bin sizes between 50 and 100 s, given that the parameter values may depend to some extent on the temporal binning of the light curves. Across all tested binnings, the total eclipse duration ranges from s in the band to s in the band. Thus, the -band eclipse is consistently longer than in the -band by –400 s, with a statistical significance of across all tests. We also measured the eclipse depth, defined as the difference between the average out-of-eclipse flux and the flux during totality, expressed as a fraction of the out-of-eclipse level. Across all sampled binnings, the eclipse removes of the -band flux and of the -band flux.
Combined with the X-ray eclipse results (see Section III.2), our measurements show that the eclipse is shorter and removes a larger fraction of the emission at shorter wavelengths, revealing a clear wavelength dependence in the occulted component.
III.5.2 The optical flare
The ULTRACAM light curves reveal an optical flare that occurred entirely during the eclipse and lasted a few minutes (Figure 9). It is likely a real feature and not an artifact as it was visible in both bands, and it does not correlate with variations in the seeing, transparency or object positions on the CCD. The flare reached a peak intensity exceeding the out-of-eclipse level of the persistent optical emission. The color evolution, shown in the bottom panel of Figure 9, indicates that the emission becomes slightly bluer at the flare peak.


IV Discussion
EP J17113332 is a new NS-LMXB discovered in outburst by the Einstein Probe on 2025 June 23. It exhibited rare behaviors including clocked bursts, eclipses and dip events. In this section we discuss in detail these phenomena and their implications, as well as the spectral properties of the persistent emission.
IV.1 Properties of the binary system
With the knowledge of the orbital period determined from the eclipses, i.e. hr (see Section III.2), we can give a rough estimate of the mass and radius of the companion star. Eggleton (1983) derived the effective radius of the Roche lobe () as
| (1) |
where , with and being the masses of the NS and the companion, respectively. is the orbital separation of the system given by
| (2) |
Assuming a Roche-lobe filling companion with , where is the radius of the star, these yield a mass-radius relation for the companion,
| (3) |
To solve for both and , another mass-radius relation is required, for which we tested three relations available in literature: the empirical mass-radius relation for single low-mass () main-sequence stars (Demircan and Kahraman, 1991), the mass-radius relation derived with a sample of companion stars in cataclysmic variables (CVs; but LMXBs appear to follow a similar trend; Smith and Dhillon 1998), and a more recent relation which also applies to Roche-lobe filling CV donors (McAllister et al., 2019). Assuming a typical NS mass of , the three relations give broadly consistent values of and . These are consistent with a K-type star.222Based on the relation between stellar mass and spectral type provided in A Modern Mean Dwarf Stellar Color and Effective Temperature Sequence. See also Pecaut and Mamajek (2013). Moreover, Smith and Dhillon (1998) provided an empirical relation between the companion spectral type and the orbital period for CVs and LMXBs, which, with hr, predicts a spectral type of K7 with a range of K4 to M0, confirming our previous estimate.
The inclination of an eclipsing system can be expressed by
| (4) |
where is the eclipse half-angle, which can be estimated as (Joss and Rappaport, 1984). From the above, we estimate a high binary inclination of .
The longer and shallower eclipses seen in the optical bands indicate that a substantial fraction of the optical emission originates in an extended region surrounding the NS. The characteristic radius of the eclipsed emitting region at wavelength is given by
| (5) |
We obtain – and –, indicating a larger characteristic size for the redder optical emission. The eclipse depths are likewise consistent with a progressively larger extended/uneclipsed contribution at longer wavelengths.
The optical flare detected during eclipse (see Section III.5.2) also provides additional clues about the companion. The flare properties resemble impulsive magnetic events in active late-type stars, in which a brief heating episode produces a hot, blue continuum followed by a more gradual cooling phase. The fact that the flare remains visible during eclipse implies that its emitting region is not obscured together with the NS and the inner accretion flow. This points to the hemisphere of the Roche-lobe–filling companion facing the observer as the most likely site of emission. Overall, this would be consistent with our estimate of a companion star with a spectral type of K4 to M0, which is known to produce such energetic flares from magnetic activities (e.g. Yang et al., 2023). However, the possibility of the optical flare originating from the reprocessed emission of a type-I X-ray burst cannot be completely ruled out. For example, a recent study by Rikame et al. (2025) showed that type-I X-ray bursts can indeed be detected during eclipses as reprocessed emission, although in their cases the emission can be detected in the X-ray band, while for the optical flare under discussion here, no simultaneous increase in X-rays was detected.
IV.2 Constraints on the distance and luminosity
From the broadband spectral analysis with NuSTAR and FXT data (Table 1), we constrained the value of the hydrogen column density to cm-2. This result was then compared with the estimated column density curve along the line of sight in the direction of EP J17113332, which is accessible from the 3D--tool333http://astro.uni-tuebingen.de/nh3d/nhtool (Doroshenko, 2024; Edenhofer et al., 2024; Yao et al., 2017; Planck Collaboration et al., 2016), to estimate the source distance, . We used a Monte Carlo method to account for the uncertainties in and derived a lower limit of for the distance. The peak bolometric flux of the type-I X-ray bursts we estimated in this work is (Section III.4.2). The Eddington luminosity for the bursts is , estimated with an NS mass of and a hydrogen mass fraction of (See Section IV.5 for discussion on the burst fuel). By limiting the peak burst luminosity under the Eddington value, and assuming the emission is isotropic, we obtained a loose upper limit of on the distance. This value is not constraining as it already exceeds the approximate extent of the Galaxy in the direction of EP J17113332, which is (e.g. Castro-Ginard et al., 2021).
A better constraint on the distance can be derived using the optical data obtained by ULTRACAM. During the optical eclipse (Section III.5.1), it is reasonable to assume that the optical emission is predominantly from the non-irradiated side of the companion star, and therefore the apparent magnitude of the star can be measured. Using SMSS 171158.71333340.7, a bright star approximately south of the target, as a calibrator, the observed optical fluxes were calibrated into magnitudes. We adopted the faintest magnitudes during the eclipse as the apparent magnitudes of the star, which are (1 uncertainty) in the -band and in the -band. Then, tentatively assuming a spectral type of K4 to M0 (Section IV.1), the absolute magnitudes of the companion in the two bands were derived to be and .444The absolute magnitude in the -band is provided in A Modern Mean Dwarf Stellar Color and Effective Temperature Sequence and the value can be transformed into those in SDSS photometry (see Jordi et al., 2006). Note that ULTRACAM uses “Super SDSS filters”, but here we tentatively ignored the difference for simplicity. Further considering the interstellar extinction in the two bands, and ,555The extinction curve in the -band was obtained with the 3D--tool, which was then transformed into and using python package dust_extinction (Gordon, 2024; Gordon et al., 2023, 2009; Fitzpatrick et al., 2019; Gordon et al., 2021; Decleir et al., 2022). the distance of the system can be estimated by solving the following equation:
| (6) |
We thus derived and from the - and -band data, respectively. The latter provides a tighter constraint, as the data have smaller uncertainties.
In summary, the best constraints on the distance of the system available so far are and , with which the luminosity of the source can be estimated. Extrapolating the best-fit 1–10 keV spectral model presented in Table 1 to the 0.01–100 keV range, we estimated a bolometric correction factor of . The bolometric flux of the persistent emission at the epoch of the NuSTAR observation is therefore , which corresponds to a luminosity of . The Eddington ratio is thus , where is the Eddington luminosity estimated with an NS mass of and a hydrogen mass fraction of assumed for the accretion flow from a hydrogen-rich K-type companion (Section IV.1).
We note that this estimated value of the Eddington ratio is significantly lower than that of a typical LMXB in outburst, which is of the order of a few tens of percent (e.g. Muñoz-Darias et al., 2014). The burst recurrence time of also points to a higher bolometric luminosity of (Section IV.5). On the one hand, it could imply that we have underestimated the source distance. One possibility could be that the optical emission during the eclipse is still dominantly contributed by the disc, and the true apparent magnitude of the companion star is therefore higher than the value we adopted, which then would lead to a larger distance estimate. On the other hand, it is also possible that the low observed luminosity is a result of the high inclination of EP J17113332. For example, 4U 1822371, another high-inclination LMXB with a low observed luminosity, was argued to have an intrinsic luminosity which is two orders of magnitude higher, and the suggested explanation is that most of the observed radiation is contributed by the photons scattered along the line of sight in an accretion-disc corona, which is only a small fraction of those emitted in the inner accretion flow (see e.g. Anitra et al., 2021, and references therein). Moreover, high inclination has been invoked in the past to explain the behavior of LMXBs which display faint (i.e., peaking at Eddington ratio or less) outbursts, the so-called very faint X-ray transients (e.g. Muno et al., 2005; King and Wijnands, 2006).
IV.3 The dip events
We identified a total of six dip events in our main dataset (Section III.2). Despite the significant differences in the duration and the short-term variations seen in the light curves, we note that all six dips were found to occur within the orbital phase range of 0.6–0.7 (with the center of eclipses defined as phase 0.5), suggesting a possible correlation with the binary orbit. The phase dependency has also been seen in other dipping systems (for a review, see Di Salvo et al., 2023). This supports the interpretation that dip events arise from the obscuration of the central X-ray source by the bulge produced by the impact of matter transferred from the companion star at the outer disk. Alternatively, it is also possible that the obscuration is not resulted from the bulge itself, but it is instead caused by the mass transfer stream from the star, which could ricochet off the disk edge during the impact and overflow towards smaller radii, generating the observed dips (Armitage and Livio, 1996). This scenario was used to explain the phase-dependent dips observed in GRO J165540 (Kuulkers et al., 2000), although the dips in this system happened at a different phase range from that of EP J17113332 (note that Kuulkers et al. 2000 defined the mid-eclipse as phase 1.0). However, the occurrence of dips is still far from regular, e.g., the NuSTAR observation covered the 0.6–0.7 range of orbital phase also during two other orbits, yet no dips were detected, suggesting a variable nature of the obscuring material.
We also note that the dips were observed only in the observations before 2025 June 28 and in the last observation on 2025 July 13, which coincide with the periods when the source flux was at a relatively low value of (Figure 7). The flux dependence of dip events was also seen in other sources, e.g. MAXI J1820070 (Kajava et al., 2019) and MAXI J1659152 (Kuulkers et al., 2013). The disappearance of dips at higher flux levels likely reflects changes in the ionization and vertical structure of the disk rim: as the accretion rate increases, stronger irradiation and radiation pressure can ionize or geometrically smooth the bulge at the stream–disk impact point, reducing its ability to obscure the central source or to deflect the mass transfer stream.
Apart from the six dips in the main dataset, a possible optical dip can be seen also in the ULTRACAM light curves (Figure 9) at around MJD 60878.00 (for -band), together with an X-ray counterpart in the FXT light curve. Optical dips were also observed in other dipping systems (e.g. Motch et al., 1987; Thomas et al., 1993; Panizo-Espinar et al., 2024). We note that this dip showed a wavelength-dependent delay, with the detection in the less energetic band lagging behind that in the more energetic band. Moreover, this event happened before the eclipse and therefore at a different orbital phase from the other six dips. The decrease of the X-ray flux during this dip is also not as significant as the others, suggesting a different physical origin of this event.
IV.4 Spectral properties of the persistent emission
We extensively monitored the spectral evolution of EP J17113332 with EP/FXT during the first 21 days of the outburst (see Figure 7). The source was initially detected with an observed persistent flux of in 0.5–10 keV band, which rose to on June 27. The flux remained roughly constant until July 7 then slowly declined back to the initial flux level of . Despite the variation in flux, the spectral shape did not show significant changes (see also Figure B3). In all the observations presented in this work, EP J17113332 exhibited a typical hard-state spectrum, with a low power-law photon index of . Moreover, from our broadband spectral analysis performed with both EP/FXT and NuSTAR data (see Figure 6 and Table 1), we obtained an inner disk radius of and a corona electron temperature of keV. These are also broadly consistent with those seen in the hard spectral state of NS-LMXBs (e.g. Pintore et al., 2018; Marino et al., 2022; Ludlam, 2024; Illiano et al., 2024). We thus suggest the following accretion geometry: a truncated accretion disk with the inner region replaced by a hot accretion flow (corona), which Compton scatters soft photons emitted from a hot region on the NS surface. The area of this region is as measured from the blackbody normalization, using the distance of the system at kpc (Section IV.2).
IV.5 Comparison of EP J17113332 with other clocked bursters
The defining observational characteristic of clocked bursters is the quasi-periodic recurrence of type-I X-ray bursts. Owing to long data gaps and intrinsic variability in the burst rate, we could not obtain a coherent periodic solution across the full 16-day dataset, which included 16 bursts. Reliable recurrence times were measured only for eight consecutive pairs of bursts spanning 1.6 days around the time of the NuSTAR observation. Despite the presence of bad time intervals in the data, their durations are much shorter than the characteristic timescale of the bursting cycle. For this subset, we found s ( mHz). The possibility that multiple bursts were missed during these gaps (potentially leading to an overestimation of by identifying it as a lower-frequency harmonic of a shorter underlying fundamental period) is ruled out by the absence of bursts during intervals with continuous data coverage. The data showed a marginal linear decrease in the recurrence rate of s day-1, although notable scatter remains, indicating intrinsic variability in the accretion rate or burning conditions on the NS on the timescale of individual bursts (Figure 3). Additional continuous observations covering multiple consecutive bursts would be required to provide a more precise characterization of the source’s temporal behavior.
In the seven known clocked bursters, the recurrence time of bursts is generally found to be anti-correlated with the source flux and is typically of the order of hours (see Cavecchi et al. 2025 and references therein for a further discussion). This anti-correlation is also found in a larger sample of NS-LMXBs with type-I X-ray bursts, as can be seen in the trend of the distribution of such systems in the plane, extending from s at to s at (see figure 1 in Kormpakis et al., 2025). Such a trend is expected, since a higher implies a higher accretion rate, reducing the time needed to accumulate enough amount of matter to trigger thermonuclear runaway. Based on this observed trend, s as measured for EP J17113332 would imply a luminosity of , which is higher by 1–2 orders of magnitude than the luminosity we measured in Section IV.2. We also found an increasing trend for the persistent emission count rate during the NuSTAR observation, which is qualitatively consistent with the decreasing trend of (Section III.1.2). We further note that the increase in the count rate was energy-dependent, i.e., the count rate in the 3–10 keV band rose faster than that in the 10–79 keV band, demonstrating a slow evolution of the spectral shape in real time (Figure 3).
The spectral properties of the persistent emission are typical of a hard spectral state (Section IV.4), which is also the case for several other clocked bursters, including the prototype, GS 182624 (e.g. Ubertini et al., 1999).
We also estimated the parameter for bursts No. 5, 6 and 10, which has a high value of 120–130 (Section III.4.3). As a comparison, GS 182624 had an value of (Ubertini et al., 1999). Further assuming that the mass and radius of the NS are and km, we estimated the mean hydrogen mass fraction at ignition to be (using equation (11) in Galloway et al., 2022), corresponding to helium-rich burst fuel. For simplicity, here we assumed that the burst and the persistent emission have the same anisotropy factors. Since we expect the accreted gas from the K-type companion to be hydrogen-rich, this value implies that most of the accreted hydrogen is consumed by stable burning before a helium burst ignites (burning regime (III) in Galloway and Keek, 2021).
V Summary
We summarize the main results on this new transient NS binary system, EP J17113332, as derived from X-ray and optical observations:
-
•
EP J17113332 is a clocked burster and its burst recurrence time can be characterized over a subset of nine bursts spanning 1.6 days around the NuSTAR observation, which is s. A likely linear decrease of its recurrence time ( s day-1) is also detected, although notable scatter remains. Remarkably, the NuSTAR light curve demonstrated an increasing trend, which is qualitatively consistent with the decrease of .
-
•
EP J17113332 is an eclipsing binary with an orbital period of hr and a typical X-ray eclipse duration of s. Apart from the eclipses, the source also exhibits dip events that seem to occur mostly at the same orbital phase range. The presence of the dips also exhibits a possible correlation with the source flux. The mass and radius of the companion star are estimated to be and , pointing to a K-type star. The binary inclination is .
-
•
Eclipses and dips are also present in the ULTRACAM optical light curves. The optical eclipses are broader and shallower than in X-rays and show a clear wavelength dependence, with longer and less deep eclipses in the redder band. By comparing the optical and X-ray ingress and egress times, we infer that a substantial fraction of the optical emission arises from an extended region in the accretion flow (disk and/or stream impact region). The dip observed in this joint EP-ULTRACAM observation also showed a wavelength-dependent delay, with the detection in the less energetic band lagging behind that in the more energetic band. In addition, this dip probably has a different physical origin from the other dips, as it occurred in a different orbital phase and the X-ray flux decrease during it is also less significant.
-
•
The ULTRACAM data reveal a short optical flare occurring during the eclipse. The event shows a blueward color change at peak and lacks an X-ray counterpart, pointing to a magnetic flare on the Roche-lobe-filling companion star, even though the possibility of the optical flare originating from the reprocessed emission of a type-I X-ray burst cannot be fully ruled out.
-
•
The distance of the system is constrained to kpc. With this distance range, the Eddington luminosity ratio of the persistent emission of EP J17113332 during the NuSTAR observation is estimated to be . Such a low value of observed luminosity could be the result of the high inclination of the system.
-
•
During the first 21 days of the outburst, the persistent emission of EP J17113332 showed moderate variation in the observed flux, but the spectral shape did not show significant changes. The spectral properties are typical of a hard spectral state.
-
•
The ratio of accretion energy to thermonuclear energy () is estimated to be 120–130, which corresponds to a mean hydrogen mass fraction at ignition of , implying helium bursts with the accreted hydrogen being depleted by stable burning in-between bursts.
Appendix A Measurement of the burst recurrence time
To characterize , we define burst times of arrival (TOAs) corresponding to the burst start times. TOA uncertainties were estimated from the flux rise duration, i.e. from the start time to the peak time.
First, we estimated using the seven detected bursts in the NuSTAR observation (see Figure 2) as this segment of the dataset exhibited the highest burst detection rate. Assuming a stable and periodic across the NuSTAR observation, we estimated the underlying periodicity by computing all pairwise TOA differences and identifying a common integer divisor. This yielded a period of approximately 8200 s, corresponding to a burst recurrence frequency of mHz.
Next, we used the estimated to attempt to derive a coherent timing solution across all 16 burst TOAs using the PINT pulsar timing software (Luo et al., 2021; Susobhanan et al., 2024). We first fitted the data with a model in which was the sole free parameter. We were unable to derive an acceptable solution — post-fit residuals spanned thousands of seconds, indicating the presence of intrinsic variation in the burst repetition frequency. We also found degeneracies in the inferred number of burst cycles between consecutive detections when the temporal gap exceeds approximately ten cycles. Introducing a first frequency derivative, , as an additional free parameter did not produce a statistically significant improvement in the fit.
Lacking a coherent solution across all bursts, we opted to conservatively assess the timing variability of bursts by applying a timing model with as the sole free parameter to pairs of consecutive bursts across the full TOA set. Measurements from TOA pairs yielding degenerate solutions were excluded from further analysis. Solutions for 8 of the 15 TOA pairs, covering all NuSTAR bursts, were obtained over a 1.6-day interval, from the EP/FXT burst on 2025-06-27 19:23:31 (UTC) to that on 2025-06-29 09:53:52 (UTC), corresponding to bursts No. 3–11 in Table B2. Best-fit values are shown in the left panel of Figure 3.
From these eight measurements we obtained a weighted median s (95% confidence level). A simple weighted constant fit gave post-fit residuals with reduced chi-squared (7 dof), indicating unmodeled variability in the burst recurrence time. A decreasing trend in can be seen, and fitting the temporal evolution with a linear model yielded s day-1 (95% confidence level), and a corresponding (6 dof). To account for the extra scatter beyond the quoted statistical uncertainties, we modeled the values as Gaussian-distributed around either a constant or a linear trend, with an additional intrinsic scatter term added in quadrature to the individual statistical errors, and fitted both models by maximum likelihood estimation. Under the constant model we obtained and s, while the linear model gave , and s. A likelihood-ratio test between these two models, calibrated with a parametric bootstrap using 2000 simulations, yielded a -value of for a non-zero slope, and a bootstrap 95% confidence interval for the slope of s day-1, indicating modest but statistically significant evidence for a decrease of during the outburst.
Appendix B Supplementary results
In this appendix, we present supplementary tables and figures to complement the results reported in the main text. The details of the X-ray observations presented in this work are listed in Table B1. The properties of the 16 detected type-I X-ray bursts are listed in Table B2. The fitting results of the relation between and the observed NuSTAR count rate during persistent emission are presented in Figure B1. The light curves and spectra collected by EP/FXT are respectively presented in Figure B2 and Figure B3. The results of the time-resolved spectral analyses for the bursts detected by NuSTAR and EP/FXT are shown in Figure B4 and Figure B5, respectively. Burst No. 8 is the only burst simultaneously covered by both EP/FXT and NuSTAR, and its spectral analysis results are presented separately in Figure B6.
| Telescope | Mode | ObsID | Start – End Time (UTC) | Exposure |
|---|---|---|---|---|
| (YYYY-MM-DD HH:MM:SS) | (ks) | |||
| EP/FXT | FF+FF | 06800000695 | 2025-06-25 14:09:08 – 2025-06-25 15:00:09 | 3.1 |
| EP/FXT | PW+TM | 06800000697 | 2025-06-26 14:08:34 – 2025-06-26 16:35:19 | 6.0 |
| EP/FXT | PW+TM | 06800000702 | 2025-06-27 06:08:10 – 2025-06-27 06:18:35 | 0.6 |
| EP/FXT | PW+TM | 06800000698 | 2025-06-27 10:56:04 – 2025-06-27 13:22:38 | 6.1 |
| EP/FXT | FF+FF | 06800000705 | 2025-06-27 18:55:52 – 2025-06-27 21:22:22 | 4.8 |
| NuSTAR | – | 81101345002 | 2025-06-27 20:50:57 – 2025-06-28 21:14:06 | 46.7 |
| EP/FXT | FF+FF | 06800000706 | 2025-06-28 01:19:42 – 2025-06-28 03:46:09 | 3.1 |
| EP/FXT | PW+TM | 06800000699 | 2025-06-28 10:55:28 – 2025-06-28 13:22:06 | 6.1 |
| EP/FXT | FF+FF | 06800000707 | 2025-06-28 17:19:19 – 2025-06-28 18:09:41 | 3.0 |
| EP/FXT | FF+FF | 06800000708 | 2025-06-29 01:19:07 – 2025-06-29 03:45:22 | 3.3 |
| EP/FXT | PW+TM | 06800000700 | 2025-06-29 09:18:55 – 2025-06-29 11:45:22 | 6.1 |
| EP/FXT | PW+TM | 06800000701 | 2025-06-30 17:18:07 – 2025-06-30 19:44:17 | 5.1 |
| EP/FXT | PW+TM | 06800000717 | 2025-07-01 15:41:30 – 2025-07-01 18:07:31 | 6.0 |
| EP/FXT | PW+TM | 06800000718 | 2025-07-02 06:05:06 – 2025-07-02 08:31:01 | 5.2 |
| EP/FXT | PW+TM | 06800000720 | 2025-07-03 14:04:08 – 2025-07-03 16:29:54 | 6.0 |
| EP/FXT | PW+TM | 06800000722 | 2025-07-05 09:14:35 – 2025-07-05 11:40:20 | 6.0 |
| EP/FXT | PW+TM | 06800000723 | 2025-07-06 10:50:04 – 2025-07-06 13:15:25 | 6.0 |
| EP/FXT | PW+TM | 06800000724 | 2025-07-07 12:24:40 – 2025-07-07 14:50:28 | 6.0 |
| EP/FXT | PW+TM | 11900302977 | 2025-07-09 05:59:06 – 2025-07-09 08:24:56 | 6.0 |
| EP/FXT | PW+TM | 11900304129 | 2025-07-10 08:16:45 – 2025-07-10 11:25:05 | 5.8 |
| EP/FXT | PW+TM | 11900305153 | 2025-07-11 11:03:37 – 2025-07-11 13:11:02 | 4.9 |
| EP/FXT | PW+TM | 11900306945 | 2025-07-12 13:01:38 – 2025-07-12 16:13:15 | 5.6 |
| EP/FXT | PW+TM | 11900307969 | 2025-07-13 15:49:35 – 2025-07-13 17:57:19 | 4.3 |
Note. — FF: Full Frame mode; PW: Partial Window mode; TM: Timing mode. PW+TM denotes the configuration in which FXT-A and FXT-B are set in PW and TM, respectively.
| Burst No. | Telescope | ObsID | Start Date | Start Time | Peak Time | Decay Timescale | Fluence | |
|---|---|---|---|---|---|---|---|---|
| (YYYY-MM-DD) | (HH:MM:SS) | (HH:MM:SS) | (s) | (counts) | (s) | |||
| 1 | EP/FXT | 06800000695 | 2025-06-25 | 14:30:41 | 14:30:58 | 21(3) | 988(3) | – |
| 2 | EP/FXT | 06800000697 | 2025-06-26 | 14:25:40 | 14:25:57 | 27(3) | 959(5) | – |
| 3 | EP/FXT | 06800000705 | 2025-06-27 | 19:23:31 | 19:23:42 | 40(4) | 796(5) | – |
| 4 | NuSTAR | 81101345002 | 2025-06-27 | 21:43:39 | 21:43:48 | 17(3) | 826(6) | 8408(47) |
| 5 | NuSTAR | 81101345002 | 2025-06-28 | 00:00:35 | 00:00:40 | 19(2) | 1549(7) | 8216(41) |
| 6 | NuSTAR | 81101345002 | 2025-06-28 | 02:19:45 | 02:19:58 | 42(3) | 1724(3) | 8350(59) |
| 7 | NuSTAR | 81101345002 | 2025-06-28 | 06:59:13 | 06:59:30 | 29(3) | 1688(8) | 8384(60) |
| 8 | NuSTAR | 81101345002 | 2025-06-28 | 11:31:30 | 11:31:47 | 31(3) | 1939(4) | 8168(59) |
| 8 | EP/FXT | 06800000699 | 2025-06-28 | 11:31:46 | 11:31:57 | 30(3) | 1190(6) | 8168(59) |
| 9 | NuSTAR | 81101345002 | 2025-06-28 | 15:59:12 | 15:59:23 | 30(3) | 1824(11) | 8031(59) |
| 10 | NuSTAR | 81101345002 | 2025-06-28 | 18:13:57 | 18:14:08 | 21(3) | 1739(8) | 8085(54) |
| 11 | EP/FXT | 06800000700 | 2025-06-29 | 09:53:52 | 09:53:59 | 32(3) | 1255(10) | 8056(51) |
| 12 | EP/FXT | 06800000718 | 2025-07-02 | 06:25:32 | 06:25:45 | 30(3) | 1559(8) | – |
| 13 | EP/FXT | 06800000720 | 2025-07-03 | 16:11:59 | 16:12:14 | 52(4) | 2066(9) | – |
| 14 | EP/FXT | 06800000724 | 2025-07-07 | 14:00:46 | 14:00:55 | 47(3) | 2227(12) | – |
| 15 | EP/FXT | 11900304129 | 2025-07-10 | 10:58:49 | 10:59:14 | 35(3) | 2043(6) | – |
| 16 | EP/FXT | 11900305153 | 2025-07-11 | 11:07:44 | 11:08:01 | 28(3) | 2313(7) | – |


References
- A Fourier Domain “Jerk” Search for Binary Pulsars. ApJ 863 (1), pp. L13. External Links: Document, 1807.07900 Cited by: §III.3.
- Spectral analysis of the low-mass X-ray pulsar 4U 1822-371: Reflection component in a high-inclination system. A&A 654, pp. A160. External Links: Document, 2109.01023 Cited by: §IV.2.
- New insights into the quasi-periodic X-ray burster GS 0836-429. A&A 586, pp. A142. External Links: Document, 1512.02409 Cited by: §I.
- Accretion Disks in Interacting Binaries: Simulations of the Stream-Disk Impact. ApJ 470, pp. 1024. External Links: Document, astro-ph/9606038 Cited by: §IV.3.
- XSPEC: The First Ten Years. In Astronomical Data Analysis Software and Systems V, G. H. Jacoby and J. Barnes (Eds.), Astronomical Society of the Pacific Conference Series, Vol. 101, pp. 17. Cited by: Einstein Probe discovery of EP J171159.4333253: an eclipsing neutron star low-mass X-ray binary with clocked bursts.
- Low-mass x-ray binaries. In Handbook of X-ray and Gamma-ray Astrophysics, C. Bambi and A. Santangelo (Eds.), pp. 1–62. External Links: ISBN 978-981-16-4544-0, Document, Link Cited by: §I.
- Probing the accretion geometry of the atoll source 4U 1702-429 in different spectral states with NICER, NuSTAR, and AstroSat. MNRAS 529 (4), pp. 4311–4324. External Links: Document, 2402.11844 Cited by: §III.4.1.
- The Discovery of the 528.6 Hz Accreting Millisecond X-Ray Pulsar MAXI J1816-195. ApJ 935 (2), pp. L32. External Links: Document, 2208.04721 Cited by: §I.
- Milky Way spiral arms from open clusters in Gaia EDR3. A&A 652, pp. A162. External Links: Document, 2105.04590 Cited by: §IV.2.
- A solution to the tension of burning on neutron stars and nuclear physics. arXiv e-prints, pp. arXiv:2506.11966. External Links: Document, 2506.11966 Cited by: §IV.5.
- Terzan 5 transient IGR J17480-2446: variation of burst and spectral properties with spectral states. MNRAS 418 (1), pp. 490–499. External Links: Document, 1102.1033 Cited by: §I.
- Status of the follow-up x-ray telescope onboard the Einstein Probe satellite. In Space Telescopes and Instrumentation 2020: Ultraviolet to Gamma Ray, J. A. den Herder, S. Nikzad, and K. Nakazawa (Eds.), Society of Photo-Optical Instrumentation Engineers (SPIE) Conference Series, Vol. 11444, pp. 114445B. External Links: Document Cited by: §II.1.2.
- Six years of BeppoSAX Wide Field Cameras observations of nine galactic type I X-ray bursters. A&A 405, pp. 1033–1042. External Links: Document, astro-ph/0304500 Cited by: §I.
- Statistical data analysis. Oxford University Press. External Links: ISBN 9780198501565, Document, Link Cited by: §III.1.1.
- Discovery of the radio counterpart of EP J171159.4-333253/EP250623a with MeerKAT. The Astronomer’s Telegram 17258, pp. 1. Cited by: §I, §II.
- SpeX Near-infrared Spectroscopic Extinction Curves in the Milky Way. ApJ 930 (1), pp. 15. External Links: Document, 2204.13716 Cited by: footnote 5.
- Stellar Mass / Luminosity and Mass / Radius Relations. Ap&SS 181 (2), pp. 313–322. External Links: Document Cited by: §IV.1.
- HiPERCAM: a quintuple-beam, high-speed optical imager on the 10.4-m Gran Telescopio Canarias. MNRAS 507 (1), pp. 350–366. External Links: Document, 2107.10124 Cited by: §II.3, §II.3.
- ULTRACAM: an ultrafast, triple-beam CCD camera for high-speed astrophysics. MNRAS 378 (3), pp. 825–840. External Links: Document, 0704.2557 Cited by: §II.3.
- Low-Magnetic-Field Neutron Stars in X-ray Binaries. In Handbook of X-ray and Gamma-ray Astrophysics, pp. 147. External Links: Document Cited by: §IV.3.
- Accretion disc atmospheres and winds in low-mass X-ray binaries. Astronomische Nachrichten 337 (4-5), pp. 368. External Links: Document, 1510.03576 Cited by: §III.4.1.
- Evidence of non-solar elemental composition in the clocked X-ray burster SRGA J144459.2-604207. PASJ 77 (3), pp. L17–L23. External Links: Document, 2411.10993 Cited by: §I.
- 3D--tool. arXiv e-prints, pp. arXiv:2403.03127. External Links: Document, 2403.03127 Cited by: §IV.2.
- A parsec-scale Galactic 3D dust map out to 1.25 kpc from the Sun. A&A 685, pp. A82. External Links: Document, 2308.01295 Cited by: §IV.2.
- Aproximations to the radii of Roche lobes.. ApJ 268, pp. 368–369. External Links: Document Cited by: §IV.1.
- Quasi-simultaneous INTEGRAL, SWIFT, and NuSTAR Observations of the New X-Ray Clocked Burster 1RXS J180408.9-342058. ApJ 887 (1), pp. 30. External Links: Document, 1910.09325 Cited by: §I.
- An Analysis of the Shapes of Interstellar Extinction Curves. VII. Milky Way Spectrophotometric Optical-through-ultraviolet Extinction and Its R-dependence. ApJ 886 (2), pp. 108. External Links: Document, 1910.08852 Cited by: footnote 5.
- Shell flashes on accreting neutron stars and X-ray bursts. ApJ 247, pp. 267–278. External Links: Document Cited by: §I.
- The Multi-INstrument Burst ARchive (MINBAR). ApJS 249 (2), pp. 32. External Links: Document, 2003.00685 Cited by: §I.
- Robust Inference of Neutron-star Parameters from Thermonuclear Burst Observations. ApJS 263 (2), pp. 30. External Links: Document, 2210.03598 Cited by: §IV.5.
- Thermonuclear X-ray Bursts. In Timing Neutron Stars: Pulsations, Oscillations and Explosions, T. M. Belloni, M. Méndez, and C. Zhang (Eds.), Astrophysics and Space Science Library, Vol. 461, pp. 209–262. External Links: Document, 1712.06227 Cited by: §I, §IV.5.
- Spectral analysis of the dipping LMXB system XB 1916-053. A&A 625, pp. A92. External Links: Document, 1904.05770 Cited by: §III.4.1.
- Improved Reflection Models of Black Hole Accretion Disks: Treating the Angular Distribution of X-Rays. ApJ 782, pp. 76. External Links: Document, 1312.3231 Cited by: §III.4.1.
- FUSE Measurements of Far-Ultraviolet Extinction. III. The Dependence on R(V) and Discrete Feature Limits from 75 Galactic Sightlines. ApJ 705 (2), pp. 1320–1335. External Links: Document, 0909.3087 Cited by: footnote 5.
- One Relation for All Wavelengths: The Far-ultraviolet to Mid-infrared Milky Way Spectroscopic R(V)-dependent Dust Extinction Relationship. ApJ 950 (2), pp. 86. External Links: Document, 2304.01991 Cited by: footnote 5.
- Milky Way Mid-Infrared Spitzer Spectroscopic Extinction Curves: Continuum and Silicate Features. ApJ 916 (1), pp. 33. External Links: Document, 2105.05087 Cited by: footnote 5.
- dust_extinction: Interstellar Dust Extinction Models. The Journal of Open Source Software 9 (100), pp. 7023. External Links: Document Cited by: footnote 5.
- SVOM/VT discovery of an optical counterpart to the new NS-LXMB EP J171159.4-333253. The Astronomer’s Telegram 17272, pp. 1. Cited by: §I.
- The Nuclear Spectroscopic Telescope Array (NuSTAR) High-energy X-Ray Mission. ApJ 770 (2), pp. 103. External Links: Document, 1301.7307 Cited by: §II.2.
- Monte Carlo Sampling Methods using Markov Chains and their Applications. Biometrika 57 (1), pp. 97–109. External Links: Document Cited by: §III.2.
- Matplotlib: A 2D Graphics Environment. Computing in Science and Engineering 9 (3), pp. 90–95. External Links: Document Cited by: Einstein Probe discovery of EP J171159.4333253: an eclipsing neutron star low-mass X-ray binary with clocked bursts.
- Spectral and timing properties of the accreting millisecond X-ray pulsar IGR J17498‑2921 during its 2023 outburst. A&A 691, pp. A189. External Links: Document, 2408.06895 Cited by: §IV.4.
- Empirical color transformations between SDSS photometry and other photometric systems. A&A 460 (1), pp. 339–347. External Links: Document, astro-ph/0609121 Cited by: footnote 4.
- Neutron Stars in Interacting Binary Systems. ARA&A 22, pp. 537–592. External Links: Document Cited by: §IV.1.
- Optimal binning of X-ray spectra and response matrix design. A&A 587, pp. A151. External Links: Document, 1601.05309 Cited by: §III.4.1.
- X-ray dips and a complex UV/X-ray cross-correlation function in the black hole candidate MAXI J1820+070. MNRAS 488 (1), pp. L18–L23. External Links: Document, 1906.06519 Cited by: §IV.3.
- The faintest accretors. MNRAS 366 (1), pp. L31–L34. External Links: Document, astro-ph/0511486 Cited by: §IV.2.
- EP J171159.4-333253/EP250623a: Optical upper limits with Kinder and RIFT observations. The Astronomer’s Telegram 17280, pp. 1. Cited by: §I.
- Connecting the m-dots: accretion rates and thermonuclear burst recurrence times on neutron stars and white dwarfs. MNRAS 540 (3), pp. 2305–2320. External Links: Document, 2505.22302 Cited by: §IV.5.
- Turmoil on the accretion disk of GRO J1655-40. A&A 358, pp. 993–1000. External Links: Document, astro-ph/0004275 Cited by: §IV.3.
- MAXI J1659-152: the shortest orbital period black-hole transient in outburst. A&A 552, pp. A32. External Links: Document, 1204.5840 Cited by: §IV.3.
- X-ray spectropolarimetric characterisation of the Z source GX 340+0 in the normal branch. A&A 702, pp. A101. External Links: Document, 2508.13278 Cited by: §III.4.1.
- X-Ray Bursts. Space Sci. Rev. 62 (3-4), pp. 223–389. External Links: Document Cited by: §III.4.2.
- X-ray binaries. Cited by: §I.
- Evaluating Spectral Models and the X-Ray States of Neutron Star X-Ray Transients. ApJ 667 (2), pp. 1073–1086. External Links: Document, astro-ph/0702089 Cited by: §III.4.1.
- Reflecting on accretion in neutron star low-mass X-ray binaries. Ap&SS 369 (1), pp. 16. External Links: Document, 2401.15787 Cited by: §III.4.1, §III.4.1, §IV.4.
- PINT: A Modern Software Package for Pulsar Timing. ApJ 911 (1), pp. 45. External Links: Document, 2012.00074 Cited by: Appendix A, Einstein Probe discovery of EP J171159.4333253: an eclipsing neutron star low-mass X-ray binary with clocked bursts.
- Disk reflection and energetics from the accreting millisecond pulsar SRGA J144459.2‑604207. A&A 699, pp. A288. External Links: Document, 2502.08239 Cited by: §III.4.1.
- Outflows and spectral evolution in the eclipsing AMXP SWIFT J1749.4-2807 with NICER, XMM-Newton, and NuSTAR. MNRAS 515 (3), pp. 3838–3852. External Links: Document, 2207.08637 Cited by: §III.4.1, §IV.4.
- Aql X-1 from dawn ’til dusk: the early rise, fast state transition and decay of its 2024 outburst. arXiv e-prints, pp. arXiv:2511.16437. External Links: Document, 2511.16437 Cited by: §III.4.1.
- Einstein Probe and NuSTAR follow-up observations of the new NS LMXB EP J171159.4-333253: clocked type-I X-ray bursts and strong reflection features. The Astronomer’s Telegram 17271, pp. 1. Cited by: §I.
- New insights on the puzzling LMXB 1RXS J180408.9-342058: the intermediate state, the clocked type-I X-ray bursts, and much more. MNRAS 490 (2), pp. 2300–2314. External Links: Document, 1909.10359 Cited by: §I.
- The accretion/ejection link in the neutron star X-ray binary 4U 1820-30 I: a boundary layer-jet coupling?. MNRAS 525 (2), pp. 2366–2379. External Links: Document, 2307.16566 Cited by: §III.4.1.
- The evolutionary status of Cataclysmic Variables: eclipse modelling of 15 systems. MNRAS 486 (4), pp. 5535–5551. External Links: Document, 1904.01888 Cited by: §IV.1.
- Discovery of SRGA J144459.2‑604207 with the SRG/ART-XC telescope: A well-tempered bursting accreting millisecond X-ray pulsar. A&A 690, pp. A353. External Links: Document, 2404.19709 Cited by: §I.
- On the disc reflection spectroscopy of NS LMXB Serpens X-1: analysis of a recent NuSTAR observation. MNRAS 494 (3), pp. 3177–3185. External Links: Document, 1907.08625 Cited by: §III.4.1.
- The Optical Light Curve of the Low-Mass X-Ray Binary XB 1254-690. ApJ 313, pp. 792. External Links: Document Cited by: §IV.3.
- X-ray bursts and burst oscillations from the slowly spinning X-ray pulsar IGR J17480-2446 (Terzan 5). MNRAS 414 (2), pp. 1508–1516. External Links: Document, 1102.1368 Cited by: §I.
- A Remarkable Low-Mass X-Ray Binary within 0.1 Parsecs of the Galactic Center. ApJ 633 (1), pp. 228–239. External Links: Document, astro-ph/0503572 Cited by: §IV.2.
- Black hole-like hysteresis and accretion states in neutron star low-mass X-ray binaries. MNRAS 443 (4), pp. 3270–3283. External Links: Document, 1407.1318 Cited by: §IV.2.
- HEAsoft: Unified Release of FTOOLS and XANADU Note: Astrophysics Source Code Library, record ascl:1408.004 Cited by: Einstein Probe discovery of EP J171159.4333253: an eclipsing neutron star low-mass X-ray binary with clocked bursts.
- NICER Discovery that SRGA J144459.2–604207 Is an Accreting Millisecond X-Ray Pulsar. ApJ 968 (1), pp. L7. External Links: Document, 2405.00087 Cited by: §I.
- Einstein Probe detection of an X-ray Transient EP250623a (EP J171203.4-333221.5). The Astronomer’s Telegram 17247, pp. 1. Cited by: §I.
- SkyMapper Southern Survey: Data release 4. PASA 41, pp. e061. External Links: Document, 2402.02015 Cited by: §II.3.
- The omnipresent flux-dependent optical dips of the black hole transient Swift J1357.2‒0933. A&A 682, pp. A19. External Links: Document, 2311.03460 Cited by: §IV.3.
- Discovery of polarized X-ray emission from the accreting millisecond pulsar SRGA J144459.2–604207. A&A 694, pp. A37. External Links: Document, 2408.00608 Cited by: §I.
- Intrinsic Colors, Temperatures, and Bolometric Corrections of Pre-main-sequence Stars. ApJS 208 (1), pp. 9. External Links: Document, 1307.2657 Cited by: footnote 2.
- A faint outburst of the accreting millisecond X-ray pulsar SAX J1748.9-2021 in NGC 6440. MNRAS 479 (3), pp. 4084–4090. External Links: Document, 1806.10944 Cited by: §IV.4.
- Planck intermediate results. XLVIII. Disentangling Galactic dust emission and cosmic infrared background anisotropies. A&A 596, pp. A109. External Links: Document, 1605.09387 Cited by: §IV.2.
- Fourier Techniques for Very Long Astrophysical Time-Series Analysis. AJ 124 (3), pp. 1788–1809. External Links: Document, astro-ph/0204349 Cited by: §III.3.
- New search techniques for binary pulsars. Ph.D. Thesis, Harvard University, Massachusetts. Cited by: §III.3.
- PRESTO: PulsaR Exploration and Search TOolkit Note: Astrophysics Source Code Library, record ascl:1107.017 External Links: 1107.017 Cited by: §III.3.
- Thermonuclear X-ray bursts across the eclipse transitions in the LMXBs EXO 0748676 and XTE J1710281. MNRAS 544 (1), pp. 13–23. External Links: Document, 2509.13299 Cited by: §IV.1.
- Studies in Astronomical Time Series Analysis. VI. Bayesian Block Representations. ApJ 764 (2), pp. 167. External Links: Document, 1207.5578 Cited by: §III.2.
- The secondary stars in cataclysmic variables and low-mass X-ray binaries. MNRAS 301 (3), pp. 767–781. External Links: Document, astro-ph/9808217 Cited by: §IV.1.
- PINT: Maximum-likelihood Estimation of Pulsar Timing Noise Parameters. ApJ 971 (2), pp. 150. External Links: Document, 2405.01977 Cited by: Appendix A.
- Optical and X-Ray Observations of the Low-Mass X-Ray Binary EXO 0748-676. ApJ 408, pp. 651. External Links: Document Cited by: §IV.3.
- Bursts from GS 1826-238: A Clocked Thermonuclear Flashes Generator. ApJ 514 (1), pp. L27–L30. External Links: Document, astro-ph/9901413 Cited by: §I, §IV.5, §IV.5.
- Atomic Data for Astrophysics. II. New Analytic FITS for Photoionization Cross Sections of Atoms and Ions. ApJ 465, pp. 487. External Links: Document, astro-ph/9601009 Cited by: §III.4.1.
- Burst-recurrence properties revealed with Insight-HXMT and NICER for the newly discovered accreting millisecond pulsar MAXI J1816–195. A&A 689, pp. A47. External Links: Document Cited by: §I.
- On the Absorption of X-Rays in the Interstellar Medium. ApJ 542 (2), pp. 914–924. External Links: Document, astro-ph/0008425 Cited by: §III.4.1.
- Evidence for Accretion Rate Change during Type I X-Ray Bursts. ApJ 772 (2), pp. 94. External Links: Document, 1303.4824 Cited by: §III.4.2.
- EP-FXT and Swift/XRT observations of EP250623a/EP J171159.4-333253: likely a new neutron star X-ray binary with type I bursts. The Astronomer’s Telegram 17255, pp. 1. Cited by: §I.
- Properties of flare events based on light curves from the TESS survey. A&A 669, pp. A15. External Links: Document Cited by: §IV.1.
- A New Electron-density Model for Estimation of Pulsar and FRB Distances. ApJ 835 (1), pp. 29. External Links: Document, 1610.09448 Cited by: §IV.2.
- Science objectives of the Einstein Probe mission. Science China Physics, Mechanics, and Astronomy 68 (3), pp. 239501. External Links: Document, 2501.07362 Cited by: §I.
- The Einstein Probe Mission. In Handbook of X-ray and Gamma-ray Astrophysics, pp. 86. External Links: Document Cited by: §I, §II.1.1.
- Spectral and temporal properties of Compton scattering by mildly relativistic thermal electrons. MNRAS 492 (4), pp. 5234–5246. External Links: Document, 1910.04535 Cited by: §III.4.1.
- Data reduction and processing for the Follow-up X-ray Telescope onboard Einstein Probe. Radiation Detection Technology and Methods 9 (2), pp. 215–222. External Links: Document Cited by: Einstein Probe discovery of EP J171159.4333253: an eclipsing neutron star low-mass X-ray binary with clocked bursts.